Embed Size (px)
Citation preview
EFFECTS OF COLLECTIVE ACTION WATER POLICY ON KANSAS FARMERS’
IRRIGATION DECISIONS
Krystal M. Drysdale, Kansas State University,
Nathan P. Hendricks, Kansas State University,
This work is supported in part
by the National Science
Foundation, the State of Kansas
Board of Regents, and the
Arthur Capper Cooperative
Center.
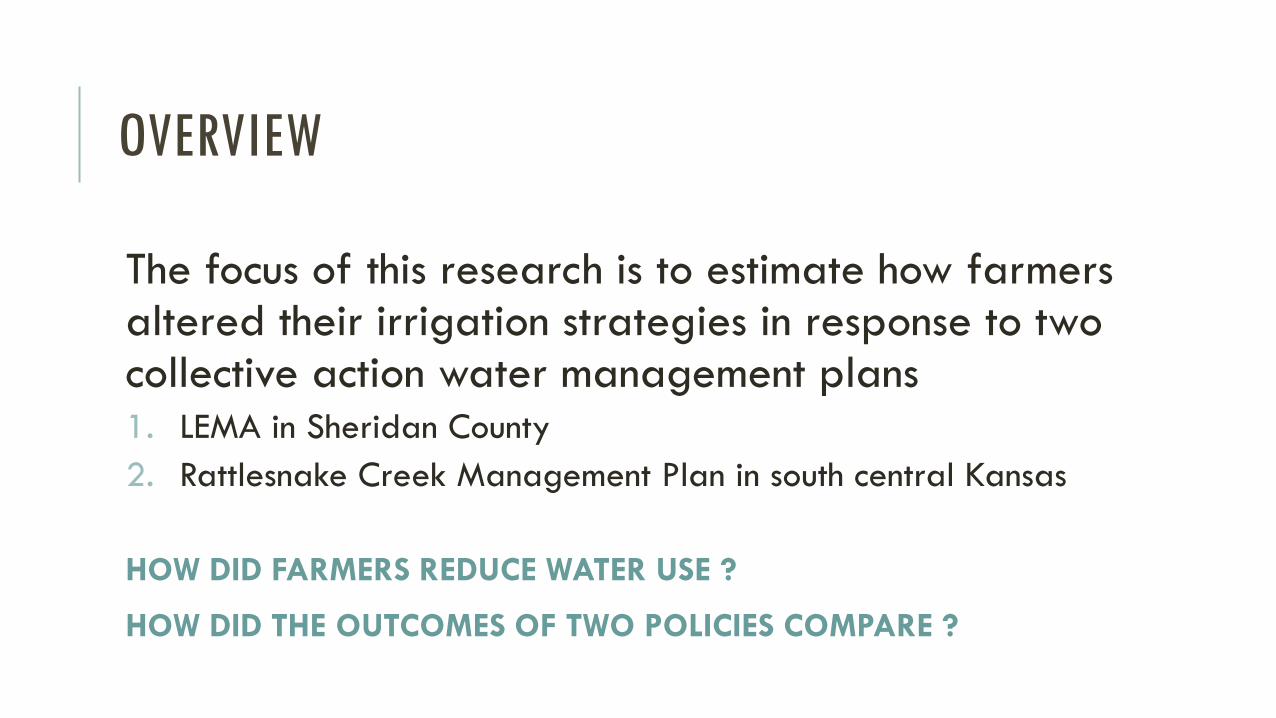
OVERVIEW
The focus of this research is to estimate how farmers altered their irrigation strategies in response to two collective action water management plans 1. LEMA in Sheridan County
2. Rattlesnake Creek Management Plan in south central Kansas
HOW DID FARMERS REDUCE WATER USE ?
HOW DID THE OUTCOMES OF TWO POLICIES COMPARE ?
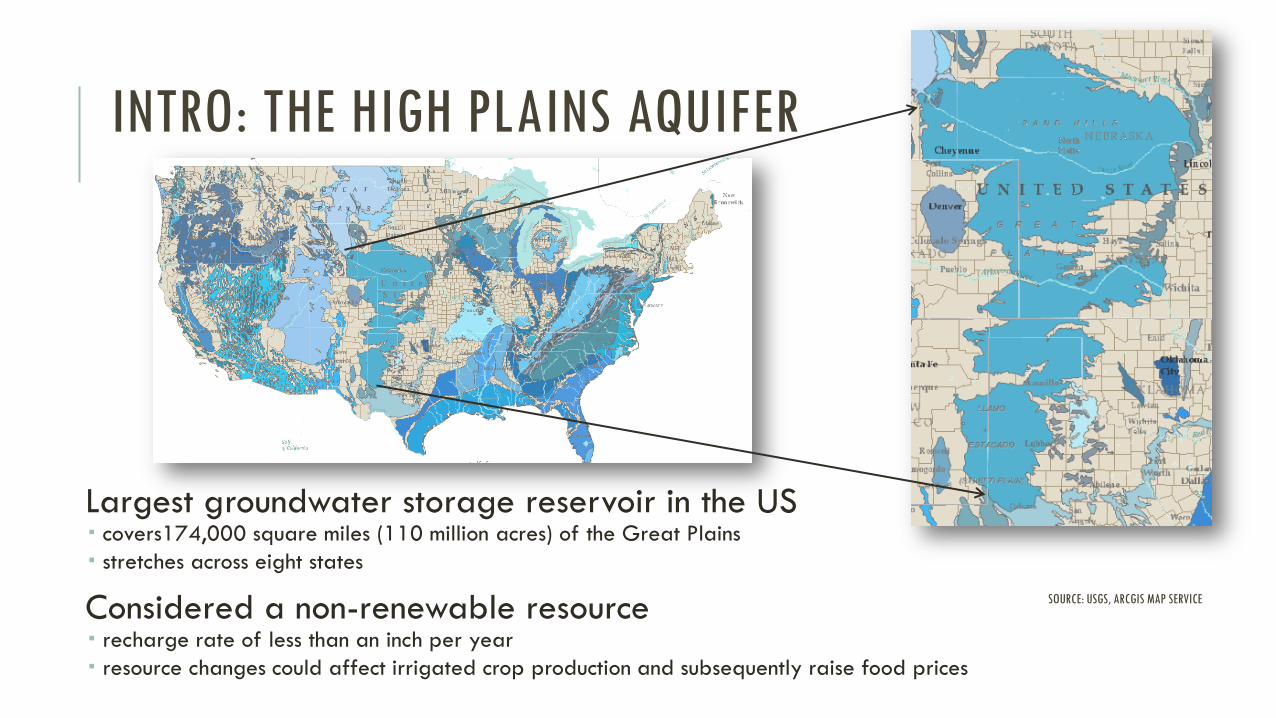
INTRO: THE HIGH PLAINS AQUIFER
SOURCE: USGS, ARCGIS MAP SERVICE
Largest groundwater storage reservoir in the US covers174,000 square miles (110 million acres) of the Great Plains
stretches across eight states
Considered a non-renewable resource recharge rate of less than an inch per year
resource changes could affect irrigated crop production and subsequently raise food prices
BACKGROUND: SHERIDAN 6 LEMA
In 2012, new legislation granted localized water conservation management plans which are legally enforced by the state. Formed a 5 year Local Enhanced Management Area (LEMA) plan in 2013 in Sheridan County
Specific goals of the LEMA as described by the order of the Chief Engineer
Reduce groundwater pumping by approximately 20%
Restricting irrigators to a five-year allocation of 55 inches each
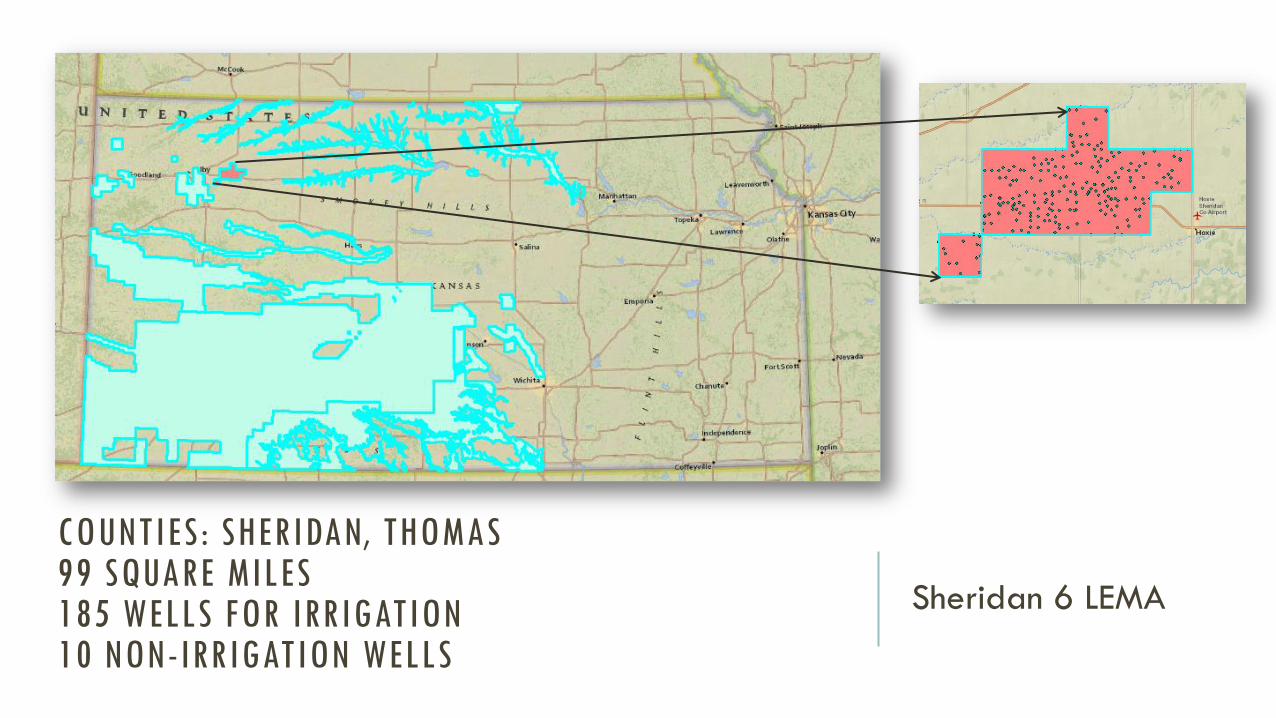
COUNTIES: SHERIDAN, THOMAS 99 SQUARE MILES 185 WELLS FOR IRRIGATION 10 NON-IRRIGATION WELLS
Sheridan 6 LEMA
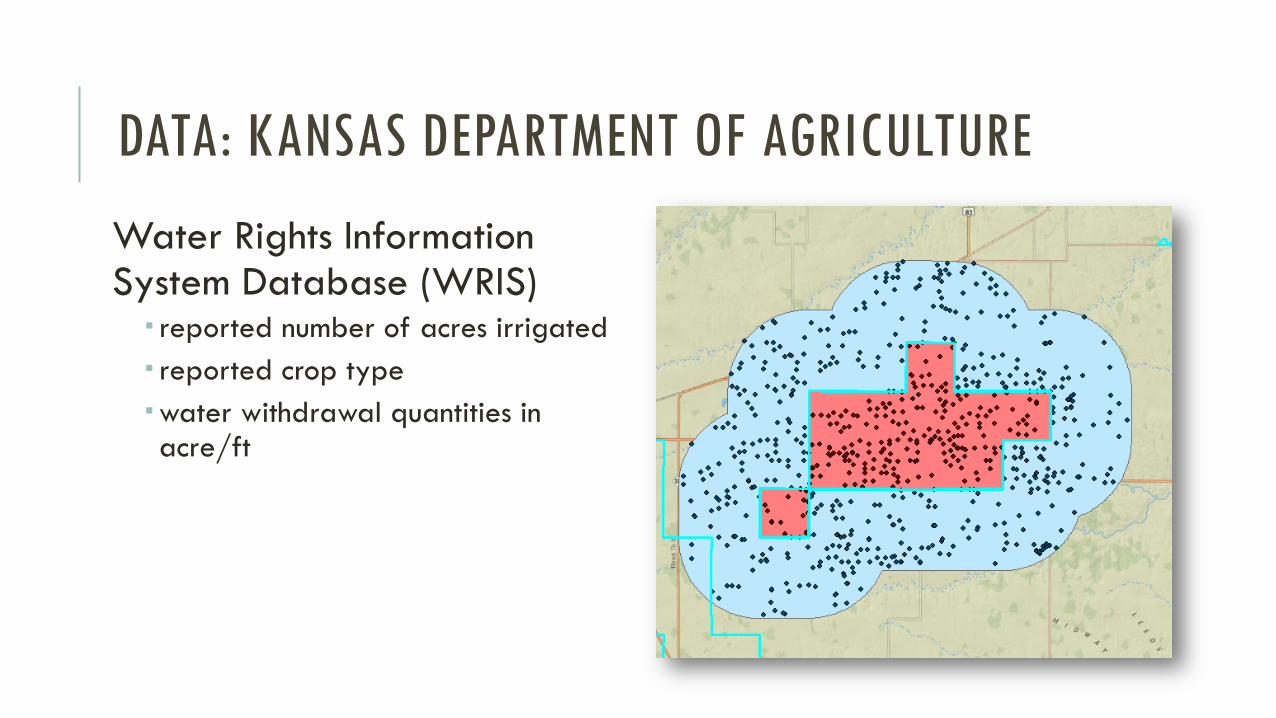
DATA: KANSAS DEPARTMENT OF AGRICULTURE
Water Rights Information System Database (WRIS)
reported number of acres irrigated
reported crop type
water withdrawal quantities in acre/ft
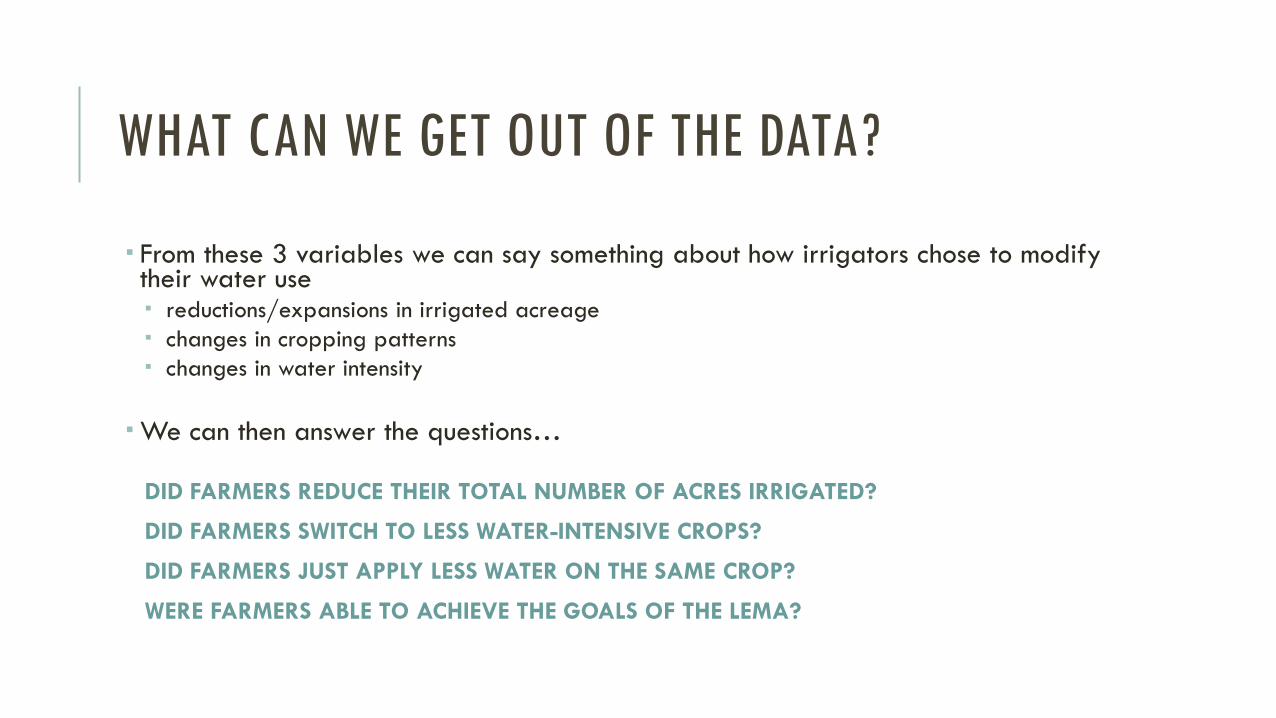
WHAT CAN WE GET OUT OF THE DATA?
From these 3 variables we can say something about how irrigators chose to modify their water use reductions/expansions in irrigated acreage
changes in cropping patterns
changes in water intensity
We can then answer the questions…
DID FARMERS REDUCE THEIR TOTAL NUMBER OF ACRES IRRIGATED?
DID FARMERS SWITCH TO LESS WATER-INTENSIVE CROPS?
DID FARMERS JUST APPLY LESS WATER ON THE SAME CROP?
WERE FARMERS ABLE TO ACHIEVE THE GOALS OF THE LEMA?
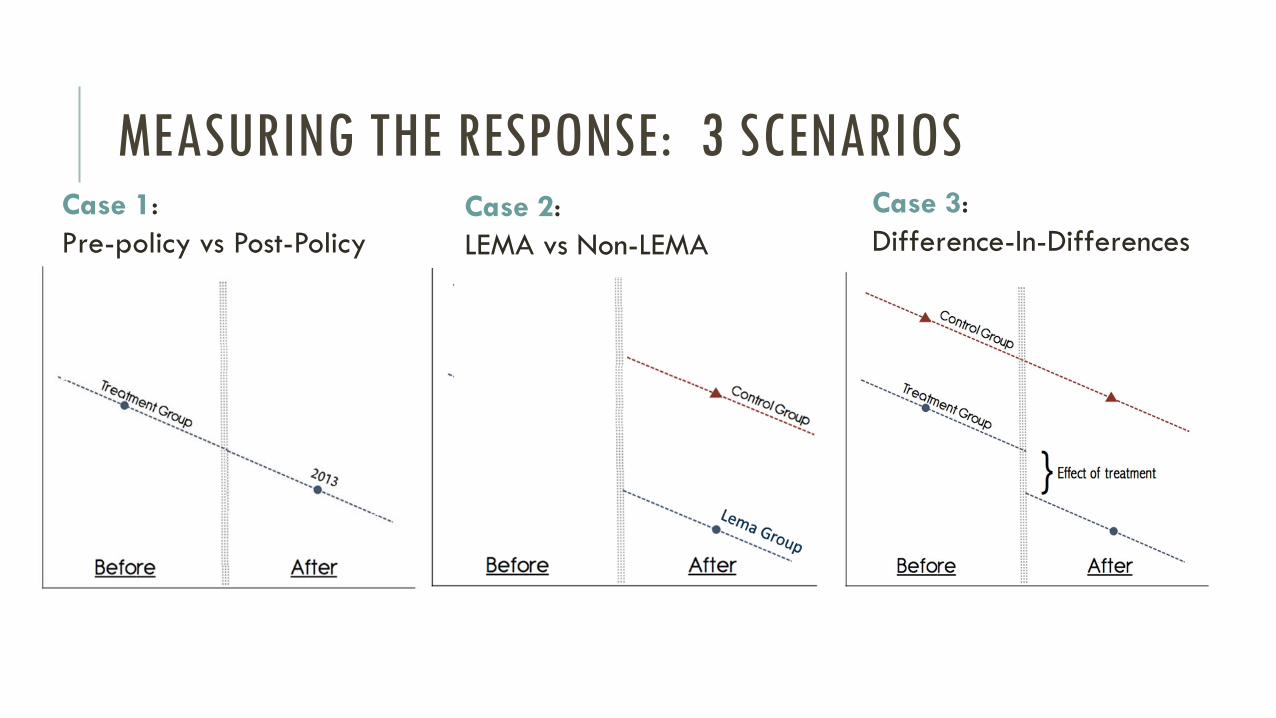
MEASURING THE RESPONSE: 3 SCENARIOS Case 1:
Pre-policy vs Post-Policy
Case 2:
LEMA vs Non-LEMA
Case 3:
Difference-In-Differences
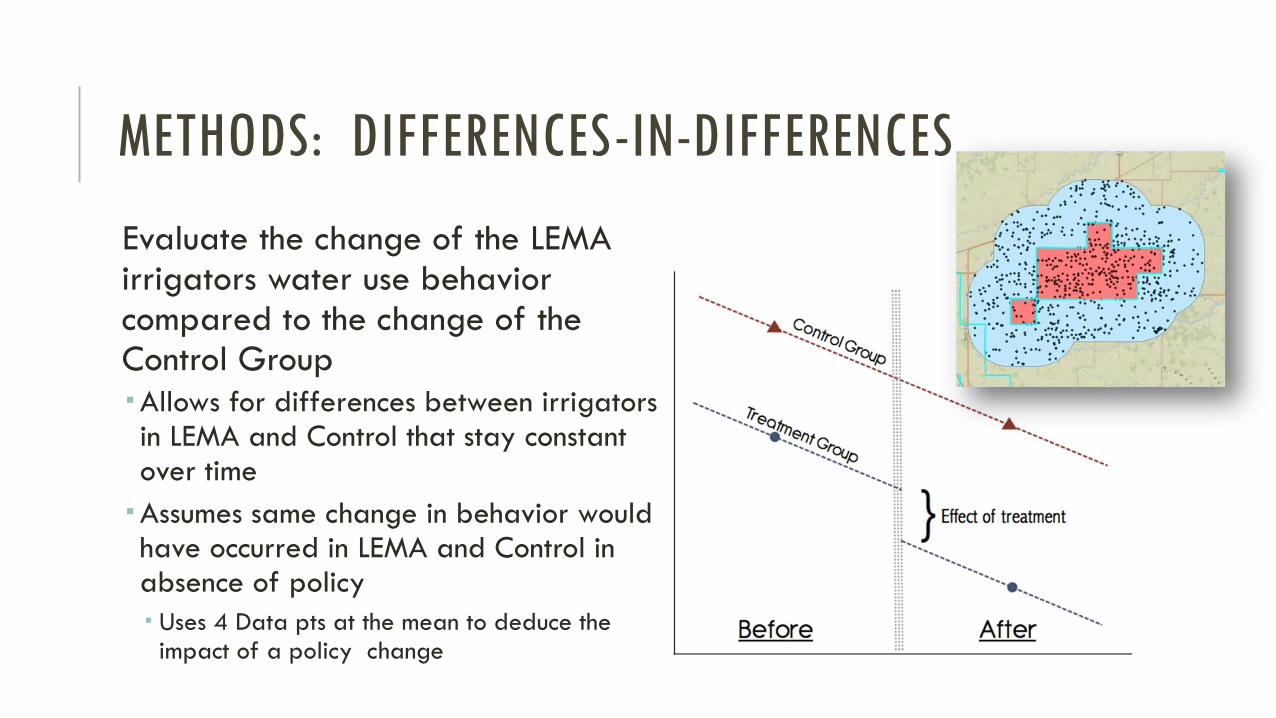
METHODS: DIFFERENCES-IN-DIFFERENCES
Evaluate the change of the LEMA irrigators water use behavior compared to the change of the Control Group
Allows for differences between irrigators in LEMA and Control that stay constant over time
Assumes same change in behavior would have occurred in LEMA and Control in absence of policy
Uses 4 Data pts at the mean to deduce the impact of a policy change
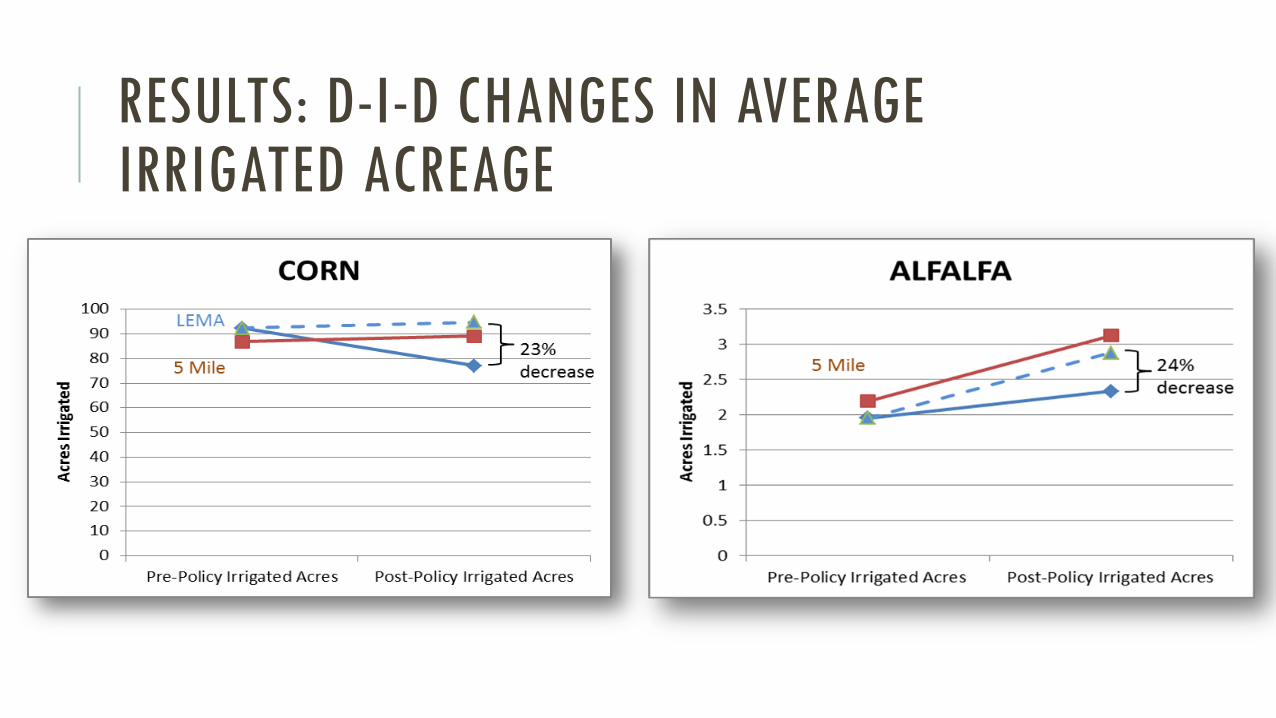
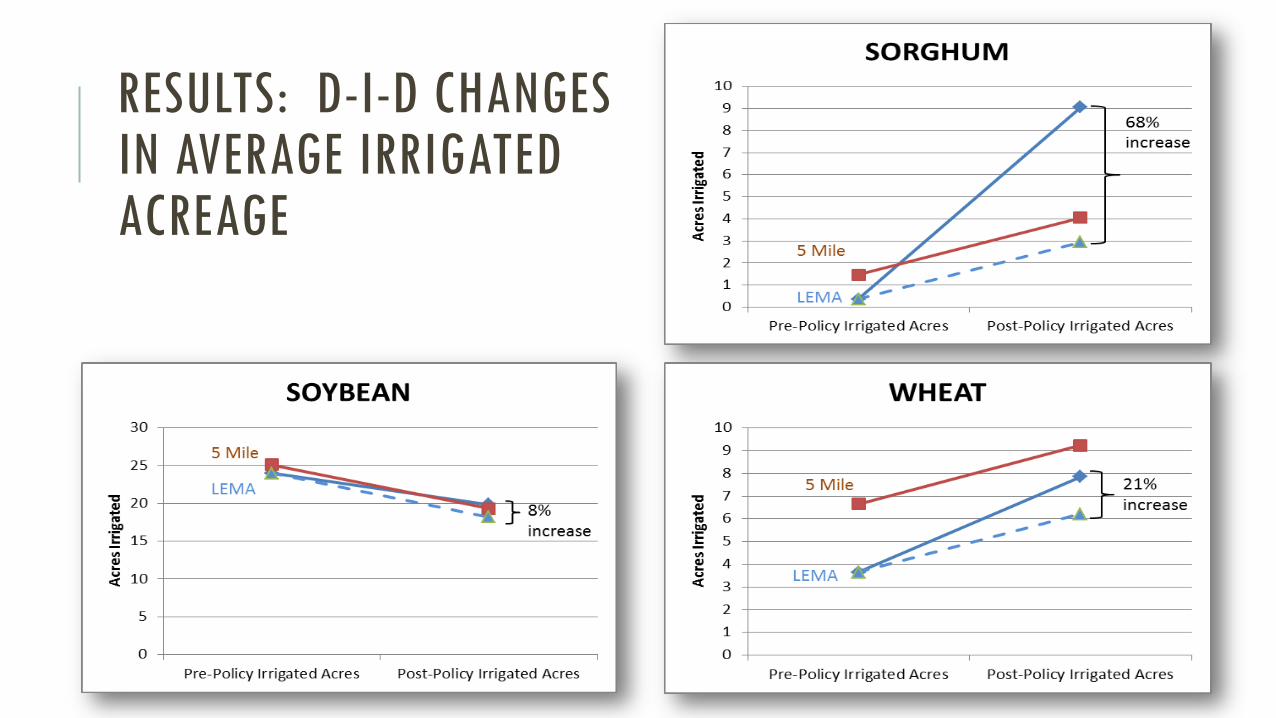
RESULTS: D-I-D CHANGES IN AVERAGE IRRIGATED ACREAGE
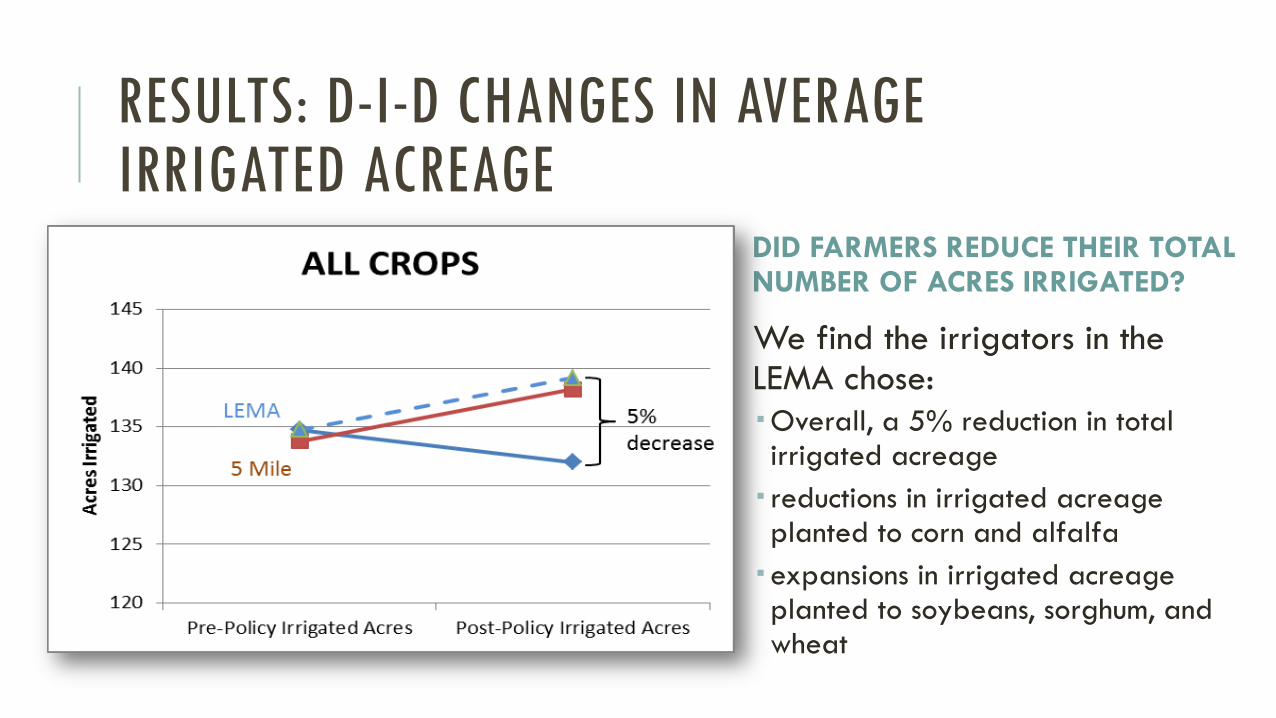
RESULTS: D-I-D CHANGES IN AVERAGE IRRIGATED ACREAGE
RESULTS: D-I-D CHANGES IN AVERAGE IRRIGATED ACREAGE
DID FARMERS REDUCE THEIR TOTAL NUMBER OF ACRES IRRIGATED?
We find the irrigators in the LEMA chose:
Overall, a 5% reduction in total irrigated acreage
reductions in irrigated acreage planted to corn and alfalfa
expansions in irrigated acreage planted to soybeans, sorghum, and wheat
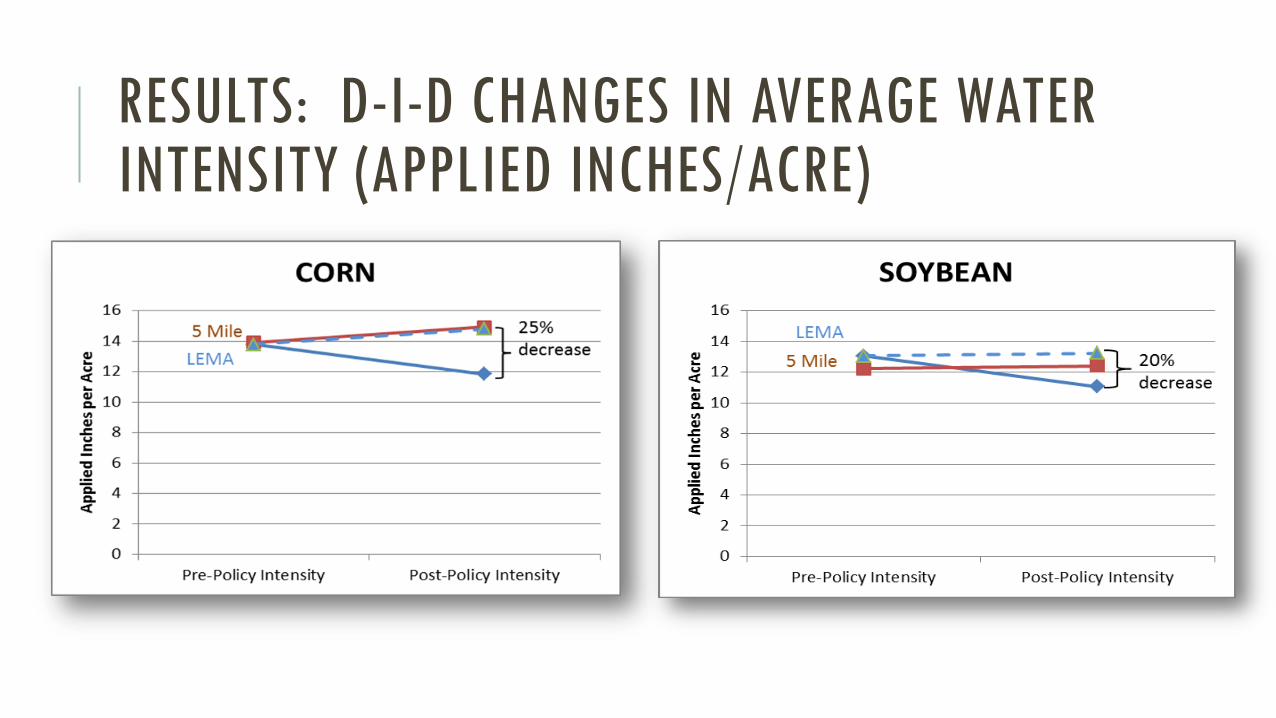
RESULTS: D-I-D CHANGES IN AVERAGE WATER INTENSITY (APPLIED INCHES/ACRE)
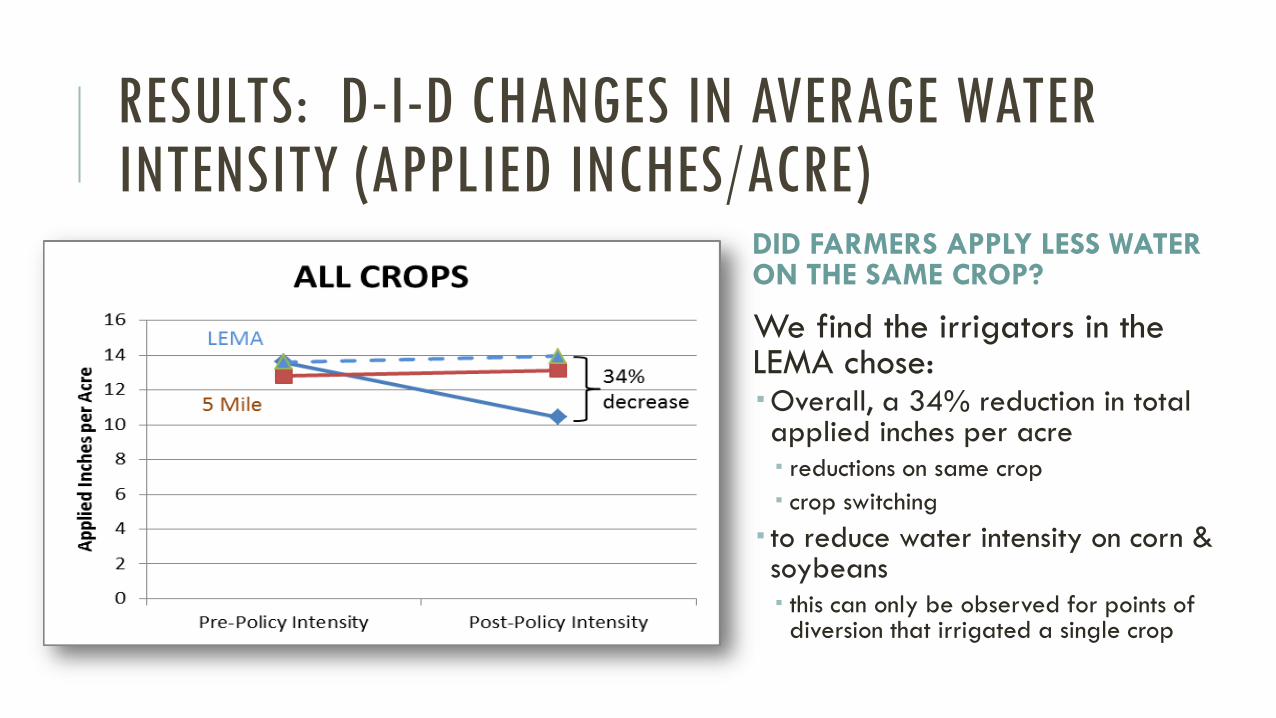
RESULTS: D-I-D CHANGES IN AVERAGE WATER INTENSITY (APPLIED INCHES/ACRE)
DID FARMERS APPLY LESS WATER ON THE SAME CROP?
We find the irrigators in the LEMA chose: Overall, a 34% reduction in total applied inches per acre reductions on same crop
crop switching
to reduce water intensity on corn & soybeans this can only be observed for points of diversion that irrigated a single crop
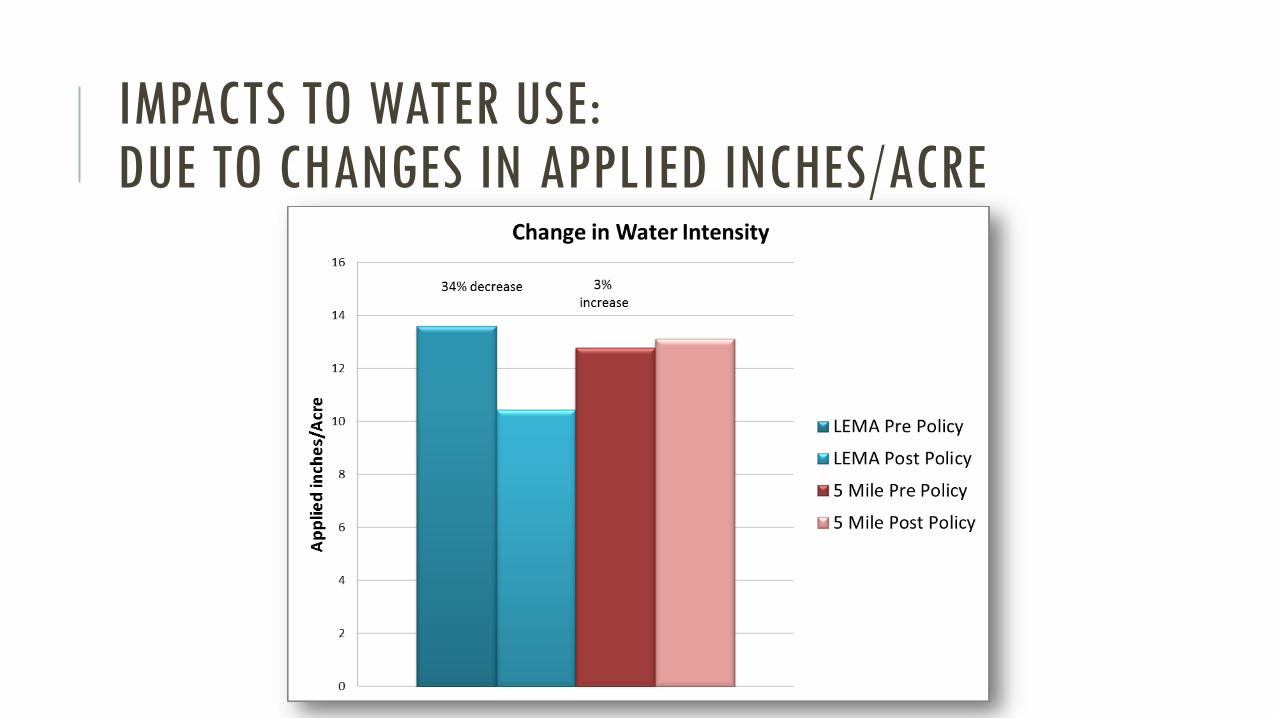
IMPACTS TO WATER USE: DUE TO CHANGES IN APPLIED INCHES/ACRE
CONSIDER A HYPOTHETICAL SCENARIO
What if we could make farmers have the same water use before and after the policy?
to isolate the effects from just changes in crop acreage reductions in irrigated acreage
crop switching
HOW MUCH OF THE CHANGE IN WATER USE WAS DUE TO CHANGES IN CROP ACREAGE?
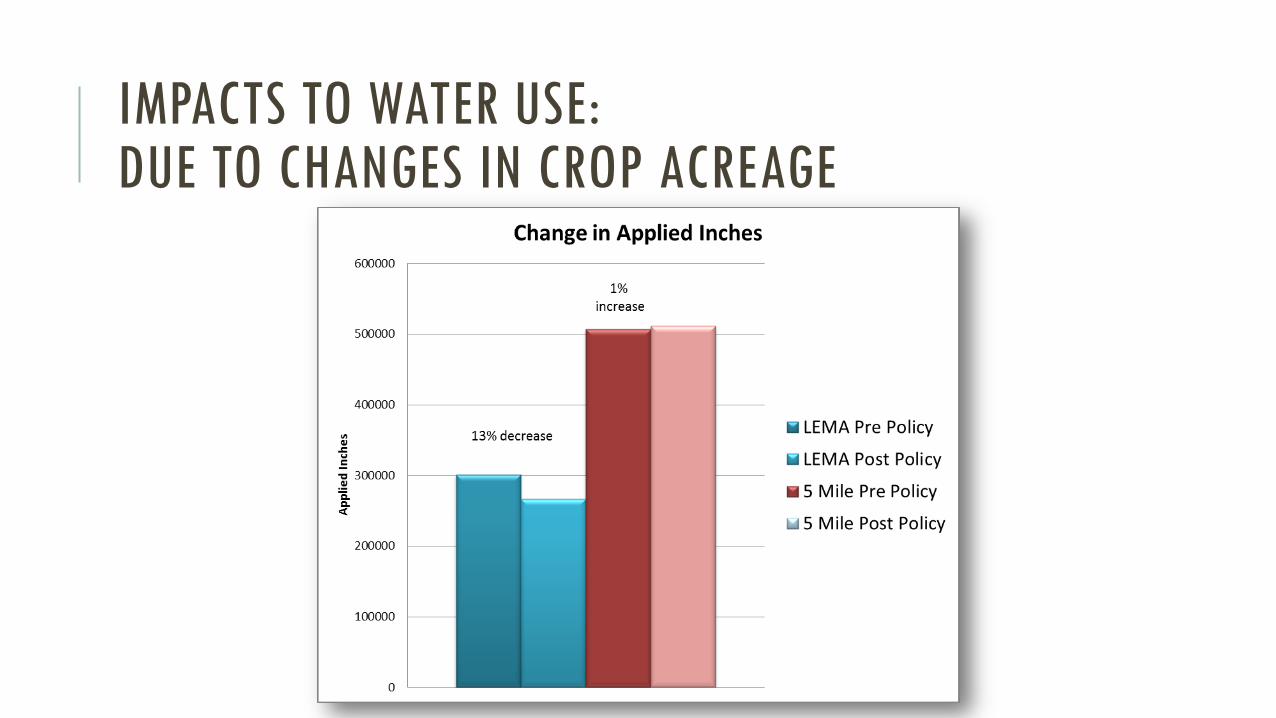
IMPACTS TO WATER USE: DUE TO CHANGES IN CROP ACREAGE
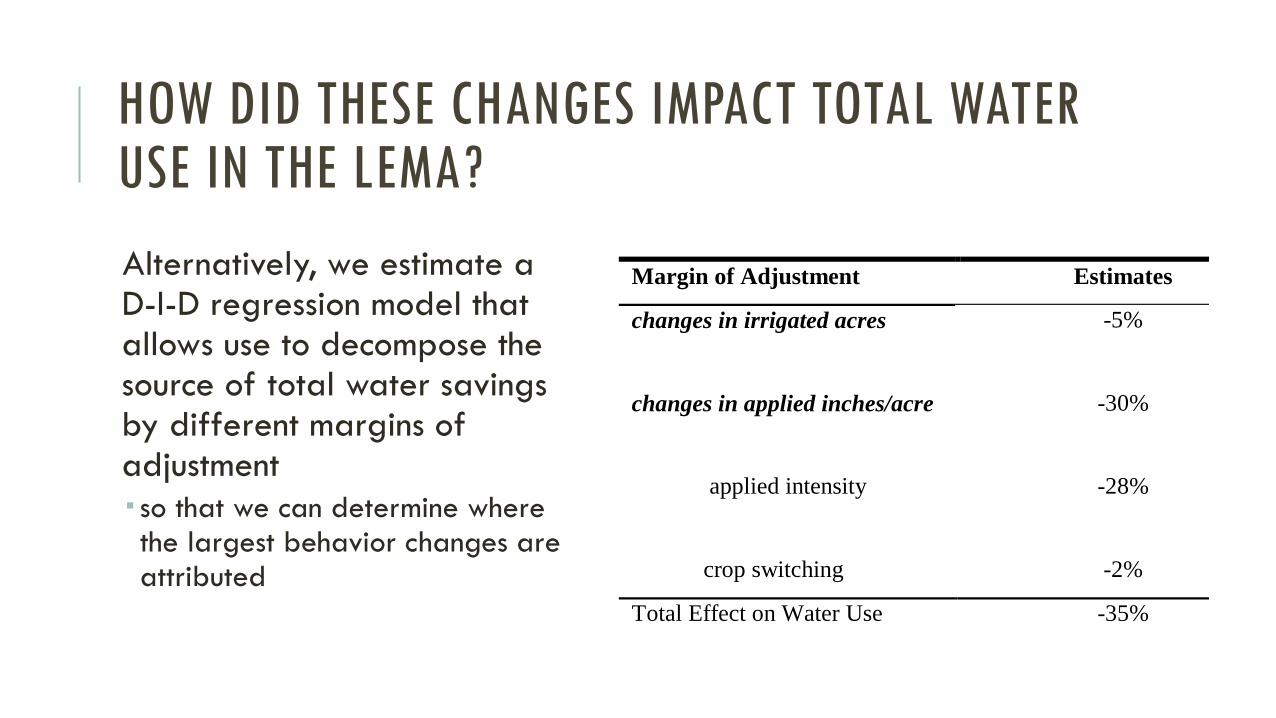
HOW DID THESE CHANGES IMPACT TOTAL WATER USE IN THE LEMA?
Alternatively, we estimate a D-I-D regression model that allows use to decompose the source of total water savings by different margins of adjustment
so that we can determine where the largest behavior changes are attributed
Margin of Adjustment Estimates
changes in irrigated acres -5%
changes in applied inches/acre -30%
applied intensity -28%
crop switching -2%
Total Effect on Water Use -35%
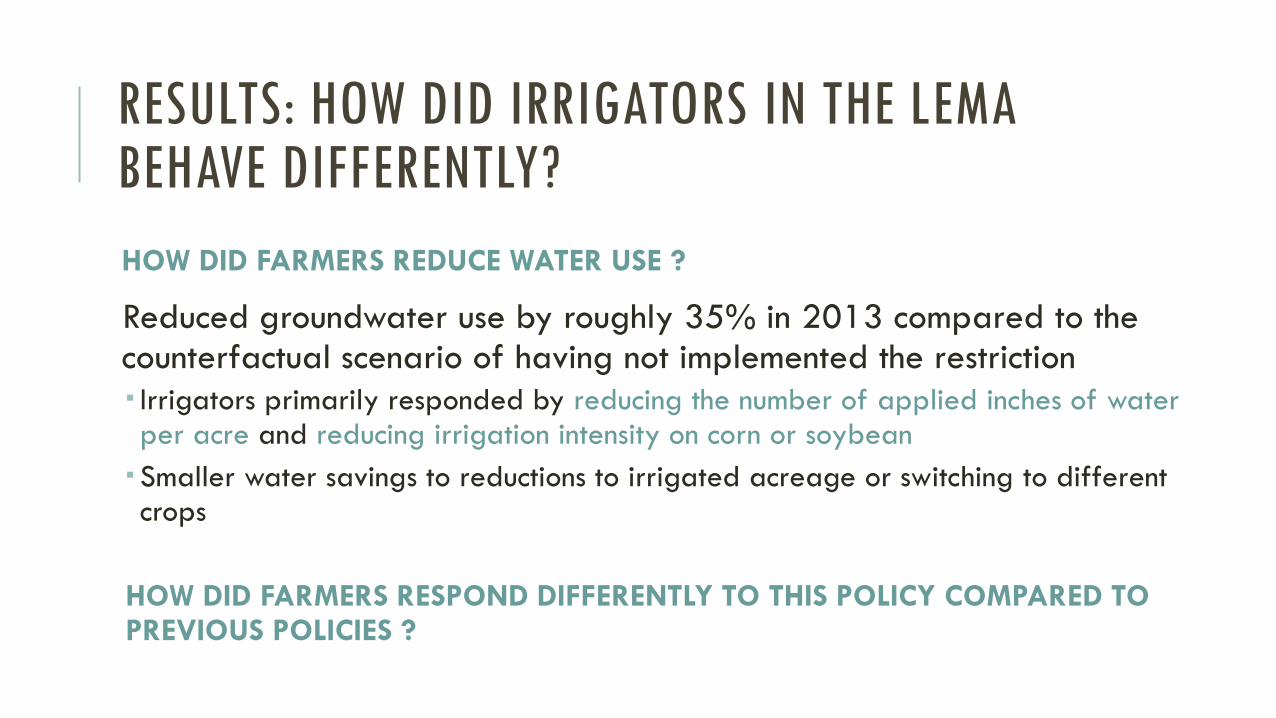
RESULTS: HOW DID IRRIGATORS IN THE LEMA BEHAVE DIFFERENTLY?
HOW DID FARMERS REDUCE WATER USE ?
Reduced groundwater use by roughly 35% in 2013 compared to the counterfactual scenario of having not implemented the restriction
Irrigators primarily responded by reducing the number of applied inches of water per acre and reducing irrigation intensity on corn or soybean
Smaller water savings to reductions to irrigated acreage or switching to different crops
HOW DID FARMERS RESPOND DIFFERENTLY TO THIS POLICY COMPARED TO PREVIOUS POLICIES ?
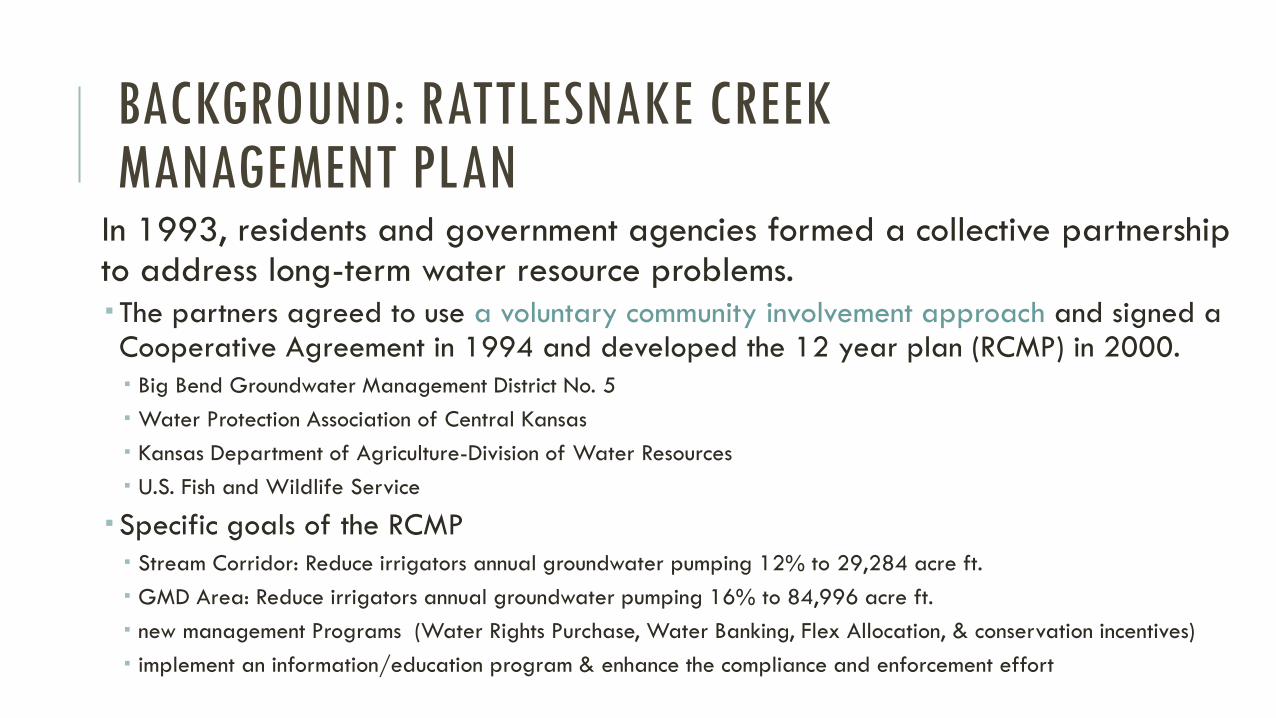
BACKGROUND: RATTLESNAKE CREEK MANAGEMENT PLAN
In 1993, residents and government agencies formed a collective partnership to address long-term water resource problems.
The partners agreed to use a voluntary community involvement approach and signed a Cooperative Agreement in 1994 and developed the 12 year plan (RCMP) in 2000.
Big Bend Groundwater Management District No. 5
Water Protection Association of Central Kansas
Kansas Department of Agriculture-Division of Water Resources
U.S. Fish and Wildlife Service
Specific goals of the RCMP
Stream Corridor: Reduce irrigators annual groundwater pumping 12% to 29,284 acre ft.
GMD Area: Reduce irrigators annual groundwater pumping 16% to 84,996 acre ft.
new management Programs (Water Rights Purchase, Water Banking, Flex Allocation, & conservation incentives)
implement an information/education program & enhance the compliance and enforcement effort
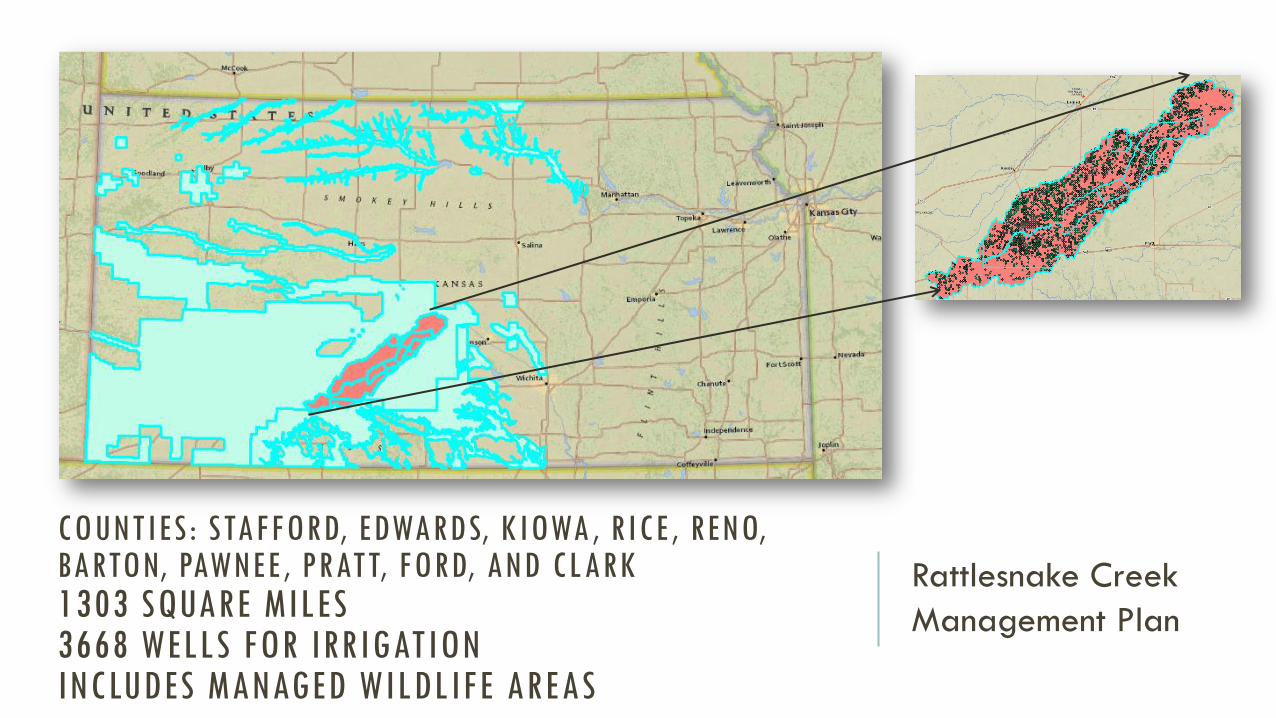
COUNTIES: STAFFORD, EDWARDS, KIOWA, RICE, RENO, BARTON, PAWNEE, PRATT, FORD, AND CLARK 1303 SQUARE MILES 3668 WELLS FOR IRRIGATION INCLUDES MANAGED WILDLIFE AREAS
Rattlesnake Creek
Management Plan
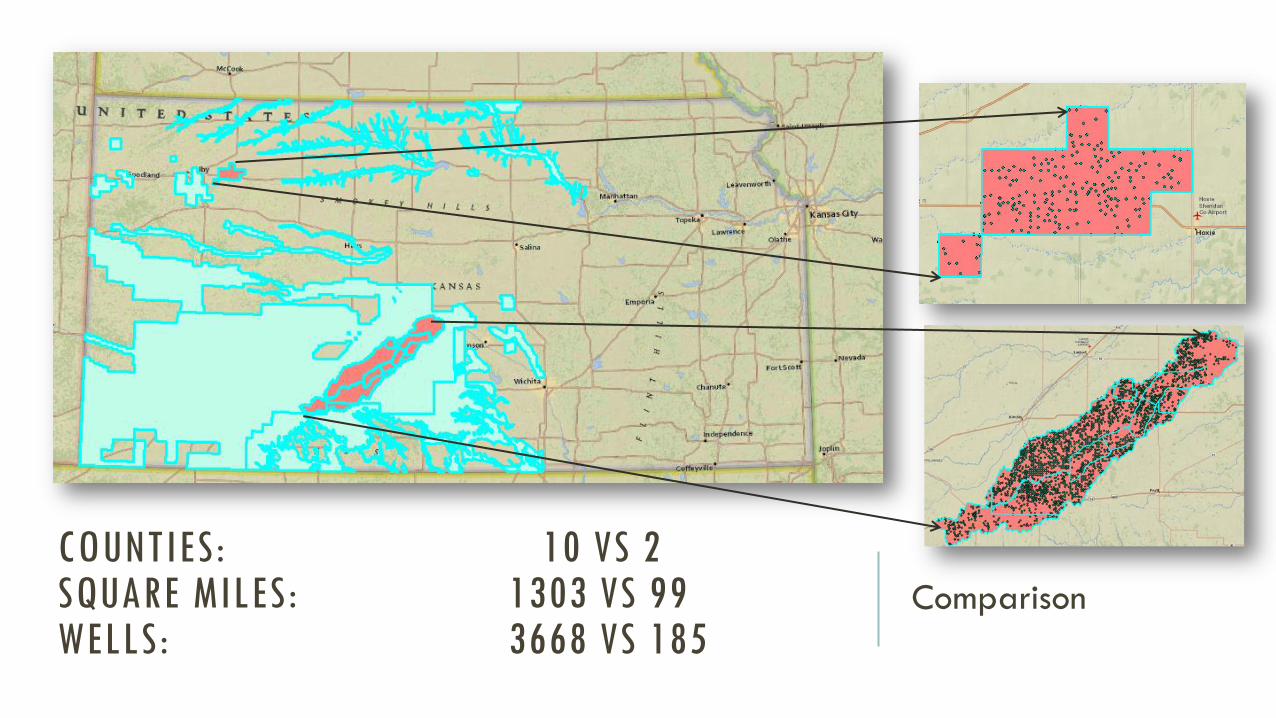
COUNTIES: 10 VS 2 SQUARE MILES: 1303 VS 99 WELLS: 3668 VS 185
Comparison
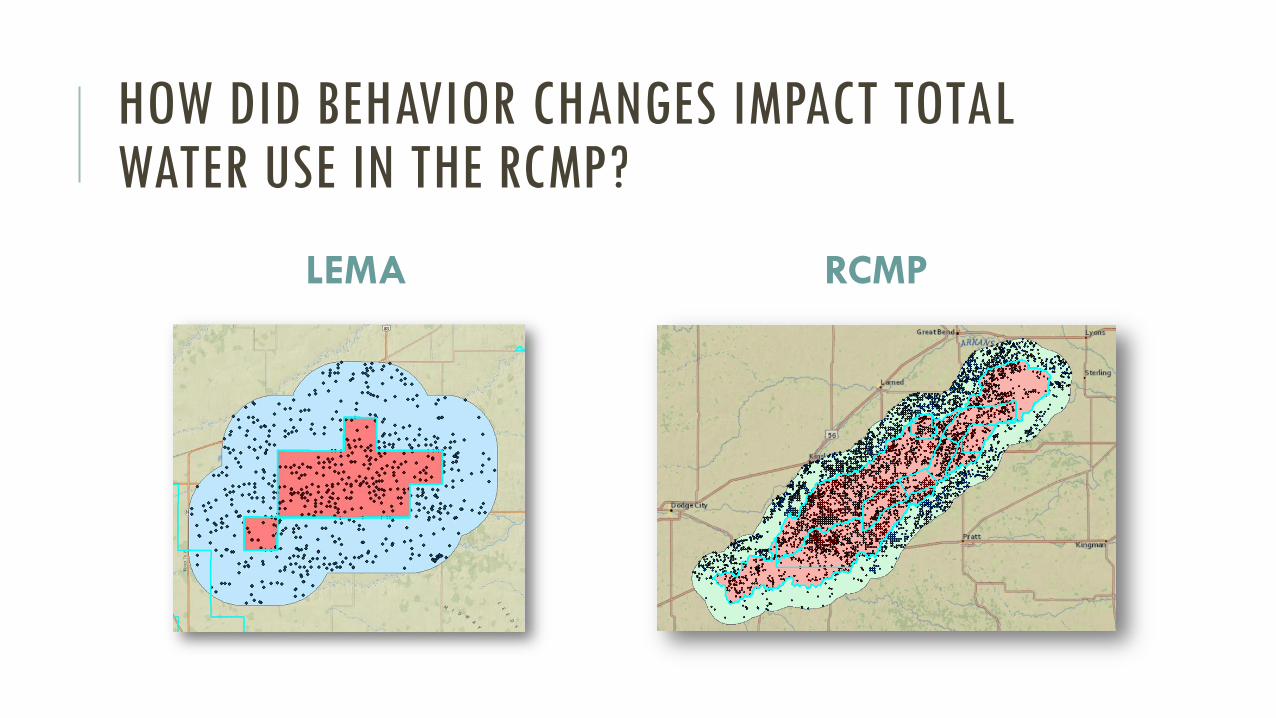
LEMA RCMP
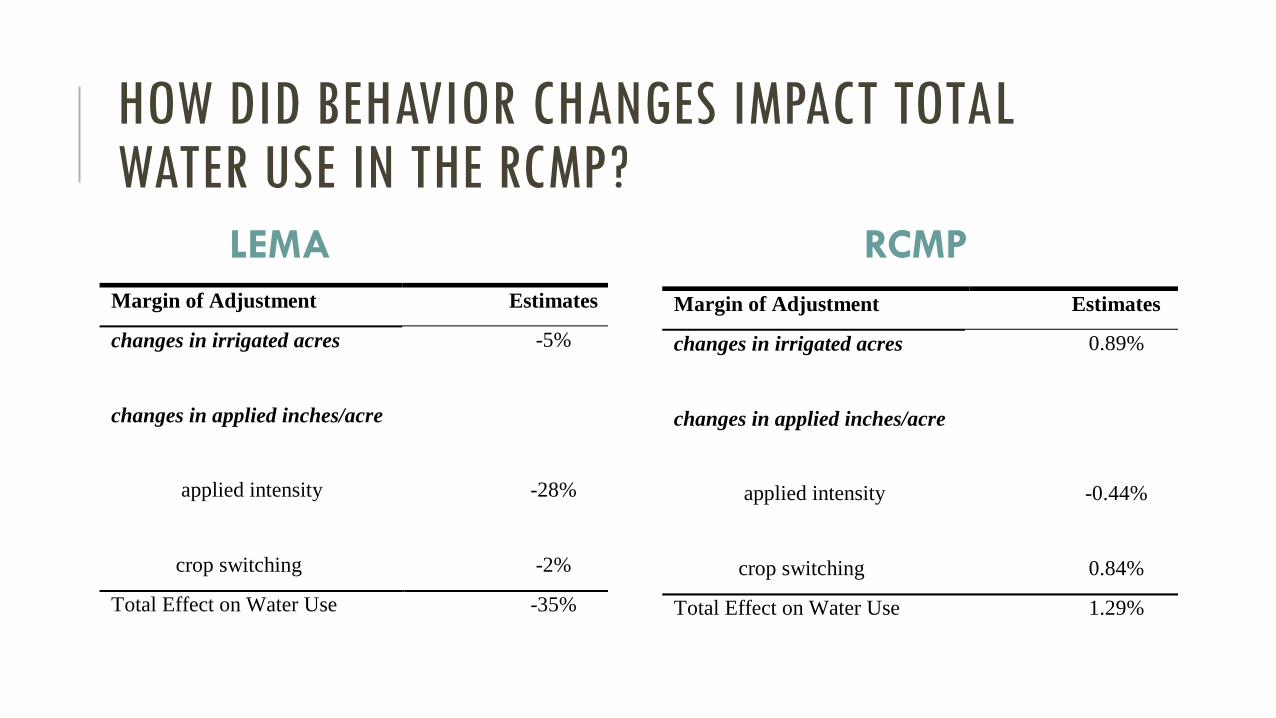
HOW DID BEHAVIOR CHANGES IMPACT TOTAL WATER USE IN THE RCMP?
HOW DID BEHAVIOR CHANGES IMPACT TOTAL WATER USE IN THE RCMP?
LEMA RCMP
Margin of Adjustment Estimates
changes in irrigated acres -5%
changes in applied inches/acre
applied intensity -28%
crop switching -2%
Total Effect on Water Use -35%
Margin of Adjustment Estimates
changes in irrigated acres 0.89%
changes in applied inches/acre
applied intensity -0.44%
crop switching 0.84%
Total Effect on Water Use 1.29%

THANK YOU FOR YOUR TIME
Questions ?
Krystal M. Drysdale, Kansas State University
Nathan P. Hendricks, Kansas State University