Embed Size (px)
Citation preview

California Agricultural Production and
Irrigated Water Use
Renée Johnson
Specialist in Agricultural Policy
Betsy A. Cody
Specialist in Natural Resources Policy
June 30, 2015
Congressional Research Service
7-5700
www.crs.gov
R44093

California Agricultural Production and Irrigated Water Use
Congressional Research Service
Summary
California ranks as the leading agricultural state in the United States in terms of farm-level sales. In 2012, California’s farm-level sales totaled nearly $45 billion and accounted for 11% of total U.S. agricultural sales. Five counties—Tulare, Kern, Fresno, Monterey, and Merced—rank among the leading agricultural counties in the nation.
Given current drought conditions in California, however, there has been much attention on the use of water to grow agricultural crops in the state. Depending on the data source, irrigated agriculture accounts for roughly 40% to 80% of total water supplies. Such discrepancies are largely based on different survey methods and assumptions, including the baseline amount of water estimated for use (e.g., what constitutes “available” supplies). Two primary data sources are the U.S. Geological Survey (USGS) and the California Department of Water Resources (DWR). USGS estimates water use for agricultural irrigation in California at 25.8 million acre-feet (MAF), accounting for 61% of USGS’s estimates of total withdrawals. DWR estimates water use withdrawals for agricultural irrigation at 33 MAF, or about 41% of total use. Both of these estimates are based on available data for 2010. These estimates differ from other widely cited estimates indicating that agricultural use accounts for 80% of California’s available water supplies, as reported in media and news reports.
Attention has also focused on trends in California toward growing more permanent orchard crops, such as fruit and nut trees and vineyard crops, as well as production of grain and pasture crops, much of which is used to support the state’s meat and dairy industries. Orchard crops refer to tree or vineyard crops that are planted once, require continuous watering to reach maturation, and cannot be fallowed during dry years without loss of investment. In contrast, most vegetables and other row crops (including grain and pasture crops) are annual crops that are sown and harvested during the same production year, sometimes more than once, and may be fallowed in dry years. Between 2004 and 2013, overall harvested acres in California increased for almonds, walnuts, pistachios, raisins, grapes, berries, cherries, pomegranates, and olives, but also for corn. During the same period, overall harvested acreage decreased for some field crops (cotton, alfalfa, rice, wheat), but also for certain orchard crops (wine grapes and some citrus and tree fruits). This shift to growing more permanent crops, especially tree nuts, appears to be largely market-driven.
The availability of irrigation water has been a major factor in the development of California’s agricultural production. California has the largest number of irrigated farmed acres compared to other states and accounts for about one-fourth of total applied acre-feet of irrigated water in the United States. Water use per acre in California is also high compared to other states. Available data for 2013 indicate that, of total irrigated acres harvested in California, about 31% of irrigated acres were land in orchards and 18% were land in vegetables. Another 46% of irrigated acres harvested were land in alfalfa, hay, pastureland, rice, corn, and cotton.
Congressional interest in California agriculture and water use centers largely on the Bureau of Reclamation’s Central Valley Project (CVP), which supplies water to numerous agricultural and municipal contractors. In recent years, the CVP has cut back water deliveries due to drought and environmental factors. Congress also authorizes and oversees U.S. Department of Agriculture support for individual crops and farmers, and some Members have expressed concern over the broader implications of decreased agricultural production and/or lack of water availability throughout the state.

California Agricultural Production and Irrigated Water Use
Congressional Research Service
Contents
Overview of California’s Farm Economy ........................................................................................ 2 Farm-Level Sales ....................................................................................................................... 4 Acreage Trends .......................................................................................................................... 6
Water Application in the Agricultural Sector ................................................................................. 11 Overall Water Supply and Use in California ........................................................................... 11 Regional and Nationwide Comparisons .................................................................................. 14 Irrigation Water Use for Selected California Crops ................................................................. 15
Irrigation Methods and Efficiency ................................................................................................. 20 Conclusion ..................................................................................................................................... 25
Figures
Figure 1. California Counties and Agricultural Districts ................................................................. 3 Figure 2. California’s Agricultural Gross Cash Receipts, 2012 ....................................................... 5 Figure 3. Value of U.S. Exports of Fruits, Vegetables, and Tree Nuts, 2014 ................................... 6 Figure 4. California’s Harvested Acreage, Selected Crops, 2013 .................................................... 9 Figure 5. California Water Use, USGS Estimate ........................................................................... 12 Figure 6. California Water Use, DWR Estimate ............................................................................ 13 Figure 7. California Water Use by Region, DWR Estimate .......................................................... 15 Figure 8. Total U.S. Water Use (Withdrawals) by State, USGS Estimate ..................................... 16 Figure 9. California’s Irrigated Acres Harvested, Selected Crops, 2013 ....................................... 19 Figure 10. Net Water Use, Selected Crops ..................................................................................... 19 Figure 11. Jobs per Acre-Foot of Net Water Applied, Selected Crops ........................................... 20 Figure 12. Statewide Trends in Irrigation Method, by Hydrologic Region, 1991-2011 ................ 23
Tables
Table 1. California’s Value Added by Agricultural Category, as Percent of State GDP .................. 2 Table 2. Total Harvested Acres and Volume Produced, California Crops (1960-2009) ................... 8 Table 3. Harvested Acreage and Production, Selected California Crops (2004-2013) .................. 10 Table 4. Water Applied on Irrigated Acres, Selected California Crops, 2013 ................................ 17 Table 5. Net Water Use, Selected California Crops ....................................................................... 18 Table 6. Trends in Irrigation Methods, 1991-2010 ....................................................................... 21
Contacts
Author Contact Information........................................................................................................... 25

California Agricultural Production and Irrigated Water Use
Congressional Research Service 1
uch attention has been focused on the use of water to grow certain agricultural crops in California, given current drought conditions in the state and mandatory cutbacks for non-agricultural water users.1 This attention has been twofold. First, media reports have
highlighted how much water is used overall by California’s agricultural sectors. Second, media reports have highlighted how much water is used to grow certain types of crops. Most media attention has focused on certain orchard crops, such as tree nuts and vineyard crops, as well as some grain and pasture crops used to support California’s meat and dairy industries. These reports frequently conflict with primary data sources, resulting in confusion over the state of agricultural production and irrigated water use in the California.
Regarding overall water use for California’s agricultural production, media reports have widely cited estimates claiming that 80% of the state’s available water supplies are used annually for agricultural use.2 Federal and state sources indicate that the state’s agricultural sector uses less available water than many media reports claim. The U.S. Geological Survey (USGS) indicates that roughly 60% is used for the state’s agricultural sectors; the California Department of Water Resources (DWR) indicates roughly 40%.3 The difference between these two estimates is largely based on different survey methods and assumptions, including the baseline amount of water estimated for use, including what constitutes “available” supplies. Some reports, including information posted by the California Department of Food and Agriculture (CDFA), have tried to clarify and highlight differences between various water use estimates.4
Regarding water used to produce specific crops, news outlets across the country have, on numerous occasions, reported estimates of the amount of water California farmers use to produce a single serving of certain foods. For example, according to these reports, it takes nearly one gallon of water to produce one almond and 450 gallons of water to produce a quarter-pound hamburger patty.5 Such statistics can be misleading and further raise questions about the usefulness of quantifying the inputs and resources required to produce a single serving of a specific crop or a single serving of meat or dairy products. Most fruit and nut trees require water year-round and often take several years before the plant reaches fruiting maturity. At maturity, a fruit orchard can produce food capable of feeding many people. Other crops—such as feed grains and pasture crops—are grown, in some cases, mainly to feed livestock, poultry, and dairy cows. The cumulative amount of resources and inputs needed to raise a single farm animal to maturity adds up quickly. Growing consumer and market demand for
1 California is in its fourth consecutive year of drought. Years of drought and/or low water availability over the past 40 years include 1976-1977, 1987-1992, 2001-2002, 2007-2009, and 2012-present (by hydrologic years). For more information, see CRS Report R43407, Drought in the United States: Causes and Current Understanding, Drought in the United States: Causes and Current Understanding. 2 See, for example, “A Guide to California’s Drought and Water Crisis,” April 29, 2015, referenced by the Sacramento Bee newspaper (accessed June 7, 2015) and NRDC, Agricultural Water Conservation and Efficiency Potential in California, Issue Brief, IB: 14-05-F, June 2014. See also L. Buchanan et al., “Your Contribution to the California Drought,” New York Times, May 21, 2015. 3 M. A. Maupin, et al., “Estimated Use of Water in the United States in 2010,” USGS Circular 1405, 2014; and DWR, The Strategic Plan, California Water Today, Volume 1, Chapter 3, October 2014. 4 “Water for Farms – a Briefing by the Public Policy Institute of California (PPIC),” CDFA blog post, April 6, 2015, http://plantingseedsblog.cdfa.ca.gov/wordpress/?p=8122. See also “California’s Farm-Water Scapegoat,” Wall Street Journal, April 11, 2015; and “8 Facts About Almonds, Agriculture, and the Drought,” PRNewswire, April 8, 2015. 5 See, for example, L. Buchanan et al., “Your Contribution to the California Drought,” New York Times, May 21, 2015; K. Kim, “496 Gallons of Water Were Used to Make This Plate,” Los Angeles Times, April 7, 2015; B. Hallock, “To Make a Burger, First You Need 660 Gallons of Water ... ,” Los Angeles Times, January 27, 2014; N. Kristof, “Our Water-Guzzling Food Factory,” New York Times, Sunday Review Op-Ed, May 30, 2015; and E. Holthaus, “The Thirsty West: 10 Percent of California’s Water Goes to Almond Farming,” Slate, May 10, 2014.
M

California Agricultural Production and Irrigated Water Use
Congressional Research Service 2
these food commodities is also a major factor in their production. Moreover, some agricultural products are grown in areas where water is more accessible. Also, not all of the water used by the agriculture sector is captured by the plant; some is returned to the soil or atmosphere.
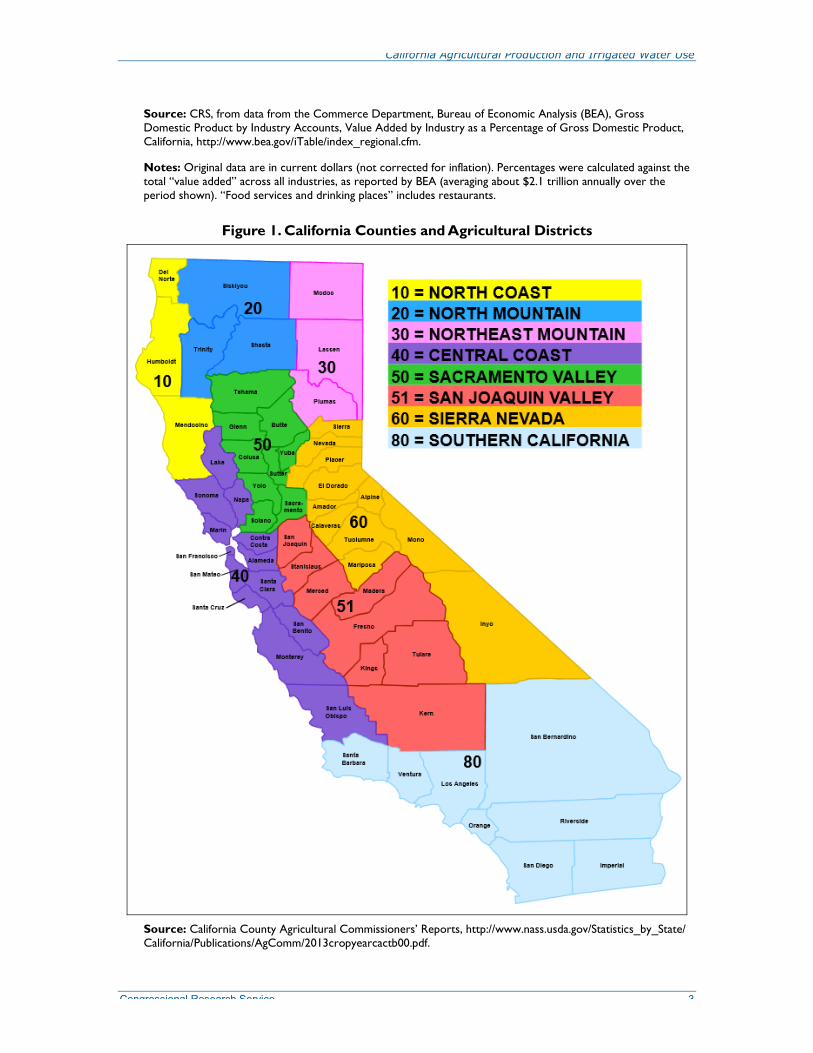
Congressional interest in California agricultural water use centers largely on the operation of the Bureau of Reclamation’s Central Valley Project, which supplies water to numerous agricultural and municipal contractors, some or much of it at a low cost, as well as on U.S. Department of Agriculture (USDA) support for individual crops and farmers. Congress may also be interested in broader implications of decreased agricultural production and/or lack of water availability throughout the state under certain water supply scenarios.6 (Figure 1 provides a map of California’s counties and agricultural districts.)
Overview of California’s Farm Economy
Agriculture and related industries are important to California’s economy. The total value of the agricultural production and processing sector was estimated at more than $100 billion in 2012-2013, including the farm, wholesale, and retail levels for agriculture and agriculture-related industries (Table 1).7 As a share of the total California economy, direct agricultural production and processing output (sales) accounted for nearly 3% of total state output. Considering the broader economic contribution of the state’s food and beverage sectors, the industry’s share of the California economy was estimated at nearly 5% (Table 1).
Table 1. California’s Value Added by Agricultural Category, as Percent of State GDP Agriculture-Related Industries, 2008-2013
Sector
2008 2010 2012 2013
(percent)
Farms 0.9 1.1 1.2 1.2
Forestry, fishing, and hunting 0.4 0.4 0.5 0.5
Processed foods, beverages, and tobacco 1.1 1.1 1.2 1.2
Textile mills and textile product mills 0.1 <0.1 <0.1 0.1
Apparel and leather and allied products 0.2 0.2 0.2 0.2
Food services and drinking places 1.8 1.8 2.0 2.1
Ag-Related Industries (percent of GDP) 4.4% 4.8% 4.9% 4.9%
Ag-Related Value Added (current, $billion) $87.4 $93.2 $102.2 $107.7
6 For more information, see CRS Report R43407, Drought in the United States: Causes and Current Understanding, by Peter Folger and Betsy A. Cody. 7 Data from the Commerce Department, Bureau of Economic Analysis, http://www.bea.gov/iTable/index_regional.cfm.
California Agricultural Production and Irrigated Water Use
Congressional Research Service 3
Source: CRS, from data from the Commerce Department, Bureau of Economic Analysis (BEA), Gross Domestic Product by Industry Accounts, Value Added by Industry as a Percentage of Gross Domestic Product, California, http://www.bea.gov/iTable/index_regional.cfm.
Notes: Original data are in current dollars (not corrected for inflation). Percentages were calculated against the total “value added” across all industries, as reported by BEA (averaging about $2.1 trillion annually over the period shown). “Food services and drinking places” includes restaurants.
Figure 1. California Counties and Agricultural Districts
Source: California County Agricultural Commissioners’ Reports, http://www.nass.usda.gov/Statistics_by_State/California/Publications/AgComm/2013cropyearcactb00.pdf.

California Agricultural Production and Irrigated Water Use
Congressional Research Service 4
Several studies have been conducted by researchers at the University of California estimating the contribution of some of the state’s major farming sectors to the overall state economy. For example, California’s dairy industry, including dairy farming and milk processing, contributed an estimated $20.8 billion in 2014 to the state in terms of economic value added (direct plus so-called indirect and induced effects).8 California’s almond industry generated an estimated $21.5 billion in 2014 in total economic impacts for the state.9 Overall, these researchers estimate that a “$1 billion increase of the value added from agricultural production and processing results in a total of $2.63 billion of [gross state product] GSP,” or the value added by all industries in the state.10 Other estimates are even greater.11
Employment within California’s agricultural sector averaged more than 412,000 jobs during 2014, accounting for more than 2% of overall employment.12 Including other closely related processing industries, researchers at the University of California estimate that the state’s agricultural sectors accounts for as much as 6.7% of California’s private sector labor force (including part-time workers).13 Other estimates place this estimate even higher.14 These researchers further estimate that “each job in agricultural production and processing accounts for 2.2 jobs in the California economy as a whole.”15 Agricultural production and processing employment in some parts of California, such as the Central Valley, are estimated to be greater in percentage terms.
Farm-Level Sales
The U.S. Department of Agriculture (USDA) reports that based on the value of agricultural sales, California ranks as the leading state nationwide. In 2012, California’s farm-level sales totaled nearly $45 billion and accounted for nearly 11% of total U.S. farm-level sales (Figure 2). USDA ranks five counties—Tulare, Kern, Fresno, Monterey, and Merced—as among the leading agricultural counties in the United States, with a reported $28.7 billion in farm sales.16 Four of these counties receive water from the federal Central Valley Project (CVP), which has reduced deliveries in recent years due to drought and environmental factors.
8 D. A. Sumner, et al., Contributions of the California Dairy Industry to the California Economy, University of California Agricultural Issues Center, May 14, 2015, http://aic.ucdavis.edu/publications/CMABReport2015.pdf. 9 D. A. Sumner, et al., The Economic Impacts of the California Almond Industry, University of California Agricultural Issues Center, http://aic.ucdavis.edu/almonds. Measured in terms of direct, indirect, and induced economic output. 10 “The Measure of California Agriculture, Highlights,” University of California, September 2012, http://aic.ucdavis.edu/publications/moca/mocamenu.htm. Estimated using 2009 data. 11 Centers of Excellence, “Agriculture Value Chain for California,” Agricultural Brief, 2011, http://www.butte.edu/departments/careertech/agriculture/Documents/Ag%20Value%20Chain%20in%20California%202011.pdf. 12 Averaged over 2014 calendar year given that agricultural labor tends to be seasonal. California Employment Development Department (http://www.labormarketinfo.edd.ca.gov/data/ca-agriculture.html#AGB). Total state employment in April 2015 was reported at 17.8 million. 13 “The Measure of California Agriculture, Highlights,” University of California, September 2012, http://aic.ucdavis.edu/publications/moca/mocamenu.htm. 14 Centers of Excellence, “Agriculture Value Chain for California,” Agricultural Brief, 2011, http://www.butte.edu/departments/careertech/agriculture/Documents/Ag%20Value%20Chain%20in%20California%202011.pdf. 15 “The Measure of California Agriculture, Highlights,” University of California, September 2012. 16 Total U.S. farm-level sales were $394.6 billion in 2012, the latest available USDA Census year. USDA, “2012 Census Highlights,” May 2014. USDA’s Census of Agriculture reports 2012 value of agricultural sales at $42.6 billion, whereas CDFA reports gross cash receipts totaling $44.7 billion in 2012.

California Agricultural Production and Irrigated Water Use
Congressional Research Service 5
Figure 2. California’s Agricultural Gross Cash Receipts, 2012
Source: California Department of Food and Agriculture (CDFA), California Agricultural Statistics Review, 2013-2014, http://www.cdfa.ca.gov/Statistics/PDFs/ResourceDirectory_2013-2014.pdf.
Notes: CDFA reports gross cash receipts totaling $44.7 billion in 2012. Totals may not add due to rounding.
Whereas most farm states specialize in producing a few agriculture commodities, California’s farm sector is diverse and produces more than 400 commodities.17 Still, the leading 20 agricultural commodities comprise about 80% of total farm cash receipts, and the leading 50 commodities account for more than 90% of all farm receipts.18 In 2013, California’s top-10 valued commodities (ranked by total farm-level sales) included milk ($7.6 billion), almonds ($5.8 billion), grapes ($5.6 billion), cattle and calves ($3.05 billion), strawberries ($2.2 billion), walnuts ($1.8 billion), lettuce ($1.7 billion), hay ($1.6 billion), tomatoes ($1.2 billion), and nursery plants ($1.2 billion).19 Alfalfa production and other forage crops, while not high in overall market value, provide an important input to the state’s dairy and other animal agriculture production.
More than 60% of California’s farm-level sales are attributed to specialty crops, defined as “fruits and vegetables, tree nuts, dried fruits, and horticulture and nursery crops (including floriculture).”20 California’s agricultural sectors are an important leader in agricultural production nationwide. Nationally, California accounts for more than one-third of the value of all specialty crops sold; also, nearly one-half of all irrigated acres growing specialty crops are located in California.21 For some crops, such as raisins, almonds, walnuts, nectarines, and pistachios,
17 CDFA, “California Agricultural Statistics Review 2012-2013,” http://www.cdfa.ca.gov/Statistics/PDFs/2013/FinalDraft2012-2013.pdf. 18 D. Sumner, et al., “The Measure of California Agriculture and Its Importance in the State’s Economy,” Chapter 3, California Agriculture: Dimensions and Issues, University of California, 2004. 19 California Department of Food and Agriculture (CDFA) production statistics, http://www.cdfa.ca.gov/statistics/. 20 Defined in the Specialty Crops Competitiveness Act of 2004 (P.L. 108-465, Section 3), as amended by the 2008 farm bill (P.L. 110-246, Food, Conservation, and Energy Act of 2008). See USDA, “USDA Definition of Specialty Crop,” http://www.ams.usda.gov/AMSv1.0/getfile?dDocName=STELPRDC5082113. Excludes peanuts, other commodities. 21 USDA, National Agricultural Statistics Service (NASS), 2007 Census of Agriculture, Specialty Crops, Vol. 2, November 2009. Latest data available.
California Agricultural Production and Irrigated Water Use
Congressional Research Service 6
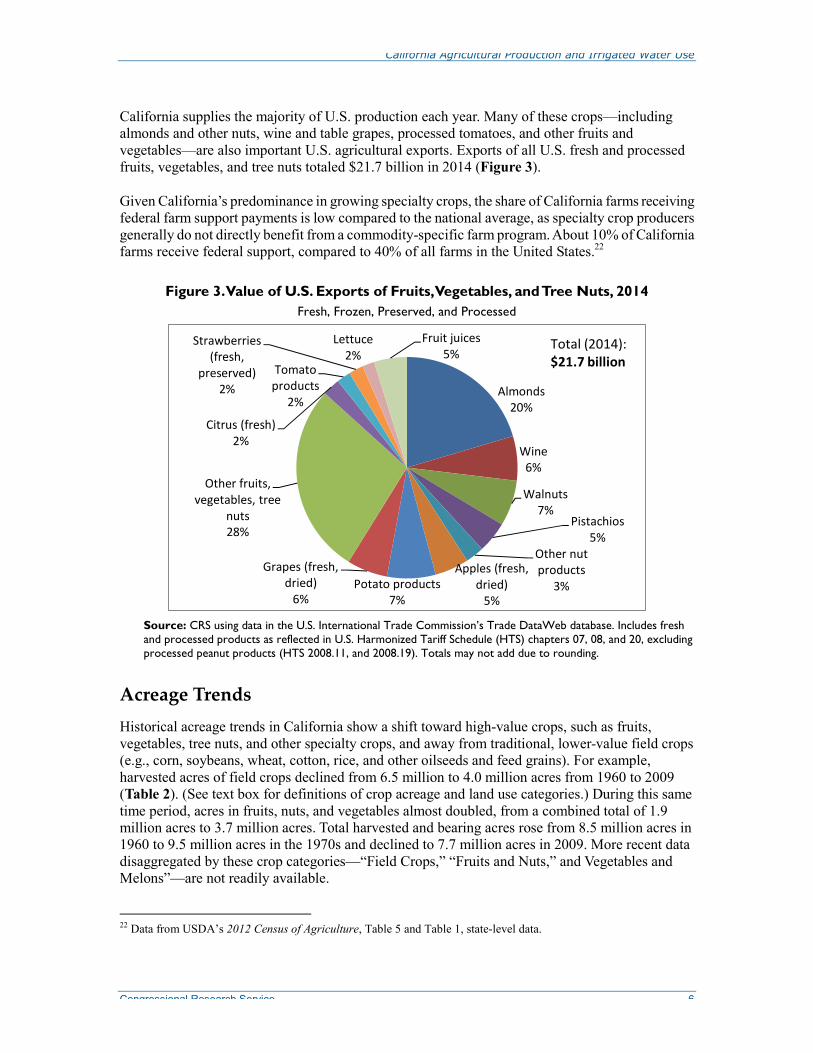
California supplies the majority of U.S. production each year. Many of these crops—including almonds and other nuts, wine and table grapes, processed tomatoes, and other fruits and vegetables—are also important U.S. agricultural exports. Exports of all U.S. fresh and processed fruits, vegetables, and tree nuts totaled $21.7 billion in 2014 (Figure 3).
Given California’s predominance in growing specialty crops, the share of California farms receiving federal farm support payments is low compared to the national average, as specialty crop producers generally do not directly benefit from a commodity-specific farm program. About 10% of California farms receive federal support, compared to 40% of all farms in the United States.22
Figure 3. Value of U.S. Exports of Fruits, Vegetables, and Tree Nuts, 2014 Fresh, Frozen, Preserved, and Processed
Almonds20%
Wine6%
Walnuts7%
Pistachios5%
Other nut products
3%Apples (fresh,
dried)5%
Potato products7%
Grapes (fresh, dried)
6%
Other fruits, vegetables, tree
nuts28%
Citrus (fresh)2%
Tomato products
2%
Strawberries (fresh,
preserved)2%
Lettuce2%
Fruit juices5%
Total (2014):$21.7 billion
Source: CRS using data in the U.S. International Trade Commission’s Trade DataWeb database. Includes fresh and processed products as reflected in U.S. Harmonized Tariff Schedule (HTS) chapters 07, 08, and 20, excluding processed peanut products (HTS 2008.11, and 2008.19). Totals may not add due to rounding.
Acreage Trends
Historical acreage trends in California show a shift toward high-value crops, such as fruits, vegetables, tree nuts, and other specialty crops, and away from traditional, lower-value field crops (e.g., corn, soybeans, wheat, cotton, rice, and other oilseeds and feed grains). For example, harvested acres of field crops declined from 6.5 million to 4.0 million acres from 1960 to 2009 (Table 2). (See text box for definitions of crop acreage and land use categories.) During this same time period, acres in fruits, nuts, and vegetables almost doubled, from a combined total of 1.9 million acres to 3.7 million acres. Total harvested and bearing acres rose from 8.5 million acres in 1960 to 9.5 million acres in the 1970s and declined to 7.7 million acres in 2009. More recent data disaggregated by these crop categories—“Field Crops,” “Fruits and Nuts,” and Vegetables and Melons”—are not readily available.
22 Data from USDA’s 2012 Census of Agriculture, Table 5 and Table 1, state-level data.

California Agricultural Production and Irrigated Water Use
Congressional Research Service 7
Crop Acreage and Land Use DefinitionsHarvested Acres—Total area harvested or partially harvested during a reporting period, including a permanent or semi-permanent planting that was harvested for only a portion of the year. Acreage lost before maturity due to natural or economic factors is not included. Acreage harvested and planted repeatedly during the year is counted each time. Includes row crops and closely sown crops; hay and silage crops; tree fruits, small fruits, berries, and tree nuts; vegetables and melons; and miscellaneous other minor crops. In recent years, farmers have double-cropped about 4% of harvested acres. Harvested acres may overstate total acreage. For example, USDA reports California’s agricultural production covered 8.3 million harvested acres in 2013; of these, 0.4 million were double cropped, and total irrigated acres covered 7.9 million acres.
Planted Acres—Planted acreage is often not reported but may be approximated by available data on harvested acreage. It may include planted crops not actually harvested due to drought, flood, fire, or some other natural or economic disaster.
Bearing Acres—The area of fruit, berry, and vine crops that have reached a commercially productive bearing age. This age varies by crop, by area, and by producer. Acreage refers mostly to permanent tree and orchard crops and may not include non-bearing acreage with unharvested crop due to drought, flood, fire, or some other natural or economic disaster.
Non-Bearing Acres—The area of fruit, berry, and vine crops that have not yet reached a commercially productive bearing age. This age varies by crop, by area, and by producer.
Irrigated Acres—Agricultural acreage under irrigation. Acres may be irrigated with groundwater from wells, on-farm surface water, and off-farm water from all suppliers. Irrigated acres are reported in USDA’s periodic Farm and Ranch Irrigation Survey (FRIS), a supplement to USDA’s periodic Census of Agriculture.
Idle Cropland—Land in cover and soil-improvement crops and cropland on which no crops were planted. Some cropland is idle each year for various physical and economic reasons. Includes acreage diverted from crops to soil-conserving uses (if not eligible for and used as cropland pasture) under federal farm programs (such as cropland enrolled in the federal Conservation Reserve Program). Some other types of fallow are not included, such as cultivated summer fallow to control weeds.
Crop Failure—Acreage on which crops failed because of weather, insects, and diseases, but may include some land not harvested due to lack of labor, low market prices, or other factors. Crop failure is calculated using the difference between cropland planted and cropland harvested. Some planted cropland is not intended to be harvested. In recent years, crops have failed on about 2-3% of the acreage planted for harvest.
Sources: CRS, compiled from various USDA terms and definitions and glossaries.
Other data from California’s County Agricultural Commissioners’ Reports and USDA’s Farm and Ranch Irrigation Survey indicate that, in 2013, total harvested acres were 7.9 million acres.23
Both 2009 and 2013 were drought years in California, which may in part explain why harvested acres during those years were lower. In other years of drought and low rainfall, such as in 1987-1992 and 2000-2001, overall acreage declined, with total acres dropping in recent years. The 1987-1992 drought preceded various environmental restrictions that resulted in less water made available to some farming operations, particularly operations in some parts of California.24
Among individual crops, there has been a continued shift toward growing more permanent orchard crops in some parts of California. Among specialty crops, orchard crops refer to crops, such as fruit trees, that are sown or planted once and are not replanted after each annual harvest. 23 California County Agricultural Commissioners’ Reports, http://www.nass.usda.gov/Statistics_by_State/California/Publications/AgComm/2013cropyearcactb00.pdf; and USDA, 2013 Farm and Ranch Irrigation Survey (FRIS), http://www.agcensus.usda.gov/Publications/Irrigation_Survey/. USDA reports California’s agricultural production covers 7.9 million irrigated acres, of which 0.4 million were double cropped (such that a total of 8.3 million acres were harvested during the year). 24 For more information, see CRS Report IF10133, California Drought: Water Supply and Conveyance Issues.
California Agricultural Production and Irrigated Water Use
Congressional Research Service 8
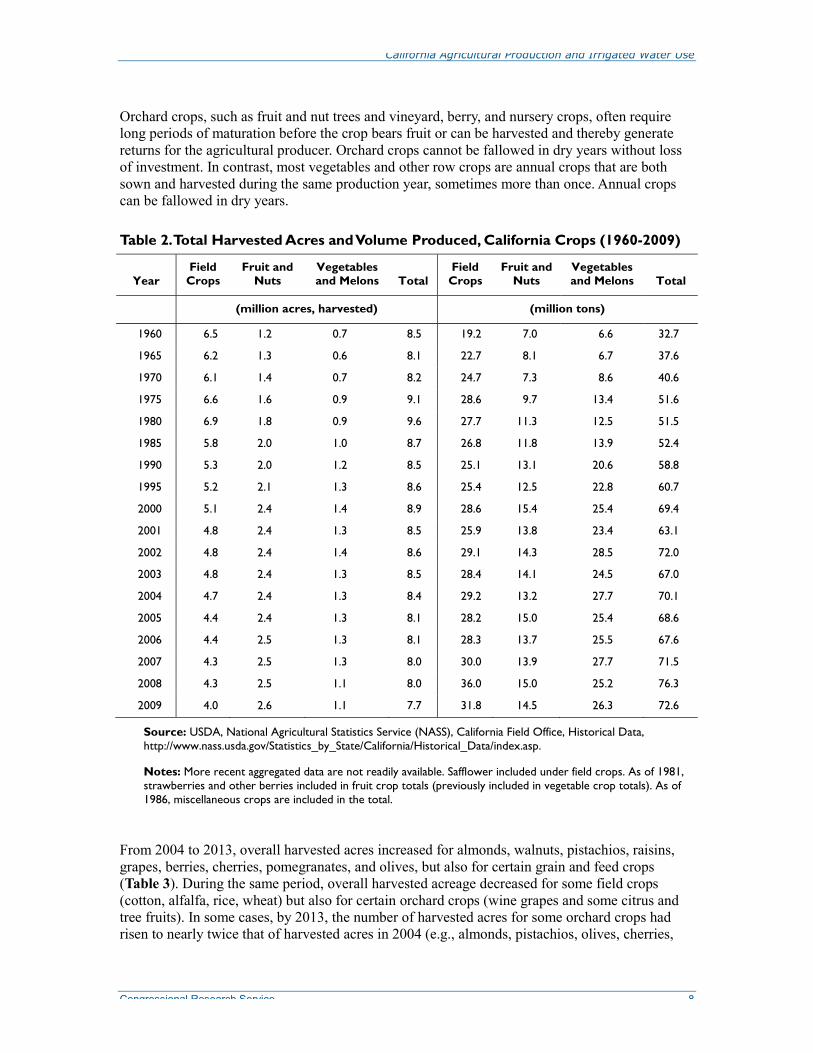
Orchard crops, such as fruit and nut trees and vineyard, berry, and nursery crops, often require long periods of maturation before the crop bears fruit or can be harvested and thereby generate returns for the agricultural producer. Orchard crops cannot be fallowed in dry years without loss of investment. In contrast, most vegetables and other row crops are annual crops that are both sown and harvested during the same production year, sometimes more than once. Annual crops can be fallowed in dry years.
Table 2. Total Harvested Acres and Volume Produced, California Crops (1960-2009)
Year Field
Crops Fruit and
Nuts Vegetables and Melons Total
Field Crops
Fruit and Nuts
Vegetables and Melons Total
(million acres, harvested) (million tons)
1960 6.5 1.2 0.7 8.5 19.2 7.0 6.6 32.7
1965 6.2 1.3 0.6 8.1 22.7 8.1 6.7 37.6
1970 6.1 1.4 0.7 8.2 24.7 7.3 8.6 40.6
1975 6.6 1.6 0.9 9.1 28.6 9.7 13.4 51.6
1980 6.9 1.8 0.9 9.6 27.7 11.3 12.5 51.5
1985 5.8 2.0 1.0 8.7 26.8 11.8 13.9 52.4
1990 5.3 2.0 1.2 8.5 25.1 13.1 20.6 58.8
1995 5.2 2.1 1.3 8.6 25.4 12.5 22.8 60.7
2000 5.1 2.4 1.4 8.9 28.6 15.4 25.4 69.4
2001 4.8 2.4 1.3 8.5 25.9 13.8 23.4 63.1
2002 4.8 2.4 1.4 8.6 29.1 14.3 28.5 72.0
2003 4.8 2.4 1.3 8.5 28.4 14.1 24.5 67.0
2004 4.7 2.4 1.3 8.4 29.2 13.2 27.7 70.1
2005 4.4 2.4 1.3 8.1 28.2 15.0 25.4 68.6
2006 4.4 2.5 1.3 8.1 28.3 13.7 25.5 67.6
2007 4.3 2.5 1.3 8.0 30.0 13.9 27.7 71.5
2008 4.3 2.5 1.1 8.0 36.0 15.0 25.2 76.3
2009 4.0 2.6 1.1 7.7 31.8 14.5 26.3 72.6
Source: USDA, National Agricultural Statistics Service (NASS), California Field Office, Historical Data, http://www.nass.usda.gov/Statistics_by_State/California/Historical_Data/index.asp.
Notes: More recent aggregated data are not readily available. Safflower included under field crops. As of 1981, strawberries and other berries included in fruit crop totals (previously included in vegetable crop totals). As of 1986, miscellaneous crops are included in the total.
From 2004 to 2013, overall harvested acres increased for almonds, walnuts, pistachios, raisins, grapes, berries, cherries, pomegranates, and olives, but also for certain grain and feed crops (Table 3). During the same period, overall harvested acreage decreased for some field crops (cotton, alfalfa, rice, wheat) but also for certain orchard crops (wine grapes and some citrus and tree fruits). In some cases, by 2013, the number of harvested acres for some orchard crops had risen to nearly twice that of harvested acres in 2004 (e.g., almonds, pistachios, olives, cherries,
California Agricultural Production and Irrigated Water Use
Congressional Research Service 9
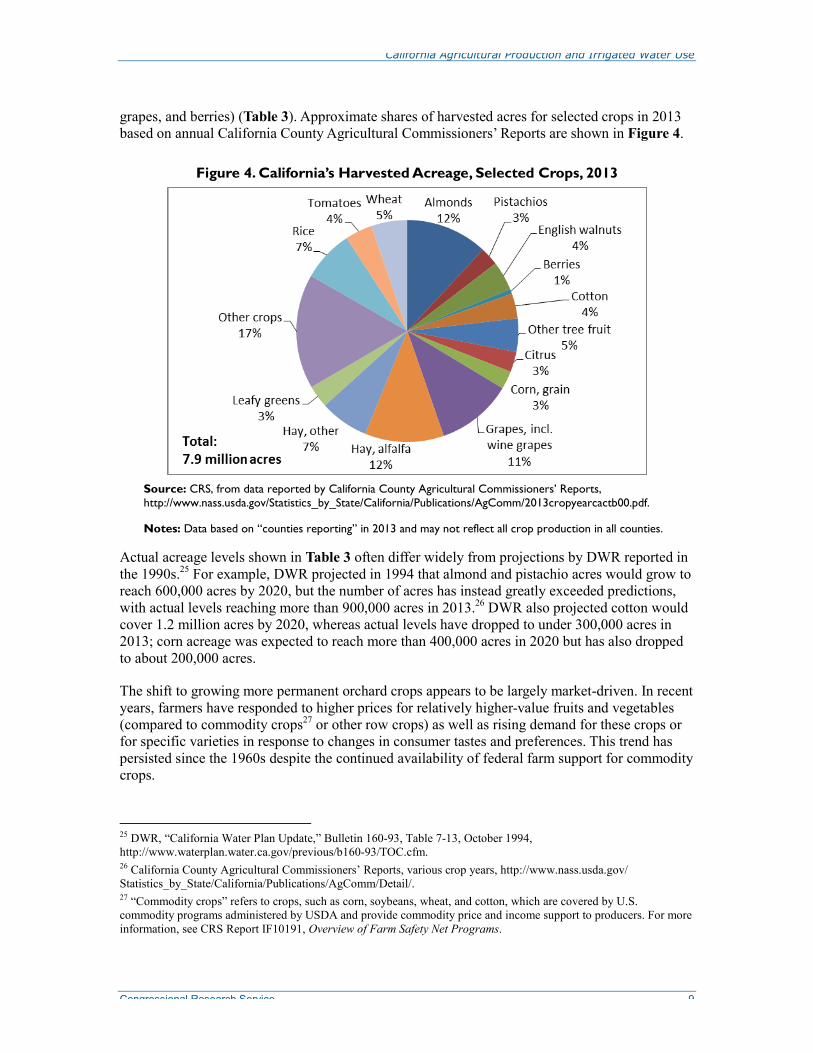
grapes, and berries) (Table 3). Approximate shares of harvested acres for selected crops in 2013 based on annual California County Agricultural Commissioners’ Reports are shown in Figure 4.
Figure 4. California’s Harvested Acreage, Selected Crops, 2013
Source: CRS, from data reported by California County Agricultural Commissioners’ Reports, http://www.nass.usda.gov/Statistics_by_State/California/Publications/AgComm/2013cropyearcactb00.pdf.
Notes: Data based on “counties reporting” in 2013 and may not reflect all crop production in all counties.
Actual acreage levels shown in Table 3 often differ widely from projections by DWR reported in the 1990s.25 For example, DWR projected in 1994 that almond and pistachio acres would grow to reach 600,000 acres by 2020, but the number of acres has instead greatly exceeded predictions, with actual levels reaching more than 900,000 acres in 2013.26 DWR also projected cotton would cover 1.2 million acres by 2020, whereas actual levels have dropped to under 300,000 acres in 2013; corn acreage was expected to reach more than 400,000 acres in 2020 but has also dropped to about 200,000 acres.
The shift to growing more permanent orchard crops appears to be largely market-driven. In recent years, farmers have responded to higher prices for relatively higher-value fruits and vegetables (compared to commodity crops27 or other row crops) as well as rising demand for these crops or for specific varieties in response to changes in consumer tastes and preferences. This trend has persisted since the 1960s despite the continued availability of federal farm support for commodity crops.
25 DWR, “California Water Plan Update,” Bulletin 160-93, Table 7-13, October 1994, http://www.waterplan.water.ca.gov/previous/b160-93/TOC.cfm. 26 California County Agricultural Commissioners’ Reports, various crop years, http://www.nass.usda.gov/Statistics_by_State/California/Publications/AgComm/Detail/. 27 “Commodity crops” refers to crops, such as corn, soybeans, wheat, and cotton, which are covered by U.S. commodity programs administered by USDA and provide commodity price and income support to producers. For more information, see CRS Report IF10191, Overview of Farm Safety Net Programs.

California Agricultural Production and Irrigated Water Use
Congressional Research Service 10
Table 3. Harvested Acreage and Production, Selected California Crops (2004-2013)
Crops
Harvested Acreage Production
2004 2007 2013 Annual Growtha 2004 2007 2013
(1000 acres) (1000 tons)
Almonds 594 714 940 5% 557 739 1,056
Apples, pears 40 29 23 -6% 567 453 418
Apricots 14 11 10 -4% 105 93 91
Avocados 66 65 62 -1% 217 140 295
Berries 38 43 55 4% 969 1,142 1,401
Cherries, sweet 27 30 42 5% 70 89 110
Citrus 252 252 233 -1% 3,180 2,877 3,371
Corn, grain 134 208 209 5% 716 1,062 1,178
Cotton 780 453 287 -11% 641 347 251
Garlic 26 26 23 -1% 239 218 189
Grapes, raisin 130 166 197 5% 1,039 519 2,391
Grapes, table 103 105 133 3% 898 935 1,620
Grapes, wine 579 545 544 -1% 3,639 3,687 4,180
Hay, alfalfa 1,091 1,088 909 -2% 8,176 7,852 6,716
Hay, other 552 604 563 0% 2,624 2,717 2,493
Lettuce 246 203 208 -2% 3,964 3,573 3,801
Leafy greens, other 48 57 51 1% 854 483 396
Melons, all 76 52 52 -4% 1,195 795 959
Nectarines 41 35 26 -5% 335 320 260
Olives 30 27 46 5% 121 116 175
Peaches 79 76 62 -3% 1,094 1,074 846
Pecans 2 2 2 0% 2 2 2
Pistachios 104 128 212 8% 191 218 262
Plums 111 109 84 -3% 312 366 338
Pomegranates 8 13 27 14% 35 38 283
Rice, all 625 576 592 -1% 2,642 2,300 2,570
Tomatoes, fresh 41 34 27 -5% 667 599 458
Tomatoes, processing 294 323 288 0% 12,455 12,480 13,422
Walnuts, English 230 242 338 4% 370 382 624
Wheat 526 448 415 -3% 1,464 1,206 1,172
Subtotal 6,887 6,535 6,657 — — — —
Source: CRS, from data as reported by California County Agricultural Commissioners’ Reports, various crop years, http://www.nass.usda.gov/Statistics_by_State/California/Publications/AgComm/Detail/. Table does not include all harvested crops and based “counties reporting” data in 2013 (may not reflect all crop production in all counties). Based on total harvested acres of 7.9 million acres.
a. “Annual Growth” is calculated by CRS based on compound annual rate of growth, or the year-over-year growth rate in harvested acres, over the 2004-2013 period.

California Agricultural Production and Irrigated Water Use
Congressional Research Service 11
Other reasons for this shift might be in response to rising input costs or reliability of water deliveries. Some producers may switch to relatively less water-intensive crops, particularly when water supplies are more scarce (such as growing forage and oilseed crops, which tend to have relatively lower per-unit water costs and usage requirements). Where crop water demands are similar, and all other factors being equal, producers may invest in higher-value crops, such as fruits, nuts, and vegetables.
Overall, while total crop acreage throughout California remained more or less constant at roughly 8 million acres in production,28 the volume of total crop production rose from nearly 33 million in 1960 to more than 73 million tons of product in 2009 (Table 2). Such gains are attributable to improved productivity and efficiency gains at the farm level and are consistent with general national trends in agricultural production. Despite overall declines in field crop acres, total volume production increased significantly, rising from an estimated 19 million tons in 1960 to 32 million tons in 2009. Increases in fruit and vegetable acreage, however, corresponded with even greater increases in volume production of these crops: total volume production of fruits and nuts more than doubled, while vegetables and melons increased fourfold.29
Water Application in the Agricultural Sector
In addition to growing market demand, the availability of irrigation water has been a factor in the development of California’s agricultural production, particularly in areas where annual rainfall is inadequate to produce desired crop yields.30 Estimates of total water use in California and the amount and share of water used for irrigation agriculture vary depending on the data source and methodology used.
Overall Water Supply and Use in California
Estimates of water use in California vary widely. Two primary sources of information on California water supplies include:
• U.S. Geological Survey data on water withdrawals and use,31 and
• California Department of Water Resources data on “dedicated and developed” water supplies and use.32
Federal and state sources indicate that the state’s agricultural sector uses less available water than many media reports claim. USGS indicates that roughly 60% of water withdrawals and use is used for the state’s agricultural sectors, whereas DWR indicates roughly 40% of water supplies and use is
28 USDA, 2013 Farm and Ranch Irrigation Survey. Agricultural production covered 7.9 million irrigated acres in 2013. 29 Yield calculations (volume per acre) for fruits and vegetables are not straightforward and further complicated by a wide range in value (price per unit) for the different types of crops, compared to field crops. 30 W. E. Johnston, “Cross Sections of a Diverse Agriculture: Profile of California’s Agricultural Production Regions and Principal Commodities,” in California Agriculture: Dimensions and Issues, University of California, 2004. 31 M. A. Maupin, et al., “Estimated Use of Water in the United States in 2010,” USGS Circular 1405, 2014; and DWR, The Strategic Plan, California Water Today, Volume 1, Chapter 3, October 2014. 32 M. A. Maupin, et al., “Estimated Use of Water in the United States in 2010,” USGS Circular 1405, 2014; and DWR, The Strategic Plan, California Water Today, Volume 1, Chapter 3, October 2014.

California Agricultural Production and Irrigated Water Use
Congressional Research Service 12
used for irrigated agriculture. USGS estimates of water use in California totaled 42.6 million acre-feet (MAF)33 or 38 billion gallons per day in 2010.34 These estimates reflect water withdrawn from surface and groundwater sources, thus excluding water left in rivers, lakes, and streams or dedicated to environmental, aesthetic, or recreational purposes. USGS’s estimate represents the amount of water withdrawn from natural and developed sources and applied to different uses and thus includes water that might be returned to other surface and groundwater sources. It does not include an estimate of the amount of water consumed by agricultural uses.35 An estimated 61% (25.8 MAF) of total water withdrawn for use in California (i.e., from surface and groundwater) in an average water year is used for agricultural irrigation, according to USGS (Figure 5). This estimate is based on available data for 2010.
Figure 5. California Water Use, USGS Estimate
Public Supply16.6%
Self-supplied domestic
0.5%
Irrigation60.7%
Livestock0.5%
Aquaculture2.6%
Self-supplied industrial
1.1%
Mining0.7%
Thermoelectric power17.4%
Total Water: 42.6 MAFWater for Irrigation: 25.8 MAF
Source: CRS from USGS data: M. A. Maupin, J. F. Kenny, S. S. Hutson, J. K. Lovelace, N. L. Barber, and K. S. Linsey, “Estimated Use of Water in the United States in 2010,” U.S. Geological Survey Circular 1405 (2014), p. 15, http://dx.doi.org/10.3133/cir1405.
Notes: Graph shows amount of water “withdrawn” and used for different purposes. Data are for 2010.
DWR’s 2013 California Water Plan reported 80 MAF in total estimated water use in California in an average water year.36 DWR’s estimate reflects water applied to particular uses from surface and groundwater sources, similar to USGS estimates of water withdrawals; however, DWR’s total is the
33 An acre-foot is a volume of water equal to 325,851 gallons and represents the amount of water needed to flood an acre of land one foot deep. It is a common measurement for large volumes of water, particularly in the agricultural and water resources sectors. One acre-foot is estimated as enough water to supply a family of four for one year (see Bureau of Reclamation’s website, http://www.usbr.gov/main/about/fact.html). 34 M. A. Maupin, et al., “Estimated Use of Water in the United States in 2010,” USGS Circular 1405, 2014, p. 9 (http://dx.doi.org/10.3133/cir1405). USGS publishes estimated water use statistics every five years. Data are for 2010. 35 USGS’ most recent survey reports consumption figures for thermoelectric uses (http://pubs.usgs.gov/circ/1405/); however, it has not estimated consumption for other sectors since 1995 (http://pubs.er.usgs.gov/publication/cir1200). USGS is working on developing consumption data as part of its ongoing water census initiative. 36 DWR, The Strategic Plan, California Water Today, Volume 1, Chapter 3 (California Water Balance by Water Year Data Table (MAF)), October 2014, http://www.waterplan.water.ca.gov/cwpu2013/final/index.cfm. Data are for 2010.

California Agricultural Production and Irrigated Water Use
Congressional Research Service 13
total amount estimated as “dedicated and developed water supply” and includes water in streams, including those dedicated as wild and scenic rivers. It also includes water returned to groundwater and surface (using total water available under this definition) but does not include water consumed for a particular use. Water use for agricultural irrigation is estimated at 33 MAF, or about 41% of total use in a normal water year (Figure 6). This estimate is also based on available data for 2010.
These estimates differ from other widely cited estimates that 80% of California’s available water supplies are for agricultural use as reported in media and news reports. The origin of 80% agricultural water use is unclear, but it may derive from other DWR or USGS publications.37
Figure 6. California Water Use, DWR Estimate
Source: CRS from California Department of Water Resources (DWR), The Strategic Plan, California Water Today, Volume 1, Chapter 3 (California Water Balance by Water Year Data Table (MAF)), October 2014, pp. 3-35, http://www.waterplan.water.ca.gov/cwpu2013/final/index.cfm.
Notes: Water allocations for different purposes, totaling 79.8 MAF. Data are for 2010.
Differences among the various estimates of water supply and use are largely based on different survey methods and assumptions, including the baseline amount of water estimated for use (e.g., what constitutes “available” supplies). In general, some agencies calculate water use by estimating the amount of water that is withdrawn from natural sources and put to particular uses—these typically include developed or readily available supplies—while other agencies estimate water use using total water supplies in the state as a baseline, whether immediately available for use or not. Additionally, water uses can be defined in many ways. While some agencies estimate water withdrawn for use, others might estimate water consumed or total water withdrawn and used, minus evaporation and
37 For example, DWR’s website states “[I]n average year (sic) California agriculture irrigates 9.6 million acres using roughly 34 million acre-feet of water of the 43 million acre-feet diverted from surface waters or pumped from groundwater” (http://www.water.ca.gov/wateruseefficiency/agricultural/). This 9.6 million acre estimate of an “average year” differs markedly from that for more recent years, reported at about 8 million acres annually (see Table 2). The 80% estimate might also derive from a 1998 USGS report on estimated U.S. water use in 1995 (USGS, Estimated Use of Water in the United States, 1998) or be based on more recent USGS estimates of the percentage of freshwater being used for agricultural purposes (77%, including livestock and aquaculture uses).

California Agricultural Production and Irrigated Water Use
Congressional Research Service 14
other factors resulting in water not being available for use or reuse. When reviewing information about total water use and percentages used for different purposes, it is important to consider whether the source is reporting gross water use or application (including water that may eventually be used and reused) or water consumed in different uses.38
Because of the manner in which agencies estimate water supply and use—namely, some use models while others use surveys—many different numbers are reported for California water supply and water uses. Historically, water remaining in rivers and streams was not counted as a “use.” In recent years, however, DWR has begun to account for such natural flows, as well as for increased environmental allocations (e.g., for fish and wildlife and for water quality purposes) from developed supplies. DWR reports total state water supply as “dedicated and developed water supply” and reports uses as a percentage of this total supply. In contrast, USGS estimates the total amount of water withdrawn from natural and developed supplies and put to use and reports specific uses as a percentage of total water “withdrawals.”
Regional and Nationwide Comparisons
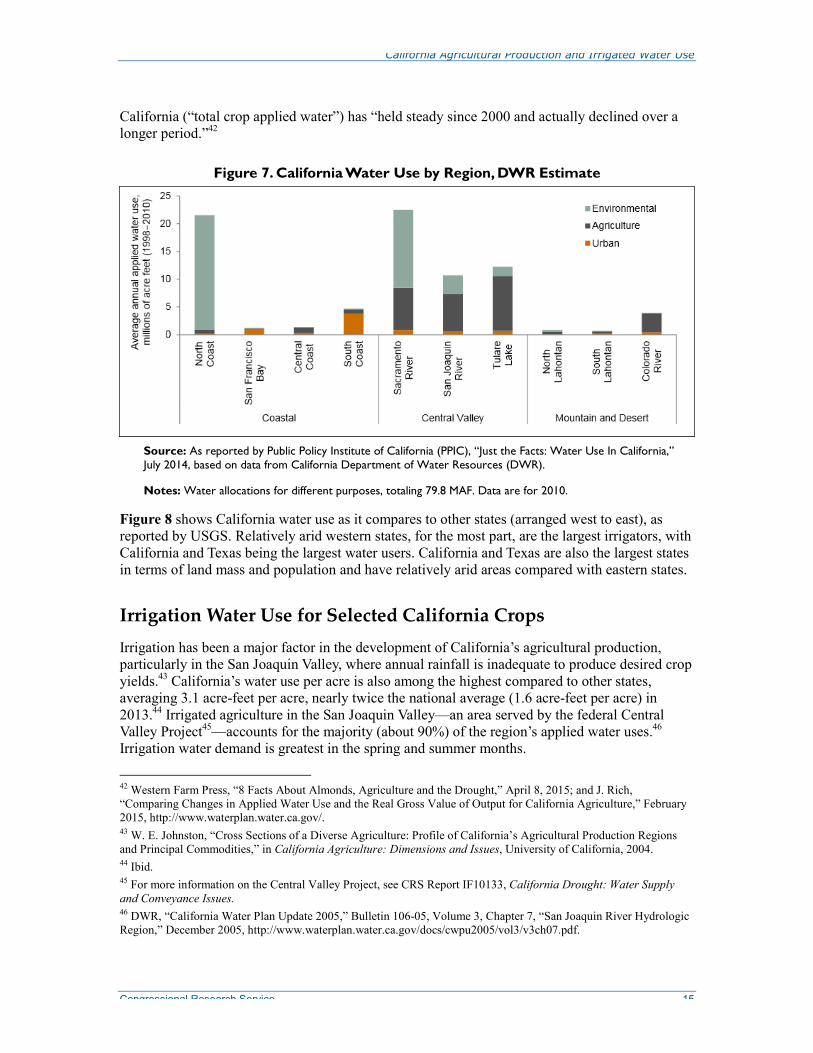
Some stakeholders in California’s agricultural sectors have complained that the 80% water use estimate cited in many media accounts is inaccurate, and they further contend DWR’s estimate of 41% is more appropriate.39 Others have observed that much of the water deemed as dedicated and developed according to DWR is from North Coast rivers and streams, which are hydrologically distinct from the developed infrastructure of the Central Valley of California and thus not readily available for use other than for environmental purposes. Figure 7 provides an overview of water uses in various regions. As shown in the figure, most of the “environmental” water use40 occurs in the North Coast area.
USDA’s 2013 Farm and Ranch Irrigation Survey reports that, nationally, California has the largest number of irrigated farmed acres compared to other states and accounts for about one-fourth of total applied acre-feet of irrigated water in the United States.41 Of the reported 7.9 million irrigated acres in California, nearly 4 million acres were irrigated with groundwater from wells and about 1.0 million acres were irrigated with on-farm surface water supplies. Another roughly 4.0 million acres in California were irrigated with off-farm surface water from all suppliers. Overall, some reports indicate that the total amount of agricultural water use in
38 For more information, see DWR, The Strategic Plan, California Water Today, Volume 1, Chapter 3, Bulletin 160, December 2013, pp. 3-31 – 3-35 (http://www.waterplan.water.ca.gov/cwpu2013/final/index.cfm) and USGS, Estimated Use of Water in the United States, 1998 (http://pubs.er.usgs.gov/publication/cir1200). For a discussion of water terms and water consumption, see Pacific Institute, California Agricultural Water Use: Key Background Information, April 2015 (http://pacinst.org/wp-content/uploads/sites/21/2015/04/CA-Ag-Water-Use.pdf). 39 “Water for Farms – a Briefing by the Public Policy Institute of California (PPIC),” CDFA blog post, April 6, 2015, http://plantingseedsblog.cdfa.ca.gov/wordpress/?p=8122. See also “8 Facts About Almonds, Agriculture, and the Drought,” PRNewswire, April 8, 2015. 40 California water districts must manage for the needs of the environment and its ecosystems, in addition to managing the state’s water resources for domestic, industrial, and agricultural use. The Public Policy Institute of California defines “environmental water use” across four categories: (1) water in rivers protected as “wild and scenic” under federal and state laws; (2) water required for maintaining habitat within streams; (3) water that supports wetlands within wildlife preserves; and (4) water needed to maintain water quality for agricultural and urban use. Other benefits of water in streams include recreation, power production, aesthetics, transportation (navigation), and water conveyance. 41 USDA, 2013 Farm and Ranch Irrigation Survey, Table 4.
California Agricultural Production and Irrigated Water Use
Congressional Research Service 15
California (“total crop applied water”) has “held steady since 2000 and actually declined over a longer period.”42
Figure 7. California Water Use by Region, DWR Estimate
Source: As reported by Public Policy Institute of California (PPIC), “Just the Facts: Water Use In California,” July 2014, based on data from California Department of Water Resources (DWR).
Notes: Water allocations for different purposes, totaling 79.8 MAF. Data are for 2010.
Figure 8 shows California water use as it compares to other states (arranged west to east), as reported by USGS. Relatively arid western states, for the most part, are the largest irrigators, with California and Texas being the largest water users. California and Texas are also the largest states in terms of land mass and population and have relatively arid areas compared with eastern states.
Irrigation Water Use for Selected California Crops
Irrigation has been a major factor in the development of California’s agricultural production, particularly in the San Joaquin Valley, where annual rainfall is inadequate to produce desired crop yields.43 California’s water use per acre is also among the highest compared to other states, averaging 3.1 acre-feet per acre, nearly twice the national average (1.6 acre-feet per acre) in 2013.44 Irrigated agriculture in the San Joaquin Valley—an area served by the federal Central Valley Project45—accounts for the majority (about 90%) of the region’s applied water uses.46 Irrigation water demand is greatest in the spring and summer months.
42 Western Farm Press, “8 Facts About Almonds, Agriculture and the Drought,” April 8, 2015; and J. Rich, “Comparing Changes in Applied Water Use and the Real Gross Value of Output for California Agriculture,” February 2015, http://www.waterplan.water.ca.gov/. 43 W. E. Johnston, “Cross Sections of a Diverse Agriculture: Profile of California’s Agricultural Production Regions and Principal Commodities,” in California Agriculture: Dimensions and Issues, University of California, 2004. 44 Ibid. 45 For more information on the Central Valley Project, see CRS Report IF10133, California Drought: Water Supply and Conveyance Issues. 46 DWR, “California Water Plan Update 2005,” Bulletin 106-05, Volume 3, Chapter 7, “San Joaquin River Hydrologic Region,” December 2005, http://www.waterplan.water.ca.gov/docs/cwpu2005/vol3/v3ch07.pdf.

California Agricultural Production and Irrigated Water Use
Congressional Research Service 16
Figure 8. Total U.S. Water Use (Withdrawals) by State, USGS Estimate
Source: CRS from USGS data: M. A. Maupin, J. F. Kenny, S. S. Hutson, J. K. Lovelace, N. L. Barber, and K. S. Linsey, Estimated Use of Water in the United States in 2010: U.S. Geological Survey Circular 1405, (2014), p. 16, http://dx.doi.org/10.3133/cir1405.
Notes: Graph shows amount of water “withdrawn” and used for different purposes. Data are for 2010.
Table 4 shows available data for selected categories of California crops in terms of the quantity of water applied on irrigated acres harvested from all sources (including groundwater from wells, on-farm surface water, and off-farm water from all suppliers). Across categories of selected crops (as categorized and named by USDA), irrigation water application rates range from an average of 0.6 acre-feet applied per acre (berries) to an average of 4.5 acre-feet applied per acre (rice). With few exceptions (e.g., tomatoes, lettuces, and berries), only aggregated data are available for total “land in orchards” and “land in vegetables.” Irrigation water application rates are not available from USDA’s survey data for some individual orchard crops, such as almonds and other tree nuts, or vineyard crops and stone fruit. Estimates are available for most commodity crops (e.g., corn, rice, cotton, alfalfa, pastureland, and other grains).
These data indicate that of total irrigated acres harvested in California about 31% of irrigated acres were land in orchards and 18% were land in vegetables. Another 46% of irrigated acres harvested were land in alfalfa, hay, pastureland, and grain crops (including rice, corn, and cotton). Figure 9 shows the allocation of California’s irrigated acres harvested across selected crops from USDA’s 2013 survey.
Researchers at the University of California have reported data indicating water application rates across a wider range of California crops. According to these estimates, some crops require more than 5 AF of irrigation water per acre (alfalfa, sugar beets), others between 4 and 5 AF per acre (rice, pasture), and some crops between 3 and 4 AF per acre (tree nuts, tree fruit, cotton). Most vegetables are estimated to apply under 2 AF per acre (Table 5).

California Agricultural Production and Irrigated Water Use
Congressional Research Service 17
Table 4. Water Applied on Irrigated Acres, Selected California Crops, 2013
Selected Crops Number of
Farms Irrigated Acres
Harvested Average Acre-Feet Applied per Acre
Corn for grain or seed 489 152,261 3.4 Corn for silage or greenchop 1,583 363,651 3.1 Sorghum for grain or seed 42 10,305 1.9 Wheat for grain or seed 900 339,188 2.1 Soybeans for beans — — — Beans, dry edible 164 38,855 2.3 Rice 2,026 1,051,374 4.5 Other small grains (barley, oats, and rye) 334 77,523 1.8 Alfalfa and mixtures 2,412 664,318 3.8 All other hay (dry hay, greenchop, and silage) 2,212 437,280 2.8 Peanuts for nuts — — — All cotton 464 274,834 2.9 Land in vegetables 3,374 1,018,036 2.8 Sweet corn 113 28,420 2.5 Tomatoes in the open 1,036 283,287 2.7 Lettuce and romaine 261 197,716 2.5 Potatoes, excluding sweet potatoes 163 63,101 1.7 All berries 1,280 33,443 0.6 Land in orchards 31,859 2,576,601 2.7 All other crops (see text) 3,819 249,561 2.7 Pastureland, all types 3,786 433,570 2.0
Source: USDA, 2013 Farm and Ranch Irrigation Survey (FRIS), Table 36, http://www.agcensus.usda.gov/Publications/2012/Online_Resources/Farm_and_Ranch_Irrigation_Survey/.
Adjusting irrigation water rates and acreage for individual crops, Figure 10 shows estimated shares of net water use47 in the state across a range of crops. The analysis estimates a total estimated net water use of about 20 MAF. Leading California crops account for about three-fourths of all agricultural water use. Use varies by crop category: irrigated pasture, alfalfa, and hay (19%); commodity crops such as corn, wheat, rice, and cotton (19%); tree nuts such as almonds, pistachios, and walnuts (19%); vine crops (11%); and citrus or other tree fruit (8%). In addition, according to these researchers, “crops with the highest economic ... revenue per net unit of water—also usually have the highest employment per land area and water use”48 (Figure 11).
47 Net water use is volume consumed by the crop, that is, water applied minus runoff and ground seepage. 48 J. Medellín-Azuara, J. Lund, and R. Howitt, UC-Davis, “Jobs per Drop Irrigating California Crops,” April 28, 2015.

California Agricultural Production and Irrigated Water Use
Congressional Research Service 18
Table 5. Net Water Use, Selected California Crops
Crop Group Area
(1000 acres) Average Acre-Feet Applied per Acre
Gross Water (TAF)
Net Water (TAF)
Alfalfa 1,039 5.0 5,241 3,652
Almonds Pistachios 1,080 3.5 3,820 2,892
Corn 781 2.8 2,206 1,507
Cotton 300 3.1 927 726
Cucurbits 116 1.8 205 138
Deciduous 671 3.3 2,210 1,655
Dry Bean 85 2.3 199 140
Fresh Tomato 42 1.8 77 55
Grain 576 1.4 802 545
Irrigated Pasture 830 4.1 3,362 2,270
Onion Garlic 80 2.8 225 161
Other Field 647 2.6 1,691 1,096
Potato 28 2.4 66 45
Processing Tomato 304 2.4 742 548
Rice 592 4.6 2,700 1,517
Safflower 43 1.4 59 51
Subtropical 452 3.1 1,411 1,049
Sugar Beet 27 5.1 138 87
Vegetables/Non-Tree Fruits 857 1.5 1,298 899
Vine 850 1.9 1,581 1,183
Grand Total 9,398 3.1 28,961 20,216
Source: Data from J. Medellín-Azuara, J. Lund, and R. Howitt, University of California-Davis, “Jobs per Drop Irrigating California Crops,” CaliforniaWaterBlog.com, posted on April 28, 2015, http://californiawaterblog.com/.
Notes: TAF = thousand acre feet of water. “Average Acre-Feet Applied per Acre” calculated by CRS from available area and gross water use. Net water use is volume consumed by the crop, that is, water applied minus runoff and ground seepage.

California Agricultural Production and Irrigated Water Use
Congressional Research Service 19
Figure 9. California’s Irrigated Acres Harvested, Selected Crops, 2013
Source: CRS, from data in USDA’s 2013 Farm and Ranch Irrigation Survey (FRIS), Table 36.
Notes: USDA reports that California’s agricultural production covers 7.9 million irrigated acres, of which 0.4 million were double cropped (such that a total of 8.3 million acres were harvested during the year).
Figure 10. Net Water Use, Selected Crops
Source: CRS, from data from J. Medellín-Azuara, J. Lund, and R. Howitt, UC-Davis, “Jobs per Drop Irrigating California Crops,” CaliforniaWaterBlog.com, posted on April 28, 2015, http://californiawaterblog.com/.
Notes: Net water use is volume consumed by the crop, that is, water applied minus runoff and ground seepage.

California Agricultural Production and Irrigated Water Use
Congressional Research Service 20
Figure 11. Jobs per Acre-Foot of Net Water Applied, Selected Crops
Source: CRS, from data from J. Medellín-Azuara, J. Lund, and R. Howitt, UC-Davis, “Jobs per Drop Irrigating California Crops,” CaliforniaWaterBlog.com, posted on April 28, 2015, http://californiawaterblog.com/.
Notes: Net water use is volume consumed by the crop, that is, water applied minus runoff and ground seepage.
Irrigation Methods and Efficiency
Compared to the national average, California’s relatively high per-acre irrigation water use may, in part, be explained by lower annual rainfall, few unused sources of freshwater, longer growing seasons, and generally drier conditions. However, California’s high per-acre use of water might also stem from irrigation inefficiencies, given current market signals (namely, artificially low water costs given existing irrigation water policies) that might not encourage farmers to conserve water or improve irrigation.49 The arid climate in some producing regions might also contribute to overall irrigation water losses from evaporation.
Despite ongoing investment in more efficient on-farm irrigation systems, flood and furrow irrigation still accounted for 43% of all irrigated acres in 2010 and continues to be the predominant irrigation method (Table 5). However, between 1991 and 2010, adoption of drip and microsprinkler irrigation systems more than doubled and accounted for 39% of all irrigated acres in 2010.50 This shift to more efficient irrigation methods may in part be attributable to a reduction in irrigation water supplies in response to periodic drought conditions and other water supply constraints, as well as reduced costs and available federal assistance for adopting improved technologies. The text box below describes the different types of irrigation systems in use.
49 See M. Bazdarich and C. Thornberg, “Benefits and Costs for California from Water Transfers,” October 2006, https://escholarship.org/uc/item/3t12x46k. 50 DWR, California Water Plan Update 2013, Volume 3, Agricultural Water Use Efficiency, Table 2-1.

California Agricultural Production and Irrigated Water Use
Congressional Research Service 21
Irrigation Methods DefinitionsGravity (furrow, flood)—Refers to surface application of water, generally where water is pumped or brought to the fields and is allowed to flow along the ground among the crops, either by flooding the field or furrows between cropping rows.
Sprinkler—USDA defines a sprinkler irrigation system as “[a]n irrigation system in which all necessary equipment and facilities are installed for efficiently applying water by means of nozzles operated under pressure.”
Drip, microsprinkler—These types of systems generally fall under the category of microirrigation, which USDA defines as “the frequent application of small quantities of water on or below the soil surface as drops, tiny streams, or miniature spray through emitters or applicators placed along a water delivery line,” encompassing methods or concepts such as bubbler, drip, subsurface drip, mist, or spray.
Subsurface—USDA defines a subsurface drip irrigation system as a type of microirrigation system, composed of “a planned irrigation system in which water is applied directly to the root zone of plants by means of applicators (e.g. orifices, emitters, and porous tubing) placed below the ground surface.” Such a system is operated under low pressure and is considered one of the more advanced irrigation methods in use and, according to USDA, “potentially more efficient than flood or sprinkler irrigation, due, in large part to reduced evaporation.”
Sources: CRS, compiled from various USGS and also USDA sources, including USDA Natural Resources Conservation Service Conservation (NRCS) Practice Standards and the NRCS National Engineering Handbook.
Table 6. Trends in Irrigation Methods, 1991-2010
Irrigation Method
1991 Acres
(million)
1991 Share
(percent)
2001 Acres
(million)
2001 Share
(percent)
2010 Acres
(million)
2010 Share
(percent)
% Change in Acreage
(1991-2010)
Gravity (furrow, flood) 5.5 67 4.0 50 3.5 43 -36
Sprinkler 1.4 17 1.3 16 1.2 15 -15
Drip, microsprinkler 1.3 15 2.7 33 3.1 39 +150
Subsurface <0.1 1 <0.1 2 <0.1 3 +380
Total 8.3 100 8.2 100 8.1 100 –
Source: DWR, California Water Plan Update 2013, Volume 3, Agricultural Water Use Efficiency, Table 2-1, http://www.waterplan.water.ca.gov/docs/cwpu2013/Final/Vol3_Ch02_AgWUE.pdf.
Drip and microsprinkler irrigation systems are reported to have the highest irrigation efficiency51 rating of 87.5%-90.0%, compared to traditional sprinkler systems of 70.0%-82.5%, depending on the type of system.52 Irrigation efficiency for most surface irrigation systems can range widely, with furrow and gravity systems having a reported 67.5%-75.0% efficiency rating. The type of irrigation system adopted can depend on financing available to update a farm’s irrigation system but may also depend on site-specific conditions at the farm, including soil type and topography, as well as the type of crop grown. Sprinkler systems may be suitable for sandy light soils where there is rapid percolation; some systems are not suitable if the slope of the land exceeds 5%-10% or in areas with high saline soils, such as in some areas on the westside of the San Joaquin Valley.
51 Irrigation efficiency refers to the ratio of the volume of water used to produce a crop and the volume of water taken from a water resource. This measure does not account for potential losses after application. 52 W. Salas, P. Green, S. Frolking, C. Li, and S. Boles, “Estimating Irrigation Water Use for California Agriculture: 1950s to Present,” CEC-500-2006-057, May 2006, http://www.energy.ca.gov/2006publications/CEC-500-2006-057/CEC-500-2006-057.PDF.

California Agricultural Production and Irrigated Water Use
Congressional Research Service 22
Economic factors such as market demand for high-value crops or the ability to sell or lease surplus water may also influence investment in more efficient irrigation technology.
Figure 12 shows differences among hydrologic regions in terms of irrigation methods used and trends in methods used from 1991 to 2011.

California Agricultural Production and Irrigated Water Use
Congressional Research Service 23
Figure 12. Statewide Trends in Irrigation Method, by Hydrologic Region, 1991-2011
Source: DWR, California Water Plan Update 2013, Volume 3, Resource Management Strategies, Agricultural Water Use Efficiency, http://www.waterplan.water.ca.gov/docs/cwpu2013/Final/Vol3_Ch02_AgWUE.pdf.
Cost is often the main limiting factor for more widespread adoption of drip irrigation systems. Media reports cite estimates that a permanent drip irrigation system can cost $1,000 to $3,000 per acre, not including installation; maintenance and/or repair costs can add another $100 to $300 an

California Agricultural Production and Irrigated Water Use
Congressional Research Service 24
acre per year.53 Actual costs will depend on the type of crop grown. In 2013, USDA reported that California farmers with irrigated land invested an estimated $600 million in irrigation equipment, covering investments in facilities, land improvement, and computer technology.54 The California Farm Water Coalition reports that between 2003 and 2008, California farmers invested more than $1.5 billion on drip and microsprinkler irrigation technology, with about 1.3 million acres installed with high-technology irrigation systems.55
Some have suggested that, because of steady advances in technology and efficiency gains made in response to previous water shortages and drought conditions, additional gains in irrigation efficiency will be difficult to obtain.56 However, others have noted that, in response to the current and ongoing situation, there continues to be ongoing efforts and increasing investment in irrigation technology. The California Farm Bureau Federation (CFBF) claims, “Experts suggest California farmers and ranchers have invested hundreds of millions of dollars in irrigation technology in recent years, and there’s general agreement that the pace of investment and technological advancement is increasing.”57 CFBF notes that farmers are continuing to invest in new and also improved technologies, including subsurface drip irrigation, as well as better emitters, valves, gauges, and management. Many farmers also engage in certain water and resource conservation practices, such as use of cover crops, minimum tillage, water recycling, and mulching. CFBF claims this investment and management has allowed California producers to grow more on increasing acreage using roughly the same amount of water.
Studies claim there is the potential to reduce agricultural water use from improved technology and water management, and changes in cropping patterns. A 2009 study by the Pacific Institute reported potential water savings of 4.5 million acre-feet in a wet year and 6.0 million acre-feet in a dry year, or reductions of 17% from improved technology and water management.58 A 2014 follow-up analysis by the Natural Resources Defense Council (NRDC) reported potential savings of between 5.6 million and 6.6 million acre-feet per year, or about 17% to 22% water savings from current levels “while maintaining productivity and total irrigated acreage.”59
Many groups have criticized the findings of these studies. Some point out that previous studies conducted by university researchers indicate that on-farm changes by California farmers would result in water savings that are significantly lower than those reported by the Pacific Institute and NRDC.60 Some claim these estimated water savings far exceed recent water delivery reductions.61
53 See, for example, J. Marx and I. James, “Farm Water Use Comes Under Scrutiny,” The Desert Sun, April 20, 2015; and M. Weiser, “Flood Irrigation Still Common, But Drip Method Is Gaining Ground,” Sacramento Bee, February 16, 2014. See also USDA’s 2013 Farm and Ranch Irrigation Survey (FRIS) data files. 54 USDA, 2013 Farm and Ranch Irrigation Survey (FRIS), Table 36. 55 As reported in DWR, California Water Plan Update 2013, Volume 3, Agricultural Water Use Efficiency. Based on a survey of irrigation companies and suppliers. 56 R. E. Howitt, D. MacEwan, and J. Medellin-Azura, “Economic Impacts of Reductions in Delta Exports on Central Valley Agriculture,” Agriculture and Resource Economics Update, University of California, Vol. 12, No. 3, January/February 2009, http://www.agecon.ucdavis.edu/extension/update/. 57 CFBF, “Farmers Constantly Seek More ‘Crop per Drop’,” February 18, 2009. 58 Pacific Institute, Sustaining California Agriculture in an Uncertain Future, July 2009, http://www.pacinst.org/publication/sustaining-california-agriculture-in-an-uncertain-future/. 59 NRDC, Agricultural Water Conservation and Efficiency Potential in California, Issue Brief, IB: 14-05-F, June 2014, http://www.nrdc.org/water/files/ca-water-supply-solutions-ag-efficiency-IB.pdf. 60 California Farm Water Coalition, “Conservation Report Lacks Reality,” July 21, 2009, press release. 61 See, e.g., “Environmental Groups, Water Advocates, and Fisheries React to Sean Hannity Spreading Misinformation (continued...)

California Agricultural Production and Irrigated Water Use
Congressional Research Service 25
Others object to the study’s assumptions that producers will shift away from growing certain crops, claiming they ignores market demand, which influences what farmers grow, among other types of methodological concerns.62 Others also object to claims that agricultural productivity will not be affected by irrigation reductions, pointing out numerous studies over the years estimating significant economic losses to the state’s agricultural sectors as a result of ongoing drought conditions.63 The most recent estimates by researchers at UC-Davis project the total direct economic costs of the drought to the agricultural sectors will total $1.8 billion in 2015, or about 4% of the state’s 2012 agricultural gross cash receipts, covering estimated revenue losses to crop, dairy, and livestock producers, as well as additional water pumping costs.64 The debate about water savings from improved irrigation efficiency further raises the question about what is the net outcome of such efficiency gains in the farming sectors: namely, will water use reductions through the adoption of more efficient irrigation systems result in overall water savings, or will these reductions be used to support additional expansion in agricultural production?
Conclusion
California’s agricultural industry is an important part of the state’s economy and a significant contributor to the nation’s food supply for certain crops such as fruits, vegetables and tree nuts. Agricultural production has shifted from traditional field crops in recent decades to higher value fruit, vegetable, tree nuts and other specialty crops. This shift appears to be largely market driven. Confusion over how much water is used to grow crops in California stems largely from baseline differences in water use and supply definitions used by different agencies reporting such data.
Author Contact Information
Renée Johnson Specialist in Agricultural Policy [email protected], 7-9588
Betsy A. Cody Specialist in Natural Resources Policy [email protected], 7-7229
(...continued) on California Water Crisis,” Indy Bay, September 17, 2009. 62 Ibid. See also California Farm Bureau Federation, “ Commentary: Widely Publicized Water-Conservation Report Drew Incorrect Conclusions,” January 28, 2009. 63 See, for example, “What Does California’s Water-Use Order Mean for Agriculture,” Agri-Pulse, Vol. 11, No. 14, April 2, 2015. 64 R. Howitt, D. MacEwan, J. Medellin-Azuara, J. Lund, and D.A. Sumner, “Preliminary Analysis: 2015 Drought Economic Impact Study,” May 31, 2015, https://watershed.ucdavis.edu/files/biblio/2015Drought_PrelimAnalysis.pdf.