Embed Size (px)
Citation preview

BARCLAY’S CAPITAL INDUSTRIAL CONFERENCER O B K U H B A C H • P A U L G O L D B E R G
MIAMI, FL - FEBRUARY 9, 2009
2
Forward Looking Statements We want to remind everyone that our comments may contain forward-looking statements that are inherently subject to uncertainties. We caution everyone to be guided in their analysis of Dover Corporation by referring to our Form 10-K for a list of factors that could cause our results to differ from those anticipated in any such forward looking statements.
We would also direct your attention to our internet site, www.dovercorporation.com, where considerably more information can be found.
3
. . . is a $7 billion global provider of innovative equipment, specialty systems and value added services for the industrial products, fluid management, engineered systems and electronic technologies markets.
. . . strives to achieve superior long term growth through efficient capital deployment focused on organic growth and strategic acquisitions in attractive end markets, particularly energy, product identification, and fluid solutions.
. . . returns value to shareholders through earnings growth initiatives, annually increased dividends and strategic share repurchases.
. . .

4
Dover’s 2008 PerformanceContinuing Earnings Per Share
2005 2006 2007 2008
$2.12
$2.90
$3.30
$3.67
Revenue $1.7B $7.6B -8% +3%
EPS (continuing) $0.91 $3.67 +3% +11%
Segment Margins 15.3% 15.3% +70bps +40bps
Organic Growth -5.7% 1.2%
Acquisition Growth
1.2% 1.7%
Free Cash Flow $228M $835M -30% +11%
• Full year free cash flow was strong at 11% of revenue, with Q4 results at 13% of revenue, reflecting higher earnings and lower tax payments in 2008.
•Q4 and full year margin improvements driven by operational excellence programs and pricing discipline.
• Full year revenue was up 3% reflecting strong performance in Fluid Management offsetting widespread industrial softness
• Improvements in working capital metrics in Q4 and for the full year
• Synergy capture initiatives yielded $0.04 in Q4 and $0.15 for the full year
Q4 FY Q4/Q4 FY/FY
5
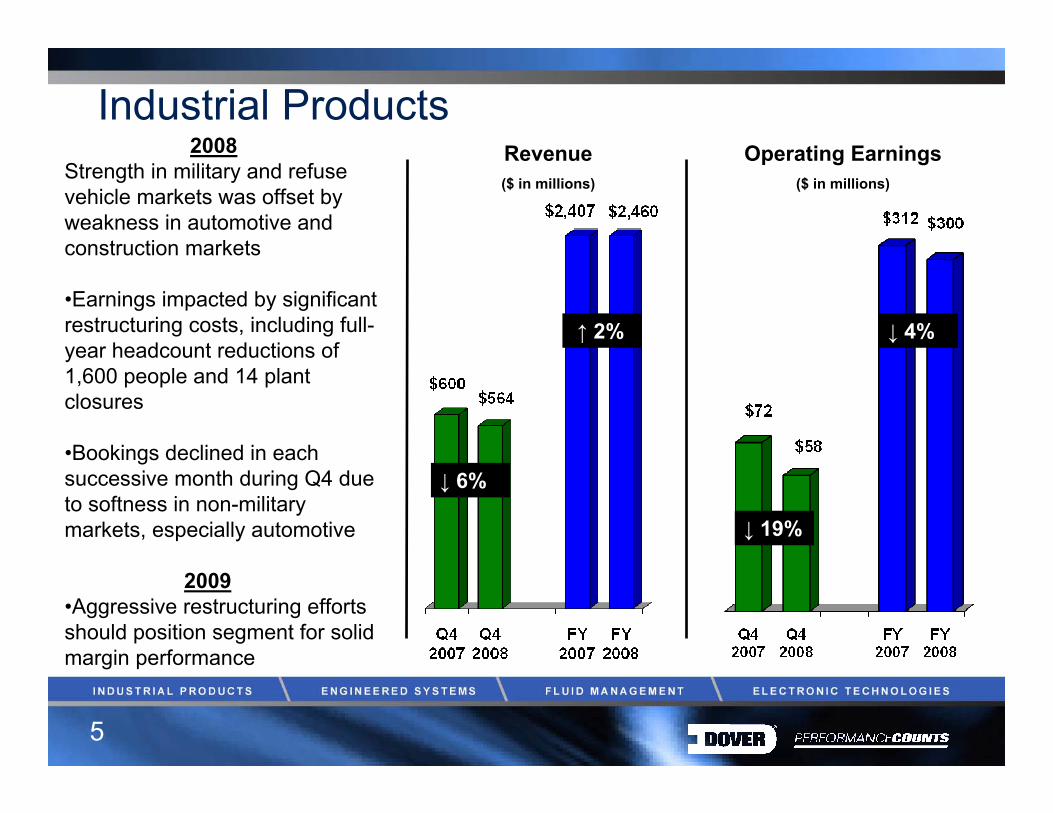
Industrial ProductsRevenue($ in millions)
Operating Earnings($ in millions)
↑ 2%
↓ 6%
↓ 4%
↓ 19%
2008Strength in military and refuse vehicle markets was offset by weakness in automotive and construction markets
•Earnings impacted by significant restructuring costs, including full-year headcount reductions of 1,600 people and 14 plant closures
•Bookings declined in each successive month during Q4 due to softness in non-military markets, especially automotive
2009•Aggressive restructuring efforts should position segment for solid margin performance
6
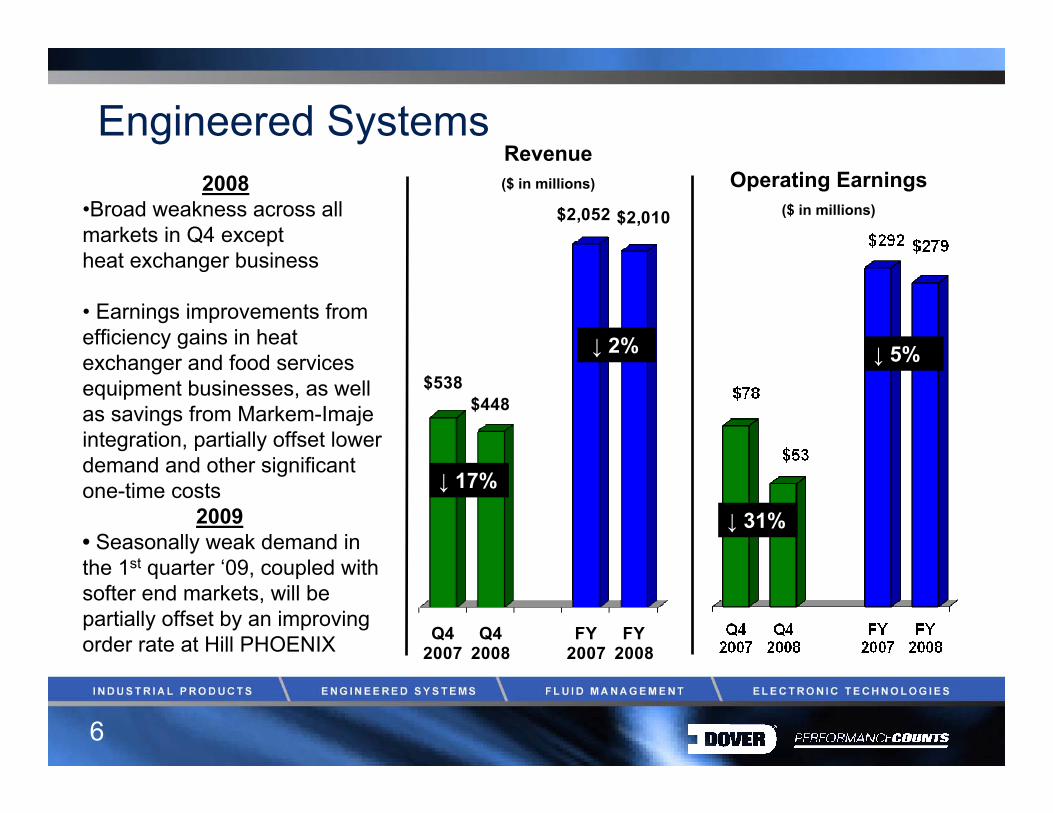
Engineered Systems
Q4 2007
Q4 2008
FY 2007
FY 2008
$538$448
$2,052 $2,010
Revenue($ in millions) Operating Earnings
($ in millions)
↓ 2%
↓ 17%
2008•Broad weakness across allmarkets in Q4 exceptheat exchanger business
• Earnings improvements from efficiency gains in heat exchanger and food services equipment businesses, as well as savings from Markem-Imaje integration, partially offset lower demand and other significant one-time costs
2009• Seasonally weak demand in the 1st quarter ‘09, coupled with softer end markets, will be partially offset by an improving order rate at Hill PHOENIX
↓ 5%
↓ 31%
7
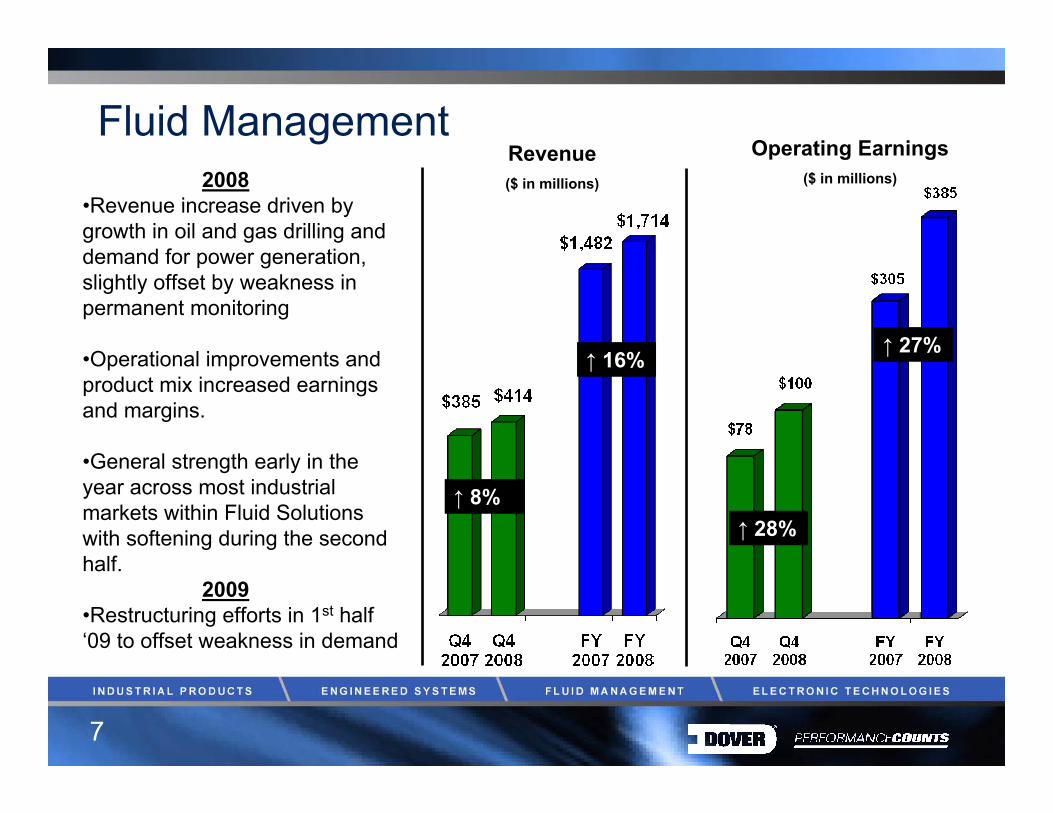
Fluid ManagementRevenue($ in millions)
Operating Earnings($ in millions)
↑ 16%
↑ 8%
↑ 27%
↑ 28%
2008•Revenue increase driven by growth in oil and gas drilling and demand for power generation, slightly offset by weakness in permanent monitoring
•Operational improvements and product mix increased earnings and margins.
•General strength early in the year across most industrial markets within Fluid Solutions with softening during the second half.
2009•Restructuring efforts in 1st half ‘09 to offset weakness in demand

8
Electronic TechnologiesRevenue($ in millions) Operating Earnings
($ in millions)
FLAT
↓ 17%
↑ 7%
↑ 11%
2008•Electronic test markets experienced meaningful demand declines as the quarter ended
•Earnings improvement due to ongoing restructuring programs and $7.5 million gain on the sale of Rasco (semicon test handling)
•MEMS, hearing aid, and military & space markets continue to be stable
2009•Electronic assembly and telecom related markets to remain weak through the first quarter of ‘09, and will absorb significant restructuring charges

9
Geographic Revenue Mix (FY 2008)
Dover Growth Rate: 3%
2008 2008 Growth Growth
RateRate
2.5%2.5%4.4%4.4%
3.7%3.7%
3.3%3.3%
10
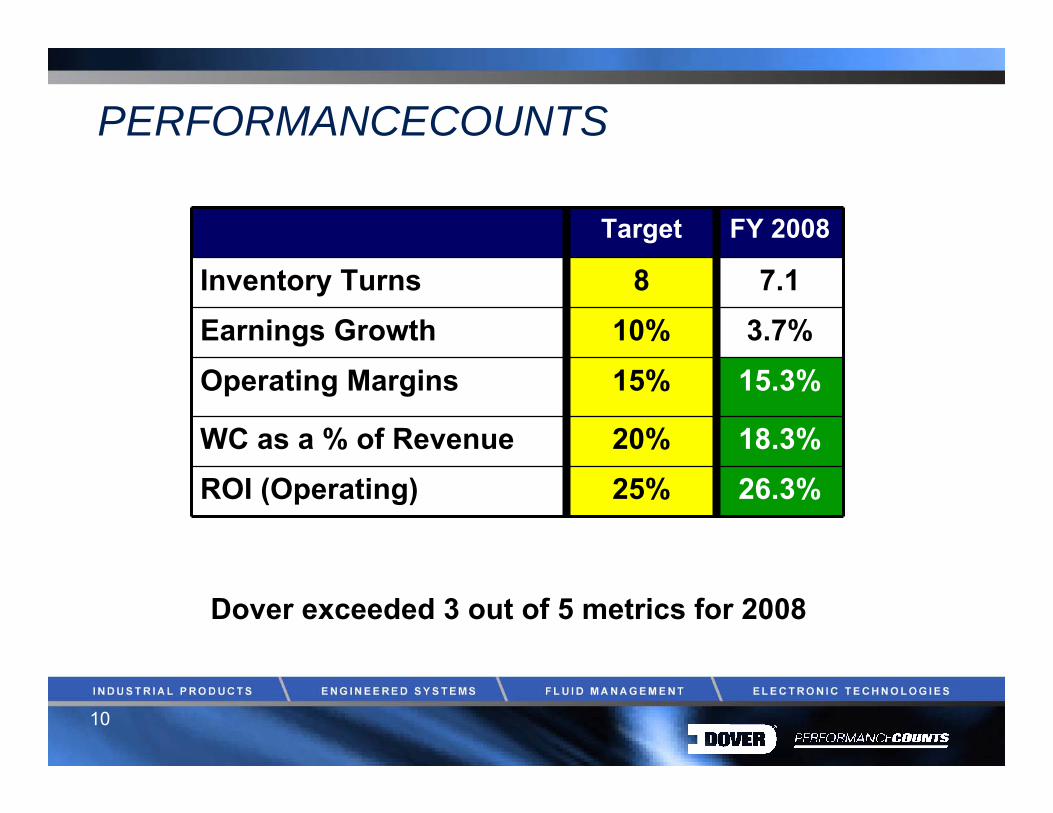
PERFORMANCECOUNTS
Target FY 2008
Inventory Turns 8 7.1Earnings Growth 10% 3.7%Operating Margins 15% 15.3%
WC as a % of Revenue 20% 18.3%ROI (Operating) 25% 26.3%
Dover exceeded 3 out of 5 metrics for 2008

11
2008 Overview• Free Cash Flow
– Fourth Quarter 2008: $227.9 million; 13.2% of revenue– Full Year 2008: $834.6 million; 11.0% of revenue – FCF to Net Earnings from Continuing Operations: 120.1%
• Net Debt to Capital Ratio– 24.9%: down 240 bps over prior year
Effective Tax Rate (ETR)– Fourth Quarter 2008: 21.4%, down 320 bps– Full Year 2008: 26.6%, consistent with 2007 and full-year guidance
• Acquisitions– Fourth Quarter 2008: One add-on for $3.9 million, net of cash acquired– Full Year 2008: Four add-ons totaling $103.8 million, net of cash acquired
• Dispositions– Fourth Quarter 2008: Sold of a line of business in the Electronic Technologies segment - $7.5 million gain – Full Year 2008: Finalized the sale of a previously discontinued business, adjusted the carrying value of a
discontinued business and recorded other adjustments for a net after-tax loss of $103.9 million in discontinued operations.
Share Repurchase Program – Full Year 2008: Repurchased 10 million shares on the open market for $462 million

12
Organizational ChangesNew senior leadership
Bob Livingston – President & CEO, 25 years at DoverSteve Sellhausen – VP Corporate Development, 20+ years experienceJay Kloosterboer – VP Human Resources, 20+ years experience
Evolving to a more center led cultureTalent and training initiatives
Formal internal talent development programsBroad management succession planning
Shared resourcesChina RHQGlobal treasury / tax / insurance / compliance
M & AValue creation focused through quicker, disciplined integration process
LOCAL MANAGEMENT STILL OWNS ALL CUSTOMER RELATIONSHIPS

13
Driving Synergy
4% 4% -- 6%6%EarningsEarnings
ImprovementImprovement
Overhead cost structureIdentify and eliminate excess capacity
Supply ChainLeverage the combined buying power of Dover across the wide array of direct and indirect costs
Shared facilitiesUtilize available capacity across company boundaries
Business system consolidations
$40 - $60 million target already achived
2008 2008 -- 20092009ORIGINALORIGINAL
GOALGOAL

Integration and Synergy Results• 2007-2008 programs
– Markem•Imaje – Norris•Alberta Oil Tool– Pump Solutions Group– Other opportunities identified
14
• 2008-2009 programs– ECT, DEK, OK International
back-office integration – MPG & CPG combination
FY 2008 Savings Incremental 2009 Savings

Synergy – The Next Step
• Global Procurement Initiative• Comprehensive review of supply chain
sourcing & spending• Data analysis & opportunity prioritization
phase virtually complete• Several projects already launched in 2009• Savings opportunity in 2010 – 2011
timeframe is $75 - $100 million
15
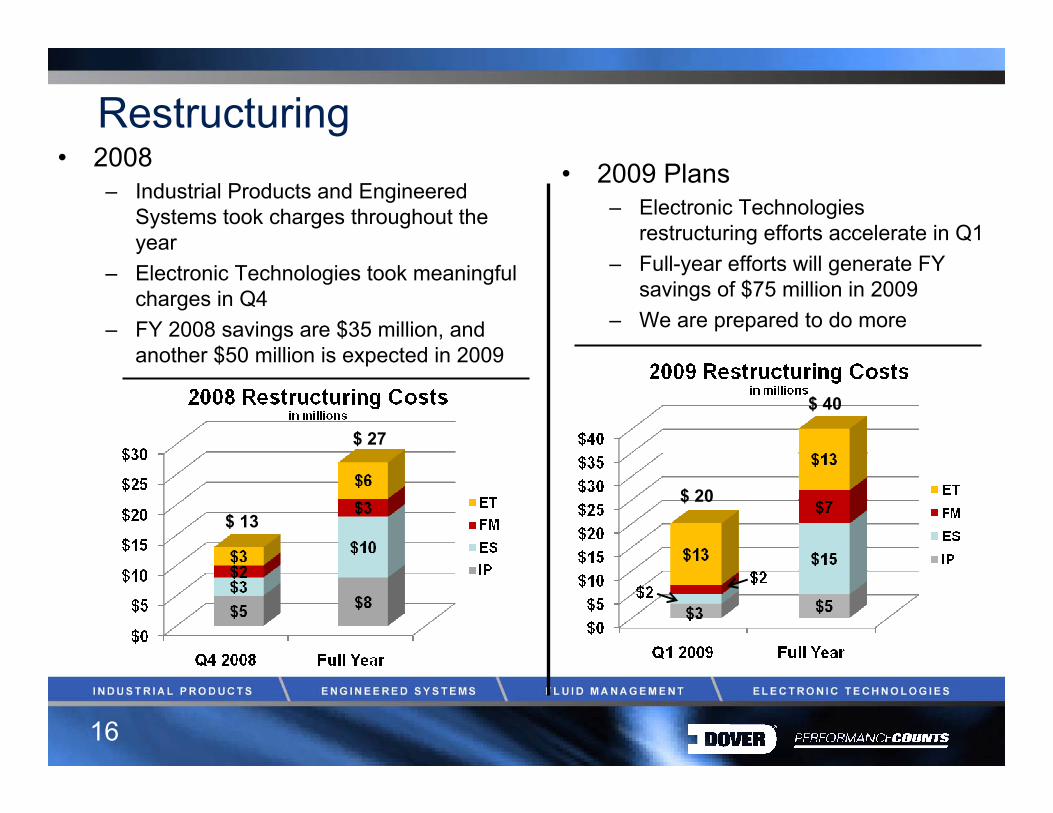
Restructuring• 2008
– Industrial Products and Engineered Systems took charges throughout the year
– Electronic Technologies took meaningful charges in Q4
– FY 2008 savings are $35 million, and another $50 million is expected in 2009
16
• 2009 Plans– Electronic Technologies
restructuring efforts accelerate in Q1– Full-year efforts will generate FY
savings of $75 million in 2009– We are prepared to do more
$ 13
$ 27
$ 20
$ 40
17
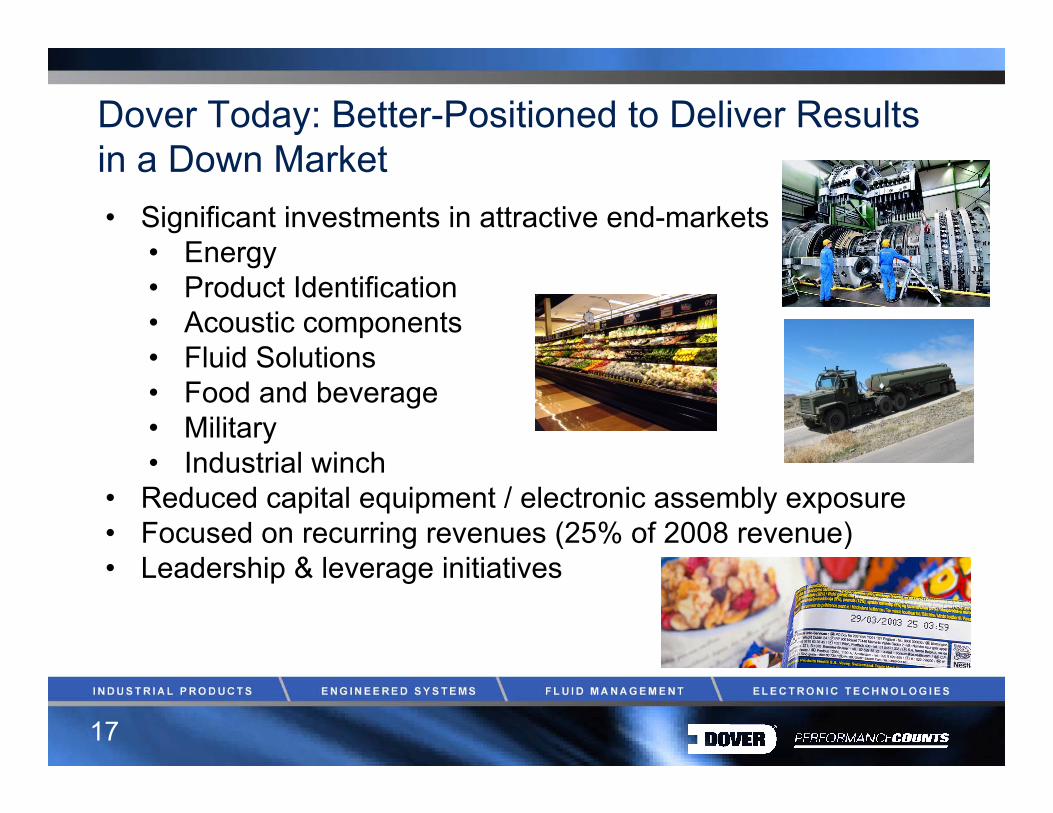
Dover Today: Better-Positioned to Deliver Results in a Down Market• Significant investments in attractive end-markets
• Energy• Product Identification• Acoustic components• Fluid Solutions• Food and beverage• Military• Industrial winch
• Reduced capital equipment / electronic assembly exposure• Focused on recurring revenues (25% of 2008 revenue)• Leadership & leverage initiatives

18
Strategic Capital AllocationAcquisitions– Strategic add-ons to bolster existing attractive platforms – Recent trends show evidence of moderating pricing– 2009 should favor well capitalized strategic buyers
Share Repurchase– Repurchased $1 billion over 2007 – 2008 timeframe
• Reduced share count 10%
– Standing authorization to repurchase 9 million shares
Dividend Policy– Increased 25% in 2008 ($1.00 per share on annualized basis)– 54 consecutive years of increasing annual dividend
We have the capacity to do all three
19
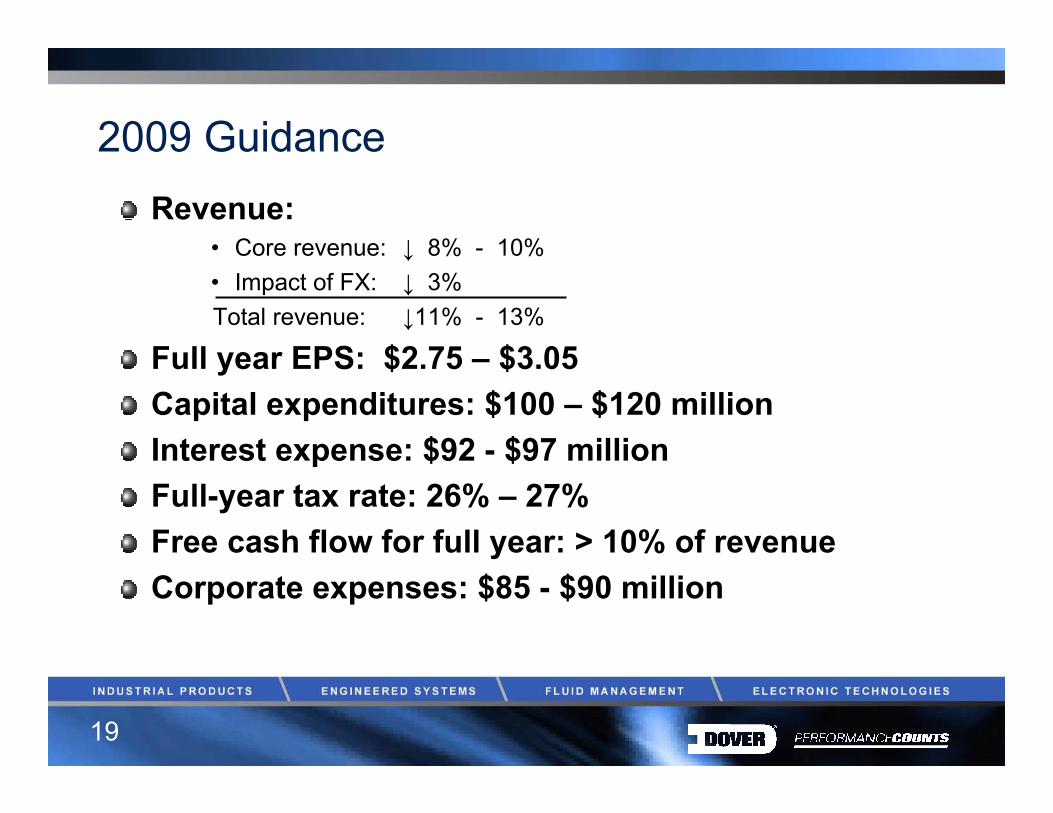
2009 GuidanceRevenue:
• Core revenue: ↓ 8% - 10%• Impact of FX: ↓ 3% Total revenue: ↓11% - 13%
Full year EPS: $2.75 – $3.05Capital expenditures: $100 – $120 millionInterest expense: $92 - $97 millionFull-year tax rate: 26% – 27%Free cash flow for full year: > 10% of revenueCorporate expenses: $85 - $90 million