Embed Size (px)
Citation preview
PCB Mass Loading Phase IIDover Power PlantSIRS ID: DE-0269Dover, Delaware
Appendix 10
DOVER POWER PLANTDOVER, DELAWARE
SIRS ID: DE-0269
PCB Mass Loading Phase IIDover Power PlantSIRS ID: DE-0269Dover, Delaware
File: 0985.69.51 Page 1 of 10 June 2015
GENERAL SITE INFORMATIONSite Name: Dover Power Plant
SIRS ID Number: DE-0269
Site Location and Description:
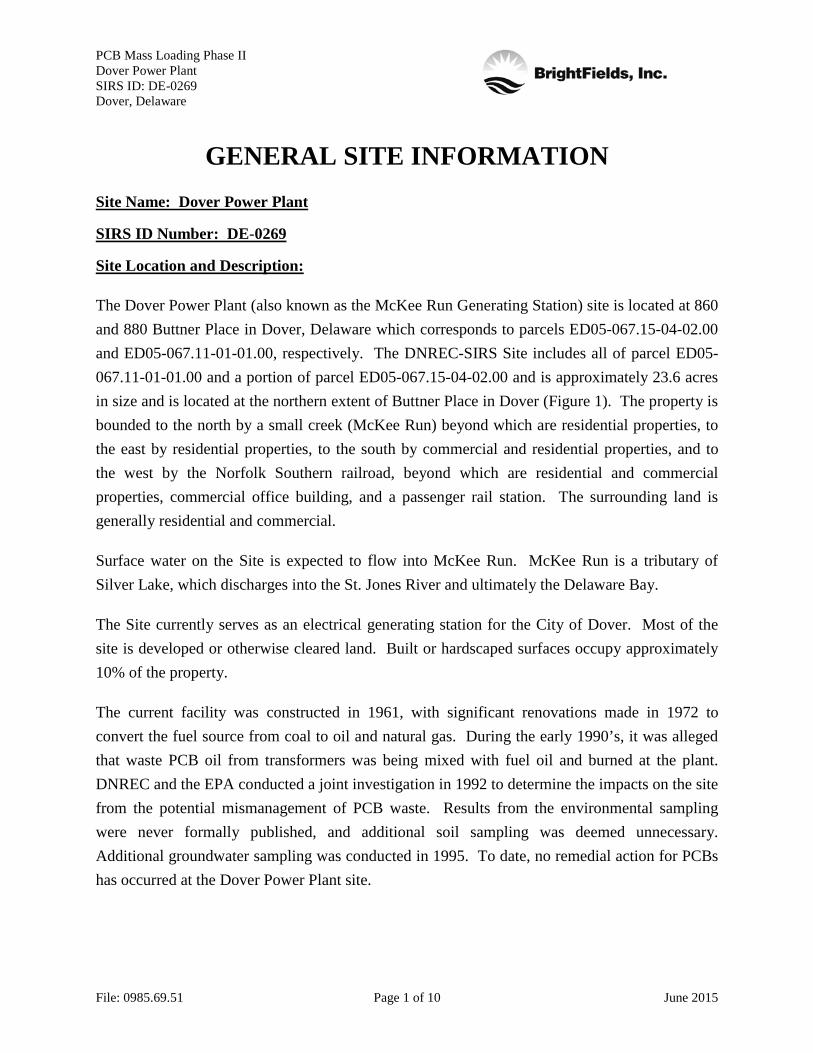
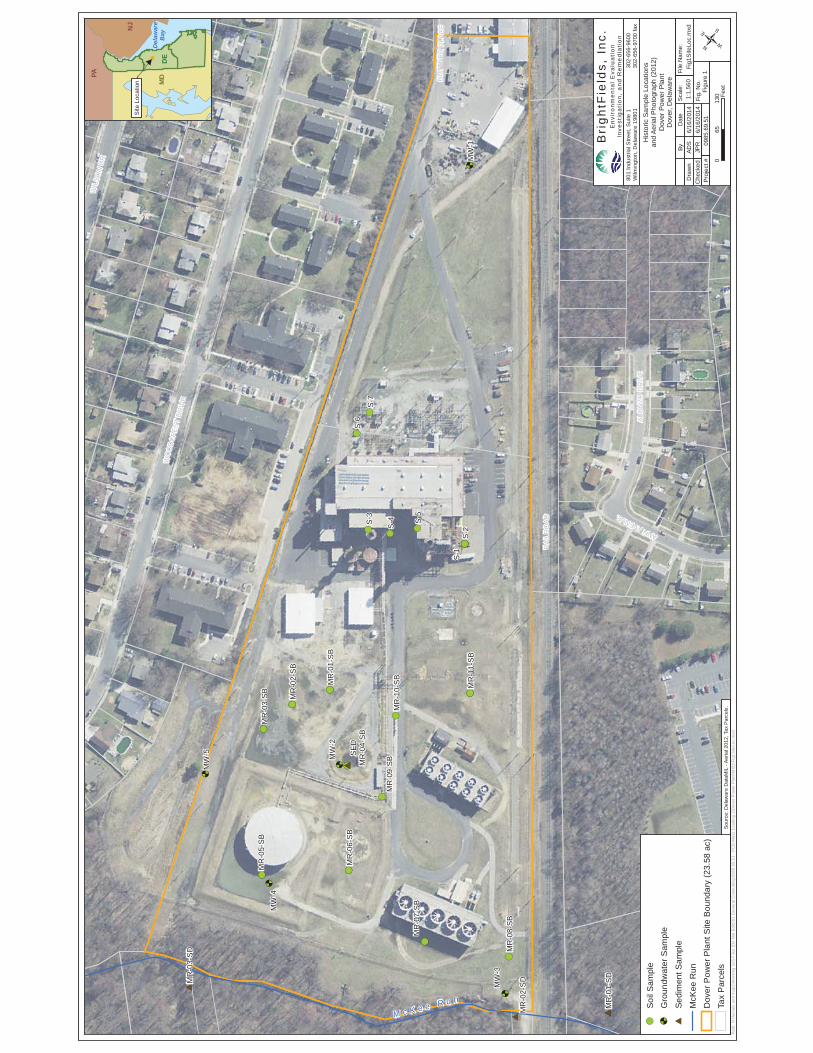
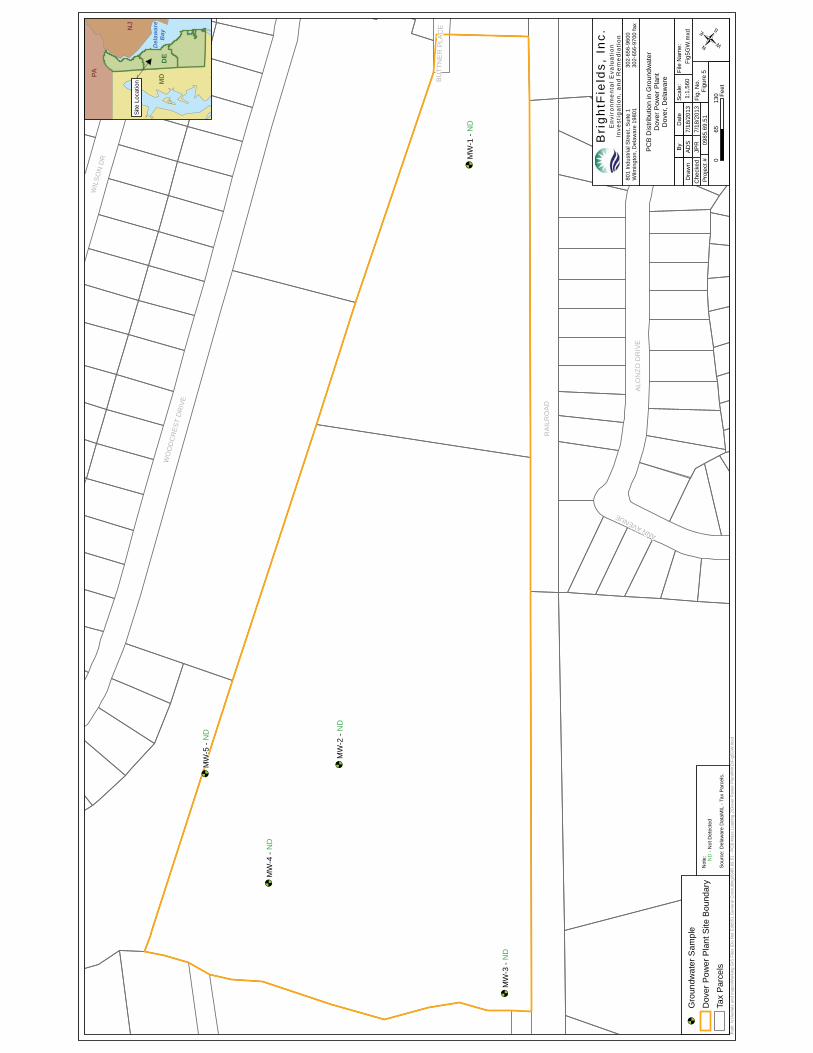
The Dover Power Plant (also known as the McKee Run Generating Station) site is located at 860and 880 Buttner Place in Dover, Delaware which corresponds to parcels ED05-067.15-04-02.00 and ED05-067.11-01-01.00, respectively. The DNREC-SIRS Site includes all of parcel ED05-067.11-01-01.00 and a portion of parcel ED05-067.15-04-02.00 and is approximately 23.6 acres in size and is located at the northern extent of Buttner Place in Dover (Figure 1). The property is bounded to the north by a small creek (McKee Run) beyond which are residential properties, to the east by residential properties, to the south by commercial and residential properties, and to the west by the Norfolk Southern railroad, beyond which are residential and commercial properties, commercial office building, and a passenger rail station. The surrounding land is generally residential and commercial.
Surface water on the Site is expected to flow into McKee Run. McKee Run is a tributary of Silver Lake, which discharges into the St. Jones River and ultimately the Delaware Bay.
The Site currently serves as an electrical generating station for the City of Dover. Most of the site is developed or otherwise cleared land. Built or hardscaped surfaces occupy approximately 10% of the property.
The current facility was constructed in 1961, with significant renovations made in 1972 to convert the fuel source from coal to oil and natural gas. During the early 1990’s, it was alleged that waste PCB oil from transformers was being mixed with fuel oil and burned at the plant. DNREC and the EPA conducted a joint investigation in 1992 to determine the impacts on the site from the potential mismanagement of PCB waste. Results from the environmental sampling were never formally published, and additional soil sampling was deemed unnecessary. Additional groundwater sampling was conducted in 1995. To date, no remedial action for PCBs has occurred at the Dover Power Plant site.
PCB Mass Loading Phase IIDover Power PlantSIRS ID: DE-0269Dover, Delaware
File: 0985.69.51 Page 2 of 10 June 2015
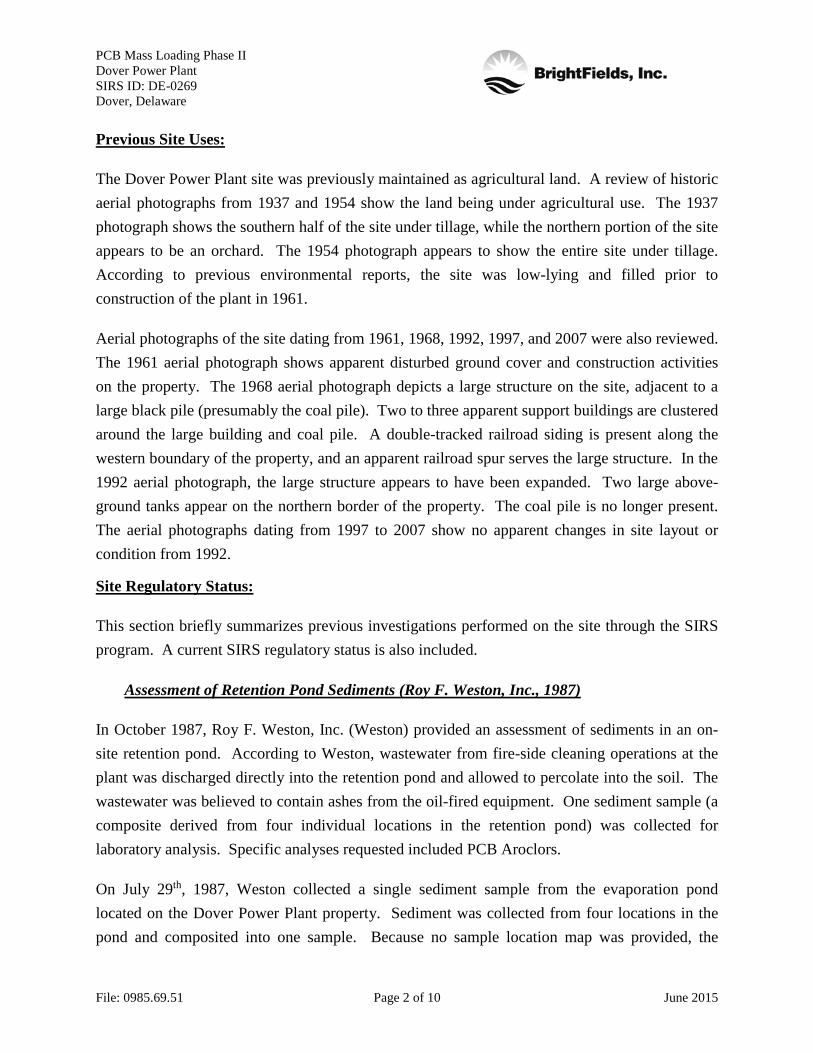
Previous Site Uses:
The Dover Power Plant site was previously maintained as agricultural land. A review of historic aerial photographs from 1937 and 1954 show the land being under agricultural use. The 1937 photograph shows the southern half of the site under tillage, while the northern portion of the site appears to be an orchard. The 1954 photograph appears to show the entire site under tillage. According to previous environmental reports, the site was low-lying and filled prior to construction of the plant in 1961.
Aerial photographs of the site dating from 1961, 1968, 1992, 1997, and 2007 were also reviewed. The 1961 aerial photograph shows apparent disturbed ground cover and construction activities on the property. The 1968 aerial photograph depicts a large structure on the site, adjacent to a large black pile (presumably the coal pile). Two to three apparent support buildings are clustered around the large building and coal pile. A double-tracked railroad siding is present along the western boundary of the property, and an apparent railroad spur serves the large structure. In the 1992 aerial photograph, the large structure appears to have been expanded. Two large above-ground tanks appear on the northern border of the property. The coal pile is no longer present. The aerial photographs dating from 1997 to 2007 show no apparent changes in site layout or condition from 1992.
Site Regulatory Status:
This section briefly summarizes previous investigations performed on the site through the SIRSprogram. A current SIRS regulatory status is also included.
Assessment of Retention Pond Sediments (Roy F. Weston, Inc., 1987)
In October 1987, Roy F. Weston, Inc. (Weston) provided an assessment of sediments in an on-site retention pond. According to Weston, wastewater from fire-side cleaning operations at the plant was discharged directly into the retention pond and allowed to percolate into the soil. The wastewater was believed to contain ashes from the oil-fired equipment. One sediment sample (a composite derived from four individual locations in the retention pond) was collected for laboratory analysis. Specific analyses requested included PCB Aroclors.
On July 29th, 1987, Weston collected a single sediment sample from the evaporation pond located on the Dover Power Plant property. Sediment was collected from four locations in the pond and composited into one sample. Because no sample location map was provided, the
PCB Mass Loading Phase IIDover Power PlantSIRS ID: DE-0269Dover, Delaware
File: 0985.69.51 Page 3 of 10 June 2015
sample location has been defined as in the approximate center of the evaporation pond sampled by Dynamac in 1992. No screening was conducted. The pesticide/PCB analysis indicated that the sediment sample did not contain PCBs above laboratory detection limits.
Site Visit Trip Report: Mckee Run Electric Generating Station (Dynamac Corporation, 1992)
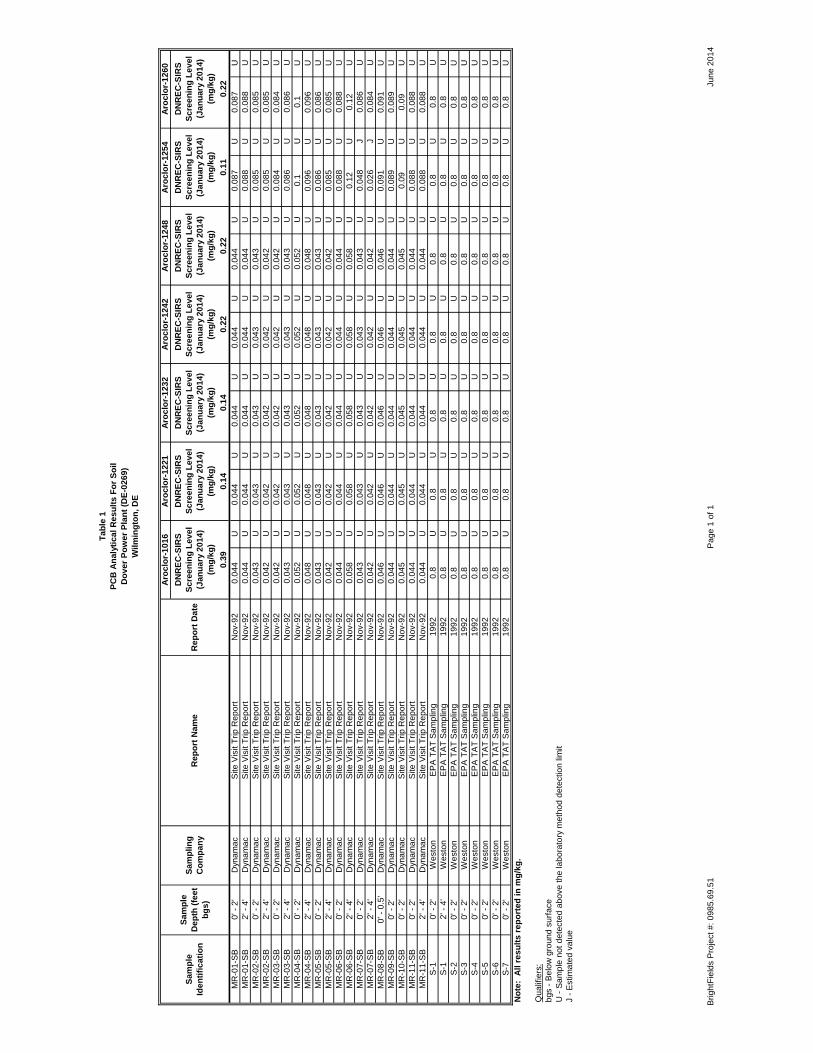
Dynamac was contracted by DNREC to assess and characterize contamination at the Dover Power Plant site. The alleged burning of PCB oil at the site gave cause for concern that PCB waste and other wastes may have been mismanaged or improperly disposed of at the site. Dynamac advanced eleven hand auger borings and collected 19 soil samples plus additional QA/QC samples. The pesticide/PCB analysis indicated that soil samples MR-07-SB (0 to 2 feet) and MR-07-SB (2 to 4 feet) contained PCBs (Aroclor 1254) at concentrations of 0.048 mg/kg and 0.026 mg/kg, respectively. Neither soil sample exceeds the 2013 DNREC screening level of 0.22 mg/kg for Aroclor 1254. All other soil samples collected by Dynamac did not contain PCBs above laboratory detection limits.
Dynamac also collected three sediment samples from McKee Run along the northern boundary of the site. The sediment samples were submitted for confirmatory PCB analysis but none of them contained PCBs above laboratory detection limits.
EPA Technical Assistance Team Sampling (Weston Inc., 1992)
In conjunction with the 1992 sampling conducted by Dynamac, Weston Inc. collected soil samples on behalf of the U.S. EPA. No formal report regarding this sampling event was available; individual documents (sample schedule, location maps, and analytical data) and discussion in the 1992 Dynamac report were used to provide context for the data. According to the above-mentioned 1992 Dynamac report, Weston conducted limited soil sampling in late October/early November 1992. Samples were analyzed for one or more of the following analytes: Pesticides, PCBs, pH, hexavalent chromium, volatile organic compounds, and dioxin.
A total of seven soil samples from six locations were collected at the Dover Power Plant site by Weston. Six of the seven samples were collected from surface soils (0 to 2 feet bgs), while the remaining sample was collected from the subsurface soil (2 to 4 feet bgs). It is unknown if screening for PCBs was conducted. All seven soil samples were submitted for laboratory
PCB Mass Loading Phase IIDover Power PlantSIRS ID: DE-0269Dover, Delaware
File: 0985.69.51 Page 4 of 10 June 2015
analysis. The PCB analysis indicated that none of the soil samples contained PCBs above laboratory detection limits.
Plant Personnel Sampling Event (1992)
A letter addressed to DNREC on November 16, 1992 from a representative of the Dover Power Plant indicated that soil samples were collected by plant personnel and analyzed for PCBs. Attached to the letter was a partial laboratory package for samples collected from seven locations “under Unit 1 near the ash hoppers and F.D. fan.” The PCB analysis indicated that soil sample #3 contained Aroclor 1254 at a concentration of 1 mg/kg, which exceeds the DNREC 2013 screening level of 0.22 mg/kg for Aroclor 1254. None of the other soil samples contained PCBs above laboratory detection limits. Due to the fact that the partial lab package and letter do not contain a spatial reference, and that no specific sampling methodology was identified, the data from this sampling event was not evaluated further during the PCB mass loading study.
McKee Run Power Plant Investigation (DNREC, 1992-1993)
DNREC conducted a five phase investigation to address concerns regarding the operation of the power plant. In Phase 1, DNREC concluded that the operating procedures at the time were not posing risks for human health or the environment. The City of Dover had plans to reduce soot issues through fly ash reinjection systems and switching the fuel to 1% number 6 oil, both which would also reduce acidic emissions. During Phase 2, investigation of past operating procedures did not reveal risks to human health and environment except for those who eat fish from the St. Jones River over a long time frame. In Phase 3, there were no instances of quantities of toxics that were released to residents living nearby the plant which would have caused significant health risks. DNREC also believed that plant workers were not exposed to quantities that would cause health risks, but there is uncertainty regarding exposure to PCB-contaminated waste oil.After consulting with the US Department of Health and EPA during Phase 4, DNREC and the Division of Public Health concluded that no actions were necessary for those who were exposed to health risks. However, they suggested a fish advisory and medical monitoring of plant workers. Lastly, Phase 5 looked into whether or not any of the operating procedures were illegal. Since the actions occurred more than two years prior to the investigation, DNREC did not have power to charge responsible individuals and therefore did not take any action.
PCB Mass Loading Phase IIDover Power PlantSIRS ID: DE-0269Dover, Delaware
File: 0985.69.51 Page 5 of 10 June 2015
Ground Water Sampling: Environmental Investigation Report (James C. Anderson Associates, 1995)
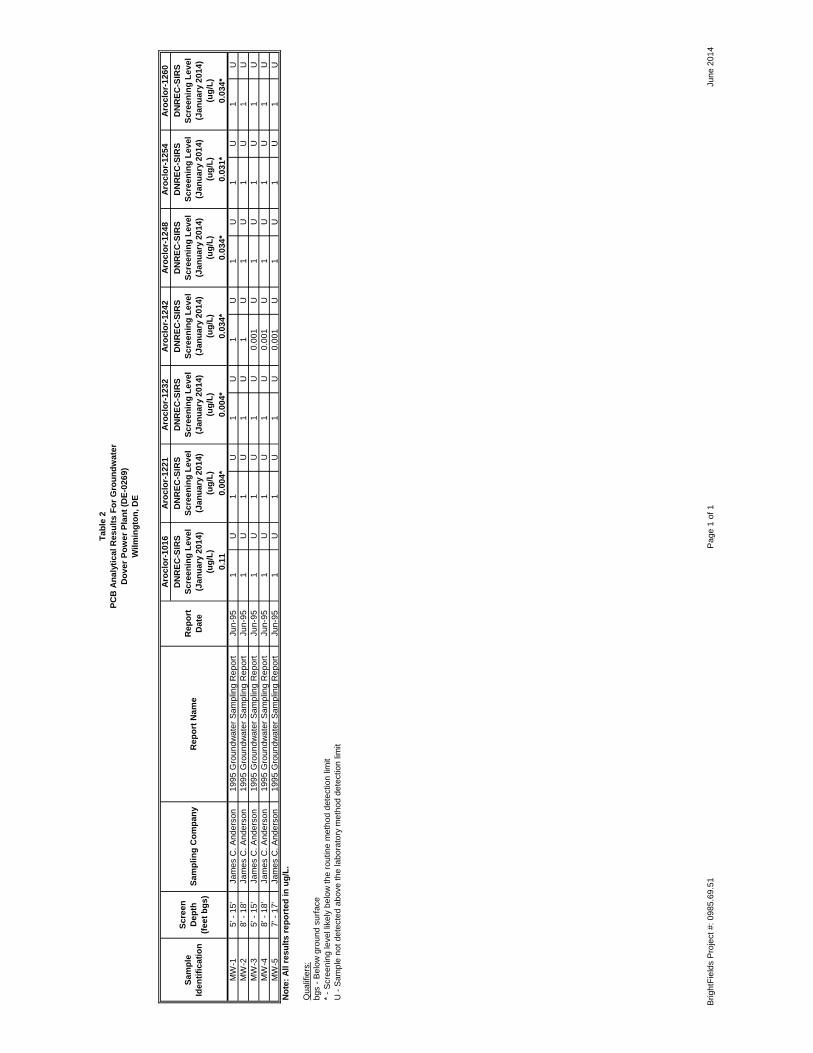
James C. Anderson Associates (JCA) prepared a report detailing additional groundwater sampling at the Dover Power Plant. The sampling was designed to determine if shallow groundwater had been impacted by any releases or alleged mismanagement/disposal of wastes at the Dover Power Plant. JCA installed five new monitoring wells on the Dover Power Plant site. Soil samples were collected with a split-spoon auger; however, the soil was field screened for VOCs only. With the exception of monitoring well MW-4 (for which no log was available) the well screen was installed from 5 to 20 feet below ground surface. Five groundwater samples were collected using low-flow sampling techniques and dedicated in-line filters. All groundwater samples were submitted for PCB Aroclor analysis, which indicated that none of the samples contained PCBs above laboratory detection limits.
Current Regulatory Status:
DNREC identified the Dover Power Plant in a letter to the City of Dover dated February 20, 1996 as requiring “no further investigation.” To date, no remedial action targeting PCBs hasoccurred on the site, nor been recommended.
PCB Mass Loading Phase IIDover Power PlantSIRS ID: DE-0269Dover, Delaware
File: 0985.69.51 Page 6 of 10 June 2015
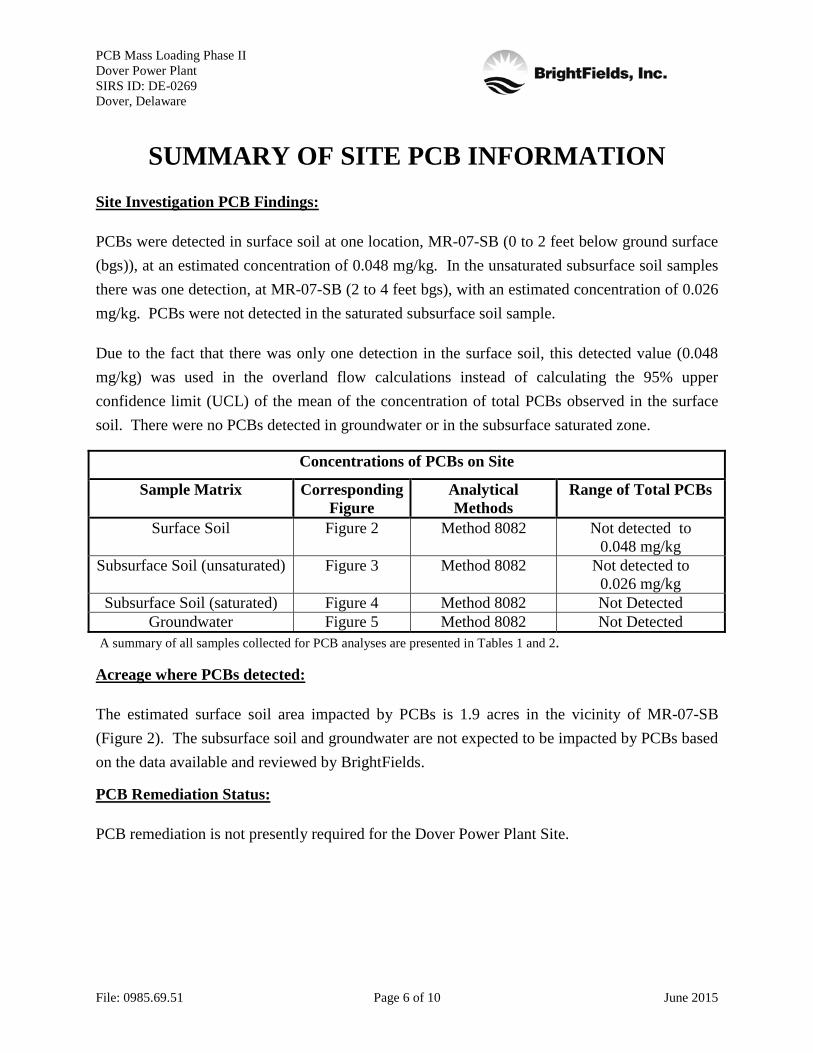
SUMMARY OF SITE PCB INFORMATIONSite Investigation PCB Findings:
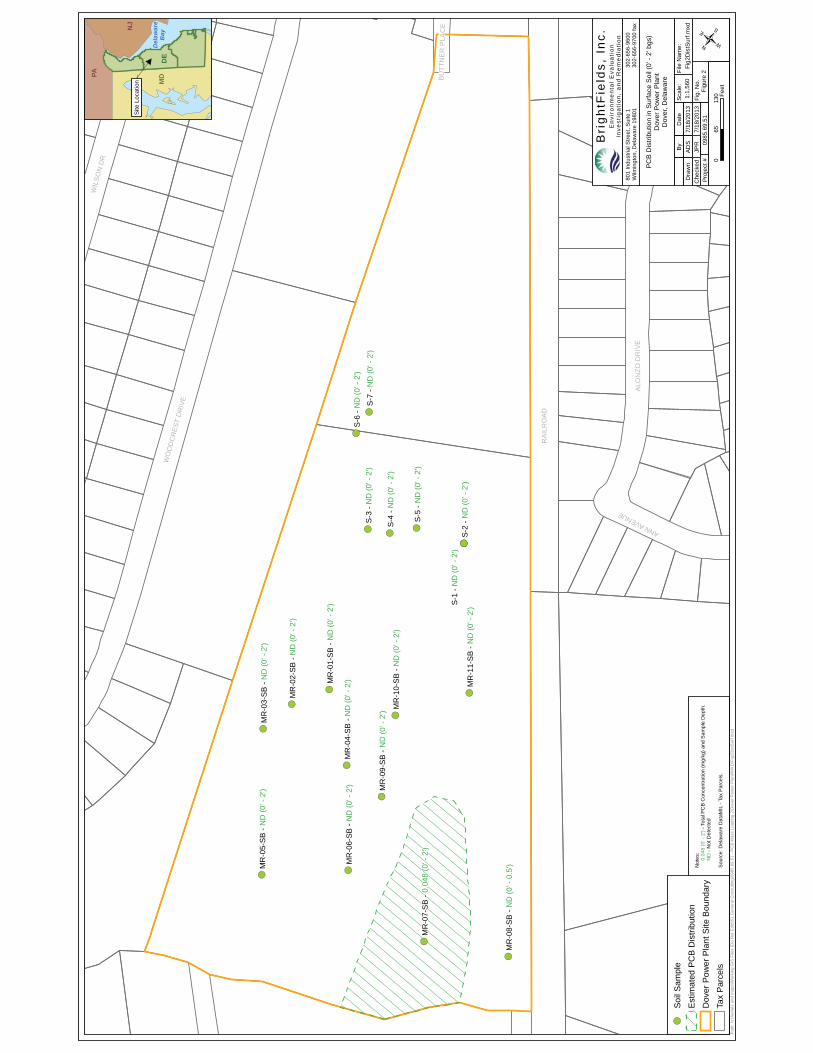
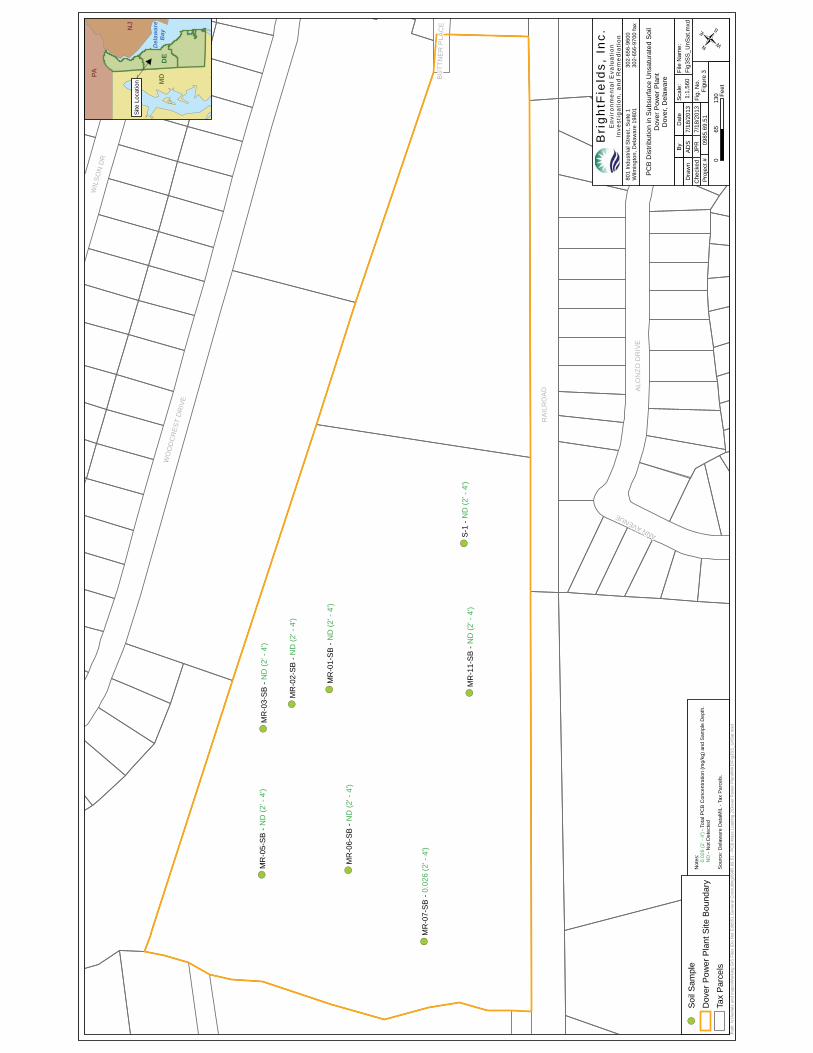
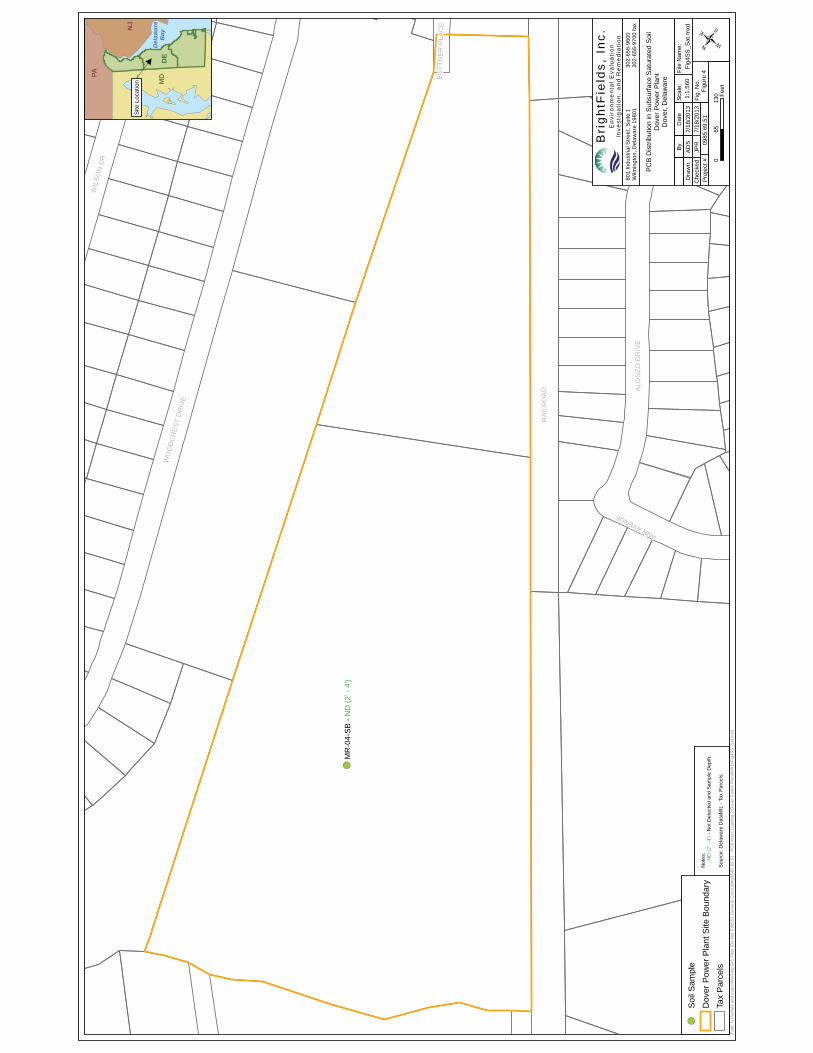
PCBs were detected in surface soil at one location, MR-07-SB (0 to 2 feet below ground surface (bgs)), at an estimated concentration of 0.048 mg/kg. In the unsaturated subsurface soil samplesthere was one detection, at MR-07-SB (2 to 4 feet bgs), with an estimated concentration of 0.026 mg/kg. PCBs were not detected in the saturated subsurface soil sample.
Due to the fact that there was only one detection in the surface soil, this detected value (0.048 mg/kg) was used in the overland flow calculations instead of calculating the 95% upper confidence limit (UCL) of the mean of the concentration of total PCBs observed in the surface soil. There were no PCBs detected in groundwater or in the subsurface saturated zone.
Concentrations of PCBs on Site
Sample Matrix CorrespondingFigure
Analytical Methods
Range of Total PCBs
Surface Soil Figure 2 Method 8082 Not detected to 0.048 mg/kg
Subsurface Soil (unsaturated) Figure 3 Method 8082 Not detected to 0.026 mg/kg
Subsurface Soil (saturated) Figure 4 Method 8082 Not DetectedGroundwater Figure 5 Method 8082 Not Detected
A summary of all samples collected for PCB analyses are presented in Tables 1 and 2.
Acreage where PCBs detected:
The estimated surface soil area impacted by PCBs is 1.9 acres in the vicinity of MR-07-SB (Figure 2). The subsurface soil and groundwater are not expected to be impacted by PCBs based on the data available and reviewed by BrightFields.
PCB Remediation Status:
PCB remediation is not presently required for the Dover Power Plant Site.
PCB Mass Loading Phase IIDover Power PlantSIRS ID: DE-0269Dover, Delaware
File: 0985.69.51 Page 7 of 10 June 2015
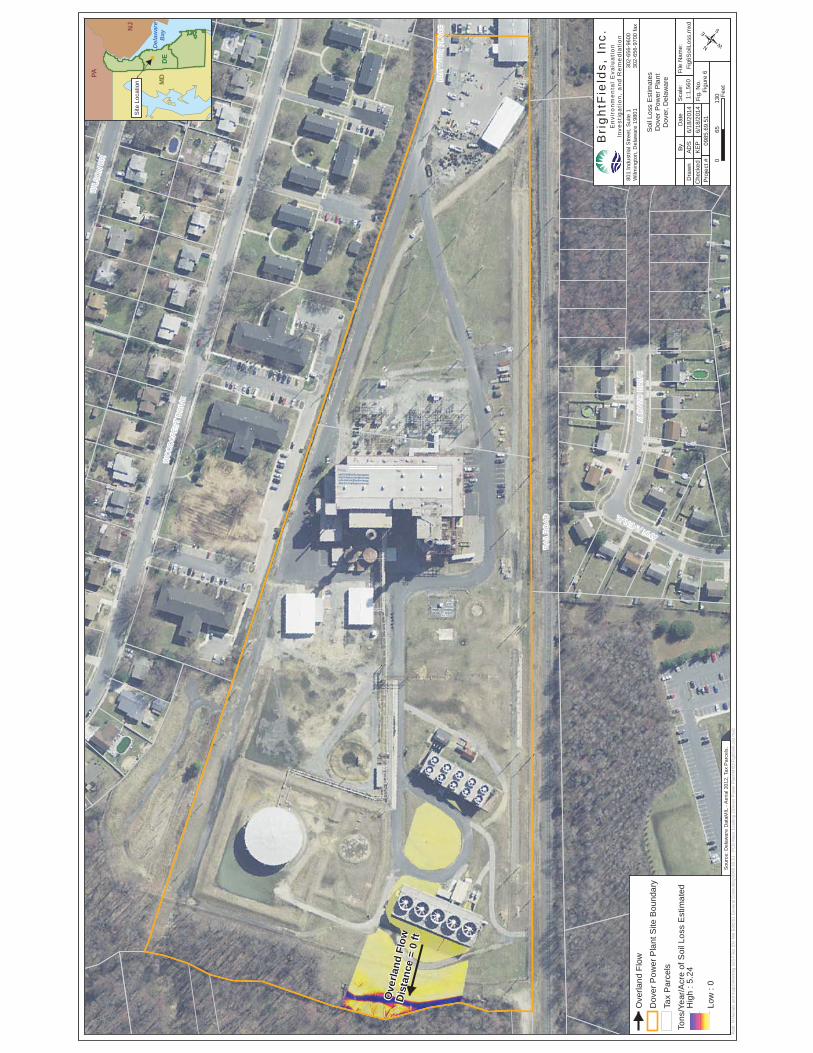
PCB MASS LOADING SUMMARYThe PCB mass loading rate to surface water via overland flow was estimated for the Dover Power Plant Property. There were no reported concentrations of PCBs in the subsurface saturated zone or in the groundwater; therefore, groundwater transport cannot be evaluated as a mechanism of transport for PCBs at the Property. A summary of the results is included below and the details of the calculations are included as attachments to this Appendix.
Overland Flow:
Overland flow has been determined on this site by using the Revised Universal Soil Loss Equation (RUSLE). The RUSLE predicts the long term average annual rate of erosion on an area based on rainfall patterns, soil type, topography, cover/canopy factors and support management practices. These specific factors are site specific and rely on local information of the site. A breakdown of the individual factors is presented below with a brief explanation of their choice.
Ground Cover and Canopy:
The surface cover and flow paths were assessed through aerial photography and available contour mapping (Delaware Data Mil, 2007). The cover/management factor (C) assigned to the erodible area and associated flow paths is 0.003, which corresponds to areas utilizing avegetative cover primarily consisting of grass or grass like plants with greater than 95% coveragein pervious areas.
Site Sediment and Erosion Control Practices:
Based on the aerial photography evaluation and review of site documents it does not appear that any sediment and erosion control practices are being implemented on Site.
Input Factors and Results:
A breakdown of the individual factors is presented below with a brief explanation of their choice.
PCB Mass Loading Phase IIDover Power PlantSIRS ID: DE-0269Dover, Delaware
File: 0985.69.51 Page 8 of 10 June 2015
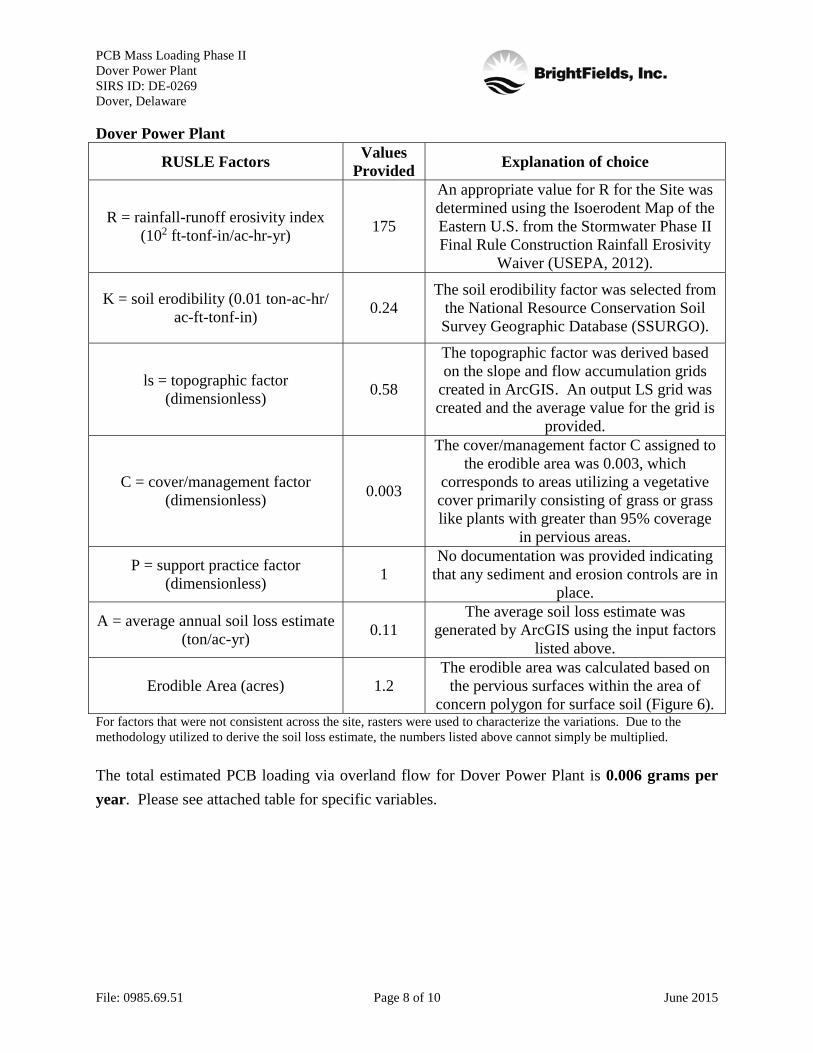
Dover Power Plant
RUSLE Factors Values Provided Explanation of choice
R = rainfall-runoff erosivity index (102 ft-tonf-in/ac-hr-yr) 175
An appropriate value for R for the Site was determined using the Isoerodent Map of the Eastern U.S. from the Stormwater Phase II Final Rule Construction Rainfall Erosivity
Waiver (USEPA, 2012).
K = soil erodibility (0.01 ton-ac-hr/ac-ft-tonf-in) 0.24
The soil erodibility factor was selected fromthe National Resource Conservation Soil Survey Geographic Database (SSURGO).
ls = topographic factor (dimensionless) 0.58
The topographic factor was derived based on the slope and flow accumulation grids
created in ArcGIS. An output LS grid was created and the average value for the grid is
provided.
C = cover/management factor (dimensionless) 0.003
The cover/management factor C assigned to the erodible area was 0.003, which
corresponds to areas utilizing a vegetative cover primarily consisting of grass or grass like plants with greater than 95% coverage
in pervious areas.
P = support practice factor(dimensionless) 1
No documentation was provided indicating that any sediment and erosion controls are in
place.
A = average annual soil loss estimate(ton/ac-yr) 0.11
The average soil loss estimate was generated by ArcGIS using the input factors
listed above.
Erodible Area (acres) 1.2The erodible area was calculated based on
the pervious surfaces within the area of concern polygon for surface soil (Figure 6).
For factors that were not consistent across the site, rasters were used to characterize the variations. Due to the methodology utilized to derive the soil loss estimate, the numbers listed above cannot simply be multiplied.
The total estimated PCB loading via overland flow for Dover Power Plant is 0.006 grams per year. Please see attached table for specific variables.
PCB Mass Loading Phase IIDover Power PlantSIRS ID: DE-0269Dover, Delaware
File: 0985.69.51 Page 9 of 10 June 2015
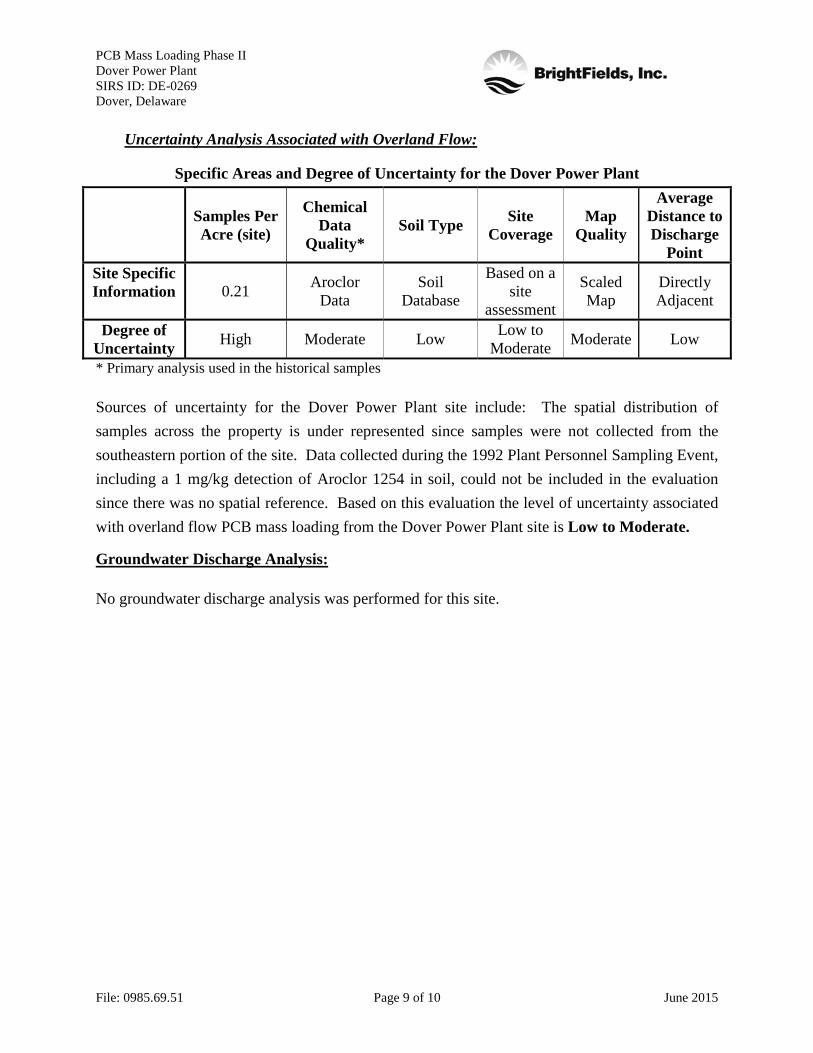
Uncertainty Analysis Associated with Overland Flow:
Specific Areas and Degree of Uncertainty for the Dover Power Plant
* Primary analysis used in the historical samples
Sources of uncertainty for the Dover Power Plant site include: The spatial distribution of samples across the property is under represented since samples were not collected from the southeastern portion of the site. Data collected during the 1992 Plant Personnel Sampling Event,including a 1 mg/kg detection of Aroclor 1254 in soil, could not be included in the evaluationsince there was no spatial reference. Based on this evaluation the level of uncertainty associated with overland flow PCB mass loading from the Dover Power Plant site is Low to Moderate.
Groundwater Discharge Analysis:
No groundwater discharge analysis was performed for this site.
Samples Per Acre (site)
Chemical Data
Quality*Soil Type Site
CoverageMap
Quality
Average Distance to Discharge
PointSite Specific Information 0.21 Aroclor
DataSoil
Database
Based on a site
assessment
Scaled Map
Directly Adjacent
Degree of Uncertainty High Moderate Low Low to
Moderate Moderate Low
PCB Mass Loading Phase IIDover Power PlantSIRS ID: DE-0269Dover, Delaware
File: 0985.69.51 Page 10 of 10 June 2015
Site References:
1993, Update on McKee Run Power Plant Investigation, February 1993.
Robert Clausen to DNREC, Letter to Mr, John Morhman, Program Manager, DNREC,November 1992.
Delaware Geological Survey, 2013, Delaware Data Mil,<http://datamil.delaware.gov/geonetwork/srv/en/main.home>, May 2013.
Delaware Department of Natural Resources and Environmental Control (DNREC), 1995,Groundwater Sampling: Environmental Investigation Report: McKee Run Generating Station,June 1995.
Dynamac Corporation, 1992, Site Visit Trip Report for the McKee Run Generating Station,November 1992.
James C. Anderson Associates, Inc., 1995, Groundwater Sampling, Environmental Investigation Report, McKee Run Power Plant, June 1995.
Roy F. Weston, Inc., 1987, Assessment of Retention Pond Sediments, October 1987.

PCB Mass Loading Phase IIDover Power PlantSIRS ID: DE-0269Dover, Delaware
Figures
! (
! (
! (
! (
! (
! (
! (
! (
! (
! (
! (
! (
! (
! (
! (
! (
! (
! (
# *# *
# *
&<
&<
&<
&<
&<
! (! (! (
! ( ! (
! (
! (
! (
! (
# *
WO
OD
CR
EST
DR
IVE
WIL
SON
DR
ALO
NZO
DR
IVE
ANNAVENUE
BU
TTN
ER
PL A
CE
VIR
GIN
IAA
VEN
U
RA
ILR
OA
D
S-7
S-6
S-5
S-4S-3
S-2
S-1
MW
-5
MW
-4
MW
-3
MW
-2
MW
-1
MR
-01-
SB
MR
-03-
SD
MR
-02-
SD
MR
-01-
SD
MR
-11-
SB
MR
-10-
SB
MR
-09-
SB
MR
-08-
SB
MR
-07-
SB
MR
-06-
SB
MR
-05-
SB
SE
DM
R-0
4-S
B
MR
-03-
SB
MR
-02-
SB
M c K e e R u n
Path
: N:\A
eria
ls a
nd m
aps\
Wor
king
GIS
File
s (D
o N
ot E
dit)\
51 G
ener
al C
onsu
lting
\098
5.69
.51
- PC
B M
ass
Load
ing
2\D
over
Pow
er P
lant
\MX
D\F
ig1S
iteLo
c.m
xd
Bri
gh
tFie
lds,
In
c.E
nvi
ronm
enta
l E
valu
atio
nIn
vest
igat
ion,
and
Re
me
diat
ion
801
Indu
stria
l Stre
et, S
uite
1W
ilmin
gton
, Del
awar
e 19
801
302-
656-
9600
302-
656-
9700
fax
His
toric
Sam
ple
Loca
tions
and
Aer
ial P
hoto
grap
h (2
012)
Dov
er P
ower
Pla
ntD
over
, Del
awar
eBy
Dra
wn
Che
cked
Dat
e
Proj
ect #
Scal
e:Fi
le N
ame:
Fig.
No.
ADS
JPR 09
85.6
9.51
Figu
re 1
065
130 Fe
et
Fig1
Site
Loc.
mxd
Del
awar
eB
ayM
DD
E
NJ
Site
Loc
atio
n
PA
/
6/16
/201
46/
16/2
014
1:1,
560
Sour
ce: D
elaw
are
Dat
aMIL
- A
eria
l 201
2, T
ax P
arce
ls.
! (So
il S
ampl
e
&<G
roun
dwat
er S
ampl
e# *
Sedi
men
t Sam
ple
McK
ee R
unD
over
Pow
er P
lant
Site
Bou
ndar
y (2
3.58
ac)
Tax
Par
cels
! (
! (
! (
! (
! (
! (
! (
! (
! (
! (! (! (
! ( ! (
! (
! (
! (
! (
WO
OD
CR
EST
DR
IVE
WIL
SON
DR
ALO
NZO
DR
IVE
ANN AVENUE
BU
TTN
ER
PLA
CE
VIR
GIN
IA A
VEN
RA
ILR
OA
D
S-7
- N
D (0
' - 2
')
S-6
- N
D (0
' - 2
')
S-5
- N
D (0
' - 2
')
S-4
- N
D (0
' - 2
')
S-3
- N
D (0
' - 2
')
S-2
- N
D (0
' - 2
')S
-1 -
ND
(0' -
2')
MR
-01-
SB
- N
D (0
' - 2
')
MR
-11-
SB
- N
D (0
' - 2
')
MR
-10-
SB
- N
D (0
' - 2
')
MR
-09-
SB
- N
D (0
' - 2
')
MR
-06-
SB
- N
D (0
' - 2
')
MR
-05-
SB
- N
D (0
' - 2
')
MR
-04-
SB
- N
D (0
' - 2
')
MR
-03-
SB
- N
D (0
' - 2
')
MR
-02-
SB
- N
D (0
' - 2
')
MR
-08-
SB
- N
D (0
' - 0
.5')
MR
-07-
SB
- 0.
048
(0' -
2')
Path
: N:\A
eria
ls a
nd m
aps\
Wor
king
GIS
File
s (D
o N
ot E
dit)\
51 G
ener
al C
onsu
lting
\098
5.69
.51
- PC
B M
ass
Load
ing
2\D
over
Pow
er P
lant
\MX
D\F
ig2D
istS
urf.m
xd
Bri
gh
tFie
lds,
In
c.E
nvi
ron
me
nta
l E
valu
ati
on
Inve
stig
atio
n, a
nd
Re
me
dia
tio
n80
1 In
dust
rial S
treet
, Sui
te 1
Wilm
ingt
on, D
elaw
are
1980
130
2-65
6-96
0030
2-65
6-97
00 fa
x
PC
B D
istri
butio
n in
Sur
face
Soi
l (0'
- 2'
bgs
)D
over
Pow
er P
lant
Dov
er, D
elaw
are
ByD
raw
nC
heck
ed
Dat
e
Proj
ect #
Scal
e:Fi
le N
ame:
Fig.
No.
ADS
JPR 09
85.6
9.51
Figu
re 2
065
130 Fe
et
Fig2
Dis
tSur
f.mxd
Del
awar
eB
ayM
DD
E
NJ
Site
Loc
atio
n
PA
/
7/18
/201
37/
18/2
013
1:1,
560
Not
es:
0
.048
(0' -
2')
- Tot
al P
CB
Con
cent
ratio
n (m
g/kg
) and
Sam
ple
Dep
th.
N
D -
Not
Det
ecte
d
Sou
rce:
Del
awar
e D
ataM
IL -
Tax
Par
cels
.
! (So
il S
ampl
eE
stim
ated
PC
B D
istri
butio
nD
over
Pow
er P
lant
Site
Bou
ndar
yTa
x Pa
rcel
s
! (
! (
! (! (
! (
! (
! (! (
WO
OD
CR
EST
DR
IVE
WIL
SON
DR
ALO
NZO
DR
IVE
ANN AVENUE
BU
TTN
ER
PLA
CE
VIR
GIN
IA A
VEN
RA
ILR
OA
D
S-1
- N
D (2
' - 4
')M
R-1
1-S
B -
ND
(2' -
4')
MR
-06-
SB
- N
D (2
' - 4
')
MR
-05-
SB
- N
D (2
' - 4
')M
R-0
3-S
B -
ND
(2' -
4')
MR
-02-
SB
- N
D (2
' - 4
')
MR
-01-
SB
- N
D (2
' - 4
')
MR
-07-
SB
- 0.
026
(2' -
4')
Path
: N:\A
eria
ls a
nd m
aps\
Wor
king
GIS
File
s (D
o N
ot E
dit)\
51 G
ener
al C
onsu
lting
\098
5.69
.51
- PC
B M
ass
Load
ing
2\D
over
Pow
er P
lant
\MX
D\F
ig3S
S_U
nSat
.mxd
Bri
gh
tFie
lds,
In
c.E
nvi
ron
me
nta
l E
valu
ati
on
Inve
stig
atio
n, a
nd
Re
me
dia
tio
n80
1 In
dust
rial S
treet
, Sui
te 1
Wilm
ingt
on, D
elaw
are
1980
130
2-65
6-96
0030
2-65
6-97
00 fa
x
PC
B D
istri
butio
n in
Sub
surfa
ce U
nsat
urat
ed S
oil
Dov
er P
ower
Pla
ntD
over
, Del
awar
e
ByD
raw
nC
heck
ed
Dat
e
Proj
ect #
Scal
e:Fi
le N
ame:
Fig.
No.
ADS
JPR 09
85.6
9.51
Figu
re 3
065
130 Fe
et
Fig3
SS
_UnS
at.m
xd
Del
awar
eB
ayM
DD
E
NJ
Site
Loc
atio
n
PA
/
7/18
/201
37/
18/2
013
1:1,
560
Not
es:
0
.026
(2' -
4')
- Tot
al P
CB
Con
cent
ratio
n (m
g/kg
) and
Sam
ple
Dep
th.
N
D -
Not
Det
ecte
d
Sou
rce:
Del
awar
e D
ataM
IL -
Tax
Par
cels
.
! (So
il S
ampl
eD
over
Pow
er P
lant
Site
Bou
ndar
yTa
x Pa
rcel
s
! (
WO
OD
CR
EST
DR
IVE
WIL
SON
DR
ALO
NZO
DR
IVE
ANN AVENUE
BU
TTN
ER
PLA
CE
VIR
GIN
IA A
VEN
RA
ILR
OA
D
MR
-04-
SB
- N
D (2
' - 4
')
Path
: N:\A
eria
ls a
nd m
aps\
Wor
king
GIS
File
s (D
o N
ot E
dit)\
51 G
ener
al C
onsu
lting
\098
5.69
.51
- PC
B M
ass
Load
ing
2\D
over
Pow
er P
lant
\MX
D\F
ig4S
S_S
at.m
xd
Bri
gh
tFie
lds,
In
c.E
nvi
ron
me
nta
l E
valu
ati
on
Inve
stig
atio
n, a
nd
Re
me
dia
tio
n80
1 In
dust
rial S
treet
, Sui
te 1
Wilm
ingt
on, D
elaw
are
1980
130
2-65
6-96
0030
2-65
6-97
00 fa
x
PC
B D
istri
butio
n in
Sub
surfa
ce S
atur
ated
Soi
lD
over
Pow
er P
lant
Dov
er, D
elaw
are
ByD
raw
nC
heck
ed
Dat
e
Proj
ect #
Scal
e:Fi
le N
ame:
Fig.
No.
ADS
JPR 09
85.6
9.51
Figu
re 4
065
130 Fe
et
Fig4
SS
_Sat
.mxd
Del
awar
eB
ayM
DD
E
NJ
Site
Loc
atio
n
PA
/
7/18
/201
37/
18/2
013
1:1,
560
Not
es:
N
D (2
' - 4
') - N
ot D
etec
ted
and
Sam
ple
Dep
th.
Sou
rce:
Del
awar
e D
ataM
IL -
Tax
Par
cels
.
! (So
il S
ampl
eD
over
Pow
er P
lant
Site
Bou
ndar
yTa
x Pa
rcel
s
&<
&<
&<
&<
&<
WO
OD
CR
EST
DR
IVE
WIL
SON
DR
ALO
NZO
DR
IVE
ANN AVENUE
BU
TTN
ER
PLA
CE
VIR
GIN
IA A
VEN
RA
ILR
OA
D
MW
-5 -
ND
MW
-4 -
ND
MW
-3 -
ND
MW
-2 -
ND
MW
-1 -
ND
Path
: N:\A
eria
ls a
nd m
aps\
Wor
king
GIS
File
s (D
o N
ot E
dit)\
51 G
ener
al C
onsu
lting
\098
5.69
.51
- PC
B M
ass
Load
ing
2\D
over
Pow
er P
lant
\MX
D\F
ig5G
W.m
xd
Bri
gh
tFie
lds,
In
c.E
nvi
ron
me
nta
l E
valu
ati
on
Inve
stig
atio
n, a
nd
Re
me
dia
tio
n80
1 In
dust
rial S
treet
, Sui
te 1
Wilm
ingt
on, D
elaw
are
1980
130
2-65
6-96
0030
2-65
6-97
00 fa
x
PC
B D
istri
butio
n in
Gro
undw
ater
Dov
er P
ower
Pla
ntD
over
, Del
awar
e
ByD
raw
nC
heck
ed
Dat
e
Proj
ect #
Scal
e:Fi
le N
ame:
Fig.
No.
ADS
JPR 09
85.6
9.51
Figu
re 5
065
130 Fe
et
Fig5
GW
.mxd
Del
awar
eB
ayM
DD
E
NJ
Site
Loc
atio
n
PA
/
7/18
/201
37/
18/2
013
1:1,
560
Not
e:
ND
- N
ot D
etec
ted
Sour
ce: D
elaw
are
Dat
aMIL
- Ta
x Pa
rcel
s.
&<G
roun
dwat
er S
ampl
eD
over
Pow
er P
lant
Site
Bou
ndar
yTa
x Pa
rcel
s
WO
OD
CR
EST
DR
IVE
WIL
SON
DR
ALO
NZO
DR
IVE
ANNAVENUE
BU
TTN
ER
PL A
CE
VIR
GIN
IAA
VEN
U
RA
ILR
OA
D
Ove
rland
Flow
Dis
tanc
e=
0ft
Path
: N:\A
eria
ls a
nd m
aps\
Wor
king
GIS
File
s (D
o N
ot E
dit)\
51 G
ener
al C
onsu
lting
\098
5.69
.51
- PC
B M
ass
Load
ing
2\D
over
Pow
er P
lant
\MX
D\F
ig6S
oilL
oss.
mxd
Bri
gh
tFie
lds,
In
c.E
nvi
ronm
enta
l E
valu
atio
nIn
vest
igat
ion,
and
Re
me
diat
ion
801
Indu
stria
l Stre
et, S
uite
1W
ilmin
gton
, Del
awar
e 19
801
302-
656-
9600
302-
656-
9700
fax
Soi
l Los
s E
stim
ates
Dov
er P
ower
Pla
ntD
over
, Del
awar
e
ByD
raw
nC
heck
ed
Dat
e
Proj
ect #
Scal
e:Fi
le N
ame:
Fig.
No.
ADS
KEP 09
85.6
9.51
Figu
re 6
065
130 Fe
et
Fig6
Soi
lLos
s.m
xd
Del
awar
eB
ayM
DD
E
NJ
Site
Loc
atio
n
PA
/
6/18
/201
46/
18/2
014
1:1,
560
Sour
ce: D
elaw
are
Dat
aMIL
- A
eria
l 201
2, T
ax P
arce
ls.
Ove
rland
Flo
wD
over
Pow
er P
lant
Site
Bou
ndar
y
Tax
Par
cels
Tons
/Yea
r/Acr
e of
Soi
l Los
s E
stim
ated
Hig
h : 5
.24
Low
: 0

PCB Mass Loading Phase IIDover Power PlantSIRS ID: DE-0269Dover, Delaware
Tables
Tabl
e 1
PCB
Ana
lytic
al R
esul
ts F
or S
oil
Dov
er P
ower
Pla
nt (D
E-02
69)
Wilm
ingt
on, D
E
Brig
htFi
elds
Pro
ject
#: 0
985.
69.5
1P
age
1 of
1Ju
ne 2
014
MR
-01-
SB
0' -
2'D
ynam
acS
ite V
isit
Trip
Rep
ort
Nov
-92
0.04
4U
0.04
4U
0.04
4U
0.04
4U
0.04
4U
0.08
7U
0.08
7U
MR
-01-
SB
2' -
4'D
ynam
acS
ite V
isit
Trip
Rep
ort
Nov
-92
0.04
4U
0.04
4U
0.04
4U
0.04
4U
0.04
4U
0.08
8U
0.08
8U
MR
-02-
SB
0' -
2'D
ynam
acS
ite V
isit
Trip
Rep
ort
Nov
-92
0.04
3U
0.04
3U
0.04
3U
0.04
3U
0.04
3U
0.08
5U
0.08
5U
MR
-02-
SB
2' -
4'D
ynam
acS
ite V
isit
Trip
Rep
ort
Nov
-92
0.04
2U
0.04
2U
0.04
2U
0.04
2U
0.04
2U
0.08
5U
0.08
5U
MR
-03-
SB
0' -
2'D
ynam
acS
ite V
isit
Trip
Rep
ort
Nov
-92
0.04
2U
0.04
2U
0.04
2U
0.04
2U
0.04
2U
0.08
4U
0.08
4U
MR
-03-
SB
2' -
4'D
ynam
acS
ite V
isit
Trip
Rep
ort
Nov
-92
0.04
3U
0.04
3U
0.04
3U
0.04
3U
0.04
3U
0.08
6U
0.08
6U
MR
-04-
SB
0' -
2'D
ynam
acS
ite V
isit
Trip
Rep
ort
Nov
-92
0.05
2U
0.05
2U
0.05
2U
0.05
2U
0.05
2U
0.1
U0.
1U
MR
-04-
SB
2' -
4'D
ynam
acS
ite V
isit
Trip
Rep
ort
Nov
-92
0.04
8U
0.04
8U
0.04
8U
0.04
8U
0.04
8U
0.09
6U
0.09
6U
MR
-05-
SB
0' -
2'D
ynam
acS
ite V
isit
Trip
Rep
ort
Nov
-92
0.04
3U
0.04
3U
0.04
3U
0.04
3U
0.04
3U
0.08
6U
0.08
6U
MR
-05-
SB
2' -
4'D
ynam
acS
ite V
isit
Trip
Rep
ort
Nov
-92
0.04
2U
0.04
2U
0.04
2U
0.04
2U
0.04
2U
0.08
5U
0.08
5U
MR
-06-
SB
0' -
2'D
ynam
acS
ite V
isit
Trip
Rep
ort
Nov
-92
0.04
4U
0.04
4U
0.04
4U
0.04
4U
0.04
4U
0.08
8U
0.08
8U
MR
-06-
SB
2' -
4'D
ynam
acS
ite V
isit
Trip
Rep
ort
Nov
-92
0.05
8U
0.05
8U
0.05
8U
0.05
8U
0.05
8U
0.12
U0.
12U
MR
-07-
SB
0' -
2'D
ynam
acS
ite V
isit
Trip
Rep
ort
Nov
-92
0.04
3U
0.04
3U
0.04
3U
0.04
3U
0.04
3U
0.04
8J
0.08
6U
MR
-07-
SB
2' -
4'D
ynam
acS
ite V
isit
Trip
Rep
ort
Nov
-92
0.04
2U
0.04
2U
0.04
2U
0.04
2U
0.04
2U
0.02
6J
0.08
4U
MR
-08-
SB
0' -
0.5'
Dyn
amac
Site
Vis
it Tr
ip R
epor
tN
ov-9
20.
046
U0.
046
U0.
046
U0.
046
U0.
046
U0.
091
U0.
091
UM
R-0
9-S
B0'
- 2'
Dyn
amac
Site
Vis
it Tr
ip R
epor
tN
ov-9
20.
044
U0.
044
U0.
044
U0.
044
U0.
044
U0.
089
U0.
089
UM
R-1
0-S
B0'
- 2'
Dyn
amac
Site
Vis
it Tr
ip R
epor
tN
ov-9
20.
045
U0.
045
U0.
045
U0.
045
U0.
045
U0.
09U
0.09
UM
R-1
1-S
B0'
- 2'
Dyn
amac
Site
Vis
it Tr
ip R
epor
tN
ov-9
20.
044
U0.
044
U0.
044
U0.
044
U0.
044
U0.
088
U0.
088
UM
R-1
1-S
B2'
- 4'
Dyn
amac
Site
Vis
it Tr
ip R
epor
tN
ov-9
20.
044
U0.
044
U0.
044
U0.
044
U0.
044
U0.
088
U0.
088
US
-10'
- 2'
Wes
ton
EP
A T
AT
Sam
plin
g19
920.
8U
0.8
U0.
8U
0.8
U0.
8U
0.8
U0.
8U
S-1
2' -
4'W
esto
nE
PA
TA
T S
ampl
ing
1992
0.8
U0.
8U
0.8
U0.
8U
0.8
U0.
8U
0.8
US
-20'
- 2'
Wes
ton
EP
A T
AT
Sam
plin
g19
920.
8U
0.8
U0.
8U
0.8
U0.
8U
0.8
U0.
8U
S-3
0' -
2'W
esto
nE
PA
TA
T S
ampl
ing
1992
0.8
U0.
8U
0.8
U0.
8U
0.8
U0.
8U
0.8
US
-40'
- 2'
Wes
ton
EP
A T
AT
Sam
plin
g19
920.
8U
0.8
U0.
8U
0.8
U0.
8U
0.8
U0.
8U
S-5
0' -
2'W
esto
nE
PA
TA
T S
ampl
ing
1992
0.8
U0.
8U
0.8
U0.
8U
0.8
U0.
8U
0.8
US
-60'
- 2'
Wes
ton
EP
A T
AT
Sam
plin
g19
920.
8U
0.8
U0.
8U
0.8
U0.
8U
0.8
U0.
8U
S-7
0' -
2'W
esto
nE
PA
TA
T S
ampl
ing
1992
0.8
U0.
8U
0.8
U0.
8U
0.8
U0.
8U
0.8
U
Qua
lifie
rs:
J - E
stim
ated
val
ueU
- S
ampl
e no
t det
ecte
d ab
ove
the
labo
rato
ry m
etho
d de
tect
ion
limit
Rep
ort D
ate
Sam
ple
Iden
tific
atio
n
Sam
ple
Dep
th (f
eet
bgs)
Sam
plin
g C
ompa
nyR
epor
t Nam
e
bgs
- Bel
ow g
roun
d su
rface
Not
e: A
ll re
sults
repo
rted
in m
g/kg
.
0.22
Aroc
lor-
1016
Aroc
lor-
1221
Aroc
lor-
1232
Aroc
lor-
1242
Aroc
lor-
1248
Aroc
lor-
1254
Aroc
lor-
1260
DN
REC
-SIR
S Sc
reen
ing
Leve
l (J
anua
ry 2
014)
(m
g/kg
)
DN
REC
-SIR
S Sc
reen
ing
Leve
l (J
anua
ry 2
014)
(m
g/kg
)0.
390.
140.
140.
220.
220.
11
DN
REC
-SIR
S Sc
reen
ing
Leve
l (J
anua
ry 2
014)
(m
g/kg
)
DN
REC
-SIR
S Sc
reen
ing
Leve
l (J
anua
ry 2
014)
(m
g/kg
)
DN
REC
-SIR
S Sc
reen
ing
Leve
l (J
anua
ry 2
014)
(m
g/kg
)
DN
REC
-SIR
S Sc
reen
ing
Leve
l (J
anua
ry 2
014)
(m
g/kg
)
DN
REC
-SIR
S Sc
reen
ing
Leve
l (J
anua
ry 2
014)
(m
g/kg
)
Tabl
e 2
PCB
Ana
lytic
al R
esul
ts F
or G
roun
dwat
er
Dov
er P
ower
Pla
nt (D
E-02
69)
Wilm
ingt
on, D
E
Brig
htFi
elds
Pro
ject
#: 0
985.
69.5
1P
age
1 of
1Ju
ne 2
014
MW
-15'
- 15
'Ja
mes
C. A
nder
son
1995
Gro
undw
ater
Sam
plin
g R
epor
tJu
n-95
1U
1U
1U
1U
1U
1U
1U
MW
-28'
- 18
'Ja
mes
C. A
nder
son
1995
Gro
undw
ater
Sam
plin
g R
epor
tJu
n-95
1U
1U
1U
1U
1U
1U
1U
MW
-35'
- 15
'Ja
mes
C. A
nder
son
1995
Gro
undw
ater
Sam
plin
g R
epor
tJu
n-95
1U
1U
1U
0.00
1U
1U
1U
1U
MW
-48'
- 18
'Ja
mes
C. A
nder
son
1995
Gro
undw
ater
Sam
plin
g R
epor
tJu
n-95
1U
1U
1U
0.00
1U
1U
1U
1U
MW
-57'
- 17
'Ja
mes
C. A
nder
son
1995
Gro
undw
ater
Sam
plin
g R
epor
tJu
n-95
1U
1U
1U
0.00
1U
1U
1U
1U
Qua
lifie
rs:
* - S
cree
ning
leve
l lik
ely
belo
w th
e ro
utin
e m
etho
d de
tect
ion
limit
DN
REC
-SIR
S Sc
reen
ing
Leve
l (J
anua
ry 2
014)
(u
g/L)
DN
REC
-SIR
S Sc
reen
ing
Leve
l (J
anua
ry 2
014)
(u
g/L)
Sam
ple
Iden
tific
atio
n
Scre
en
Dep
th
(feet
bgs
)Sa
mpl
ing
Com
pany
Rep
ort N
ame
bgs
- Bel
ow g
roun
d su
rface
Not
e: A
ll re
sults
repo
rted
in u
g/L.
DN
REC
-SIR
S Sc
reen
ing
Leve
l (J
anua
ry 2
014)
(u
g/L)
0.03
4*0.
031*
DN
REC
-SIR
S Sc
reen
ing
Leve
l (J
anua
ry 2
014)
(u
g/L)
DN
REC
-SIR
S Sc
reen
ing
Leve
l (J
anua
ry 2
014)
(u
g/L)
U -
Sam
ple
not d
etec
ted
abov
e th
e la
bora
tory
met
hod
dete
ctio
n lim
it
0.03
4*
Aroc
lor-
1016
Aroc
lor-
1221
Aroc
lor-
1232
Aroc
lor-
1242
Aroc
lor-
1248
Aroc
lor-
1254
Aroc
lor-
1260
DN
REC
-SIR
S Sc
reen
ing
Leve
l (J
anua
ry 2
014)
(u
g/L)
DN
REC
-SIR
S Sc
reen
ing
Leve
l (J
anua
ry 2
014)
(u
g/L)
0.11
0.00
4*0.
004*
0.03
4*
Rep
ort
Dat
e

PCB Mass Loading Phase IIDover Power PlantSIRS ID: DE-0269Dover, Delaware
Site Photographs

PCB Mass Loading Phase IIDover Power PlantSIRS ID: DE-0269Dover, Delaware
Front entrance building on the southern end of the site with small patch of grass.
Parking lot beyond the building at the entrance.

PCB Mass Loading Phase IIDover Power PlantSIRS ID: DE-0269Dover, Delaware
Photograph taken from the middle edge of the site showing short grass, graveled areas, and roadsrunning down the middle of the site and on the eastern boundary.
View of the main building and some of the equipment on site with pavement wrapping around the eastern side (towards the right of the photograph).
PCB Mass Loading Phase IIDover Power PlantSIRS ID: DE-0269Dover, Delaware
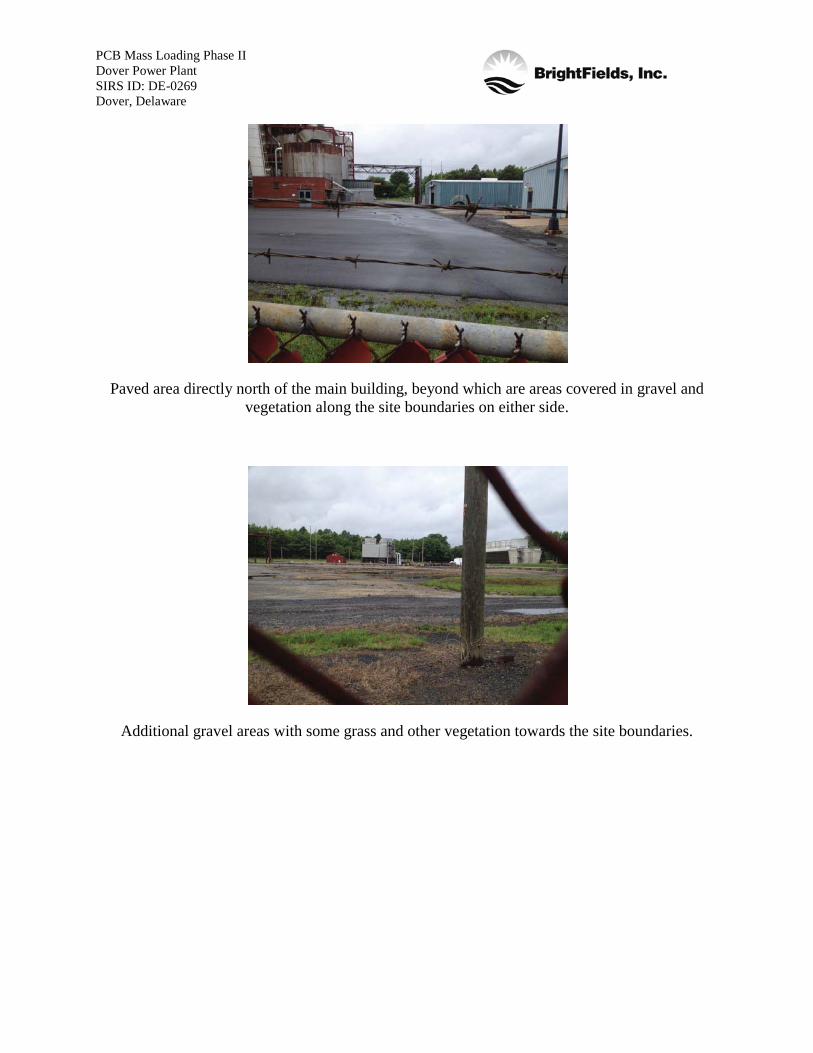
Paved area directly north of the main building, beyond which are areas covered in gravel and vegetation along the site boundaries on either side.
Additional gravel areas with some grass and other vegetation towards the site boundaries.

PCB Mass Loading Phase IIDover Power PlantSIRS ID: DE-0269Dover, Delaware
Overland Flow Calculations
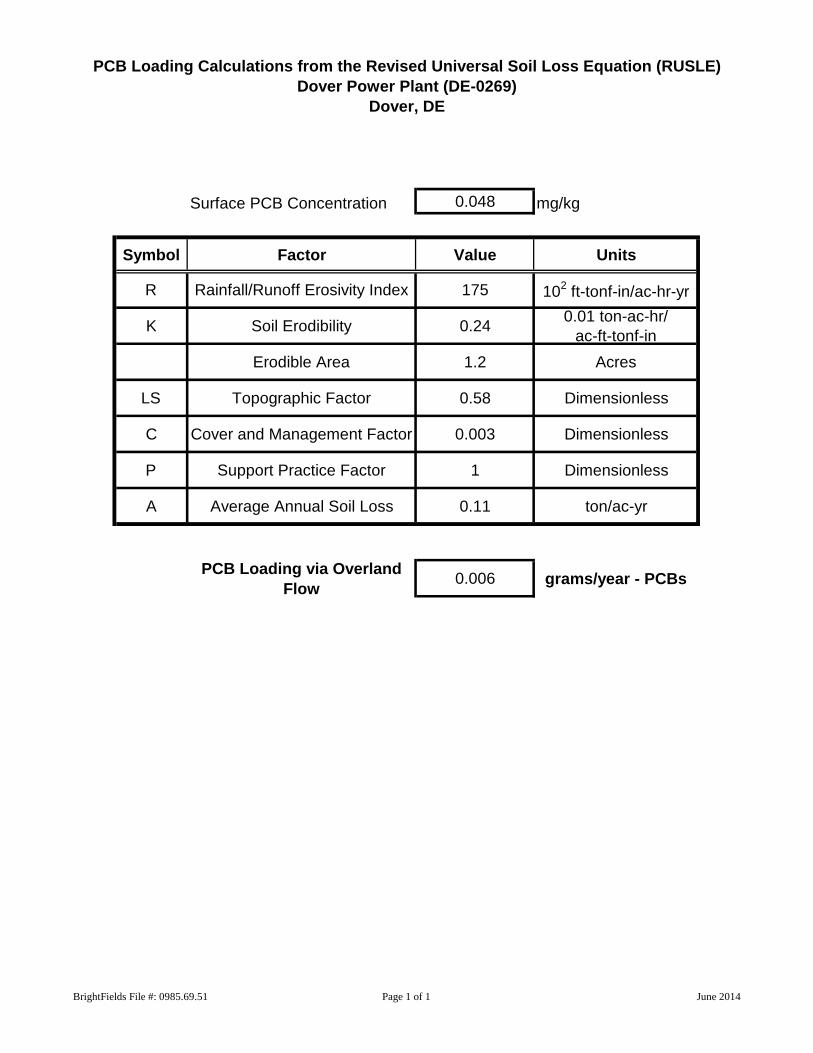
PCB Loading Calculations from the Revised Universal Soil Loss Equation (RUSLE)Dover Power Plant (DE-0269)
Dover, DE
BrightFields File #: 0985.69.51 Page 1 of 1 June 2014
Surface PCB Concentration 0.048 mg/kg
Symbol Factor Value Units
R Rainfall/Runoff Erosivity Index 175 102 ft-tonf-in/ac-hr-yr
K Soil Erodibility 0.24 0.01 ton-ac-hr/ac-ft-tonf-in
Erodible Area 1.2 Acres
LS Topographic Factor 0.58 Dimensionless
C Cover and Management Factor 0.003 Dimensionless
P Support Practice Factor 1 Dimensionless
A Average Annual Soil Loss 0.11 ton/ac-yr
PCB Loading via Overland Flow 0.006 grams/year - PCBs
PCB Mass Loading Phase IIDover Power PlantSIRS ID: DE-0269Dover, Delaware
Groundwater Transport Calculations(Not Applicable)