Embed Size (px)
Citation preview

The Power of One

Table of Contents

Our Customers
Our Colleagues
Our Contributions
070605
Total Revenues
070605
Annual Dividends Declared
070605
Stock Price at Year End
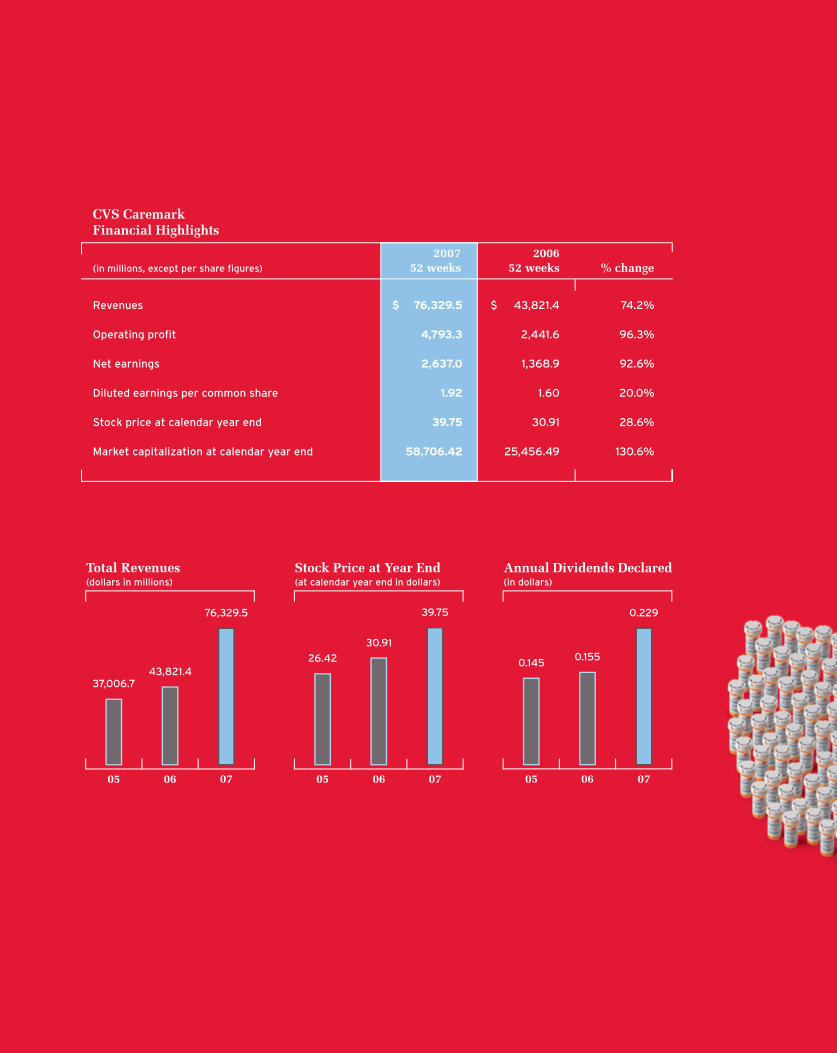
CVS Caremark Financial Highlights
2007 200652 weeks 52 weeks % change
Unmatched Breadth of CapabilitiesWith the 2007 merger of CVS Corporation and
Caremark Rx, Inc., we’ve become an integrated
provider of prescriptions and related health
services with an unmatched breadth of capa-
bilities. We’re the market leader in multiple
categories and able to provide payors and
patients with solutions that no pharmacy
retailer or pharmacy benefits manager on
its own could offer. It’s “The Power of One.”
The combination will enable us to provide end-
to-end solutions that impact everything from
pharmacy plan design to the ultimate delivery
of products and services to customers. Our
capabilities include industry-leading clinical
and health management programs, specialty
pharmacy expertise, leadership in retail clinics,
customer service excellence, and our deep
knowledge of the consumer gained through
the more than four million customers who
visit our stores every day.
We invite you to turn the page to learn more
about our new company and our plans for
improving the delivery of pharmacy and
health care services in the United States.
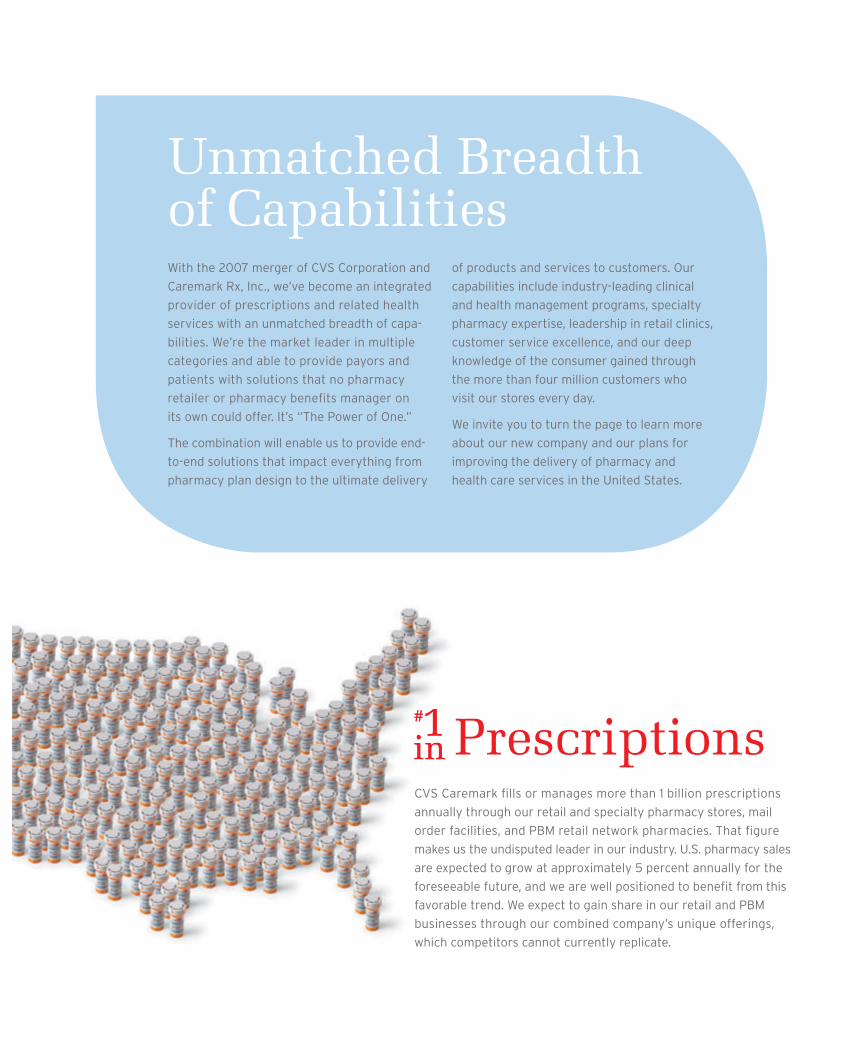
PrescriptionsCVS Caremark fills or manages more than 1 billion prescriptions
annually through our retail and specialty pharmacy stores, mail
order facilities, and PBM retail network pharmacies. That figure
makes us the undisputed leader in our industry. U.S. pharmacy sales
are expected to grow at approximately 5 percent annually for the
foreseeable future, and we are well positioned to benefit from this
favorable trend. We expect to gain share in our retail and PBM
businesses through our combined company’s unique offerings,
which competitors cannot currently replicate.
#1 in#1 in

� I
C
VS
Car
emar
k
Retail Clinics#1 inMinuteClinic, the nation’s leading chain of retail-
based health clinics, operated 462 locations in
25 states at year-end. Nearly all are located
right inside our stores, making it “CVS easy”
to seek treatment for common illnesses
or to receive routine vaccinations.
Open seven days a week, MinuteClinic
requires no appointment. Its clinicians
— primarily nurse practitioners — have
handled more than 1.5 million patient
visits to date and over 500,000
in the final four months of
2007 alone. With our broader
health care focus, many more
MinuteClinics are on the way
in 2008 with an expanded
list of services.
CVS Caremark leads the industry with approximately
$8 billion in specialty pharmacy sales through our
20 specialty mail order pharmacies, our 56 specialty
pharmacy stores, and CVS/pharmacy locations.
Specialty costs are rising rapidly for payors, and
we’re uniquely positioned to help our PBM clients
control spending with our advanced utilization
management guidelines, clinical expertise, and
Accordant® health management programs.
Specialty Pharmacy#1 in

� I �007 An
nu
al Rep
ort
The most popular loyalty program in retail expanded further
in 2007 as ExtraCare card usage exceeded 63 percent
of front-end sales. More than 50 million active
cardholders are taking advantage of in-store
sales while skipping the hassle of clipping
coupons. They also receive offerings with
their receipts targeted to their specific
shopping preferences along with quarterly
ExtraBucks. ExtraBucks can be used for
virtually any front-end purchase just like
cash, and customers tell us they love them!
Retail Loyalty
Store CountWith nearly 6,300 CVS/pharmacy locations and
56 specialty pharmacy stores from coast to coast,
we operate more stores than any other U.S. drugstore
chain. More than 60 percent are freestanding, making it
“CVS easy” for customers to fill prescriptions, replenish
the medicine cabinet, or stop in to consult with one of
our beauty advisors. With free time in such short supply
these days, 60 percent of our locations offer drive-thru
pharmacies and 72 percent provide the convenience of
24-hour or extended-hours drugstores.
#1 in
#1 in

� I
C
VS
Car
emar
k
One CompanyWhat do you get when you combine the nation’s largest
chain of retail pharmacies, a leading PBM, and the
fastest-growing operator of retail health clinics? In CVS
Caremark, you get a company with the potential to have
a major impact on the way pharmacy and health care
services in the United States are delivered. We plan to
leverage our unique combination to help payors control
costs more effectively, improve patient access, and
promote better health outcomes in a way that no other
company can.

� I �007 An
nu
al Rep
ort
One View of PatientIt won’t be long before every one of Caremark’s covered lives
can walk into a CVS/pharmacy with the confidence that their
pharmacist has a complete overview of their individual history.
That includes routine prescriptions filled in our stores, mail
order pharmacies, or at CVS.com; participation in one of
Caremark’s leading health management programs; or a visit
to one of our MinuteClinics. This unique view of the patient
will, among other things, help CVS Caremark promote greater
compliance with customers’ prescription drug regimens. That’s
one of the keys to improving health outcomes while reducing
health care costs for both patients and payors.

� I
C
VS
Car
emar
k
One Goal“ CVS Caremark is positioned to
improve access for patients, promote
better health outcomes, and control
payor costs in a way that no pharmacy
retailer or PBM could do separately.”
Tom Ryan I Chairman of the Board, President & CEO

7 I �007 An
nu
al Rep
ort
The past year set the stage for
a new chapter in our company’s
history as we completed the
transformational merger of CVS
Corporation and Caremark Rx, Inc.
We are now the largest integrated
provider of prescriptions and related
health services in the United States,
filling or managing more than a
quarter of all prescriptions in the
nation. Beyond the sheer scale
of our operations, CVS Caremark
is positioned to improve access
for patients, promote better health
outcomes, and control payor costs
in a way that no pharmacy retailer
or PBM could do separately. Our
unique model provides us with a
significant opportunity to gain share
and create new sources of growth
going forward.
It was a very successful year on
a number of other fronts as well.
Here are some highlights of our
key accomplishments:
• CVS Caremark posted record
revenue and earnings, driven
by solid performance in
both the retail and pharmacy
services segments.
• We opened �7� new or relocated
CVS/pharmacy stores and saw
continued improvement in sales
and profits in the stores we
acquired from Albertson’s, Inc.,
in �00�, and from J.C. Penney
in �00�.
• Caremark Pharmacy Services
signed up $�.1 billion in new
business, a clear sign that payors
understand the potential benefits
of our combination.
• We opened �1� MinuteClinics,
increasing our total at year-
end to ��� clinics in �� states.
That’s about four times the
number operated by our nearest
competitor.
• We attained our goal of generat-
ing $� billion in free cash flow,
and we launched a $� billion
share repurchase program that
we completed in the first quarter
of �008.
• Even in the midst of all this
activity, we remained keenly
focused on service, execution,
and expense control across
the company.
Total revenues rose 7�.� percent
to a record $7�.� billion. In our
CVS/pharmacy segment, same
store sales rose �.� percent. Gross
margins increased in both our retail
and PBM businesses, due largely to
significant generic drug introductions
and purchasing synergies resulting
from the merger. Net earnings
climbed 9�.� percent to $�.� billion,
or $1.9� per diluted share.
Turning to CVS Caremark’s stock
performance, the �9.� percent total
return on our shares far surpassed
the modest numbers posted by the
S&P �00 Index and the Dow Jones
Industrial Average (DJIA) in �007.
Our three-year performance is just
as impressive. While the S&P �00
and the DJIA returned �1.� percent
and ��.0 percent, respectively, CVS
shares returned 78.� percent.
We’re going to offer services that
no other competitor can match.
In the short time since completing
our merger, we’ve made substantial
progress in integrating our two
companies. We brought Pharma-
Care, CVS’ legacy PBM business,
under the Caremark umbrella,
connected all our back-end systems,
and are set to achieve more than
Dear Shareholder:

8 I
C
VS
Car
emar
k
“ In the short time since completing our merger, we’ve made substantial
progress in integrating our two companies. We brought PharmaCare,
CVS’ legacy PBM business, under the Caremark umbrella, connected all
our back-end systems, and are set to achieve more than $700 million in
cost-saving synergies in 2008. That’s over 50 percent higher than our
original target at the time we first announced the merger.”
$700 million in cost-saving syner-
gies in �008. That’s over �0 percent
higher than our original target at the
time we first announced the merger.
We’ve also made important progress
in developing differentiated offerings
that we believe will lead to enhanced
growth for our company over time.
Obviously, we’re offering payors and
patients all the services they would
expect from a world-class PBM;
however, we plan to take those
services a step further.
For example, let’s take the area
of compliance. One of the simplest
ways for a PBM to control payor
costs and improve outcomes is
by encouraging patients to take the
medicine prescribed to them and to
renew their prescriptions promptly.
Any PBM has the capability to do
this by contacting these patients
over the telephone or by mail.
However, face-to-face interaction
is far more effective, and our
CVS/pharmacy stores give us the
unique capability to get closer to
the consumer. We’re developing
programs that tap into the com-
bined ��,000 pharmacists and
MinuteClinic practitioners in our
locations across the country.
We also intend to build upon our
No. 1 position in the high-growth
specialty pharmacy market, lever-
age our ExtraCare card and all its
unique benefits among our millions
of covered lives, enhance our health
management programs, and increase
use of MinuteClinic by our PBM
clients. We’ll implement some of
our initiatives relatively quickly;
others will happen over time.
We’re leveraging opportunities for
greater profitability in the pharmacy.
In both our retail and mail order
pharmacies, we are benefiting from
the aging population, greater utiliza-
tion among seniors due to Medicare
Part D, and the increasing use of
generic drugs. Although their lower
prices depress revenue growth
and we continue to see pressure
on pharmacy reimbursement rates,
generics are more profitable than
brand name drugs and help drive
margin expansion. Moreover,
CVS Caremark is now the largest
purchaser of generic drugs in
the United States, which enables
us to drive down costs.
In �007, the company had a
�� percent generic dispensing
rate at retail. With approximately
$70 billion in branded drug sales
coming off patent in the next
five years, we expect that figure
to rise to 7� percent by �01�.
We should see similar gains for
Caremark’s PBM business, whose
generic dispensing rate is currently
at �0 percent.

9 I �007 An
nu
al Rep
ort
“ We’ve done so much more than just combine
two very successful businesses. We’ve literally
created a first-of-its-kind company — one with
the ability to grow faster than either of its
components would have on its own.”
Generic versions of bioengineered
drugs represent another opportunity.
Currently, the United States has no
procedure for approving generic
versions of bioengineered drugs
when they come off patent. However,
we expect to see Congress enact
legislation at some point in the
future to create a biogeneric approval
process at the U.S. Food and Drug
Administration. We will be well
positioned if or when this occurs.
We continue to open new stores and
make the most of recent acquisitions.
Despite the past year’s merger
activity, we continued to execute
our organic growth strategy at
retail. CVS/pharmacy square footage
grew by � percent, in line with our
annual target. Of the �7� stores we
opened, 1�9 were new locations and
1�� were relocations. Factoring in
closings, we enjoyed net unit growth
of 9� stores. We continued to expand
in our newer, high-growth areas such
as Los Angeles, San Diego, Phoenix,
Las Vegas, and Minneapolis.
The former Eckerd® locations that
we acquired in �00� still enjoyed
same store sales growth that out-
paced our overall numbers. These
stores are benefiting from their
locations in high-growth markets –
mainly Florida and Texas – and
they continue to gain share from
competitors as well.
We’re also very pleased with
the performance of the stand-
alone Sav-on® and Osco® stores
we purchased from Albertsons.
This acquisition strengthened
our presence in the Midwest and
provided us with an immediate
leadership position in Southern
California, the country’s second-
largest drugstore market. In fact,
our Southern California CVS/
pharmacy stores now lead the
entire chain in sales. These new
CVS/pharmacy stores are benefit-
ing from an improved merchandise
assortment and category focus.
The introduction of the ExtraCare
card is encouraging customer
loyalty and helping drive an
increase in sales and margins.
In the front of the store, we’re
seeing sales growth across our core
categories, especially in beauty,
personal care, general merchandise,
and digital photo. CVS store brands
and proprietary brands have been
important drivers of gross margins.
As solid as our front-end business
is, it’s worth noting that it accounts
for �0 percent of our retail sales
compared with 70 percent for the
pharmacy. The front-end percent-
age becomes even smaller in the
context of CVS Caremark’s overall
revenues. That’s why we expect
any impact on CVS/pharmacy from
a softer economy to be limited and
manageable. After all, our average
front-end purchase is a little under
$1�, and we don’t anticipate that
consumers will buy less cough
medicine, analgesics, or any of
the other non-discretionary
10
I C
VS
Car
emar
k
items that make up the majority
of our front-end sales. We even
stand to benefit if consumers turn
to our high-quality, lower-cost CVS
store brand products to save money.
We’re expanding MinuteClinic as part
of our broader health care offerings.
For many CVS/pharmacy customers,
�007 presented them with their first
chance to visit one of our in-store
MinuteClinics. Focused on treating
a limited number of common
ailments at a competitive price, it
is helping us lower costs for health
plans and self-insured employers.
MinuteClinic has seen more than
1.� million patients since inception,
and customer response has been
extremely positive. It is the only
retail clinic to meet the rigorous
guidelines of The Joint Commission,
the nation’s chief standards-setting
and accrediting body in health care.
At least �� percent of MinuteClinic
patients have not previously been
CVS/pharmacy customers. That
represents a significant opportunity
to introduce them to the “CVS
easy” shopping experience and
reap incremental sales gains in the
pharmacy and the front end. As I
mentioned earlier, we’re also working
to incorporate MinuteClinic into
our PBM offerings when Caremark
sits down at the table with current
and potential clients.
Before closing, I want to take this
opportunity to thank the outstanding
management team we have across
our retail and PBM businesses and
the more than 190,000 people in
our company who helped make
the past year’s accomplishments
possible. I’ve often said we have
the best people in the industry, and
they proved me right again. I deeply
appreciate their dedication.
I also want to acknowledge the
considerable contributions Mac
Crawford made at the helm of
Caremark for nine years and in his
subsequent role as the first chair-
man of the board of our combined
company. Mac chose to step down
in November, and I wish him a
happy and healthy retirement.
We shared the same vision for
the future of this industry, and the
core team he assembled remains the
guiding force at Caremark Pharmacy
Services. Former director Roger
Headrick provided invaluable
guidance during his 11 years on the
Caremark board, and I want to thank
him for his contributions as well.
We really are at a pivotal moment
in our history, with CVS Caremark
poised to transform the delivery of
pharmacy services in this country.
We’ve done so much more than
just combine two very successful
businesses. We’ve literally created
a first-of-its-kind company – one
with the ability to grow faster than
either of its components would
have on its own. For us, that’s the
real “power of one.” Thank you for
your confidence.
Thomas M. Ryan
Chairman of the Board,
President & CEO
February 27, 2008
11 I �007 An
nu
al Rep
ort
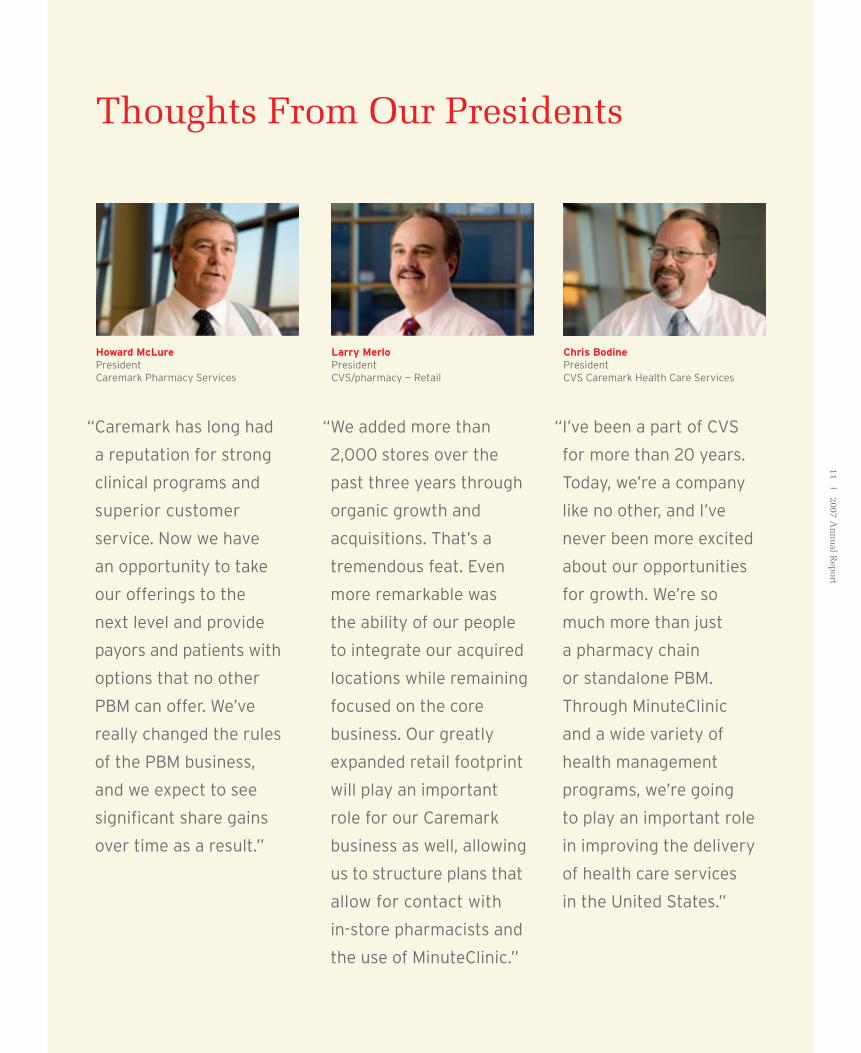
Chris Bodine President CVS Caremark Health Care Services
Larry Merlo President CVS/pharmacy — Retail
Howard McLure President Caremark Pharmacy Services
Thoughts From Our Presidents
“ I’ve been a part of CVS
for more than 20 years.
Today, we’re a company
like no other, and I’ve
never been more excited
about our opportunities
for growth. We’re so
much more than just
a pharmacy chain
or standalone PBM.
Through MinuteClinic
and a wide variety of
health management
programs, we’re going
to play an important role
in improving the delivery
of health care services
in the United States.”
“ We added more than
2,000 stores over the
past three years through
organic growth and
acquisitions. That’s a
tremendous feat. Even
more remarkable was
the ability of our people
to integrate our acquired
locations while remaining
focused on the core
business. Our greatly
expanded retail footprint
will play an important
role for our Caremark
business as well, allowing
us to structure plans that
allow for contact with
in-store pharmacists and
the use of MinuteClinic.”
“ Caremark has long had
a reputation for strong
clinical programs and
superior customer
service. Now we have
an opportunity to take
our offerings to the
next level and provide
payors and patients with
options that no other
PBM can offer. We’ve
really changed the rules
of the PBM business,
and we expect to see
significant share gains
over time as a result.”
1�
I C
VS
Car
emar
k
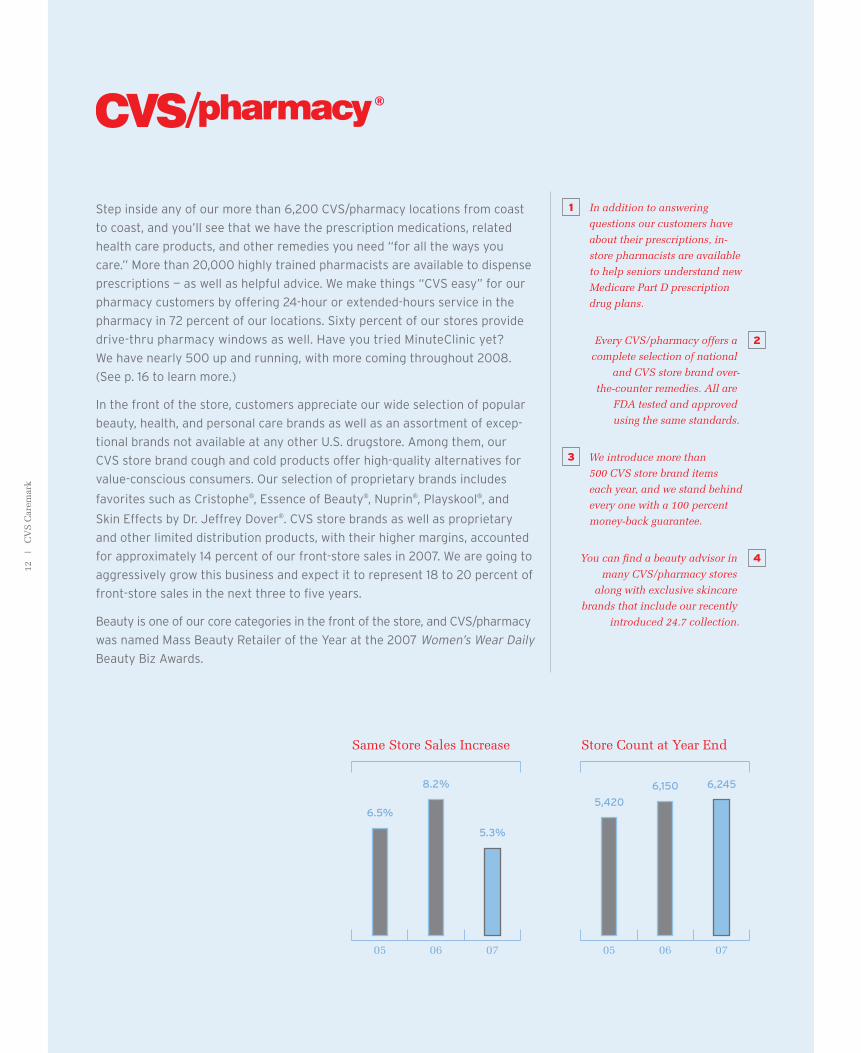
Step inside any of our more than 6,200 CVS/pharmacy locations from coast
to coast, and you’ll see that we have the prescription medications, related
health care products, and other remedies you need “for all the ways you
care.” More than 20,000 highly trained pharmacists are available to dispense
prescriptions — as well as helpful advice. We make things “CVS easy” for our
pharmacy customers by offering 24-hour or extended-hours service in the
pharmacy in 72 percent of our locations. Sixty percent of our stores provide
drive-thru pharmacy windows as well. Have you tried MinuteClinic yet?
We have nearly 500 up and running, with more coming throughout 2008.
(See p. 16 to learn more.)
In the front of the store, customers appreciate our wide selection of popular
beauty, health, and personal care brands as well as an assortment of excep-
tional brands not available at any other U.S. drugstore. Among them, our
CVS store brand cough and cold products offer high-quality alternatives for
value-conscious consumers. Our selection of proprietary brands includes
favorites such as Cristophe®, Essence of Beauty®, Nuprin®, Playskool®, and
Skin Effects by Dr. Jeffrey Dover®. CVS store brands as well as proprietary
and other limited distribution products, with their higher margins, accounted
for approximately 14 percent of our front-store sales in 2007. We are going to
aggressively grow this business and expect it to represent 18 to 20 percent of
front-store sales in the next three to five years.
Beauty is one of our core categories in the front of the store, and CVS/pharmacy
was named Mass Beauty Retailer of the Year at the 2007 Women’s Wear Daily
Beauty Biz Awards.
1 In addition to answering
questions our customers have
about their prescriptions, in-
store pharmacists are available
to help seniors understand new
Medicare Part D prescription
drug plans.
Every CVS/pharmacy offers a
complete selection of national
and CVS store brand over-
the-counter remedies. All are
FDA tested and approved
using the same standards.
We introduce more than
500 CVS store brand items
each year, and we stand behind
every one with a 100 percent
money-back guarantee.
You can find a beauty advisor in
many CVS/pharmacy stores
along with exclusive skincare
brands that include our recently
introduced 24.7 collection.
2
3
4
6.5%
8.2%
5.3%
070�0�
Same Store Sales Increase
5,420
6,150 6,245
070�0�
Store Count at Year End

1� I �007 An
nu
al Rep
ort
1
2 3 4

1�
I C
VS
Car
emar
k
Payors and patients have long counted on Caremark for a broad range of
services, whether it’s managing their pharmacy benefits, filling prescriptions
by mail, or offering the industry’s deepest clinical capabilities. A leader in
specialty pharmacy, Caremark pioneered this category more than 25 years ago.
Through our Accordant business, we offer the most extensive health manage-
ment programs in the industry. We treat 27 separate chronic disease states,
including diabetes, hemophilia, multiple sclerosis, and rheumatoid arthritis.
Caremark’s strengths in analytics help us develop effective cost-control
strategies for Fortune 1000 employers, health plans, and other PBM clients.
Our strong service culture is reflected in the latest J.D. Power and Associates
Retail Pharmacy Satisfaction Study. Caremark ranked highest in customer
satisfaction among 11 mail order pharmacy service providers. In 2008, the
ExtraCare Health card we are introducing for PBM clients will provide beneficial
health promotions for their plan members.
The 23,000 pharmacists and MinuteClinic practitioners in our retail stores
will help us take many of our offerings to the next level by getting closer to the
patient. Take the $33 billion — and growing — specialty market. In addition to
filling prescriptions at our 20 specialty mail order facilities, we can offer patients
something no other PBM can: a network of 56 retail specialty pharmacies
where they can consult with one of our highly trained pharmacists on a face-
to-face basis. Personal interaction of this kind helps improve compliance, one
of the keys to lowering costs for payors and improving patient health.
$36.011$40.514
$43.349
070�0�
Net Revenues* (dollars in billions)
*Comparable data
$3.0
$3.93
070�
EBITDA/Adjusted Claim* (in dollars)
*Comparable data
1 We filled approximately
74 million traditional and
specialty prescriptions by
mail in 2007.
Clinical pharmacists in our
seven award-winning customer
contact centers routinely
interact with patients and
physician offices.
Most prescriptions in our
state-of-the-art mail service
facilities are filled automatically,
verified by a pharmacist, and
packed and shipped within
minutes of arriving in our
dispensing pharmacy.
Automation can be seen
throughout Caremark mail
facilities, including this
A-Frame system that dispenses
high volume units in their
original manufacturer packaging.
2
3
4

1� I �007 An
nu
al Rep
ort
1
2 3 4

1�
I C
VS
Car
emar
k
1 2
CVS/pharmacy customers have come to expect great service in the
pharmacy and a broad range of offerings in the front of the store. In an
increasing number of locations, we’re giving people yet another reason to
stop in. Nearly 500 of our stores in 25 states now feature a MinuteClinic,
the U.S. leader in retail-based health clinics.
More than 1.5 million people have visited MinuteClinic since its founding
in 2000, and we’ve been busy opening new locations since purchasing the
company in 2006. Staffed primarily by nurse practitioners and physician’s
assistants, MinuteClinics treat a limited number of common ailments and
offer routine vaccinations. They are also open seven days a week and never
require an appointment. As a result, MinuteClinics provide an ideal solution
for professionals and parents with busy schedules, anyone whose doctor
isn’t immediately available, or people who want to avoid visiting an emer-
gency room for minor ailments.
MinuteClinics will play an increasingly important role in CVS Caremark’s drive
to lower the cost of health care for insurance plans and self-insured employ-
ers. Each location provides quality care at a price that is more affordable
than the typical visit to the doctor’s office or emergency room. Of course,
when patients have conditions that require a doctor’s care, MinuteClinic
refers them to their family physician or provides a list of area doctors if
they don’t have one. We are exploring ways of making MinuteClinic part of
Caremark’s PBM coverage — an important advantage in the marketplace — and
have already launched pilot programs that incorporate it for selected payors.
For example, new biometric screening services will facilitate proactive early
interventions for plan members with undiagnosed diabetes, hypertension,
and high cholesterol. That should lead to improved health and lower medical
costs over time.
Childhood and ear infections
often go hand-in-hand, so moms
and dads appreciate the quality
care our clinicians provide.
MinuteClinic is the only chain
of retail clinics accredited by
The Joint Commission, and it
accepts reimbursement from
most insurance plans.
52
142
462
070�0�
Clinic Count
1
2

17 I 2007 An
nu
al Rep
ort
Stock Performance
The following graph shows changes over the past five-year period in the value of $100 invested in: (1) our common stock;
(2) S&P 500 Index; (3) S&P 500 Food & Staples Retail Group Index, which currently includes nine retail companies.
Compound Compound Annual Annual Annual Year End
Return Rate Return Rate Return Rate 2002 2003 2004 2005 2006 2007 (1 Year) (3 Year) (5 Year)
CVS Caremark Corporation $ 100 $ 146 $ 183 $ 216 $ 254 $ 329 29.4% 21.5% 26.9%S&P 500(1) $ 100 $ 129 $ 143 $ 150 $ 173 $ 183 5.5% 8.6% 12.8%S&P 500 Food & Staples Retail Group Index (2) $ 100 $ 99 $ 102 $ 98 $ 105 $ 111 6.0% 2.9% 2.2%
SOURCE: Standard & Poor’s Research Insight
(1) Index includes CVS Caremark
(2) Index currently includes Costco Wholesale, CVS Caremark, Kroger, Safeway, SUPERVALU, Sysco, Wal-Mart, Walgreen, and Whole Foods
$350
$300
$250
$200
$150
$100
$50
$0
070603 050402
Comparison of Cumulative Total Return to ShareholdersDecember 31, 2002 to December 31, 2007
The year-end values of each investment shown in the preceding graph are based on share price appreciation plus dividends, with the
dividends reinvested as of the last business day of the month during which such dividends were paid. The calculations exclude trading
commissions and taxes. Total stockholder returns from each investment, whether measured in dollars or percentages, can be calculated
from the year-end investment values shown beneath the graph.
CVS Caremark Corporation S&P 500 S&P 500 Food & Staples Retail Group Index

18
I C
VS
Car
emar
k
ManageMent’sDiscussionanDanalysisoffinancialconDitionanDResultsofopeRations
The Caremark Merger Effective March 22, 2007, we closed our merger with Caremark
Rx, Inc. (“Caremark”). Following the merger with Caremark
(the “Caremark Merger”), we changed our name to “CVS
Caremark Corporation.”
We believe CVS and Caremark are complementary companies
and the merger is expected to yield benefits for health plan
sponsors through more effective cost-management solutions
and innovative programs and for consumers through expanded
choice, improved access and more personalized services. We
also believe we can operate the combined companies more
efficiently than either company could have operated on its own.
In that regard, the merger has enabled us to achieve significant
synergies from purchasing scale and operating efficiencies.
Purchasing synergies are largely comprised of purchase discounts
and/or rebates obtained from generic and brand name drug
manufacturers and cost efficiencies obtained from our retail
pharmacy networks. Operating synergies include decreases in
overhead expense, increases in productivity and efficiencies by
eliminating excess capacity, decreases in prescription dispensing
costs and other benefits made possible by combining comple-
mentary operations. During 2007, we achieved approximately
$400 million in purchasing and operating synergies (the vast
majority of which were purchase related). We expect purchasing
synergies to increase substantially as we realize a full year benefit
from the Caremark Merger.
Over the longer term, we expect that the Caremark Merger
will create significant incremental revenue opportunities. These
opportunities are expected to be derived from a variety of new
programs and benefit designs that leverage our client relationships,
our integrated information systems and the personal interaction
of our more than 20,000 pharmacists, nurse practitioners and
physician assistants with the millions of consumers who shop our
stores on a daily basis. Examples of these programs include new
prescription compliance and persistency programs, enhanced
disease management programs, new ExtraCare card programs
for plan beneficiaries, increased use of MinuteClinics by plan
The following discussion should be read in conjunction with
our audited consolidated financial statements and our Cautionary
Statement Concerning Forward-Looking Statements that are
presented in this Annual Report.
Overview of Our BusinessCVS Caremark is the largest provider of prescriptions and related
healthcare services in the United States. We fill or manage more
than one billion prescriptions annually. As a fully integrated
pharmacy services company, we drive value for our customers by
effectively managing pharmaceutical costs and improving health-
care outcomes through our approximately 6,200 CVS/pharmacy®
stores; our pharmacy benefit management, mail order and
specialty pharmacy division, Caremark Pharmacy Services; our
retail-based health clinic subsidiary, MinuteClinic®; and our online
pharmacy, CVS.com®.
Today’s healthcare delivery system is rapidly changing. Health-
care is becoming more consumer-centric as the U.S. healthcare
system strains to manage growing costs and employers shift
more responsibility for managing costs to employees. In addition,
an aging population, increasing incidence of chronic disease and
increasing utilization of the Medicare drug benefit is fueling
demand for prescriptions and pharmacy services. Further, cost-
effective generic drugs are becoming more widely available and
new drug therapies to treat unmet healthcare needs and reduce
hospital stays are being introduced. Consumers require medica-
tion management programs and better information to help them
get the most out of their healthcare dollars. As a fully integrated
pharmacy services company, we are well positioned to provide
solutions that address these trends and improve the pharmacy
services experience for consumers.
We also strive to improve clinical outcomes, resulting in better
control over healthcare costs for employers and health plans.
In that regard, we offer broader disease management, health
assessment and wellness services to help plan participants
manage and protect against potential health risks and avoid
future health costs.

ManageMent’sDiscussionanDanalysisoffinancialconDitionanDResultsofopeRations
19 I 2007 An
nu
al Rep
ort
Approximately one-half of the drugstores are located in southern
California. The remaining drugstores are primarily located in our
existing markets in the Midwest and Southwest.
As of December 29, 2007, our retail pharmacy business
included 6,245 retail drugstores (of which 6,164 operated a
pharmacy) located in 40 states plus the District of Columbia
and operating under the CVS or CVS/pharmacy name, our
online retail website, CVS.com and 462 retail healthcare clinics
operating under the MinuteClinic name (of which 437 are
located in CVS/pharmacy stores).
Overview of Pharmacy Services SegmentOur pharmacy services business provides comprehensive prescrip-
tion benefit management services to over 2,000 health benefit
plans. These services include mail order pharmacy services,
specialty pharmacy services, plan design and administration,
formulary management and claims processing. Our customers
are primarily sponsors of health benefit plans (employers,
unions, government employee groups, insurance companies
and managed care organizations) and individuals located
throughout the United States. As a pharmacy benefits manager,
we manage the dispensing of pharmaceuticals through our mail
order pharmacies and our national network of 60,000 retail
pharmacies (which include CVS/pharmacy stores) to eligible
participants in benefit plans maintained by our customers and
utilize our information systems to perform safety checks, drug
interaction screening and generic substitution.
Our pharmacy services business also includes our specialty
pharmacy business. Our specialty pharmacies support individuals
that require complex and expensive drug therapies. Substantially
all of our mail service specialty pharmacies have been accredited
by the Joint Commission on Accreditation of Healthcare
Organizations. We also provide health management programs,
which include integrated disease management for 27 conditions
through our Accordant® health management offering. The
majority of these integrated programs are accredited by the
National Committee for Quality Assurance (the “NCQA”).
beneficiaries and flexible fulfillment options that afford plan
beneficiaries the opportunity to pick-up maintenance medications
in-store. While certain of these programs will commence in 2008,
many are in their formative stage and require significant informa-
tion system enhancements as well as changes to work processes.
Accordingly, there can be no assurances as to the timing of the
implementation of or the amount of incremental revenue
opportunities associated with these kinds of programs.
Our business is comprised of two operating segments: Retail
Pharmacy and Pharmacy Services.
Overview of Retail Pharmacy SegmentOur retail pharmacy business sells prescription drugs and a wide
assortment of general merchandise, including over-the-counter
drugs, beauty products and cosmetics, photo finishing, seasonal
merchandise, greeting cards and convenience foods through our
CVS/pharmacy retail stores and online through CVS.com.
CVS/pharmacy is one of the nation’s largest retail pharmacy
chains. With more than 40 years of dynamic growth in the
retail pharmacy industry, CVS/pharmacy generates almost 68%
of its revenue from the pharmacy business and is committed to
providing superior customer service by being the easiest phar-
macy retailer for customers to use. CVS/pharmacy fills more
than one of every seven retail prescriptions in America, and one
of every five in our own markets. Our proprietary loyalty card
program, ExtraCare, boasts over 50 million cardholders, making
it one of the largest and most successful retail loyalty programs
in the country.
In addition, we provide healthcare services through our
MinuteClinic® healthcare clinics. The clinics utilize nationally
recognized medical protocols to diagnose and treat minor health
conditions and are staffed by nurse practitioners and physician
assistants. We believe the clinics provide quality services that are
quick, affordable and convenient.
On June 2, 2006, we acquired certain assets and assumed
certain liabilities from Albertson’s, Inc. for $4.0 billion. The
assets acquired and the liabilities assumed included approximately
700 standalone drugstores and a distribution center located in La
Habra, California (collectively the “Standalone Drug Business”).

20
I C
VS
Car
emar
k
ManageMent’sDiscussionanDanalysisoffinancialconDitionanDResultsofopeRations
Results of Operations and Industry AnalysisSummary of the Consolidated Financial ResultsThe Company’s fiscal year is a 52 or 53 week period ending on
the Saturday closest to December 31. Fiscal 2007, which ended on
December 29, 2007, fiscal 2006, which ended on December 30,
2006, and fiscal 2005, which ended on December 31, 2005,
each included 52 weeks. Unless otherwise noted, all references
to years relate to these fiscal years.
Fiscal Year Ended
In millions, except per common share amounts 2007 2006 2005
Net revenues $ 76,329.5 $ 43,821.4 $ 37,006.7Gross profit 16,107.7 11,742.2 9,694.6Total operating expenses 11,314.4 9,300.6 7,675.1Operating profit 4,793.3 2,441.6 2,019.5Interest expense, net 434.6 215.8 110.5Earnings before income tax provision 4,358.7 2,225.8 1,909.0Income tax provision 1,721.7 856.9 684.3Net earnings $ 2,637.0 $ 1,368.9 $ 1,224.7Diluted earnings per common share $ 1.92 $ 1.60 $ 1.45
Net revenues increased $32.5 billion during 2007 primarily
due to (i) the Caremark Merger, which resulted in an increase in
Pharmacy Services revenue of $26.5 billion, and (ii) the inclusion of
a full year of financial results and growth of the Standalone Drug
Business, which resulted in an increase in Retail Pharmacy revenue
of $2.2 billion. Net revenues increased $6.8 billion during 2006
primarily due to the acquisition of the Standalone Drug Business.
Gross profit increased $4.4 billion during 2007 due primarily
to the Caremark Merger. We achieved approximately $400 million
in purchasing and operating synergies (the vast majority of which
were purchase related) resulting from the Caremark Merger. In
addition, we continued to benefit from the increased utilization
of generic drugs (which normally yield a higher gross profit rate
than equivalent brand name drugs) in both the Retail Pharmacy
and Pharmacy Services segments. During 2006, gross profit
increased $2.0 billion primarily due to increased utilization of
generic drugs in both the Retail Pharmacy and Pharmacy Services
segments. However, the increased use of generic drugs has
resulted in pressure to decrease reimbursement payments to
retail and mail order pharmacies for generic drugs. We expect
this trend to continue.
In addition, our pharmacy services business participates in the
administration of the Medicare Part D drug benefit through the
provision of pharmacy benefit management (“PBM”) services
to health plan clients as well as clients that have qualified as a
Medicare Part D prescription drug plan. Caremark also partici-
pates by offering Medicare Part D benefits through our SilverScript
Insurance Company (“SilverScript”) subsidiary, which sponsors
one of the top 10 Medicare Part D prescription drug plans in
the country. In addition, PharmaCare, through a joint venture
with Universal American Financial Corp., also participates in
the offering of Medicare Part D pharmacy benefits by affiliated
entities of Universal American.
Our pharmacy services business generates net revenues primarily
by contracting with clients to provide prescription drugs to plan
participants. Prescription drugs are dispensed by our mail order
pharmacies, our specialty pharmacies and by retail pharmacies
in our national network (including CVS/pharmacy stores). Net
revenues are also generated by providing to clients certain
additional services, including administrative services like claims
processing and formulary management as well as healthcare
related services like disease management.
Our pharmacy services business operates under the Caremark
Pharmacy Services, PharmaCare Management Services and
PharmaCare Pharmacy names. As of December 29, 2007, the
pharmacy services business operated 56 retail specialty pharmacy
stores, 20 specialty mail order pharmacies and 9 mail order
pharmacies located in 26 states and the District of Columbia.

ManageMent’sDiscussionanDanalysisoffinancialconDitionanDResultsofopeRations
21 I 2007 An
nu
al Rep
ort
Income tax provision. Our effective income tax rate was 39.5%
in 2007, 38.5% in 2006 and 35.8% in 2005.
As you review our results in this area, we believe you should
consider the following important information:
• During 2007, our effective income tax rate was negatively
impacted by an increase in interest on income tax reserves and
higher state income taxes principally due to the Caremark
Merger, which resulted in a change in the allocation of income
between states.
• During 2007 and 2006, our effective income tax rate was
negatively impacted by the implementation of SFAS No.123(R)
“Share-Based Payment”, as the compensation expense associ-
ated with our employee stock purchase plan is not deductible
for income tax purposes unless, and until, any disqualifying
dispositions occur.
• During the fourth quarters of 2006 and 2005, the Company
recorded reductions of previously recorded income tax reserves
through the income tax provision of $11.0 million and $52.6
million, respectively.
• For internal comparisons, we find it useful to assess year-to-year
performance by excluding the impact of the reductions of previ-
ously recorded income tax reserves in 2006 and 2005 discussed
above. As such, we consider 39.0% and 38.6% to be the
comparable effective tax rates for 2006 and 2005, respectively.
Net earnings increased $1.2 billion or 92.6% to $2.6 billion
(or $1.92 per diluted share) in 2007. This compares to $1.4 billion
(or $1.60 per diluted share) in 2006, and $1.2 billion (or $1.45
per diluted share) in 2005. For internal comparisons, we find
it useful to assess year-to-year performance by excluding the
$40.2 million ($24.7 million after-tax) impact of the SAB 108
Adjustments and $11.0 million reduction of previously recorded
income tax reserves from 2006. As such, we consider $1.3 billion
(or $1.56 per diluted share) to be our comparable net earnings in
2006. In addition, we find it useful to remove the $52.6 million
reduction of previously recorded income tax reserves from 2005.
As such, we consider $1.2 billion (or $1.39 per diluted share) to
be our comparable net earnings in 2005.
Operating expenses increased $2.0 billion and $1.6 billion
during 2007 and 2006, respectively. As you review our perfor-
mance in this area, we believe you should consider the following
important information:
• Total operating expense increased during 2007 primarily due to
the Caremark Merger, which resulted in incremental operating
expenses, depreciation and amortization related to the intan-
gible assets acquired and merger-related integration costs.
• Total operating expenses increased $60.7 million during
2006 due to the adoption of the Statement of Financial
Accounting Standards (“SFAS”) No. 123(R), “Share-Based
Payment.” In addition, total operating expenses increased
during 2006, due to costs incurred to integrate the Standalone
Drug Business.
• During the fourth quarter of 2006, we adopted Staff
Accounting Bulletin No. 108, “Considering the Effects of Prior
Year Misstatements when Quantifying Misstatements in current
Year Financial Statements” (“SAB 108”). In connection with
adopting SAB 108, we recorded adjustments, which collectively
reduced total operating expenses by $40.2 million (the “SAB
108 Adjustments”). Since the effects of the SAB 108 Adjustments
were not material to 2006 or any previously reported fiscal year,
the entire impact was recorded in the fourth quarter of 2006.
Interest expense, net consisted of the following:
In millions 2007 2006 2005
Interest expense $ 468.3 $ 231.7 $ 117.0Interest income (33.7) (15.9) (6.5)Interest expense, net $ 434.6 $ 215.8 $ 110.5
The increase in interest expense during 2007 is due to an
increase in our average debt balance, which resulted primarily
from the borrowings used to fund the special cash dividend paid
to Caremark shareholders and the accelerated share repurchase
program that commenced subsequent to the Caremark Merger.
The increase in interest expense during 2006 was due to a
combination of higher interest rates and higher average debt
balances, which resulted from borrowings used to fund the
acquisition of the Standalone Drug Business.

22
I C
VS
Car
emar
k
ManageMent’sDiscussionanDanalysisoffinancialconDitionanDResultsofopeRations
Segment AnalysisWe evaluate segment performance based on net revenues, gross profit and operating profit before the effect of certain intersegment
activities and charges. Following is a reconciliation of the Company’s business segments to the consolidated financial statements:
Retail Pharmacy Pharmacy Services Intersegment ConsolidatedIn millions Segment Segment(1) Eliminations(2) Totals
2007: Net revenues $ 45,086.5 $ 34,938.4 $ (3,695.4) $ 76,329.5 Gross profit 13,110.6 2,997.1 16,107.7 Operating profit 2,691.3 2,102.0 4,793.3
2006: Net revenues $ 40,285.6 $ 3,691.3 $ (155.5) $ 43,821.4 Gross profit 11,283.4 458.8 11,742.2 Operating profit 2,123.5 318.1 2,441.6
2005: Net revenues $ 34,094.6 $ 2,956.7 $ (44.6) $ 37,006.7 Gross profit 9,349.1 345.5 9,694.6 Operating profit 1,797.1 222.4 2,019.5
(1) Net revenues of the Pharmacy Services Segment include approximately $4,618.2 million of Retail Co-Payments for 2007.
(2) Intersegment eliminations relate to intersegment revenues that occur when a Pharmacy Services Segment customer uses a Retail Pharmacy Segment store to purchase covered products. When this occurs, both segments record the revenue on a standalone basis.
Retail Pharmacy SegmentThe following table summarizes our Retail Pharmacy Segment’s performance for the respective periods:
Fiscal Year Ended
In millions 2007 2006 2005
Net revenues $ 45,086.5 $ 40,285.6 $ 34,094.6Gross profit 13,110.6 11,283.4 9,349.1 Gross profit % of net revenues 29.1% 28.0% 27.4%Operating expenses 10,419.3 9,159.9 7,552.0 Operating expenses % of net revenues 23.1% 22.7% 22.2%Operating profit 2,691.3 2,123.5 1,797.1 Operating profit % of net revenues 6.0% 5.3% 5.3%Net revenue increase: Total 11.9% 18.2% 18.7% Pharmacy 10.9% 17.9% 18.8% Front Store 14.0% 18.7% 18.4%Same store revenue increase:(1) Total 5.3% 8.1% 6.3% Pharmacy 5.2% 9.0% 6.7% Front Store 5.3% 6.2% 5.5%Pharmacy % of net revenues 67.8% 68.4% 68.6%Third party % of pharmacy revenue 95.3% 94.7% 94.1%Retail prescriptions filled 527.5 481.7 420.6
(1) Same store revenue increase includes the sales results of the Standalone Drug Business beginning July of fiscal 2007.

ManageMent’sDiscussionanDanalysisoffinancialconDitionanDResultsofopeRations
23 I 2007 An
nu
al Rep
ort
Net revenues. As you review our Retail Pharmacy Segment’s
performance in this area, we believe you should consider the
following important information:
• During 2006, total net revenues were significantly affected
by the acquisition of the Standalone Drug Business on June 2,
2006. Revenues from the Standalone Drug Business increased
total net revenues by approximately 4.9% and 8.7% during 2007
and 2006, respectively.
• During 2005, total net revenues were significantly affected by
the July 31, 2004 acquisition of certain assets and assumption
of certain liabilities from J.C. Penney Company, Inc. and certain
of its subsidiaries, including Eckerd Corporation (“Eckerd”). This
acquisition included more than 1,200 Eckerd retail drugstores
and Eckerd Health Services, which included Eckerd’s mail order
and pharmacy benefit management businesses (collectively, the
“2004 Acquired Businesses”). Revenues from the 2004 Acquired
Businesses increased total net revenues by approximately 11.2%
during 2005. Beginning in August 2005, same store sales include
the acquired Eckerd stores, which increased total same store
sales by approximately 110 basis points during 2006.
• Total net revenues from new stores accounted for approximately
130 basis points of our total net revenue percentage increase in
2007 and 2006 compared to 160 basis points in 2005.
• Total net revenues continued to benefit from our active
relocation program, which moves existing in-line shopping
center stores to larger, more convenient, freestanding locations.
Historically, we have achieved significant improvements in
customer count and net revenue when we do this. As such,
our relocation strategy remains an important component of
our overall growth strategy. As of December 29, 2007, approxi-
mately 64% of our existing stores were freestanding, compared
to approximately 61% and 59% at December 30, 2006 and
December 31, 2005, respectively.
• Pharmacy revenue growth continued to benefit from new
market expansions, increased penetration in existing markets,
the introduction of a prescription drug benefit under Medicare
Part D in 2006, our ability to attract and retain managed care
customers and favorable industry trends. These trends include
an aging American population; many “baby boomers” are now
in their fifties and sixties and are consuming a greater number
of prescription drugs. In addition, the increased use of pharma-
ceuticals as the first line of defense for individual healthcare
also contributed to the growing demand for pharmacy services.
We believe these favorable industry trends will continue.
• Pharmacy revenue dollars continue to be negatively impacted in
all years by the conversion of brand named drugs to equivalent
generic drugs, which typically have a lower selling price. In
addition, our pharmacy growth has also been adversely affected
by the growth of the mail order channel, a decline in the number
of significant new brand named drug introductions, higher
consumer co-payments and co-insurance arrangements and by
an increase in the number of over-the-counter remedies that
were historically only available by prescription. We may choose
not to participate in certain prescription benefit programs that
mandate filling maintenance prescriptions through a mail order
service facility or that implement pharmacy reimbursement rates
that fall below our minimum profitability standards. In the event
we elect to, for any reason, withdraw from current programs
and/or decide not to participate in future programs, we may not
be able to sustain our current rate of sales growth.
Gross profit, which includes net revenues less the cost of
merchandise sold during the reporting period and the related
purchasing costs, warehousing costs, delivery costs and actual
and estimated inventory losses, as a percentage of net revenues
was 29.1% in 2007. This compares to 28.0% in 2006 and 27.4%
in 2005.
As you review our Retail Pharmacy Segment’s performance in
this area, we believe you should consider the following important
information:
• Front store revenues increased as a percentage of total revenues
during 2007. On average our gross profit on front store revenues
is higher than our average gross profit on pharmacy revenues.
Pharmacy revenues as a percentage of total revenues were 67.8%
in 2007, compared to 68.4% in 2006 and 68.6% in 2005.
• Front store gross profit rate benefited from improved product
mix and benefits from our ExtraCare loyalty program.
• Our pharmacy gross profit rate benefited from a portion of the
significant purchasing synergies resulting from the Caremark
Merger. We expect the benefit from purchasing synergies to
continue to positively impact our pharmacy gross profit rate
through fiscal 2008.

24
I C
VS
Car
emar
k
ManageMent’sDiscussionanDanalysisoffinancialconDitionanDResultsofopeRations
• Our pharmacy gross profit rates have been adversely affected
by the efforts of managed care organizations, pharmacy benefit
managers, governmental and other third party payors to reduce
their prescription costs. In the event this trend continues, we
may not be able to sustain our current rate of revenue growth
and gross profit dollars could be adversely impacted.
Total operating expenses, which include store and administra-
tive payroll, employee benefits, store and administrative occupancy
costs, selling expenses, advertising expenses, administrative
expenses and depreciation and amortization expense increased
to 23.1% of net revenues in 2007, compared to 22.7% of net
revenues in 2006 and 22.2% of net revenues in 2005.
As you review our Retail Pharmacy Segment’s performance
in this area, we believe you should consider the following
important information:
• Total operating expenses as a percentage of net revenues
continued to be impacted by an increase in the sale of generic
drugs, which typically have a lower selling price than their
brand named equivalents.
• Total operating expenses increased as a percentage of net
revenues during 2007 and 2006, due to increased store payroll
costs, primarily driven by the Standalone Drug business, which
operates at higher costs due to the geographic locations of
the stores.
• Total operating expenses increased $60.7 million during 2006
as a result of the adoption of the SFAS No. 123(R). In addition,
total operating expenses increased due to costs incurred to
integrate the Standalone Drug Business.
• During the fourth quarter of 2006, we adopted SAB No. 108.
In connection with adopting SAB 108, we recorded adjust-
ments, which collectively reduced total operating expenses by
$40.2 million. Since the effects of the SAB 108 Adjustments
were not material to 2006 or any previously reported fiscal year,
the entire impact was recorded in the fourth quarter of 2006.
• Our pharmacy gross profit rate continued to benefit from
an increase in generic drug revenues in 2007, which normally
yield a higher gross profit rate than equivalent brand name
drug revenues. However, the increased use of generic drugs
increased the pressure from third party payors to reduce
reimbursement payments to retail pharmacies for generic drugs,
which reduced the benefit we realized from brand to generic
product conversions. We expect this trend to continue.
• Sales to customers covered by third party insurance programs
have continued to increase and, thus, have become a larger
component of our total pharmacy business. On average, our
gross profit on third party pharmacy revenues is lower than our
gross profit on cash pharmacy revenues. Third party pharmacy
revenues were 95.3% of pharmacy revenues in 2007, com-
pared to 94.7% of pharmacy revenues in 2006 and 94.1% of
pharmacy revenues in 2005. We expect this trend to continue.
• The introduction of the Federal Government’s new Medicare
Part D benefit is increasing utilization, but decreasing pharmacy
gross profit rates as higher profit business (such as cash and
state Medicaid customers) continued to migrate to Part D
coverage during 2007.
• On February 8, 2006, the President signed into law the Deficit
Reduction Act of 2005 (the “DRA”). The DRA seeks to reduce
federal spending by altering the Medicaid reimbursement
formula for multi-source (i.e., generic) drugs. According to the
Congressional Budget Office, retail pharmacies are expected
to negotiate with individual states for higher dispensing fees
to mitigate the adverse effect of these changes. These changes
were scheduled to begin to take effect during the first quarter
of 2007 and were expected to result in reduced Medicaid
reimbursement rates for retail pharmacies. During 2007, the
Centers for Medicare and Medicaid Services (“CMS”) issued
a final rule purporting to implement the new reimbursement
formula. On December 14, 2007, the U.S. District Court for
the District of Columbia preliminarily enjoined CMS from
implementing the new rule to the extent such action affects
Medicaid reimbursement rates for retail pharmacies. As a result,
implementation has been delayed indefinitely. Accordingly, the
extent of any reductions and the impact on the Company
cannot be determined at this time.

ManageMent’sDiscussionanDanalysisoffinancialconDitionanDResultsofopeRations
25 I 2007 An
nu
al Rep
ort
Pharmacy Services SegmentThe following table summarizes our Pharmacy Services Segment’s performance for the respective periods:
Fiscal Year Ended
In millions 2007 2006 2005
Net revenues $ 34,938.4 $ 3,691.3 $ 2,956.7Gross profit 2,997.1 458.8 345.5 Gross profit % of net revenues 8.6% 12.4% 11.7%Operating expenses 895.1 140.7 123.1 Operating expenses % of net revenues 2.6% 3.8% 4.2%Operating profit 2,102.0 318.1 222.4 Operating profit % of net revenues 6.0% 8.6% 7.5%Net revenues: Mail service $ 13,835.5 $ 2,935.4 Retail network 20,831.3 732.7 Other 271.6 23.2
Comparable Financial Information(1) Net revenues $ 43,349.0 $ 40,514.0 Gross profit 3,557.6 2,848.8 Gross profit % of net revenues 8.2% 7.0% Operating expenses 998.4 982.2 Operating expenses % of net revenues 2.3% 2.4% Operating profit 2,559.2 1,866.6 Operating profit % of net revenues 5.9% 4.6% Net revenues: Mail service $ 16,790.7 $ 15,519.4 Retail network 26,218.9 24,668.3 Other 339.4 326.3 Pharmacy claims processed: Total 607.2 605.9 Mail service 73.9 73.3 Retail network 533.3 532.6 Generic dispensing rate: Total 60.1% 55.8% Mail service 48.1% 43.3% Retail network 61.7% 57.4% Mail order penetration rate: 28.2% 28.0%
(1) The comparable financial information (above) combines the historical Pharmacy Services Segment results of CVS and Caremark assuming the Caremark Merger occurred at the beginning of each period presented. The historical results of Caremark are based on calendar quarter/year reporting periods, whereas the historical results of the Pharmacy Services Segment of CVS are based on a 52-week fiscal year ending on the Saturday nearest to December 31. In each period presented, the comparable results include incremental depreciation and amortization resulting from the preliminary fixed and intangible assets recorded in connection with the Caremark Merger and exclude merger-related expenses and integration expenses. The comparable financial information has been provided for illustrative purposes only and does not purport to be indicative of the actual results that would have been achieved by the combined business segment for the periods presented or that will be achieved by the combined business segment in the future.
26
I C
VS
Car
emar
k
ManageMent’sDiscussionanDanalysisoffinancialconDitionanDResultsofopeRations
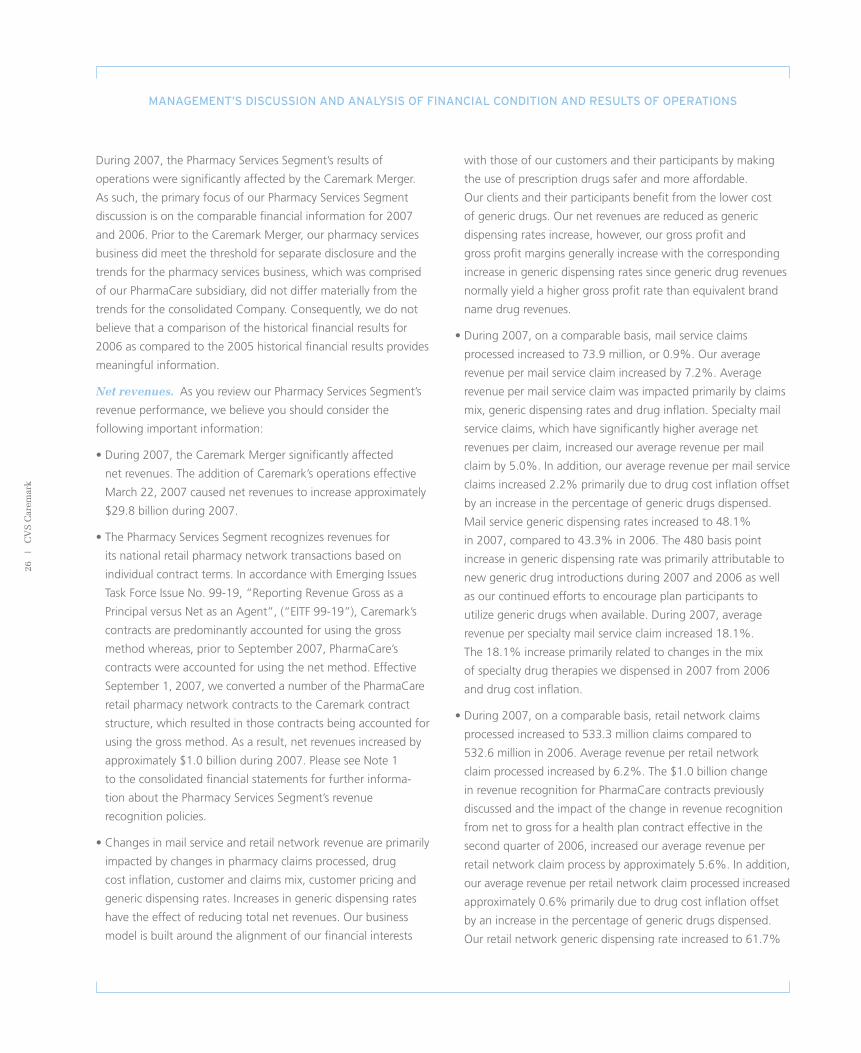
During 2007, the Pharmacy Services Segment’s results of
operations were significantly affected by the Caremark Merger.
As such, the primary focus of our Pharmacy Services Segment
discussion is on the comparable financial information for 2007
and 2006. Prior to the Caremark Merger, our pharmacy services
business did meet the threshold for separate disclosure and the
trends for the pharmacy services business, which was comprised
of our PharmaCare subsidiary, did not differ materially from the
trends for the consolidated Company. Consequently, we do not
believe that a comparison of the historical financial results for
2006 as compared to the 2005 historical financial results provides
meaningful information.
Net revenues. As you review our Pharmacy Services Segment’s
revenue performance, we believe you should consider the
following important information:
• During 2007, the Caremark Merger significantly affected
net revenues. The addition of Caremark’s operations effective
March 22, 2007 caused net revenues to increase approximately
$29.8 billion during 2007.
• The Pharmacy Services Segment recognizes revenues for
its national retail pharmacy network transactions based on
individual contract terms. In accordance with Emerging Issues
Task Force Issue No. 99-19, “Reporting Revenue Gross as a
Principal versus Net as an Agent”, (“EITF 99-19”), Caremark’s
contracts are predominantly accounted for using the gross
method whereas, prior to September 2007, PharmaCare’s
contracts were accounted for using the net method. Effective
September 1, 2007, we converted a number of the PharmaCare
retail pharmacy network contracts to the Caremark contract
structure, which resulted in those contracts being accounted for
using the gross method. As a result, net revenues increased by
approximately $1.0 billion during 2007. Please see Note 1
to the consolidated financial statements for further informa-
tion about the Pharmacy Services Segment’s revenue
recognition policies.
• Changes in mail service and retail network revenue are primarily
impacted by changes in pharmacy claims processed, drug
cost inflation, customer and claims mix, customer pricing and
generic dispensing rates. Increases in generic dispensing rates
have the effect of reducing total net revenues. Our business
model is built around the alignment of our financial interests
with those of our customers and their participants by making
the use of prescription drugs safer and more affordable.
Our clients and their participants benefit from the lower cost
of generic drugs. Our net revenues are reduced as generic
dispensing rates increase, however, our gross profit and
gross profit margins generally increase with the corresponding
increase in generic dispensing rates since generic drug revenues
normally yield a higher gross profit rate than equivalent brand
name drug revenues.
• During 2007, on a comparable basis, mail service claims
processed increased to 73.9 million, or 0.9%. Our average
revenue per mail service claim increased by 7.2%. Average
revenue per mail service claim was impacted primarily by claims
mix, generic dispensing rates and drug inflation. Specialty mail
service claims, which have significantly higher average net
revenues per claim, increased our average revenue per mail
claim by 5.0%. In addition, our average revenue per mail service
claims increased 2.2% primarily due to drug cost inflation offset
by an increase in the percentage of generic drugs dispensed.
Mail service generic dispensing rates increased to 48.1%
in 2007, compared to 43.3% in 2006. The 480 basis point
increase in generic dispensing rate was primarily attributable to
new generic drug introductions during 2007 and 2006 as well
as our continued efforts to encourage plan participants to
utilize generic drugs when available. During 2007, average
revenue per specialty mail service claim increased 18.1%.
The 18.1% increase primarily related to changes in the mix
of specialty drug therapies we dispensed in 2007 from 2006
and drug cost inflation.
• During 2007, on a comparable basis, retail network claims
processed increased to 533.3 million claims compared to
532.6 million in 2006. Average revenue per retail network
claim processed increased by 6.2%. The $1.0 billion change
in revenue recognition for PharmaCare contracts previously
discussed and the impact of the change in revenue recognition
from net to gross for a health plan contract effective in the
second quarter of 2006, increased our average revenue per
retail network claim process by approximately 5.6%. In addition,
our average revenue per retail network claim processed increased
approximately 0.6% primarily due to drug cost inflation offset
by an increase in the percentage of generic drugs dispensed.
Our retail network generic dispensing rate increased to 61.7%

ManageMent’sDiscussionanDanalysisoffinancialconDitionanDResultsofopeRations
27 I 2007 An
nu
al Rep
ort
pharmacies, customer service operations and related information
technology support. Gross profit as a percentage of revenues
was 8.6% in 2007. This compares to 12.4% in 2006 and 11.7%
in 2005.
During 2007, the Caremark Merger significantly affected our
gross profit. As you review our Pharmacy Services Segment’s
performance in this area, we believe you should consider the
following important information:
• As discussed above, our national retail network contracts are
reviewed on an individual basis to determine if the revenues
should be accounted for using the gross or net method under
applicable accounting rules. Under these rules the majority of
Caremark’s national retail network contracts are accounted for
using the gross method, resulting in increased revenues,
increased cost of revenues and lower gross profit rates. The
conversion of PharmaCare contracts to the Caremark contract
structure, effective September 2007, also resulted in increased
revenues, increased cost of revenues and lower gross profit
margins. The change in revenue recognition had no impact on
the actual gross profit amount.
• During 2007, on a comparable basis, our gross profit as a
percentage of total net revenues was 8.2%. This compares to
the gross profit as a percentage of total net revenues of 7.0%
in 2006.
• During 2007, on a comparable basis, our gross profit rate
benefited from a portion of the significant purchasing synergies
resulting from the Caremark Merger. We expect the benefit
from purchasing synergies to continue to positively impact our
pharmacy gross profit rate through fiscal 2008.
• During 2007, on a comparable basis, our gross profit rate
benefited from an increase in our generic dispensing rates.
Total generic dispensing rates increased to 60.1% in 2007,
compared to 55.8% in 2006. As previously discussed, our
net revenues are reduced as generic dispensing rates increase,
however, our gross profit and gross profit margins generally
increase with the corresponding increase in generic dispensing
rates. However, the increased use of generic drugs is increasing
the pressure from clients to reduce pharmacy reimbursement
payments for generic drugs.
in 2007, compared to 57.4% in 2006. The 430 basis point
increase in generic dispensing rate was comparable to that in
our mail service claims and is attributable to the same industry
dynamics. We anticipate that our generic dispensing rates
will increase in future periods, however, the magnitude of the
increases will be determined by new generic drug introductions
and our efforts to encourage plan participants to utilize generic
drugs when available.
• During 2007, net revenues benefited from our participation in
the administration of the Medicare Part D Drug Benefit through
the provision of PBM services to our health plan clients and
other clients that have qualified as a Medicare Part D Prescription
Drug Plan (“PDP”). We also participate (i) by offering Medicare
Part D benefits through our subsidiary, SilverScript, which has
been approved by CMS as a PDP in all regions of the country
and (ii), by assisting employer, union and other health plan
clients that qualify for the retiree drug subsidy available under
Medicare Part D by collecting and submitting eligibility and/or
drug cost data to CMS for them as required under Part D in
order to obtain the subsidy and (iii) through a joint venture with
Universal American Financial Corp. (“UAFC”), which sponsors
Prescription Pathways, an approved PDP.
Both SilverScript and Prescription Pathways were in the top
ten PDPs in the country in terms of enrollment during 2007.
Revenues related to SilverScript and our joint venture with
UAFC are comparable between 2007 and 2006. The majority
of these revenues are included in our retail network revenue
due to the high level of retail network utilization within the
Medicare Part D program.
In February 2008, the Company and UAFC agreed to dissolve
this joint venture at the end of the 2008 plan year and to
divide responsibility for providing Medicare Part D services to
the affected Prescription Pathways plan members beginning
with the 2009 plan year. The terms of this agreement are
subject to regulatory approval.
Gross profit includes net revenues less cost of revenues. Cost of
revenues includes the cost of pharmaceuticals dispensed, either
directly through our mail service and specialty retail pharmacies or
indirectly through our national retail pharmacy network, shipping
and handling costs and the operating costs of our mail service

28
I C
VS
Car
emar
k
ManageMent’sDiscussionanDanalysisoffinancialconDitionanDResultsofopeRations
We anticipate that our generic dispensing rates will increase in
future periods which benefits our customers, plan participants
and our financial performance. However, our gross profits
are continually impacted by our ability to profitably retain our
existing customers and win new business, and maintain and
enhance our drug purchase discounts from manufacturers,
wholesalers and retail pharmacies.
• During 2007, on a comparable basis, our gross profit rate was
negatively impacted by the recording of PharmaCare contracts
on a gross basis as previously discussed. The recording of these
revenues on a gross basis did not impact the actual gross profit
amount, however, it did decrease the gross profit margin.
Total operating expenses, which include selling, general
and administrative expenses (including integration and other
related expenses), depreciation and amortization related to
selling, general and administrative activities and retail specialty
pharmacy store and administrative payroll, employee benefits
and occupancy costs decreased to 2.6% of net revenues in 2007,
compared to 3.8% in 2006 and 4.2% in 2005.
As you review our Pharmacy Services Segment’s performance
in this area, we believe you should consider the following
important information:
• During 2007, the Caremark Merger significantly affected our
operating expenses. Total operating expenses for 2007 include
$81.7 million of merger, integration and other related expenses
and $162.6 million of incremental amortization expense resulting
from the preliminary intangible assets recorded in connection
with the Caremark Merger. Please see Note 2 to the consoli-
dated financial statements for additional information.
• During 2007, on a comparable basis, total operating expenses
increased 1.6% to $998.4 million or 2.3% of net revenue,
compared to $982.2 million or 2.4% of net revenue during
2006. 2007 and 2006 comparable results include incremental
depreciation and amortization resulting from the preliminary
fixed and intangible assets recorded in connection with the
Caremark Merger and exclude merger-related expenses and
integration costs.
Liquidity and Capital ResourcesWe anticipate that our cash flow from operations, supplemented
by commercial paper and long-term borrowings will continue to
fund the future growth of our business.
Net cash provided by operating activities increased to
$3.2 billion in 2007. This compares to $1.7 billion in 2006 and
$1.6 billion in 2005. The increase in net cash provided by opera-
tions during 2007 primarily resulted from increased cash receipts
from revenues due to the Caremark Merger. The increase in
net cash provided by operations during 2006 primarily resulted
from an increase in cash receipts from revenues.
Net cash used in investing activities decreased to
$3.1 billion in 2007. This compares to $4.6 billion in 2006 and
$0.9 billion in 2005. The $3.1 billion of net cash used in investing
activities during 2007 was primarily due to the Caremark Merger.
The increase in net cash used in investing activities during 2006
was primarily due to the acquisition of the Standalone Drug
Business. Gross capital expenditures totaled $1.8 billion during
2007, compared to $1.8 billion in 2006 and $1.5 billion in 2005.
During 2007, approximately 54.6% of our total capital expendi-
tures were for new store construction, 21.7% for store expansion
and improvements and 23.7% for technology and other corporate
initiatives. During 2008, we currently plan to invest over $2.0 bil-
lion in gross capital expenditures, which will include spending for
approximately 300–325 new or relocated stores.
We finance a significant portion of our new store development
program through sale-leaseback transactions. Proceeds from
sale-leaseback transactions totaled $601.3 million in 2007. This
compares to $1.4 billion in 2006, which included approximately
$800 million in proceeds associated with the sale and leaseback
of properties acquired as part of the acquisition of the Standalone
Drug Business, and $539.9 million in 2005. Under the transac-
tions, the properties are sold at net book value and the resulting
leases qualify and are accounted for as operating leases.

ManageMent’sDiscussionanDanalysisoffinancialconDitionanDResultsofopeRations
29 I 2007 An
nu
al Rep
ort
Following is a summary of our store development activity for the
respective years:
2007 2006 2005
Total stores (beginning of year) 6,205 5,474 5,378New and acquired stores 140 848 166Closed stores (44) (117) (70)Total stores (end of year) 6,301 6,205 5,474Relocated stores(1) 137 118 131
(1) Relocated stores are not included in new or closed store totals.
Net cash provided by financing activities was $0.4 billion in
2007, compared to net cash provided by financing activities of
$2.9 billion in 2006 and net cash used in financing activities of
$0.6 billion in 2005. Net cash provided by financing activities
during 2007 was primarily due to increased long-term borrowings
to fund the special cash dividend paid to Caremark shareholders
and was offset, in part, by the repayment of short-term borrow-
ings and the repurchase of common shares. Net cash provided by
financing activities during 2006 was primarily due to the financ-
ing of the acquisition of the Standalone Drug Business, including
issuance of the 2006 Notes (defined below), during the third
quarter of 2006. This increase was offset, in part, by the repay-
ment of the $300 million, 5.625% unsecured senior notes, which
matured during the first quarter of 2006. Fiscal 2005 reflected
a reduction in short-term borrowings. During 2007, we paid
common stock dividends totaling $308.8 million, or $0.22875
per common share.
We believe that our current cash on hand and cash provided by
operations, together with our ability to obtain additional short-
term and long-term financing, will be sufficient to cover our
working capital needs, capital expenditures, debt service require-
ments and dividend requirements for at least the next twelve
months and the foreseeable future.
We had $2.1 billion of commercial paper outstanding at a
weighted average interest rate of 5.1% as of December 29, 2007.
In connection with our commercial paper program, we maintain
a $675 million, five-year unsecured back-up credit facility, which
expires on June 11, 2009, a $675 million, five-year unsecured
back-up credit facility, which expires on June 2, 2010, a $1.4 bil-
lion, five-year unsecured back-up credit facility, which expires
on May 12, 2011 and a $1.3 billion, five-year unsecured back-up
credit facility, which expires on March 12, 2012. The credit
facilities allow for borrowings at various rates that are dependent
in part on our public debt rating. As of December 29, 2007, we
had no outstanding borrowings against the credit facilities.
In connection with the Caremark Merger, on March 28, 2007,
we commenced a tender offer to purchase up to 150 million
common shares, or about 10%, of our outstanding common
stock at a price of $35.00 per share. The offer to purchase
shares expired on April 24, 2007 and resulted in approximately
10.3 million shares being tendered. The shares were placed into
our treasury account.
On May 9, 2007, our Board of Directors authorized a share
repurchase program for up to $5.0 billion of our outstanding
common stock.
On May 13, 2007, we entered into a $2.5 billion fixed dollar
accelerated share repurchase agreement (the “May ASR agree-
ment”) with Lehman Brothers, Inc. (“Lehman”). The May ASR
agreement contained provisions that established the minimum
and maximum number of shares to be repurchased during the
term of the May ASR agreement. Pursuant to the terms of the
May ASR agreement, on May 14, 2007, we paid $2.5 billion to
Lehman in exchange for Lehman delivering 45.6 million shares
of common stock to us, which were placed into our treasury
account upon delivery. On June 7, 2007, upon establishment
of the minimum number of shares to be repurchased, Lehman
delivered an additional 16.1 million shares of common stock to
us. The final settlement under the May ASR agreement occurred
on October 5, 2007 and resulted in us receiving an additional
5.8 million shares of common stock during the fourth quarter
of 2007. As of December 29, 2007, the aggregate 67.5 million
shares of common stock received pursuant to the $2.5 billion
May ASR agreement had been placed into our treasury account.
On October 8, 2007, we commenced an open market repurchase
program. The program concluded on November 2, 2007 and
resulted in 5.3 million shares of common stock being repurchased
for $211.9 million. The shares were placed into our treasury
account upon delivery.
On November 6, 2007, we entered into a $2.3 billion fixed
dollar accelerated share repurchase agreement (the “November
ASR agreement”) with Lehman. The November ASR agreement
contained provisions that established the minimum and maxi-
mum number of shares to be repurchased during the term of

30
I C
VS
Car
emar
k
ManageMent’sDiscussionanDanalysisoffinancialconDitionanDResultsofopeRations
may be redeemed at any time, in whole or in part at a defined
redemption price plus accrued interest. Net proceeds from the
2006 Notes were used to repay a portion of the outstanding
commercial paper issued to finance the Standalone Drug
Business. To manage a portion of the risk associated with
potential changes in market interest rates, during the second
quarter of 2006 we entered into forward starting pay fixed rate
swaps (the “Swaps”), with a notional amount of $750 million.
The Swaps settled in conjunction with the placement of the long-
term financing. As of December 29, 2007 and December 30,
2006, we had no freestanding derivatives in place.
Our credit facilities, unsecured senior notes and ECAPS contain
customary restrictive financial and operating covenants. These
covenants do not include a requirement for the acceleration of
our debt maturities in the event of a downgrade in our credit
rating. We do not believe the restrictions contained in these
covenants materially affect our financial or operating flexibility.
As of December 29, 2007, our long-term debt was rated “Baa2”
by Moody’s and “BBB+” by Standard & Poor’s, and our commer-
cial paper program was rated “P-2” by Moody’s and “A-2” by
Standard & Poor’s. Upon completion of the Caremark Merger,
Standard & Poor’s raised the Company’s credit watch outlook
from negative to stable. On May 21, 2007, Moody’s also raised
the Company’s credit watch from negative to stable. In assessing
our credit strength, we believe that both Moody’s and Standard &
Poor’s considered, among other things, our capital structure and
financial policies as well as our consolidated balance sheet, our
acquisition of the Standalone Drug Business, the Caremark
Merger and other financial information. Although we currently
believe our long-term debt ratings will remain investment grade,
we cannot guarantee the future actions of Moody’s and/or
Standard & Poor’s. Our debt ratings have a direct impact on our
future borrowing costs, access to capital markets and new store
operating lease costs.
Off-Balance Sheet ArrangementsIn connection with executing operating leases, we provide a
guarantee of the lease payments. We finance a portion of our
new store development through sale-leaseback transactions,
which involve selling stores to unrelated parties and then leasing
the stores back under leases that qualify and are accounted for
as operating leases. We do not have any retained or contingent
the November ASR agreement. Pursuant to the terms of the
November ASR agreement, on November 7, 2007, we paid
$2.3 billion to Lehman in exchange for Lehman delivering
37.2 million shares of common stock to us, which were placed
into our treasury account upon delivery. On November 26, 2007,
upon establishment of the minimum number of shares to be
repurchased, Lehman delivered an additional 14.4 million shares
of common stock to us. As of December 29, 2007, the aggregate
51.6 million shares of common stock received pursuant to the
November ASR agreement had been placed into our treasury
account. We may receive up to 5.7 million additional shares of
common stock, depending on the market price of the common
stock, as determined under the November ASR agreement, over
the term of the November ASR agreement, which is currently
expected to conclude during the first quarter of 2008.
Accordingly, the $5.0 billion share repurchase program authorized
by our Board of Directors has been completed pending the final
settlement of the November ASR agreement discussed previously.
We will, however, continue to evaluate alternatives for optimizing
our capital structure on an ongoing basis.
On May 22, 2007, we issued $1.75 billion of floating rate senior
notes due June 1, 2010, $1.75 billion of 5.75% unsecured senior
notes due June 1, 2017, and $1.0 billion of 6.25% unsecured
senior notes due June 1, 2027 (collectively the “2007 Notes”).
Also on May 22, 2007, we entered into an underwriting
agreement with Lehman Brothers, Inc., Morgan Stanley & Co.
Incorporated, Banc of America Securities LLC, BNY Capital
Markets, Inc., and Wachovia Capital Markets, LLC, as representa-
tives of the underwriters pursuant to which we agreed to issue
and sell $1.0 billion of Enhanced Capital Advantaged Preferred
Securities (“ECAPS”) due June 1, 2062 to the underwriters.
The ECAPS bear interest at 6.302% per year until June 1, 2012
at which time they will pay interest based on a floating rate. The
2007 Notes and the ECAPS pay interest semi-annually and may
be redeemed at any time, in whole or in part at a defined redemp-
tion price plus accrued interest. The net proceeds from the 2007
Notes and ECAPS were used to repay the bridge credit facility and
a portion of the outstanding commercial paper borrowings.
On August 15, 2006, we issued $800 million of 5.75% unsecured
senior notes due August 15, 2011 and $700 million of 6.125%
unsecured senior notes due August 15, 2016 (collectively the
“2006 Notes”). The 2006 Notes pay interest semi-annually and

ManageMent’sDiscussionanDanalysisoffinancialconDitionanDResultsofopeRations
31 I 2007 An
nu
al Rep
ort
become insolvent and failed to make the required payments
under a store lease, we could be required to satisfy these
obligations. Assuming that each respective purchaser became
insolvent, and we were required to assume all of these lease
obligations, we estimate that we could settle the obligations for
approximately $325 million to $375 million as of December 29,
2007. As of December 29, 2007, we guaranteed approximately
220 such store leases, with the maximum remaining lease term
extending through 2022.
We currently believe that the ultimate disposition of any of the
lease guarantees will not have a material adverse effect on our
consolidated financial condition, results of operations or future
cash flows.
interests in the stores, and we do not provide any guarantees,
other than a guarantee of the lease payments, in connection with
the transactions. In accordance with generally accepted account-
ing principles, our operating leases are not reflected in our
consolidated balance sheet.
Between 1991 and 1997, we sold or spun off a number of
subsidiaries, including Bob’s Stores, Linens ’n Things, Marshalls,
Kay-Bee Toys, Wilsons, This End Up and Footstar. In many cases,
when a former subsidiary leased a store, we provided a guarantee
of the store’s lease obligations. When the subsidiaries were
disposed of, the guarantees remained in place, although each
initial purchaser agreed to indemnify us for any lease obligations
we were required to satisfy. If any of the purchasers were to
Following is a summary of our significant contractual obligations as of December 29, 2007:
Payments Due by Period WithinIn millions Total 1Year 1–3Years 3–5Years After5YearsOperating leases $ 22,090.6 $ 1,584.5 $ 3,202.8 $ 2,918.7 $ 14,384.6Long-term debt 8,251.7 45.5 2,402.4 1,802.7 4,001.1Other long-term liabilities reflected in our consolidated balance sheet 398.8 77.0 235.4 22.5 63.9Capital lease obligations 145.1 1.6 4.1 5.5 133.9 $ 30,886.2 $ 1,708.6 $ 5,844.7 $ 4,749.4 $ 18,583.5
Critical Accounting PoliciesWe prepare our consolidated financial statements in conformity
with generally accepted accounting principles, which require
management to make certain estimates and apply judgment.
We base our estimates and judgments on historical experience,
current trends and other factors that management believes to be
important at the time the consolidated financial statements are
prepared. On a regular basis, we review our accounting policies
and how they are applied and disclosed in our consolidated
financial statements. While we believe the historical experience,
current trends and other factors considered support the prepara-
tion of our consolidated financial statements in conformity with
generally accepted accounting principles, actual results could
differ from our estimates, and such differences could be material.
Our significant accounting policies are discussed in Note 1 to
our consolidated financial statements. We believe the following
accounting policies include a higher degree of judgment and/or
complexity and, thus, are considered to be critical accounting
policies. The critical accounting policies discussed below are
applicable to both of our business segments. We have discussed
the development and selection of our critical accounting policies
with the Audit Committee of our Board of Directors and the Audit
Committee has reviewed our disclosures relating to them.
Goodwill and Intangible Assets We account for goodwill and intangible assets in accordance with
SFAS No. 141, “Business Combinations,” SFAS No. 142, “Goodwill
and Other Intangible Assets” and SFAS No. 144, “Accounting for
the Impairment or Disposal of Long-Lived Assets.”
Identifiable intangible assets consist primarily of trademarks,
customer contracts and relationships, favorable and unfavorable
leases and covenants not to compete. These intangible assets
arise primarily from the allocation of the purchase price of
businesses acquired to identifiable intangible assets based on
their respective fair market values at the date of acquisition.

32
I C
VS
Car
emar
k
ManageMent’sDiscussionanDanalysisoffinancialconDitionanDResultsofopeRations
Amounts assigned to identifiable intangible assets, and their
related useful lives, are derived from established valuation
techniques and management estimates. Goodwill represents the
excess of amounts paid for acquisitions over the fair market value
of the net identifiable assets acquired.
We evaluate the recoverability of certain long-lived assets,
including intangible assets with finite lives, but excluding goodwill
and intangible assets with indefinite lives, which are tested for
impairment using separate tests, whenever events or changes in
circumstances indicate that the carrying value of an asset may not
be recoverable. We group and evaluate these long-lived assets for
impairment at the lowest level at which individual cash flows can
be identified. When evaluating these long-lived assets for potential
impairment, we first compare the carrying amount of the asset
group to the asset group’s estimated future cash flows (undis-
counted and without interest charges). If the estimated future
cash flows are less than the carrying amount of the asset group,
an impairment loss calculation is prepared. The impairment loss
calculation compares the carrying amount of the asset group to
the asset group’s estimated future cash flows (discounted and
with interest charges). If required, an impairment loss is recorded
for the portion of the asset group’s carrying value that exceeds the
asset group’s estimated future cash flows (discounted and with
interest charges).
Our long-lived asset impairment loss calculation contains uncer-
tainty since we must use judgment to estimate each asset group’s
future sales, profitability and cash flows. When preparing these
estimates, we consider historical results and current operating
trends and our consolidated sales, profitability and cash flow
results and forecasts.
These estimates can be affected by a number of factors including,
but not limited to, general economic conditions, efforts of third
party organizations to reduce their prescription drug costs and/or
increased member co-payments, the continued efforts of competi-
tors to gain market share and consumer spending patterns.
Goodwill and indefinitely-lived intangible assets are subject to
impairment reviews annually, or if changes or events indicate the
carrying value may not be recoverable.
Indefinitely-lived intangible assets are tested by comparing
the estimated fair value of the asset to its carrying value. If the
carrying value of the asset exceeds its estimated fair value, an
impairment loss is recognized and the asset is written down to
its estimated fair value.
Our indefinitely-lived intangible asset impairment loss calculation
contains uncertainty since we must use judgment to estimate
the fair value based on the assumption that in lieu of ownership
of an intangible asset, the Company would be willing to pay
a royalty in order to utilize the benefits of the asset. Value is
estimated by discounting the hypothetical royalty payments to
their present value over the estimated economic life of the asset.
These estimates can be affected by a number of factors including,
but not limited to, general economic conditions, availability of
market information as well as the profitability of the Company.
Goodwill is tested on a reporting unit basis using the expected
present value of future cash flows. In accordance with SFAS 142,
goodwill impairment is determined using a two-step process.
The first step of the impairment test is to identify potential
impairment by comparing the reporting unit’s fair value with its
net book value (or carrying amount), including goodwill. If the
fair value of the reporting unit exceeds its carrying amount, the
reporting unit’s goodwill is not considered to be impaired and
the second step of the impairment test is not performed. If the
carrying amount of the reporting unit’s carrying amount exceeds
its fair value, the second step of the impairment test is performed
to measure the amount of impairment loss, if any. The second
step of the impairment test compares the implied fair value of
the reporting unit’s goodwill with the carrying amount of the
goodwill. If the carrying amount of the reporting unit’s goodwill
exceeds the implied fair value of the goodwill, an impairment loss
is recognized in an amount equal to that excess.
Our impairment loss calculation contains uncertainty since
we must use judgment to estimate each reporting unit’s future
revenues, profitability and cash flows. When preparing these
estimates, we consider each reporting unit’s historical results and
current operating trends and our consolidated revenues, profit-
ability and cash flow results and forecasts. These estimates can be
affected by a number of factors including, but not limited to,
general economic conditions, efforts of third party organizations
to reduce their prescription drug costs and/or increase member
co-payments, the continued efforts of competitors to gain market
share and consumer spending patterns.

ManageMent’sDiscussionanDanalysisoffinancialconDitionanDResultsofopeRations
33 I 2007 An
nu
al Rep
ort
The carrying value of goodwill and intangible assets covered
by this critical accounting policy was $34.4 billion as of
December 29, 2007. We did not record any impairment losses
related to goodwill or intangible assets during 2007, 2006
or 2005. Although we believe we have sufficient current and
historical information available to us to test for impairment, it
is possible that actual cash flows could differ from the estimated
cash flows used in our impairment tests. Due to the nature
of the uncertainties discussed above, we cannot determine a
reasonably likely change.
We have not made any material changes in the methodologies
utilized to test the carrying values of goodwill and intangible
assets for impairment during the past three years.
Closed Store Lease LiabilityWe account for closed store lease termination costs in accordance
with SFAS No. 146, “Accounting for Costs Associated with Exit
or Disposal Activities,” subsequent to its adoption in 2003. As
such, when a leased store is closed, we record a liability for the
estimated present value of the remaining obligation under the
non-cancelable lease, which includes future real estate taxes,
common area maintenance and other charges, if applicable.
The liability is reduced by estimated future sublease income.
The initial calculation and subsequent evaluations of our closed store
lease liability contain uncertainty since we must use judgment to
estimate the timing and duration of future vacancy periods, the
amount and timing of future lump sum settlement payments
and the amount and timing of potential future sublease income.
When estimating these potential termination costs and their
related timing, we consider a number of factors, which include,
but are not limited to, historical settlement experience, the owner
of the property, the location and condition of the property, the
terms of the underlying lease, the specific marketplace demand
and general economic conditions.
Our total closed store lease liability covered by this critical
accounting policy was $441.2 million as of December 29, 2007.
This amount is net of $263.0 million of estimated sublease
income that is subject to the uncertainties discussed above.
Although we believe we have sufficient current and historical
information available to us to record reasonable estimates for
sublease income, it is possible that actual results could differ.
In order to help you assess the risk, if any, associated with
the uncertainties discussed above, a ten percent (10%) pre-tax
change in our estimated sublease income, which we believe
is a reasonably likely change, would increase or decrease our
total closed store lease liability by about $26.3 million as of
December 29, 2007.
We have not made any material changes in the reserve method-
ology used to record closed store lease reserves during the past
three years.
Self-Insurance LiabilitiesWe are self-insured for certain losses related to general liability,
workers’ compensation and auto liability, although we maintain
stop loss coverage with third party insurers to limit our total
liability exposure. We are also self-insured for certain losses
related to health and medical liabilities.
The estimate of our self-insurance liability contains uncertainty
since we must use judgment to estimate the ultimate cost that
will be incurred to settle reported claims and unreported claims
for incidents incurred but not reported as of the balance sheet
date. When estimating our self-insurance liability, we consider
a number of factors, which include, but are not limited to,
historical claim experience, demographic factors, severity factors
and valuations provided by independent third party actuaries.
On a quarterly basis, we review our assumptions with our
independent third party actuaries to determine if our self-
insurance liability is adequate as it relates to our general liability,
workers’ compensation and auto liability. Similar reviews are
conducted semi-annually to determine that our self insurance
liability is adequate for our health and medical liability.
Our total self-insurance liability covered by this critical account-
ing policy was $328.6 million as of December 29, 2007. Although
we believe we have sufficient current and historical information
available to us to record reasonable estimates for our self-insurance
liability, it is possible that actual results could differ. In order to help
you assess the risk, if any, associated with the uncertainties discussed
above, a ten percent (10%) pre-tax change in our estimate for
our self-insurance liability, which we believe is a reasonably likely
change, would increase or decrease our self-insurance liability by
about $32.9 million as of December 29, 2007.

34
I C
VS
Car
emar
k
ManageMent’sDiscussionanDanalysisoffinancialconDitionanDResultsofopeRations
We have not made any material changes in the accounting
methodology used to establish our self-insurance liability
during the past three years.
InventoryOur inventory is stated at the lower of cost or market on a
first-in, first-out basis using the retail method of accounting to
determine cost of sales and inventory in our stores, average
cost to determine cost of sales and inventory in our mail service
and specialty pharmacies and the cost method of accounting
to determine inventory in our distribution centers. Under the
retail method, inventory is stated at cost, which is determined
by applying a cost-to-retail ratio to the ending retail value of our
inventory. Since the retail value of our inventory is adjusted on
a regular basis to reflect current market conditions, our carrying
value should approximate the lower of cost or market. In
addition, we reduce the value of our ending inventory for
estimated inventory losses that have occurred during the interim
period between physical inventory counts. Physical inventory
counts are taken on a regular basis in each location (other than
in six distribution centers, which perform a continuous cycle
count process to validate the inventory balance on hand) to
ensure that the amounts reflected in the consolidated financial
statements are properly stated.
The accounting for inventory contains uncertainty since we must
use judgment to estimate the inventory losses that have occurred
during the interim period between physical inventory counts.
When estimating these losses, we consider a number of factors,
which include, but are not limited to, historical physical inventory
results on a location-by-location basis and current physical
inventory loss trends.
Our total reserve for estimated inventory losses covered by this
critical accounting policy was $135.1 million as of December 29,
2007. Although we believe we have sufficient current and
historical information available to us to record reasonable
estimates for estimated inventory losses, it is possible that actual
results could differ. In order to help you assess the aggregate risk,
if any, associated with the uncertainties discussed above, a ten
percent (10%) pre-tax change in our estimated inventory losses,
which we believe is a reasonably likely change, would increase or
decrease our total reserve for estimated inventory losses by about
$13.5 million as of December 29, 2007.
We have not made any material changes in the accounting
methodology used to establish our inventory loss reserves
during the past three years.
Although we believe that the estimates discussed above are
reasonable and the related calculations conform to generally
accepted accounting principles, actual results could differ from
our estimates, and such differences could be material.
Recent Accounting Pronouncements We adopted Financial Accounting Standards Board Interpretation
(“FIN”) No. 48, “Accounting for Uncertainty in Income Taxes – an
interpretation of FASB Statement No. 109” effective December 31,
2006. FIN No. 48 addresses the uncertainty about how certain
income tax positions taken or expected to be taken on an
income tax return should be reflected in the financial statements
before they are finally resolved. As a result of the implementa-
tion, the Company recognized a decrease to reserves for
uncertain income tax positions of approximately $4.0 million,
which was accounted for as an increase to the December 31,
2006 balance of retained earnings.
We adopted SFAS No. 157, “Fair Value Measurement.” SFAS
No. 157 defines fair value, establishes a framework for measuring
fair value in generally accepted accounting principles and expands
disclosures regarding fair value measurements. SFAS No. 157
was effective for fiscal years beginning after November 15, 2007
and interim periods within those fiscal years. The adoption of
this statement did not have a material impact on our consolidated
results of operations, financial position or cash flows.
In June 2006, the Emerging Issues Task Force of the Financial
Accounting Standards Board (“FASB”) reached a consensus on
EITF Issue No. 06-4, “Accounting for Deferred Compensation
and Postretirement Benefit Aspects of Endorsement Split-Dollar
Life Insurance Arrangements” (“EITF 06-4”), which requires
the application of the provisions of SFAS No. 106, “Employers’
Accounting for Postretirement Benefits Other Than Pensions”
(“SFAS 106”) (if, in substance, a postretirement benefit plan
exists), or Accounting Principles Board Opinion No. 12 (if the
arrangement is, in substance, an individual deferred compensa-
tion contract) to endorsement split-dollar life insurance
arrangements. SFAS 106 would require us to recognize a liability
for the discounted value of the future premium benefits that we
ManageMent’sDiscussionanDanalysisoffinancialconDitionanDResultsofopeRations
35 I 2007 An
nu
al Rep
ort
will incur through the death of the underlying insureds. EITF 06-4
is currently effective for fiscal years beginning after December 15,
2007. We are currently evaluating the potential impact the
adoption of EITF 06-4 may have on our consolidated results of
operations, financial position and cash flows.
In March 2007, the FASB issued Emerging Issues Task Force Issue
No. 06–10 “Accounting for Collateral Assignment Split-Dollar
Life Insurance Agreements” (“EITF 06-10”). EITF 06-10 provides
guidance for determining a liability for the postretirement benefit
obligation as well as recognition and measurement of the associ-
ated asset on the basis of the terms of the collateral assignment
agreement. EITF 06-10 is effective for fiscal years beginning after
December 15, 2007. We are currently evaluating the potential
impact the adoption of EITF 06-10 may have on our consolidated
results of operations, financial position and cash flows.
In December 2007, the FASB issued SFAS No. 141 (revised 2007),
“Business Combinations” (“SFAS 141R”), which replaces FASB
Statement No. 141. SFAS 141R establishes the principles and
requirements for how an acquirer recognizes and measures in its
financial statements the identifiable assets acquired, the liabilities
assumed, any non controlling interest in the acquiree and the
goodwill acquired. The Statement also establishes disclosure
requirements which will enable users to evaluate the nature and
financial effects of business combinations. SFAS 141R is effective
for fiscal years beginning after December 15, 2008. As of
December 29, 2007, the Company has $176.6 million of unrecog-
nized tax benefits (after considering the federal benefit of state
taxes) related to business combinations that be would treated
as an adjustment to the purchase price allocation if they were
recognized under SFAS No. 141. Upon adopting SFAS 141R,
the remaining balance, if any, of these unrecognized tax benefits
would affect the Company’s effective income tax rate if they
were recognized. The Company is currently evaluating the other
potential impacts, if any, the adoption of SFAS 141R may have
on its consolidated results of operations, financial position and
cash flows.
Cautionary Statement Concerning Forward-Looking StatementsThe Private Securities Litigation Reform Act of 1995 (the
“Reform Act”) provides a safe harbor for forward-looking
statements made by or on behalf of CVS Caremark Corporation.
The Company and its representatives may, from time to time,
make written or verbal forward-looking statements, including
statements contained in the Company’s filings with the Securities
and Exchange Commission and in its reports to stockholders.
Generally, the inclusion of the words “believe,” “expect,”
“intend,” “estimate,” “project,” “anticipate,” “will,” “should”
and similar expressions identify statements that constitute
forward-looking statements. All statements addressing operating
performance of CVS Caremark Corporation or any subsidiary,
events or developments that the Company expects or anticipates
will occur in the future, including statements relating to revenue
growth, earnings or earnings per common share growth, free
cash flow, debt ratings, inventory levels, inventory turn and loss
rates, store development, relocations and new market entries,
as well as statements expressing optimism or pessimism about
future operating results or events, are forward-looking statements
within the meaning of the Reform Act.
The forward-looking statements are and will be based upon
management’s then-current views and assumptions regarding
future events and operating performance, and are applicable
only as of the dates of such statements. The Company under-
takes no obligation to update or revise any forward-looking
statements, whether as a result of new information, future
events, or otherwise.
By their nature, all forward-looking statements involve risks and
uncertainties. Actual results may differ materially from those
contemplated by the forward-looking statements for a number
of reasons, including but not limited to:
• Our ability to realize the incremental revenues, synergies and
other benefits from the Caremark Merger as expected, and to
successfully integrate the Caremark businesses in accordance
with the expected timing;

36
I C
VS
Car
emar
k
ManageMent’sDiscussionanDanalysisoffinancialconDitionanDResultsofopeRations
• The continued efforts of health maintenance organizations,
managed care organizations, pharmacy benefit management
companies and other third party payors to reduce prescription
drug costs and pharmacy reimbursement rates, particularly
with respect to generic pharmaceuticals;
• The possibility of client loss and/or the failure to win new
client business;
• The frequency and rate of introduction of successful new
prescription drugs as well as generic alternatives to existing
brand drugs;
• The effect on our Pharmacy Services business of a declining
margin environment attributable to increased competition in
the pharmacy benefit management industry and increased
client demands for lower prices, enhanced service offerings
and/or higher service levels;
• Risks related to our inability to earn and retain purchase
discounts and/or rebates from pharmaceutical manufacturers
at current levels;
• Risks regarding the impact of the new Medicare prescription
drug benefit on our business;
• Risks related to the change in industry pricing benchmarks that
could adversely affect our financial performance;
• Increased competition from other drugstore chains, supermarkets,
discount retailers, membership clubs and Internet companies, as
well as changes in consumer preferences or loyalties;
• Litigation, legislative and regulatory risks associated with our
business or the retail pharmacy business and/or pharmacy
benefit management industry generally;
• The risks relating to changes in laws and regulations, including
changes in accounting standards and taxation requirements
(including tax rate changes, new tax laws and revised tax
law interpretations);
• The risks relating to adverse developments in the healthcare or
pharmaceutical industry generally, including, but not limited to,
developments in any investigation related to the pharmaceutical
industry that may be conducted by any governmental authority;
• The strength of the economy in general or in the markets
we serve, which may impact consumer purchasing power,
preferences and/or spending patterns, our ability to attract,
hire and retain suitable pharmacists, management, and other
employees, our ability to establish effective advertising,
marketing and promotional programs, our ability to obtain
necessary financing on acceptable terms and our ability to
secure suitable store locations under acceptable terms; and
• Other risks and uncertainties detailed from time to time in our
filings with the Securities and Exchange Commission.
The foregoing list is not exhaustive. There can be no assurance
that the Company has correctly identified and appropriately
assessed all factors affecting its business. Additional risks and
uncertainties not presently known to the Company or that it
currently believes to be immaterial also may adversely impact the
Company. Should any risks and uncertainties develop into actual
events, these developments could have material adverse effects
on the Company’s business, financial condition and results of
operations. For these reasons, you are cautioned not to place
undue reliance on the Company’s forward-looking statements.
37 I 2007 An
nu
al Rep
ort
ManageMent’sRepoRtoninteRnalcontRoloveRfinancialRepoRting
We are responsible for establishing and maintaining effective internal control over financial reporting. Our Company’s internal control over financial reporting includes those policies and procedures that pertain to the Company’s ability to record, process, summarize and report a system of internal accounting controls and procedures to provide reasonable assurance, at an appropriate cost/benefit relationship, that the unauthorized acquisition, use or disposition of assets are prevented or timely detected and that transactions are authorized, recorded and reported properly to permit the preparation of financial statements in accordance with generally accepted accounting principles (GAAP) and receipt and expenditures are duly authorized. In order to ensure the Company’s internal control over financial reporting is effective, management regularly assesses such controls and did so most recently for its financial reporting as of December 29, 2007.
We conduct an evaluation of the effectiveness of our internal controls over financial reporting based on the framework in Internal Control – Integrated Framework issued by the Committee of Sponsoring Organizations of the Treadway Commission. This evaluation included review of the documentation, evaluation of the design effectiveness and testing of the operating effectiveness of controls. Our system of internal control over financial reporting is enhanced by periodic reviews by our internal auditors, written policies and procedures and a written Code of Conduct adopted by our Company’s Board of Directors, applicable to all employees of our Company. In addition, we have an internal Disclosure Committee, comprised of management from each functional area within the Company, which performs a separate review of our disclosure controls and procedures. There are inherent limitations in the effectiveness of any system of internal controls over financial reporting.
Based on our evaluation, we conclude our Company’s internal control over financial reporting is effective and provides reasonable assur-ance that assets are safeguarded and that the financial records are reliable for preparing financial statements as of December 29, 2007.
Ernst & Young LLP, independent registered public accounting firm, is appointed by the Board of Directors and ratified by our Company’s shareholders. They were engaged to render an opinion regarding the fair presentation of our consolidated financial statements as well as conducting a review of the system of internal accounting controls. Their accompanying report is based upon an audit conducted in accordance with the Public Company Accounting Oversight Board (United States).
February 25, 2008

38
I C
VS
Car
emar
k
RepoRtofinDepenDentRegisteReDpublicaccountingfiRM
The Board of Directors and Shareholders CVS Caremark Corporation
We have audited CVS Caremark Corporation’s internal control over financial reporting as of December 29, 2007, based on criteria established in Internal Control – Integrated Framework issued by the Committee of Sponsoring Organizations of the Treadway Commission (the COSO criteria). CVS Caremark Corporation’s management is responsible for maintaining effective internal control over financial reporting, and for its assessment of the effectiveness of internal control over financial reporting included in the accompa-nying Management’s Report on Internal Control Over Financial Reporting. Our responsibility is to express an opinion on the Company’s internal control over financial reporting based on our audit.
We conducted our audit in accordance with the standards of the Public Company Accounting Oversight Board (United States). Those standards require that we plan and perform the audit to obtain reasonable assurance about whether effective internal control over financial reporting was maintained in all material respects. Our audit included obtaining an understanding of internal control over financial reporting, assessing the risk that a material weakness exists, testing and evaluating the design and operating effectiveness of internal control based on the assessed risk, and performing such other procedures as we considered necessary in the circumstances. We believe that our audit provides a reasonable basis for our opinion.
A company’s internal control over financial reporting is a process designed to provide reasonable assurance regarding the reliability of financial reporting and the preparation of financial statements for external purposes in accordance with generally accepted accounting principles. A company’s internal control over financial reporting includes those policies and procedures that (1) pertain to the mainte-nance of records that, in reasonable detail, accurately and fairly reflect the transactions and dispositions of the assets of the company; (2) provide reasonable assurance that transactions are recorded as necessary to permit preparation of financial statements in accordance with generally accepted accounting principles, and that receipts and expenditures of the company are being made only in accordance with authorizations of management and directors of the company; and (3) provide reasonable assurance regarding prevention or timely detection of unauthorized acquisition, use, or disposition of the company’s assets that could have a material effect on the financial statements.
Because of its inherent limitations, internal control over financial reporting may not prevent or detect misstatements. Also, projections of any evaluation of effectiveness to future periods are subject to the risk that controls may become inadequate because of changes in conditions, or that the degree of compliance with the policies or procedures may deteriorate.
In our opinion, CVS Caremark Corporation maintained, in all material respects, effective internal control over financial reporting as of December 29, 2007, based on the COSO criteria.
We also have audited, in accordance with the standards of the Public Company Accounting Oversight Board (United States), the consolidated balance sheet of CVS Caremark Corporation as of December 29, 2007, and the related consolidated statements of operations, shareholders’ equity and cash flows for the fifty-two week period ended December 29, 2007 and our report dated February 25, 2008 expressed an unqualified opinion thereon.
Boston, Massachusetts February 25, 2008

39 I 2007 An
nu
al Rep
ort
consoliDateDstateMentsofopeRations
FiscalYearEnded Fiscal Year Ended Fiscal Year Ended Dec.29,2007 Dec. 30, 2006 Dec. 31, 2005 In millions, except per share amounts (52weeks) (52 weeks) (52 weeks)
Net revenues $ 76,329.5 $ 43,821.4 $ 37,006.7Cost of revenues 60,221.8 32,079.2 27,312.1 Gross profit 16,107.7 11,742.2 9,694.6Total operating expenses 11,314.4 9,300.6 7,675.1Operating profit 4,793.3 2,441.6 2,019.5Interest expense, net 434.6 215.8 110.5Earnings before income tax provision 4,358.7 2,225.8 1,909.0Income tax provision 1,721.7 856.9 684.3Net earnings 2,637.0 1,368.9 1,224.7Preference dividends, net of income tax benefit 14.2 13.9 14.1Net earnings available to common shareholders $ 2,622.8 $ 1,355.0 $ 1,210.6
BAsicEArningspErcommonshArE: Net earnings $ 1.97 $ 1.65 $ 1.49 Weighted average common shares outstanding 1,328.2 820.6 811.4
DiluTEDEArningspErcommonshArE: Net earnings $ 1.92 $ 1.60 $ 1.45 Weighted average common shares outstanding 1,371.8 853.2 841.6Dividends declared per common share $ 0.22875 $ 0.15500 $ 0.14500
See accompanying notes to consolidated financial statements.

40
I C
VS
Car
emar
k
consoliDateDbalancesheets
In millions, except per share amounts Dec.29,2007 Dec. 30, 2006
AssETs: Cash and cash equivalents $ 1,056.6 $ 530.7 Short-term investments 27.5 – Accounts receivable, net 4,579.6 2,381.7 Inventories 8,008.2 7,108.9 Deferred income taxes 329.4 274.3 Other current assets 148.1 100.2 Total current assets 14,149.4 10,395.8 Property and equipment, net 5,852.8 5,333.6 Goodwill 23,922.3 3,195.2 Intangible assets, net 10,429.6 1,318.2 Deferred income taxes – 90.8 Other assets 367.8 240.5 Total assets $ 54,721.9 $ 20,574.1
liABiliTiEs: Accounts payable $ 3,593.0 $ 2,521.5 Claims and discounts payable 2,484.3 346.3 Accrued expenses 2,556.8 1,950.2 Short-term debt 2,085.0 1,842.7 Current portion of long-term debt 47.2 344.3 Total current liabilities 10,766.3 7,005.0 Long-term debt 8,349.7 2,870.4 Deferred income taxes 3,426.1 – Other long-term liabilities 857.9 781.1
Commitments and contingencies (Note 11)
shArEholDErs’EquiTY: Preferred stock, $0.01 par value: authorized 120,619 shares; no shares issued or outstanding – – Preference stock, series one ESOP convertible, par value $1.00: authorized 50,000,000 shares; issued and outstanding 3,798,000 shares at December 29, 2007 and 3,990,000 shares at December 30, 2006 203.0 213.3 Common stock, par value $0.01: authorized 3,200,000,000 shares; issued 1,590,139,000 shares at December 29, 2007 and 847,266,000 shares at December 30, 2006 15.9 8.5 Treasury stock, at cost: 153,682,000 shares at December 29, 2007 and 21,529,000 shares at December 30, 2006 (5,620.4) (314.5) Shares held in trust, 9,224,000 shares at December 29, 2007 (301.3) – Guaranteed ESOP obligation (44.5) (82.1) Capital surplus 26,831.9 2,198.4 Retained earnings 10,287.0 7,966.6 Accumulated other comprehensive loss (49.7) (72.6) Total shareholders’ equity 31,321.9 9,917.6 Total liabilities and shareholders’ equity $ 54,721.9 $ 20,574.1
See accompanying notes to consolidated financial statements.

41 I 2007 An
nu
al Rep
ort
consoliDateDstateMentsofcashflows
FiscalYearEnded Fiscal Year Ended Fiscal Year Ended Dec.29,2007 Dec. 30, 2006 Dec. 31, 2005 In millions (52weeks) (52 weeks) (52 weeks)
cAshFloWsFromopErATingAcTiviTiEs: Cash receipts from revenues $ 61,986.3 $ 43,273.7 $ 36,923.1 Cash paid for inventory (45,772.6) (31,422.1) (26,403.9) Cash paid to other suppliers and employees (10,768.6) (9,065.3) (8,186.7) Interest and dividends received 33.6 15.9 6.5 Interest paid (468.2) (228.1) (135.9) Income taxes paid (1,780.8) (831.7) (591.0)Net cash provided by operating activities 3,229.7 1,742.4 1,612.1
cAshFloWsFrominvEsTingAcTiviTiEs: Additions to property and equipment (1,805.3) (1,768.9) (1,495.4) Proceeds from sale-leaseback transactions 601.3 1,375.6 539.9 Acquisitions (net of cash acquired) and other investments (1,983.3) (4,224.2) 12.1 Cash outflow from hedging activities – (5.3) – Proceeds from sale or disposal of assets 105.6 29.6 31.8Net cash used in investing activities (3,081.7) (4,593.2) (911.6)
cAshFloWsFromFinAncingAcTiviTiEs: Additions to/(reductions in) short-term debt 242.3 1,589.3 (632.2) Additions to long-term debt 6,000.0 1,500.0 16.5 Reductions in long-term debt (821.8) (310.5) (10.5) Dividends paid (322.4) (140.9) (131.6) Proceeds from exercise of stock options 552.4 187.6 178.4 Excess tax benefits from stock based compensation 97.8 42.6 – Repurchase of common stock (5,370.4) – –Net cash provided by (used in) financing activities 377.9 2,868.1 (579.4)
Net increase in cash and cash equivalents 525.9 17.3 121.1Cash and cash equivalents at beginning of year 530.7 513.4 392.3Cash and cash equivalents at end of year $ 1,056.6 $ 530.7 $ 513.4
rEconciliATionoFnETEArningsTonETcAshproviDEDBYopErATingAcTiviTiEs: Net earnings $ 2,637.0 $ 1,368.9 $ 1,224.7 Adjustments required to reconcile net earnings to net cash provided by operating activities: Depreciation and amortization 1,094.6 733.3 589.1 Stock based compensation 78.0 69.9 – Deferred income taxes and other non-cash items 40.1 98.2 13.5 Change in operating assets and liabilities providing/ (requiring) cash, net of effects from acquisitions: Accounts receivable, net 279.7 (540.1) (83.1) Inventories (448.0) (624.1) (265.2) Other current assets (59.2) (21.4) (13.2) Other assets (26.4) (17.2) (0.1) Accounts payable (181.4) 396.7 192.2 Accrued expenses (168.2) 328.9 (43.8) Other long-term liabilities (16.5) (50.7) (2.0)Net cash provided by operating activities $ 3,229.7 $ 1,742.4 $ 1,612.1
See accompanying notes to consolidated financial statements.

42
I C
VS
Car
emar
k
consoliDateDstateMentsofshaReholDeRs’equity
Shares Dollars
Dec.29, Dec. 30, Dec. 31, Dec.29, Dec. 30, Dec. 31, In millions 2007 2006 2005 2007 2006 2005
prEFErEncEsTock: Beginning of year 4.0 4.2 4.3 $ 213.3 $ 222.6 $ 228.4
Conversion to common stock (0.2) (0.2) (0.1) (10.3) (9.3) (5.8)
End of year 3.8 4.0 4.2 203.0 213.3 222.6
commonsTock: Beginning of year 847.3 838.8 828.6 8.5 8.4 8.3 Common stock issued for Caremark Merger 712.7 – – 7.1 – –
Stock options exercised and awards 30.1 8.5 10.2 0.3 0.1 0.1
End of year 1,590.1 847.3 838.8 15.9 8.5 8.4
TrEAsurYsTock: Beginning of year (21.5) (24.5) (26.6) (314.5) (356.5) (385.9) Purchase of treasury shares (135.0) 0.1 – (5,378.7) (0.1) (1.7) Conversion of preference stock 0.9 0.8 0.5 24.7 11.7 7.3
Employee stock purchase plan issuance 1.9 2.1 1.6 48.1 30.4 23.8
End of year (153.7) (21.5) (24.5) (5,620.4) (314.5) (356.5)
guArAnTEEDEsopoBligATion: Beginning of year (82.1) (114.0) (140.9)
Reduction of guaranteed ESOP obligation 37.6 31.9 26.9
End of year (44.5) (82.1) (114.0)
shArEshElDinTrusT: Beginning of year – – – – – –
Shares acquired through Caremark Merger (9.2) – – (301.3) – –
End of year (9.2) (301.3) – –
cApiTAlsurplus: Beginning of year 2,198.4 1,922.4 1,687.3 Common stock issued for Caremark Merger, net of issuance costs 23,942.4 – – Stock option activity and awards 607.7 235.8 188.8 Tax benefit on stock options and awards 97.8 42.6 47.8
Conversion of preference stock (14.4) (2.4) (1.5)
End of year 26,831.9 2,198.4 1,922.4
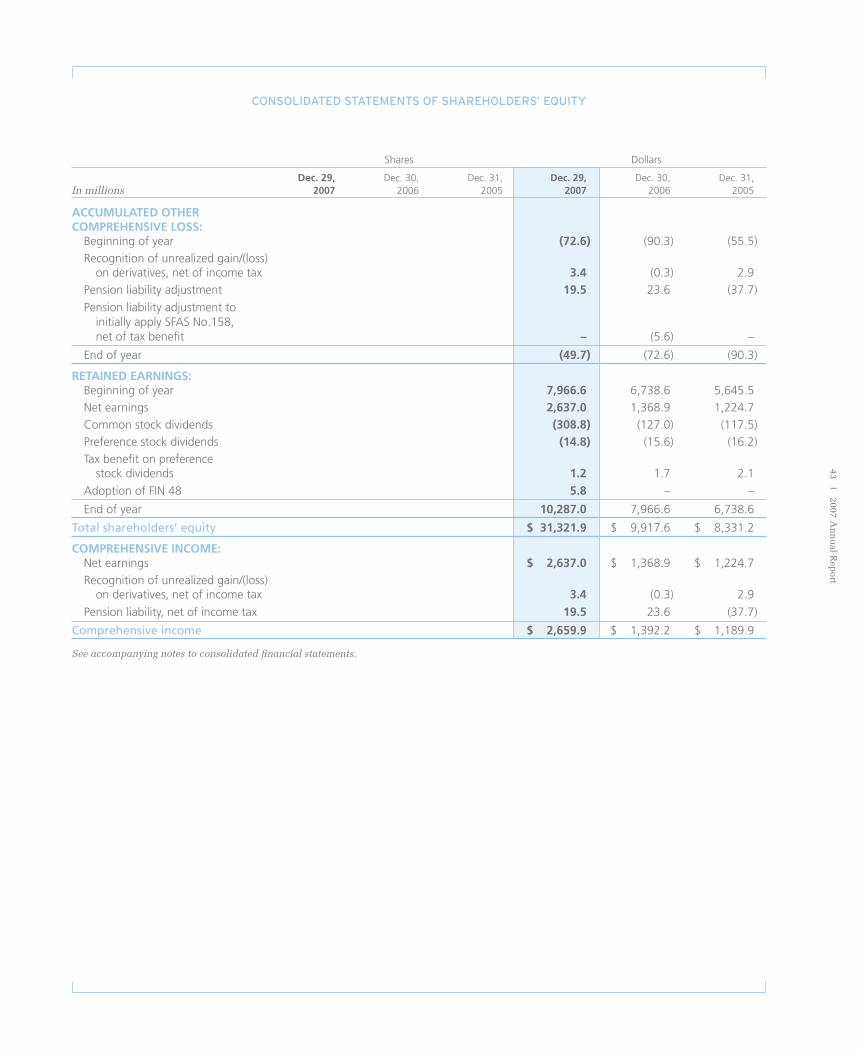
43 I 2007 An
nu
al Rep
ort
consoliDateDstateMentsofshaReholDeRs’equity
Shares Dollars
Dec.29, Dec. 30, Dec. 31, Dec.29, Dec. 30, Dec. 31, In millions 2007 2006 2005 2007 2006 2005
AccumulATEDoThErcomprEhEnsivEloss: Beginning of year (72.6) (90.3) (55.5) Recognition of unrealized gain/(loss) on derivatives, net of income tax 3.4 (0.3) 2.9 Pension liability adjustment 19.5 23.6 (37.7)
Pension liability adjustment to initially apply SFAS No.158, net of tax benefit – (5.6) –
End of year (49.7) (72.6) (90.3)
rETAinEDEArnings: Beginning of year 7,966.6 6,738.6 5,645.5 Net earnings 2,637.0 1,368.9 1,224.7 Common stock dividends (308.8) (127.0) (117.5) Preference stock dividends (14.8) (15.6) (16.2) Tax benefit on preference stock dividends 1.2 1.7 2.1
Adoption of FIN 48 5.8 – –
End of year 10,287.0 7,966.6 6,738.6
Total shareholders’ equity $ 31,321.9 $ 9,917.6 $ 8,331.2
comprEhEnsivEincomE: Net earnings $ 2,637.0 $ 1,368.9 $ 1,224.7 Recognition of unrealized gain/(loss) on derivatives, net of income tax 3.4 (0.3) 2.9
Pension liability, net of income tax 19.5 23.6 (37.7)
Comprehensive income $ 2,659.9 $ 1,392.2 $ 1,189.9
See accompanying notes to consolidated financial statements.

notestoconsoliDateDfinancialstateMents
44
I C
VS
Car
emar
k
Significant Accounting PoliciesDescription of BusinessCVS Caremark Corporation (the “Company”) operates the largest
retail pharmacy business (based on store count) and one of the
largest pharmacy services businesses in the United States.
The retail pharmacy business sells prescription drugs and a wide
assortment of general merchandise, including over-the-counter
drugs, beauty products and cosmetics, photo finishing, seasonal
merchandise, greeting cards and convenience foods through
its CVS/pharmacy® retail stores and online through CVS.com®.
The Company also provides healthcare services through its 462
MinuteClinic® healthcare clinics, 437 of which are located in
CVS/pharmacy retail stores.
The pharmacy services business provides a full range of pharmacy
benefit management services including mail order pharmacy
services, specialty pharmacy services, plan design and administra-
tion, formulary management and claims processing. Its customers
are primarily employers, insurance companies, unions, govern-
ment employee groups, managed care organizations and other
sponsors of health benefit plans and individuals throughout the
United States. In addition, through the Company’s SilverScript
insurance subsidiary, it is a national provider of drug benefits to
eligible beneficiaries under the Federal Government’s Medicare
Part D Program. The Company’s specialty pharmacies support
individuals that require complex and expensive drug therapies.
The pharmacy services business operates a national retail
pharmacy network with over 60,000 participating pharmacies
(including CVS/pharmacy stores). The Company also provides
disease management programs for 27 conditions through our
Accordant® disease management offering. Twenty-one of these
programs are accredited by the National Committee for Quality
Assurance. Currently, the pharmacy services business operates
under the Caremark Pharmacy Services®, PharmaCare
Management Services® and PharmaCare Pharmacy® names.
As of December 29, 2007, the Company operated 6,301 retail
and specialty pharmacy stores, 20 specialty mail order pharmacies,
9 mail service pharmacies and 462 healthcare clinics in 44 states
and the District of Columbia.
Basis of PresentationThe consolidated financial statements include the accounts of
the Company and its wholly-owned subsidiaries. All material
intercompany balances and transactions have been eliminated.
Stock SplitOn May 12, 2005, the Company’s Board of Directors authorized
a two-for-one stock split, which was effected through the
issuance of one additional share of common stock for each share
of common stock outstanding. These shares were distributed on
June 6, 2005 to shareholders of record as of May 23, 2005. All
share and per share amounts presented herein have been restated
to reflect the effect of the stock split.
Fiscal YearThe Company’s fiscal year is a 52 or 53 week period ending on
the Saturday nearest to December 31. Fiscal 2007, which ended
on December 29, 2007, fiscal 2006, which ended on December
30, 2006 and fiscal 2005, which ended on December 31, 2005,
each included 52 weeks. Unless otherwise noted, all references
to years relate to these fiscal years.
Reclassifications Certain reclassifications have been made to the consolidated
financial statements of prior years to conform to the current year
presentation. These reclassifications include payroll and operating
expenses associated with the fulfillment of scripts in the mail
order facilities and call center facilities within the Company’s
pharmacy services business, which have been reclassified from
operating expenses to cost of revenues.
Use of EstimatesThe preparation of financial statements in conformity with
generally accepted accounting principles requires management
to make estimates and assumptions that affect the reported
amounts in the consolidated financial statements and accompa-
nying notes. Actual results could differ from those estimates.
Cash and Cash EquivalentsCash and cash equivalents consist of cash and temporary invest-
ments with maturities of three months or less when purchased.
Short-Term InvestmentsThe Company’s short-term investments consist of auction
rate securities with initial maturities greater than three months
when purchased. These investments, which are classified as
available-for-sale, are carried at historical cost, which approxi-
mated fair value at December 29, 2007.
#1

notestoconsoliDateDfinancialstateMents
45 I 2007 An
nu
al Rep
ort
Accounts ReceivableAccounts receivable are stated net of an allowance for
uncollectible accounts of $141.4 million and $73.4 million as
of December 29, 2007 and December 30, 2006, respectively.
The balance primarily includes amounts due from third party
providers (e.g., pharmacy benefit managers, insurance companies
and governmental agencies) and vendors as well as clients,
participants and manufacturers.
Fair Value of Financial InstrumentsAs of December 29, 2007, the Company’s financial instruments
include cash and cash equivalents, short-term investments,
accounts receivable, accounts payable and short-term debt. Due to
the short-term nature of these instruments, the Company’s carrying
value approximates fair value. The carrying amount and estimated
fair value of long-term debt was $8.2 billion as of December 29,
2007. The carrying amount and estimated fair value of long-term
debt was $3.1 billion as of December 30, 2006. The fair value of
long-term debt was estimated based on rates currently offered to
the Company for debt with similar terms and maturities. The
Company had outstanding letters of credit, which guaranteed
foreign trade purchases, with a fair value of $5.7 million as of
December 29, 2007 and $6.8 million as of December 30, 2006.
There were no outstanding investments in derivative financial
instruments as of December 29, 2007 or December 30, 2006.
Inventories Inventories are stated at the lower of cost or market on a first-in,
first-out basis using the retail method of accounting to determine
cost of sales and inventory in our retail pharmacy stores, average
cost to determine cost of sales and inventory in our mail service
and specialty pharmacies and the cost method of accounting
to determine inventory in our distribution centers. Independent
physical inventory counts are taken on a regular basis in each
store and distribution center location (other than six distribution
centers, which perform a continuous cycle count process to
validate the inventory balance on hand) to ensure that the
amounts reflected in the accompanying consolidated financial
statements are properly stated. During the interim period
between physical inventory counts, the Company accrues for
anticipated physical inventory losses on a location-by-location
basis based on historical results and current trends.
Property and Equipment Property, equipment and improvements to leased premises are
depreciated using the straight-line method over the estimated
useful lives of the assets or, when applicable, the term of the
lease, whichever is shorter. Estimated useful lives generally range
from 10 to 40 years for buildings, building improvements and
leasehold improvements and 3 to 10 years for fixtures and
equipment. Repair and maintenance costs are charged directly
to expense as incurred. Major renewals or replacements that
substantially extend the useful life of an asset are capitalized
and depreciated.
Following are the components of property and equipment:
Dec.29, Dec. 30, In millions 2007 2006
Land $ 586.4 $ 601.3Building and improvements 896.0 801.9Fixtures and equipment 5,178.1 4,347.4Leasehold improvements 2,133.2 1,828.5Capitalized software 243.9 219.1Capital leases 181.7 229.3 9,219.3 8,027.5Accumulated depreciation and amortization (3,366.5) (2,693.9) $ 5,852.8 $ 5,333.6
The Company capitalizes application development stage
costs for significant internally developed software projects.
These costs are amortized over the estimated useful lives of the
software, which generally range from 3 to 5 years. Unamortized
costs were $74.2 million as of December 29, 2007 and $75.5 mil-
lion as of December 30, 2006.
GoodwillThe Company accounts for goodwill and intangibles under
Statement of Financial Accounting Standards (“SFAS”) No. 142,
“Goodwill and Other Intangible Assets.” As such, goodwill and
other indefinite-lived assets are not amortized, but are subject to
impairment reviews annually, or more frequently if necessary. See
Note 3 for further information on goodwill.
Intangible AssetsPurchased customer contracts and relationships are amortized
on a straight-line basis over their estimated useful lives of up to
20 years. Purchased customer lists are amortized on a straight-line
basis over their estimated useful lives of up to 10 years. Purchased
leases are amortized on a straight-line basis over the remaining life
of the lease. See Note 3 for further information on intangible assets.
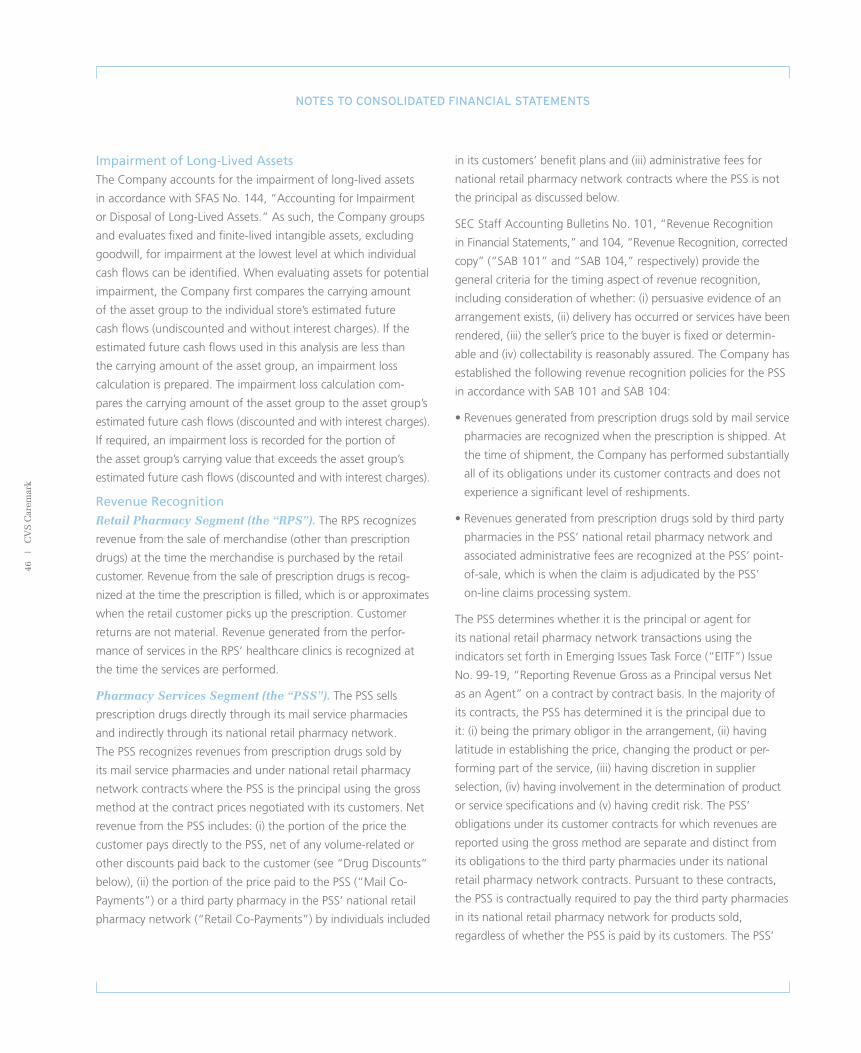
notestoconsoliDateDfinancialstateMents
46
I C
VS
Car
emar
k
Impairment of Long-Lived AssetsThe Company accounts for the impairment of long-lived assets
in accordance with SFAS No. 144, “Accounting for Impairment
or Disposal of Long-Lived Assets.” As such, the Company groups
and evaluates fixed and finite-lived intangible assets, excluding
goodwill, for impairment at the lowest level at which individual
cash flows can be identified. When evaluating assets for potential
impairment, the Company first compares the carrying amount
of the asset group to the individual store’s estimated future
cash flows (undiscounted and without interest charges). If the
estimated future cash flows used in this analysis are less than
the carrying amount of the asset group, an impairment loss
calculation is prepared. The impairment loss calculation com-
pares the carrying amount of the asset group to the asset group’s
estimated future cash flows (discounted and with interest charges).
If required, an impairment loss is recorded for the portion of
the asset group’s carrying value that exceeds the asset group’s
estimated future cash flows (discounted and with interest charges).
Revenue RecognitionRetail Pharmacy Segment (the “RPS”). The RPS recognizes
revenue from the sale of merchandise (other than prescription
drugs) at the time the merchandise is purchased by the retail
customer. Revenue from the sale of prescription drugs is recog-
nized at the time the prescription is filled, which is or approximates
when the retail customer picks up the prescription. Customer
returns are not material. Revenue generated from the perfor-
mance of services in the RPS’ healthcare clinics is recognized at
the time the services are performed.
Pharmacy Services Segment (the “PSS”). The PSS sells
prescription drugs directly through its mail service pharmacies
and indirectly through its national retail pharmacy network.
The PSS recognizes revenues from prescription drugs sold by
its mail service pharmacies and under national retail pharmacy
network contracts where the PSS is the principal using the gross
method at the contract prices negotiated with its customers. Net
revenue from the PSS includes: (i) the portion of the price the
customer pays directly to the PSS, net of any volume-related or
other discounts paid back to the customer (see “Drug Discounts”
below), (ii) the portion of the price paid to the PSS (“Mail Co-
Payments”) or a third party pharmacy in the PSS’ national retail
pharmacy network (“Retail Co-Payments”) by individuals included
in its customers’ benefit plans and (iii) administrative fees for
national retail pharmacy network contracts where the PSS is not
the principal as discussed below.
SEC Staff Accounting Bulletins No. 101, “Revenue Recognition
in Financial Statements,” and 104, “Revenue Recognition, corrected
copy” (“SAB 101” and “SAB 104,” respectively) provide the
general criteria for the timing aspect of revenue recognition,
including consideration of whether: (i) persuasive evidence of an
arrangement exists, (ii) delivery has occurred or services have been
rendered, (iii) the seller’s price to the buyer is fixed or determin-
able and (iv) collectability is reasonably assured. The Company has
established the following revenue recognition policies for the PSS
in accordance with SAB 101 and SAB 104:
• Revenues generated from prescription drugs sold by mail service
pharmacies are recognized when the prescription is shipped. At
the time of shipment, the Company has performed substantially
all of its obligations under its customer contracts and does not
experience a significant level of reshipments.
• Revenues generated from prescription drugs sold by third party
pharmacies in the PSS’ national retail pharmacy network and
associated administrative fees are recognized at the PSS’ point-
of-sale, which is when the claim is adjudicated by the PSS’
on-line claims processing system.
The PSS determines whether it is the principal or agent for
its national retail pharmacy network transactions using the
indicators set forth in Emerging Issues Task Force (“EITF”) Issue
No. 99-19, “Reporting Revenue Gross as a Principal versus Net
as an Agent” on a contract by contract basis. In the majority of
its contracts, the PSS has determined it is the principal due to
it: (i) being the primary obligor in the arrangement, (ii) having
latitude in establishing the price, changing the product or per-
forming part of the service, (iii) having discretion in supplier
selection, (iv) having involvement in the determination of product
or service specifications and (v) having credit risk. The PSS’
obligations under its customer contracts for which revenues are
reported using the gross method are separate and distinct from
its obligations to the third party pharmacies under its national
retail pharmacy network contracts. Pursuant to these contracts,
the PSS is contractually required to pay the third party pharmacies
in its national retail pharmacy network for products sold,
regardless of whether the PSS is paid by its customers. The PSS’

notestoconsoliDateDfinancialstateMents
47 I 2007 An
nu
al Rep
ort
responsibilities under its customer contracts typically include
validating eligibility and coverage levels, communicating the
prescription price and the co-payments due to the third party
retail pharmacy, identifying possible adverse drug interactions for
the pharmacist to address with the physician prior to dispensing,
suggesting clinically appropriate generic alternatives where
appropriate and approving the prescription for dispensing.
Although the PSS does not have credit risk with respect to Retail
Co-Payments, management believes that all of the other indica-
tors of gross revenue reporting are present. For contracts under
which the PSS acts as an agent, the PSS records revenues
using the net method.
Drug Discounts. The PSS deducts from its revenues any
discounts paid to its customers as required by Emerging Issues
Task Force Issue No. 01-9, “Accounting for Consideration Given
by a Vendor to a Customer (Including a Reseller of the Vendor’s
Products)” (“EITF 01-9”). The PSS pays discounts to its customers
in accordance with the terms of its customer contracts, which are
normally based on a fixed discount per prescription for specific
products dispensed or a percentage of manufacturer discounts
received for specific products dispensed. The liability for discounts
due to the PSS’ customers is included in “Claims and discounts
payable” in the accompanying consolidated balance sheets.
Medicare Part D. The PSS began participating in the Federal
Government’s Medicare Part D program as a Prescription Drug
Plan (“PDP”) on January 1, 2006. The PSS’ net revenues include
insurance premiums earned by the PDP, which are determined
based on the PSS’ annual bid and related contractual arrange-
ments with the Centers for Medicare and Medicaid Services
(“CMS”). The insurance premiums include a beneficiary premium,
which is the responsibility of the PDP member, but is subsidized
by CMS in the case of low-income members, and a direct subsidy
paid by CMS. These insurance premiums are recognized in net
revenues over the period in which members are entitled to receive
benefits. Premiums collected in advance are deferred.
In addition to these premiums, the PSS’ net revenues include
co-payments, deductibles and coinsurance (collectively referred
to as member responsibility amounts) related to PDP members’
prescription claims. CMS subsidizes certain components of these
member responsibility amounts and pays the PSS an estimated
prospective subsidy amount each month. The prospective subsidy
amounts received from CMS are recorded in “Accrued expenses”
in the accompanying consolidated condensed balance sheets to
the extent that they differ from amounts earned based on actual
claims experience.
The PSS accounts for CMS obligations and member responsibility
amounts using the gross method consistent with its revenue
recognition policies, including the application of EITF 99-19.
Additionally, the PSS includes actual amounts paid by members of
its PDP to the third party pharmacies in its national retail pharmacy
network in the total Retail Co-Payments included in net revenues.
Please see Note 13 for further information on revenues of the
Company’s business segments.
Cost of RevenuesRetail Pharmacy Segment. The RPS’ cost of revenues includes:
the cost of merchandise sold during the reporting period and the
related purchasing costs, warehousing and delivery costs (includ-
ing depreciation and amortization) and actual and estimated
inventory losses.
Pharmacy Services Segment. The PSS’ cost of revenues
includes: (i) the cost of prescription drugs sold during the
reporting period directly through its mail service pharmacies and
indirectly through its national retail pharmacy network, (ii) ship-
ping and handling costs and (iii) the operating costs of its mail
service pharmacies and customer service operations and related
information technology support costs (including depreciation and
amortization). The cost of prescription drugs sold component of
cost of revenues includes: (i) the cost of the prescription drugs
purchased from manufacturers or distributors and shipped to
participants in customers’ benefit plans from the PSS’ mail service
pharmacies, net of any volume-related or other discounts (see
“Drug Discounts” above) and (ii) the cost of prescription drugs
sold (including Retail Co-Payments) through the PSS’ national
retail pharmacy network under contracts where it is the principal,
net of any volume-related or other discounts.
Please see Note 13 for further information related to the cost
of revenues of the Company’s business segments.

notestoconsoliDateDfinancialstateMents
48
I C
VS
Car
emar
k
Vendor Allowances and Purchase DiscountsThe Company accounts for vendor allowances and purchase
discounts under the guidance provided by EITF Issue No. 02-16,
“Accounting by a Customer (Including a Reseller) for Certain
Consideration Received from a Vendor,” and EITF Issue No. 03-10,
“Application of EITF Issue No. 02-16 by Resellers to Sales Incentives
Offered to Consumers by Manufacturers.”
Retail Pharmacy Segment. Vendor allowances the RPS receives
reduce the carrying cost of inventory and are recognized in cost
of revenues when the related inventory is sold, unless they are
specifically identified as a reimbursement of incremental costs for
promotional programs and/or other services provided. Funds that
are directly linked to advertising commitments are recognized as a
reduction of advertising expense (included in operating expenses)
when the related advertising commitment is satisfied. Any such
allowances received in excess of the actual cost incurred also
reduce the carrying cost of inventory. The total value of any up-
front payments received from vendors that are linked to purchase
commitments is initially deferred. The deferred amounts are then
amortized to reduce cost of revenues over the life of the contract
based upon purchase volume. The total value of any upfront
payments received from vendors that are not linked to purchase
commitments is also initially deferred. The deferred amounts are
then amortized to reduce cost of revenues on a straight-line basis
over the life of the related contract. The total amortization of
these upfront payments was not material to the accompanying
consolidated financial statements.
Pharmacy Services Segment. The PSS receives purchase
discounts on products purchased. The PSS’ contractual arrange-
ments with vendors, including manufacturers, wholesalers
and retail pharmacies, normally provide for the PSS to receive
purchase discounts from established list prices in one, or a
combination of, the following forms: (i) a direct discount at
the time of purchase, (ii) a discount for the prompt payment of
invoices or (iii) when products are purchased indirectly from
a manufacturer (e.g., through a wholesaler or retail pharmacy),
a discount (or rebate) paid subsequent to dispensing. These
rebates are recognized when prescriptions are dispensed and are
generally calculated and billed to manufacturers within 30 days
of the end of each completed quarter. Historically, the effect of
adjustments resulting from the reconciliation of rebates recog-
nized to the amounts billed and collected has not been material
to the PSS’ results of operations. The PSS accounts for the effect
of any such differences as a change in accounting estimate in
the period the reconciliation is completed. The PSS also receives
additional discounts under its wholesaler contract if it exceeds
contractually defined annual purchase volumes.
The PSS earns purchase discounts at various points in its business
cycle (e.g., when the product is purchased, when the vendor is
paid or when the product is dispensed) for products sold through
its mail service pharmacies and third party pharmacies included
its national retail pharmacy network. In addition, the PSS receives
fees from pharmaceutical manufacturers for administrative services.
Purchase discounts and administrative service fees are recorded as a
reduction of “Cost of revenues” as required by EITF 02-16.
Shares Held in TrustAs a result of the Caremark Merger, the Company maintains
grantor trusts, which held approximately 9.2 million shares of
its common stock at December 29, 2007. These shares are
designated for use under various employee compensation plans.
Since the Company holds these shares, they are excluded from
the computation of basic and diluted shares outstanding.
InsuranceThe Company is self-insured for certain losses related to general
liability, workers’ compensation and auto liability. The Company
obtains third party insurance coverage to limit exposure from
these claims. The Company is also self-insured for certain losses
related to health and medical liabilities. The Company’s self-
insurance accruals, which include reported claims and claims
incurred but not reported, are calculated using standard insurance
industry actuarial assumptions and the Company’s historical
claims experience.
Store Opening and Closing CostsNew store opening costs, other than capital expenditures, are
charged directly to expense when incurred. When the Company
closes a store, the present value of estimated unrecoverable costs,
including the remaining lease obligation less estimated sublease
income and the book value of abandoned property and equip-
ment, are charged to expense. The long-term portion of the
lease obligations associated with store closings was $370.0
million and $418.0 million in 2007 and 2006, respectively.

notestoconsoliDateDfinancialstateMents
49 I 2007 An
nu
al Rep
ort
Advertising CostsAdvertising costs are expensed when the related advertis-
ing takes place. Advertising costs, net of vendor funding,
(included in operating expenses), were $290.6 million in 2007,
$265.3 million in 2006 and $206.6 million in 2005.
Interest Expense, NetInterest expense was $468.3 million, $231.7 million and
$117.0 million, and interest income was $33.7 million, $15.9 mil-
lion and $6.5 million in 2007, 2006 and 2005, respectively. Capitalized
interest totaled $23.7 million in 2007, $20.7 million in 2006 and
$12.7 million in 2005.
Accumulated Other Comprehensive Loss Accumulated other comprehensive loss consists of changes in
the net actuarial gains and losses associated with pension and
other post retirement benefit plans, unrealized losses on deriva-
tives and adjustment to initially apply SFAS No. 158. In accordance
with SFAS No. 158, the amount included in accumulated other
comprehensive income related to the Company’s pension and
post retirement plans was $58.7 million pre-tax ($35.9 million
after-tax) as of December 29, 2007 and $87.4 million pre-tax
($55.4 million after-tax) as of December 30, 2006. The unrealized
loss on derivatives totaled $21.9 million pre-tax ($13.8 million
after-tax) and $27.2 million pre-tax ($17.2 million after-tax) as
of December 29, 2007 and December 30, 2006, respectively.
Stock-Based CompensationOn January 1, 2006, the Company adopted SFAS No. 123(R),
“Share-Based Payment,” using the modified prospective transi-
tion method. Under this method, compensation expense is
recognized for options granted on or after January 1, 2006 as
well as any unvested options on the date of adoption. As allowed
under the modified prospective transition method, prior period
financial statements have not been restated. Prior to January 1,
2006, the Company accounted for its stock-based compensation
plans under the recognition and measurement principles of
Accounting Principles Board (“APB”) Opinion No. 25, “Accounting
for Stock Issued to Employees,” and related interpretations. As
such, no stock-based employee compensation costs were reflected
in net earnings for options granted under those plans since they
had an exercise price equal to the fair market value of the under-
lying common stock on the date of grant. See Note 8 for further
information on stock-based compensation.
Income Taxes The Company provides for federal and state income taxes
currently payable, as well as for those deferred because of timing
differences between reported income and expenses for financial
statement purposes versus tax purposes. Federal and state tax
credits are recorded as a reduction of income taxes. Deferred tax
assets and liabilities are recognized for the future tax consequences
attributable to differences between the carrying amount of assets
and liabilities for financial reporting purposes and the amounts
used for income tax purposes. Deferred tax assets and liabilities
are measured using the enacted tax rates expected to apply to
taxable income in the years in which those temporary differences
are expected to be recoverable or settled. The effect of a change
in tax rates is recognized as income or expense in the period of
the change. See Note 12 for further information on income taxes.
Earnings per Common ShareBasic earnings per common share is computed by dividing: (i) net
earnings, after deducting the after-tax Employee Stock Ownership
Plan (“ESOP”) preference dividends, by (ii) the weighted average
number of common shares outstanding during the year (the
“Basic Shares”).
When computing diluted earnings per common share, the
Company assumes that the ESOP preference stock is converted
into common stock and all dilutive stock awards are exercised.
After the assumed ESOP preference stock conversion, the ESOP
Trust would hold common stock rather than ESOP preference
stock and would receive common stock dividends ($0.22875
per share in 2007, $0.15500 per share in 2006 and $0.14500
per share in 2005) rather than ESOP preference stock dividends
(currently $3.90 per share). Since the ESOP Trust uses the dividends
it receives to service its debt, the Company would have to increase
its contribution to the ESOP Trust to compensate it for the
lower dividends. This additional contribution would reduce
the Company’s net earnings, which in turn, would reduce the
amounts that would be accrued under the Company’s incen-
tive compensation plans.

notestoconsoliDateDfinancialstateMents
50
I C
VS
Car
emar
k
Diluted earnings per common share is computed by dividing:
(i) net earnings, after accounting for the difference between the
dividends on the ESOP preference stock and common stock and
after making adjustments for the incentive compensation plans,
by (ii) Basic Shares plus the additional shares that would be
issued assuming that all dilutive stock awards are exercised
and the ESOP preference stock is converted into common stock.
Options to purchase 10.7 million, 4.7 million and 6.9 million
shares of common stock were outstanding as of December 29,
2007, December 30, 2006 and December 31, 2005, respectively,
but were not included in the calculation of diluted earnings per
share because the options’ exercise prices were greater than the
average market price of the common shares and, therefore, the
effect would be antidilutive.
New Accounting PronouncementsThe Company adopted Financial Accounting Standards
Board Interpretation No. 48, “Accounting for Uncertainty in
Income Taxes – an interpretation of FASB Statement No. 109”
(“FIN 48”) effective December 31, 2006. FIN 48 addresses the
uncertainty about how certain income tax positions taken or
expected to be taken on an income tax return should be reflected
in the financial statements before they are finally resolved. As
a result of the implementation, the Company recognized a
decrease to reserves for uncertain income tax positions of
approximately $4.0 million, which was accounted for as an
increase to the December 31, 2006 balance of retained earnings.
The Company adopted SFAS No. 157, “Fair Value Measurement.”
SFAS No. 157 defines fair value, establishes a framework for
measuring fair value in generally accepted accounting principles
and expands disclosures regarding fair value measurements. SFAS
No. 157 is effective for fiscal years beginning after November 15,
2007 and interim periods within those fiscal years. The adoption
of this statement did not have a material impact on its consoli-
dated results of operations, financial position or cash flows.
In June 2006, the Emerging Issues Task Force of the Financial
Accounting Standards Board (“FASB”) reached a consensus
on EITF Issue No. 06-4, “Accounting for Deferred Compensation
and Postretirement Benefit Aspects of Endorsement Split-Dollar
Life Insurance Arrangements” (“EITF 06-4”), which requires the
application of the provisions of SFAS No. 106, “Employers’
Accounting for Postretirement Benefits Other Than Pensions”
(“SFAS 106”) (if, in substance, a postretirement benefit plan
exists), or Accounting Principles Board Opinion No. 12 (if the
arrangement is, in substance, an individual deferred compensation
contract) to endorsement split-dollar life insurance arrangements.
SFAS 106 would require the Company to recognize a liability
for the discounted value of the future benefits that it will
incur through the death of the underlying insureds. EITF 06-4 is
currently effective for fiscal years beginning after December 15,
2007. The Company is currently evaluating the potential impact
the adoption of EITF 06-4 may have on its consolidated results of
operations, financial position and cash flows.
In March 2007, the FASB issued Emerging Issues Task Force Issue
No. 06-10 “Accounting for Collateral Assignment Split-Dollar
Life Insurance Agreements” (“EITF 06-10”). EITF 06-10 provides
guidance for determining a liability for the postretirement
benefit obligation as well as recognition and measurement of
the associated asset on the basis of the terms of the collateral
assignment agreement. EITF 06-10 is effective for fiscal years
beginning after December 15, 2007. The Company is currently
evaluating the potential impact the adoption of EITF 06-10 may
have on its consolidated results of operations, financial position
and cash flows.
In December 2007, the FASB issued SFAS No. 141 (revised 2007),
“Business Combinations” (“SFAS 141R”), which replaces FASB
Statement No. 141. SFAS 141R establishes the principles and
requirements for how an acquirer recognizes and measures in its
financial statements the identifiable assets acquired, the liabilities
assumed, any non controlling interest in the acquiree and the
goodwill acquired. The Statement also establishes disclosure
requirements which will enable users to evaluate the nature and
financial effects of business combinations. SFAS 141R is effective
for fiscal years beginning after December 15, 2008. The Company
is currently evaluating the potential impact, if any, the adoption
of SFAS 141R may have on its consolidated results of operations,
financial position and cash flows.

notestoconsoliDateDfinancialstateMents
51 I 2007 An
nu
al Rep
ort
Business CombinationsCaremark MergerEffective March 22, 2007, pursuant to the Agreement and
Plan of Merger dated as of November 1, 2006, as amended
(the “Merger Agreement”), Caremark Rx, Inc. (“Caremark”)
was merged with and into a newly formed subsidiary of
CVS Corporation, with the CVS subsidiary continuing as the
surviving entity (the “Caremark Merger”). Following the merger,
the Company changed its name to CVS Caremark Corporation.
Under the terms of the Merger Agreement, Caremark shareholders
received 1.67 shares of common stock, par value $0.01 per share,
of the Company for each share of common stock of Caremark,
par value $0.001 per share, issued and outstanding immediately
prior to the effective time of the merger. In addition, Caremark
shareholders of record as of the close of business on the day
immediately preceding the closing date of the merger received
a special cash dividend of $7.50 per share.
The merger was accounted for using the purchase method of
accounting under U.S. Generally Accepted Accounting Principles.
Under the purchase method of accounting, CVS Corporation is
considered the acquirer of Caremark for accounting purposes and
the total purchase price will be allocated to the assets acquired
and liabilities assumed from Caremark based on their fair values
as of March 22, 2007. Under the purchase method of account-
ing, the total consideration was approximately $26.9 billion and
includes amounts related to Caremark common stock ($23.3 billion),
Caremark stock options ($0.6 billion) and the special cash dividend
($3.2 billion), less shares held in trust ($0.3 billion). The consider-
ation associated with the common stock and stock options was
based on the average closing price of CVS common stock for
the five trading days ending February 14, 2007, which was
$32.67 per share. The results of the operations of Caremark have
been included in the consolidated statements of operations since
March 22, 2007.
Following is a summary of the estimated assets acquired and
liabilities assumed as of March 22, 2007. This estimate is prelimi-
nary and based on information that was available to management
at the time the consolidated financial statements were prepared.
Accordingly, the allocation will change and the impact of such
changes could be material.
EstimatedAssetsAcquiredandliabilitiesAssumedasofmarch22,2007
In millions
Cash and cash equivalents $ 1,293.4Short-term investments 27.5Accounts receivable 2,472.7Inventories 442.3Deferred tax asset 95.4Other current assets 31.4 Total current assets 4,362.7Property and equipment 209.7Goodwill 20,853.0Intangible assets(1) 9,429.5Other assets 67.1 Total assets acquired 34,922.0Accounts payable 960.8Claims and discounts payable 2,430.1Accrued expenses(2) 991.6 Total current liabilities 4,382.5Deferred tax liability 3,595.7Other long-term liabilities 93.2 Total liabilities 8,071.4Net assets acquired $ 26,850.6
(1) Intangible assets include customer contracts and relationships ($2.9 billion) with an estimated weighted average life of 14.7 years, proprietary technology ($109.8 million) with an estimated weighted average life of 3.5 years, favorable leaseholds ($12.7 million) with an estimated weighted average life of 6.2 years, covenants not to compete ($9.0 million) with an estimated average life of 2 years and trade names ($6.4 billion), which are indefinitely lived.
(2) Accrued expenses currently include $49.5 million for estimated severance, benefits and outplacement costs for approximately 240 Caremark employees that have been or will be terminated. The amount accrued and the number of employees affected may continue to increase as exit plans are finalized and communicated. As of December 29, 2007, $48.1 million of the liability has been settled with cash payments. The remaining liability will require future cash payments through 2008. Accrued expenses also include $1.4 million for the estimated costs associated with the non-cancelable lease obligation of one location. As of December 29, 2007, $0.5 million of the liability has been settled with cash payments. The remaining liability will require future cash payments through 2008.
#2

notestoconsoliDateDfinancialstateMents
52
I C
VS
Car
emar
k
Standalone Drug BusinessOn June 2, 2006, CVS acquired certain assets and assumed
certain liabilities from Albertson’s, Inc. (“Albertson’s”) for
$4.0 billion. The assets acquired and the liabilities assumed
included approximately 700 standalone drugstores and a
distribution center (collectively the “Standalone Drug Business”).
In conjunction with the acquisition of the Standalone Drug
Business, during fiscal 2006, the Company recorded a
$49.5 million liability for the estimated costs associated with
the non-cancelable lease obligations of 94 acquired stores that
the Company does not intend to operate. As of December 29,
2007, 81 of these locations have been closed and $3.6 million
of this liability has been settled with cash payments. The
$47.5 million remaining liability, which includes $3.1 million
of interest accretion, will require future cash payments through
2033, unless settled prior thereto. The Company believes the
remaining liability is adequate to cover the remaining costs
associated with the related activities.
The following unaudited pro forma combined results of opera-
tions have been provided for illustrative purposes only and do
not purport to be indicative of the actual results that would
have been achieved by the combined companies for the periods
presented or that will be achieved by the combined companies
in the future:
In millions, except per share amounts 2007 2006
Pro forma:(1)(2)(3)(4)
Net revenues $ 83,798.6 $ 78,668.9 Net earnings 2,906.6 2,167.5 Basic earnings per share $ 1.76 $ 1.41 Diluted earnings per share 1.72 1.37
(1) The pro forma combined results of operations assume that the Caremark Merger and the acquisition of the Standalone Drug Business occurred at the beginning of each period presented. These results have been prepared by adjusting the historical results of the Company to include the historical results of Caremark and the Standalone Drug Business, incremental interest expense and the impact of the prelimi-nary purchase price allocation discussed above. The historical results of Caremark are based on a calendar period end, whereas the historical results of the Pharmacy Services Segment of CVS are based on a 52 week fiscal year ending on the Saturday nearest to December 31.
(2) Inter-company revenues that occur when a Caremark customer uses a CVS/pharmacy retail store to purchase covered products were eliminated. These adjustments had no impact on pro forma net earnings or pro forma earnings per share.
(3) The pro forma combined results of operations do not include any cost savings that may result from the combination of the Company and Caremark or any estimated costs that will be incurred by the Company to integrate the businesses.
(4) The pro forma combined results of operations for fiscal year ended December 29, 2007, exclude $80.3 million pre-tax ($48.6 million after-tax) of stock option expense associated with the accelerated vesting of certain Caremark stock options, which vested upon consummation of the merger due to change in control provisions included in the underlying Caremark stock option plans. The pro forma combined results for the fiscal year ended December 29, 2007 also exclude $42.9 million pre-tax ($25.9 million after-tax) related to change in control payments due upon the consummation of the merger due to change in control provisions in certain Caremark employment agreements. In addition, the pro forma combined results of operations for the fiscal year ended December 29, 2007, exclude merger-related costs of $150.1 million pre-tax ($101.7 million after-tax), which primarily consist of investment banker fees, legal fees, accounting fees and other merger-related costs incurred by Caremark.
Goodwill and Other IntangiblesThe Company accounts for goodwill and intangibles under
SFAS No. 142, “Goodwill and Other Intangible Assets.” Under
SFAS No. 142, goodwill and other indefinitely-lived assets are not
amortized, but are subject to annual impairment reviews, or more
frequent reviews if events or circumstances indicate an impair-
ment may exist.
When evaluating goodwill for potential impairment, the
Company first compares the fair value of the reporting unit,
based on estimated future discounted cash flows, to its carrying
amount. If the estimated fair value of the reporting unit is less
than its carrying amount, an impairment loss calculation is
prepared. The impairment loss calculation compares the implied
fair value of a reporting unit’s goodwill with the carrying amount
of its goodwill. If the carrying amount of the goodwill exceeds
the implied fair value, an impairment loss is recognized in an
amount equal to the excess. During the third quarter of 2007,
the Company performed its required annual goodwill impairment
tests, and concluded there were no goodwill impairments.
Indefinitely-lived intangible assets are tested by comparing
the estimated fair value of the asset to its carrying value. If the
carrying value of the asset exceeds its estimated fair value, an
impairment loss is recognized and the asset is written down to
its estimated fair value.
#3

notestoconsoliDateDfinancialstateMents
53 I 2007 An
nu
al Rep
ort
The carrying amount of goodwill was $23.9 billion and
$3.2 billion as of December 29, 2007 and December 30, 2006,
respectively. During 2007, gross goodwill increased primarily in
the Pharmacy Services Segment due to the Caremark Merger.
There was no impairment of goodwill during 2007.
The carrying amount of indefinitely-lived assets was $6.4 billion
as of December 29, 2007. The Company had no indefinitely-lived
assets as of December 30, 2006. The increase in the Company’s
indefinitely-lived assets during 2007 was due to the recognition of
trademarks associated with the Caremark Merger.
Intangible assets with finite useful lives are amortized over their
estimated useful lives. The increase in the gross carrying amount
of the Company’s amortizable intangible assets during 2007 was
primarily due to the Caremark Merger and adjustments related
to the Standalone Drug Business. The amortization expense for
intangible assets totaled $344.1 million in 2007, $161.2 million
in 2006 and $128.6 million in 2005. The anticipated annual
amortization expense for these intangible assets is $387.2 million
in 2008, $373.8 million in 2009, $361.5 million in 2010,
$352.7 million in 2011 and $334.5 million in 2012.
Following is a summary of the Company’s intangible assets as of the respective balance sheet dates:
Dec.29,2007 Dec. 30, 2006
gross Gross carrying Accumulated Carrying Accumulated In millions Amount Amortization Amount Amortization
Trademarks (indefinitely-lived) $ 6,398.0 $ – $ – $ –Customer contracts and relationships and Covenants not to compete 4,444.1 (876.9) 1,457.6 (563.4)Favorable leases and Other 623.0 (158.6) 552.2 (128.2) $ 11,465.1 $ (1,035.5) $ 2,009.8 $ (691.6)
Share Repurchase ProgramIn connection with the Caremark Merger, on March 28, 2007, the
Company commenced a tender offer to purchase up to 150 mil-
lion common shares, or about 10%, of its outstanding common
stock at a price of $35.00 per share. The tender offer expired on
April 24, 2007 and resulted in approximately 10.3 million shares
being tendered. The shares were placed into the Company’s
treasury account.
On May 9, 2007, the Board of Directors of the Company
authorized a share repurchase program for up to $5.0 billion
of the Company’s outstanding common stock.
On May 13, 2007, the Company entered into a $2.5 billion fixed
dollar accelerated share repurchase (the “May ASR”) agreement
with Lehman Brothers, Inc. (“Lehman”). The May ASR agreement
contained provisions that established the minimum and maximum
number of shares to be repurchased during the term of the May
ASR agreement. Pursuant to the terms of the May ASR agreement,
on May 14, 2007, the Company paid $2.5 billion to Lehman in
exchange for Lehman delivering 45.6 million shares of common
stock to the Company, which were placed into its treasury account
upon delivery. On June 7, 2007, upon establishment of the mini-
mum number of shares to be repurchased, Lehman delivered an
additional 16.1 million shares of common stock to the Company.
The May ASR program concluded on October 5, 2007 and
resulted in the Company receiving an additional 5.8 million
shares of common stock during the fourth quarter of 2007.
As of December 29, 2007 the aggregate 67.5 million shares of
common stock received pursuant to the $2.5 billion May ASR
agreement had been placed into the Company’s treasury account.
On October 8, 2007, the Company commenced an open market
repurchase program. The program concluded on November 2,
2007 and resulted in 5.3 million shares of common stock being
repurchased for $211.9 million. The shares were placed into the
Company’s treasury account upon delivery.
On November 6, 2007, the Company entered into a $2.3 billion
fixed dollar accelerated share repurchase agreement (the “November
ASR”) with Lehman. The November ASR agreement contained
provisions that established the minimum and maximum number
of shares to be repurchased during the term of the November
#4

notestoconsoliDateDfinancialstateMents
54
I C
VS
Car
emar
k
ASR agreement. Pursuant to the terms of the November ASR
agreement, on November 7, 2007, the Company paid $2.3 billion
to Lehman in exchange for Lehman delivering 37.2 million shares
of common stock to the Company, which were placed into its
treasury account upon delivery. On November 26, 2007, upon
establishment of the minimum number of shares to be repur-
chased, Lehman delivered an additional 14.4 million shares
of common stock to the Company. As of December 29, 2007,
the aggregate 51.6 million shares of common stock, received
pursuant to the November ASR agreement, had been placed into
the Company’s treasury account. The Company may receive up to
5.7 million of additional shares of common stock, depending on
the market price of the common stock, as determined under the
November ASR agreement, over the term of the November ASR
agreement, which is currently expected to conclude during the
first quarter of 2008.
Borrowing and Credit AgreementsFollowing is a summary of the Company’s borrowings as of the
respective balance sheet dates:
Dec.29, Dec. 30, In millions 2007 2006
Commercial paper $ 2,085.0 $ 1,842.73.875% senior notes due 2007 – 300.04.0% senior notes due 2009 650.0 650.0Floating rate notes due 2010 1,750.0 –5.75% senior notes due 2011 800.0 800.04.875% senior notes due 2014 550.0 550.06.125% senior notes due 2016 700.0 700.05.75% senior notes due 2017 1,750.0 –6.25% senior notes due 2027 1,000.0 –8.52% ESOP notes due 2008(1) 44.5 82.16.302% Enhanced Capital Advantage Preferred Securities 1,000.0 –Mortgage notes payable 7.3 11.7Capital lease obligations 145.1 120.9 10,481.9 5,057.4Less: Short-term debt (2,085.0) (1,842.7) Current portion of long-term debt (47.2) (344.3) $ 8,349.7 $ 2,870.4
(1) See Note 8 for further information about the Company’s ESOP Plan.
In connection with its commercial paper program, the Company
maintains a $675 million, five-year unsecured back-up credit
facility, which expires on June 11, 2009, a $675 million, five-year
unsecured back-up credit facility, which expires on June 2, 2010,
a $1.4 billion, five-year unsecured back-up credit facility, which
expires on May 12, 2011 and a $1.3 billion, five-year unsecured
back-up credit facility, which expires on March 12, 2012. The
credit facilities allow for borrowings at various rates depending
on the Company’s public debt ratings and requires the Company
to pay a quarterly facility fee of 0.1%, regardless of usage. As of
December 29, 2007, the Company had no outstanding borrow-
ings against the credit facilities. The weighted average interest
rate for short-term debt was 5.3% as of December 29, 2007 and
December 30, 2006.
On May 22, 2007, the Company issued $1.75 billion of floating
rate senior notes due June 1, 2010, $1.75 billion of 5.75%
unsecured senior notes due June 1, 2017, and $1.0 billion of
6.25% unsecured senior notes due June 1, 2027 (collectively
the “2007 Notes”). Also on May 22, 2007, the Company entered
into an underwriting agreement with Lehman Brothers, Inc.,
Morgan Stanley & Co. Incorporated, Banc of America Securities
LLC, BNY Capital Markets, Inc., and Wachovia Capital Markets,
LLC, as representatives of the underwriters pursuant to which
the Company agreed to issue and sell $1.0 billion of Enhanced
Capital Advantaged Preferred Securities (“ECAPS”) due June 1,
2062 to the underwriters. The ECAPS bear interest at 6.302%
per year until June 1, 2012 at which time they will pay interest
based on a floating rate. The 2007 Notes and ECAPS pay interest
semi-annually and may be redeemed at any time, in whole or in
part at a defined redemption price plus accrued interest. The net
proceeds from the 2007 Notes and ECAPS were used to repay the
bridge credit facility and commercial paper borrowings.
On August 15, 2006, the Company issued $800 million
of 5.75% unsecured senior notes due August 15, 2011 and
$700 million of 6.125% unsecured senior notes due August 15,
2016 (collectively the “2006 Notes”). The 2006 Notes pay interest
semi-annually and may be redeemed at any time, in whole or
in part at a defined redemption price plus accrued interest. Net
proceeds from the 2006 Notes were used to repay a portion of
the outstanding commercial paper issued to finance the acquisi-
tion of the Standalone Drug Business.
#5

notestoconsoliDateDfinancialstateMents
55 I 2007 An
nu
al Rep
ort
To manage a portion of the risk associated with potential changes
in market interest rates, during the second quarter of 2006 the
Company entered into forward starting pay fixed rate swaps (the
“Swaps”), with a notional amount of $750 million. During 2006,
the Swaps settled in conjunction with the placement of the long-
term financing, at a loss of $5.3 million. The Company accounts
for the above derivatives in accordance with SFAS No. 133,
“Accounting for Derivative Instruments and Hedging Activities,”
as modified by SFAS No. 138, “Accounting for Derivative
Instruments and Certain Hedging Activities,” which requires the
resulting loss to be recorded in shareholders’ equity as a compo-
nent of accumulated other comprehensive loss. This unrealized loss
will be amortized as a component of interest expense over the
life of the related long-term financing. As of December 29, 2007,
the Company had no freestanding derivatives in place.
The credit facilities, unsecured senior notes and ECAPS contain
customary restrictive financial and operating covenants. The
covenants do not materially affect the Company’s financial or
operating flexibility.
The aggregate maturities of long-term debt for each of the
five years subsequent to December 29, 2007 are $47.2 million in
2008, $653.0 million in 2009, $1.8 billion in 2010, $803.9 million
in 2011 and $1.0 billion in 2012.
LeasesThe Company leases most of its retail and mail locations, nine
of its distribution centers and certain corporate offices under non-
cancelable operating leases, with initial terms of 15 to 25 years
and with options that permit renewals for additional periods.
The Company also leases certain equipment and other assets
under non-cancelable operating leases, with initial terms of 3 to
10 years. Minimum rent is expensed on a straight-line basis over
the term of the lease. In addition to minimum rental payments,
certain leases require additional payments based on sales volume,
as well as reimbursement for real estate taxes, common area
maintenance and insurance, which are expensed when incurred.
Following is a summary of the Company’s net rental expense for
operating leases for the respective years:
In millions 2007 2006 2005
Minimum rentals $ 1,557.0 $ 1,361.2 $ 1,213.2Contingent rentals 65.1 61.5 63.3 1,622.1 1,422.7 1,276.5Less: sublease income (21.5) (26.4) (18.8) $ 1,600.6 $ 1 ,396.3 $ 1,257.7
Following is a summary of the future minimum lease payments
under capital and operating leases as of December 29, 2007:
Capital Operating In millions Leases Leases
2008 $ 16.0 $ 1,584.52009 16.0 1,548.32010 16.1 1,654.52011 16.2 1,418.22012 16.5 1,500.5Thereafter 256.5 14,384.6 $ 337.3 $ 22,090.6Less: imputed interest (192.2)Present value of capital lease obligations $ 145.1 $ 22,090.6
The Company finances a portion of its store development
program through sale-leaseback transactions. The properties
are sold and the resulting leases qualify and are accounted for
as operating leases. The Company does not have any retained
or contingent interests in the stores and does not provide any
guarantees, other than a guarantee of lease payments, in
connection with the sale-leaseback transactions. Proceeds from
sale-leaseback transactions totaled $601.3 million, $1.4 billion,
which included approximately $800 million in proceeds associated
with the sale and leaseback of properties acquired as part of the
acquisition of the Standalone Drug Business, and $539.9 million
in 2007, 2006 and 2005, respectively. The operating leases that
resulted from these transactions are included in the above table.
#6

notestoconsoliDateDfinancialstateMents
56
I C
VS
Car
emar
k
Medicare Part DThe Company offers Medicare Part D benefits through its wholly-
owned subsidiary SilverScript Insurance Company (“SilverScript”)
which has been approved by the CMS as a PDP. SilverScript has
contracted with CMS to be the Company’s PDP and, pursuant to
the Medicare Prescription Drug, Improvement and Modernization
Act of 2003 (“MMA”), must be a risk-bearing entity regulated
under state insurance laws or similar statutes.
SilverScript is licensed through the Tennessee Department of
Commerce and Insurance (the “TDCI”) as a domestic insurance
company under the applicable laws and regulations of the State
of Tennessee. Pursuant to these laws and regulations, SilverScript
must file quarterly and annual reports with the National Association
of Insurance Commissioners (“NAIC”), and the TDCI must
maintain certain minimum amounts of capital and surplus under
a formula established by the NAIC and must, in certain circum-
stances, request and receive the approval of the TDCI before
making dividend payments or other capital distributions to the
Company. The Company does not believe these limitations on
dividends and distributions materially impact its financial position.
SilverScript is licensed as or has filed expansion applications for
licensure as an insurance company in other jurisdictions where
it does or may seek to do business. Certain of the expansion
insurance licensure applications for states in which SilverScript
currently operates were pending as of the date of this filing.
The Company has recorded estimates of various assets and
liabilities arising from its participation in the Medicare Part D
program based on information in its claims management
and enrollment systems. Significant estimates arising from its
participation in this program include: (i) estimates of low-income
cost subsidy and reinsurance amounts ultimately payable to or
receivable from CMS based on a detailed claims reconciliation
that will occur in 2008; (ii) estimates of amounts payable to or
receivable from other PDPs for claims costs incurred as a result
of retroactive enrollment changes, which were communicated by
CMS after such claims had been incurred; and (iii) an estimate of
amounts receivable from or payable to CMS under a risk-sharing
feature of the Medicare Part D program design, referred to as
the risk corridor.
Employee Stock Ownership PlanThe Company sponsors a defined contribution Employee Stock
Ownership Plan (the “ESOP”) that covers full-time employees
with at least one year of service.
In 1989, the ESOP Trust issued and sold $357.5 million of 20-year,
8.52% notes due December 31, 2008 (the “ESOP Notes”). The
proceeds from the ESOP Notes were used to purchase 6.7 million
shares of Series One ESOP Convertible Preference Stock (the
“ESOP Preference Stock”) from the Company. Since the ESOP
Notes are guaranteed by the Company, the outstanding balance
is reflected as long-term debt, and a corresponding guaranteed
ESOP obligation is reflected in shareholders’ equity in the
accompanying consolidated balance sheets.
Each share of ESOP Preference Stock has a guaranteed minimum
liquidation value of $53.45, is convertible into 4.628 shares of
common stock and is entitled to receive an annual dividend of
$3.90 per share.
The ESOP Trust uses the dividends received and contributions
from the Company to repay the ESOP Notes. As the ESOP Notes
are repaid, ESOP Preference Stock is allocated to participants based
on (i) the ratio of each year’s debt service payment to total current
and future debt service payments multiplied by (ii) the number of
unallocated shares of ESOP Preference Stock in the plan.
As of December 29, 2007, 3.8 million shares of ESOP Preference
Stock were outstanding, of which 3.4 million shares were
allocated to participants and the remaining 0.4 million shares
were held in the ESOP Trust for future allocations.
Annual ESOP expense recognized is equal to (i) the interest
incurred on the ESOP Notes plus (ii) the higher of (a) the principal
repayments or (b) the cost of the shares allocated, less (iii) the
dividends paid. Similarly, the guaranteed ESOP obligation is
reduced by the higher of (i) the principal payments or (ii) the
cost of shares allocated.
Following is a summary of the ESOP activity for the respective years:
In millions 2007 2006 2005
ESOP expense recognized $ 29.8 $ 26.0 $ 22.7Dividends paid 14.8 15.6 16.2Cash contributions 29.8 26.0 22.7Interest payments 7.0 9.7 12.0ESOP shares allocated 0.4 0.4 0.3
#8#7
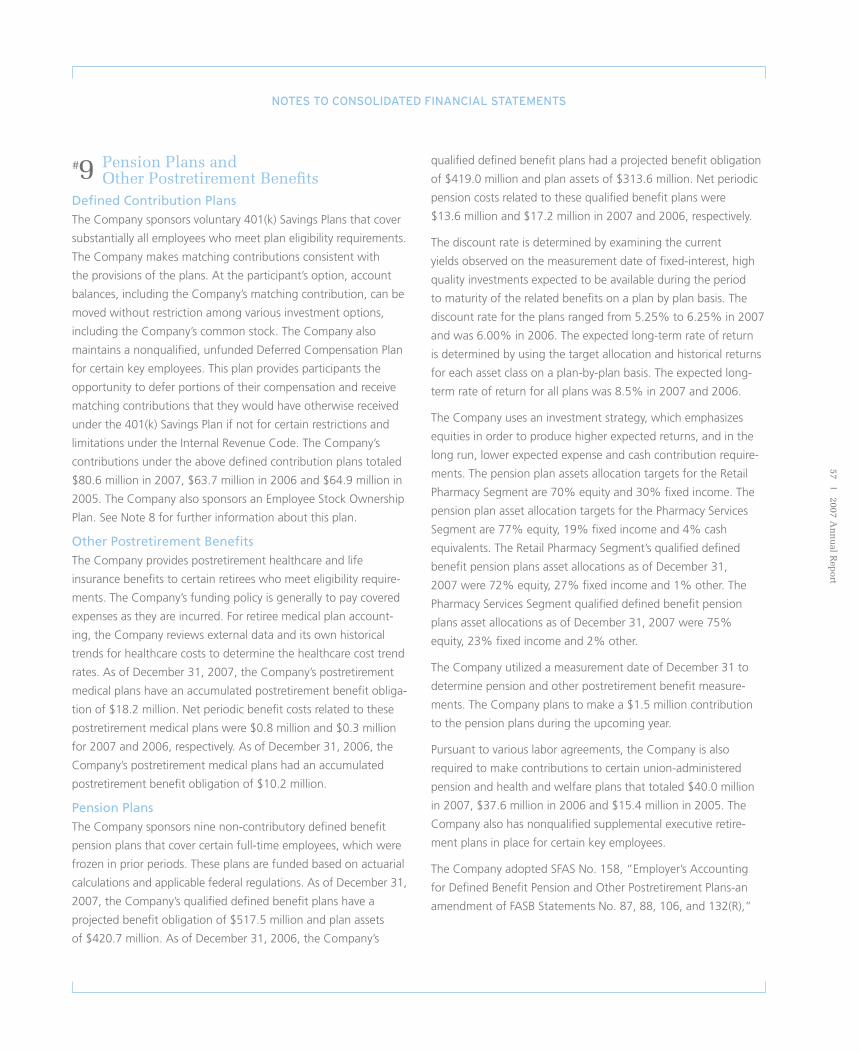
notestoconsoliDateDfinancialstateMents
57 I 2007 An
nu
al Rep
ort
Pension Plans and Other Postretirement Benefits
Defined Contribution PlansThe Company sponsors voluntary 401(k) Savings Plans that cover
substantially all employees who meet plan eligibility requirements.
The Company makes matching contributions consistent with
the provisions of the plans. At the participant’s option, account
balances, including the Company’s matching contribution, can be
moved without restriction among various investment options,
including the Company’s common stock. The Company also
maintains a nonqualified, unfunded Deferred Compensation Plan
for certain key employees. This plan provides participants the
opportunity to defer portions of their compensation and receive
matching contributions that they would have otherwise received
under the 401(k) Savings Plan if not for certain restrictions and
limitations under the Internal Revenue Code. The Company’s
contributions under the above defined contribution plans totaled
$80.6 million in 2007, $63.7 million in 2006 and $64.9 million in
2005. The Company also sponsors an Employee Stock Ownership
Plan. See Note 8 for further information about this plan.
Other Postretirement BenefitsThe Company provides postretirement healthcare and life
insurance benefits to certain retirees who meet eligibility require-
ments. The Company’s funding policy is generally to pay covered
expenses as they are incurred. For retiree medical plan account-
ing, the Company reviews external data and its own historical
trends for healthcare costs to determine the healthcare cost trend
rates. As of December 31, 2007, the Company’s postretirement
medical plans have an accumulated postretirement benefit obliga-
tion of $18.2 million. Net periodic benefit costs related to these
postretirement medical plans were $0.8 million and $0.3 million
for 2007 and 2006, respectively. As of December 31, 2006, the
Company’s postretirement medical plans had an accumulated
postretirement benefit obligation of $10.2 million.
Pension PlansThe Company sponsors nine non-contributory defined benefit
pension plans that cover certain full-time employees, which were
frozen in prior periods. These plans are funded based on actuarial
calculations and applicable federal regulations. As of December 31,
2007, the Company’s qualified defined benefit plans have a
projected benefit obligation of $517.5 million and plan assets
of $420.7 million. As of December 31, 2006, the Company’s
qualified defined benefit plans had a projected benefit obligation
of $419.0 million and plan assets of $313.6 million. Net periodic
pension costs related to these qualified benefit plans were
$13.6 million and $17.2 million in 2007 and 2006, respectively.
The discount rate is determined by examining the current
yields observed on the measurement date of fixed-interest, high
quality investments expected to be available during the period
to maturity of the related benefits on a plan by plan basis. The
discount rate for the plans ranged from 5.25% to 6.25% in 2007
and was 6.00% in 2006. The expected long-term rate of return
is determined by using the target allocation and historical returns
for each asset class on a plan-by-plan basis. The expected long-
term rate of return for all plans was 8.5% in 2007 and 2006.
The Company uses an investment strategy, which emphasizes
equities in order to produce higher expected returns, and in the
long run, lower expected expense and cash contribution require-
ments. The pension plan assets allocation targets for the Retail
Pharmacy Segment are 70% equity and 30% fixed income. The
pension plan asset allocation targets for the Pharmacy Services
Segment are 77% equity, 19% fixed income and 4% cash
equivalents. The Retail Pharmacy Segment’s qualified defined
benefit pension plans asset allocations as of December 31,
2007 were 72% equity, 27% fixed income and 1% other. The
Pharmacy Services Segment qualified defined benefit pension
plans asset allocations as of December 31, 2007 were 75%
equity, 23% fixed income and 2% other.
The Company utilized a measurement date of December 31 to
determine pension and other postretirement benefit measure-
ments. The Company plans to make a $1.5 million contribution
to the pension plans during the upcoming year.
Pursuant to various labor agreements, the Company is also
required to make contributions to certain union-administered
pension and health and welfare plans that totaled $40.0 million
in 2007, $37.6 million in 2006 and $15.4 million in 2005. The
Company also has nonqualified supplemental executive retire-
ment plans in place for certain key employees.
The Company adopted SFAS No. 158, “Employer’s Accounting
for Defined Benefit Pension and Other Postretirement Plans-an
amendment of FASB Statements No. 87, 88, 106, and 132(R),”
#9

notestoconsoliDateDfinancialstateMents
58
I C
VS
Car
emar
k
effective December 15, 2006. SFAS No. 158 requires an employer
to recognize in its statement of financial position an asset for a
plan’s overfunded status or a liability for a plan’s underfunded
status, measure a plan’s assets and its obligations that determine
its funded status as of the end of the employer’s fiscal year, and
recognize changes in the funded status of a defined benefit
postretirement plan in the year in which the changes occur.
Those changes are reported in comprehensive income and in a
separate component of shareholders’ equity. The adoption of
this statement did not have a material impact on the Company’s
consolidated results of operations, financial position or cash flows.
Stock Incentive PlansOn January 1, 2006, the Company adopted SFAS No. 123(R),
“Share-Based Payment”, using the modified prospective transi-
tion method. Under this method, compensation expense is
recognized for options granted on or after January 1, 2006
as well as any unvested options on the date of adoption.
Compensation expense for unvested stock options outstanding
at January 1, 2006 is recognized over the requisite service period
based on the grant-date fair value of those options and awards
as previously calculated under the SFAS No. 123(R) pro forma
disclosure requirements. As allowed under the modified prospec-
tive transition method, prior period financial statements have not
been restated. Prior to January 1, 2006, the Company accounted
for its stock-based compensation plans under the recognition and
measurement principles of APB Opinion No. 25, “Accounting for
Stock Issued to Employees,” and related interpretations. As such,
no stock-based employee compensation costs were reflected in
net earnings for options granted under those plans since they had
an exercise price equal to the fair market value of the underlying
common stock on the date of grant.
Compensation expense related to stock options, which
includes the 1999 Employee Stock Purchase Plan (“1999 ESPP”)
and the 2007 Employee Stock Purchase Plan (“2007 ESPP” and
collectively the “ESPP”) totaled $84.5 million for 2007, compared
to $60.7 million for 2006. The recognized tax benefit was
$26.9 million and $18.0 million for 2007 and 2006, respectively.
Compensation expense related to restricted stock awards totaled
$12.1 million for 2007, compared to $9.2 million for 2006.
Compensation costs associated with the Company’s share-
based payments are included in selling, general and
administrative expenses.
The following table includes the effect on net earnings and
earnings per share if stock compensation costs had been
determined consistent with the fair value recognition provisions
of SFAS No. 123(R) for 2005:
In millions, except per share amounts 2005
Net earnings, as reported $ 1,224.7Add: Stock-based employee compensation expense included in reported net earnings, net of related tax effects(1) 4.8Deduct: Total stock-based employee compensation expense determined under fair value based method for all awards, net of related tax effects 48.6Pro forma net earnings $ 1,180.9Basic EPS: As reported $ 1.49 Pro forma 1.44Diluted EPS: As reported $ 1.45 Pro forma 1.40
(1) Amounts represent the after-tax compensation costs for restricted stock grants and expense related to the acceleration of vesting of stock options on certain terminated employees.
The 1999 ESPP provides for the purchase of up to 14.8 million
shares of common stock. As a result of the 1999 ESPP not
having sufficient shares available for the program to continue
beyond 2007, the Board of Directors adopted, and shareholders
approved, the 2007 ESPP. Under the 2007 ESPP, eligible employ-
ees may purchase common stock at the end of each six-month
offering period, at a purchase price equal to 85% of the lower
of the fair market value on the first day or the last day of
the offering period and provides for the purchase of up to
15.0 million shares of common stock. During 2007, 1.9 million
shares of common stock were purchased, under the provisions of
the 1999 ESPP, at an average price of $25.10 per share. As of
December 29, 2007, 14.1 million shares of common stock have
been issued under the 1999 ESPP. As of December 29, 2007, no
common stock had been issued under the 2007 ESPP.
The fair value of stock compensation expense associated with
the Company’s ESPP is estimated on the date of grant (i.e.,
the beginning of the offering period) using the Black-Scholes
Option Pricing Model and is recorded as a liability, which is
adjusted to reflect the fair value of the award at the end of
each reporting period until settlement date.
#10

notestoconsoliDateDfinancialstateMents
59 I 2007 An
nu
al Rep
ort
Following is a summary of the assumptions used to value the
ESPP awards for each of the respective periods:
2007 2006 2005
Dividend yield(1) 0.33% 0.26% 0.26%Expected volatility(2) 21.72% 26.00% 16.40%Risk-free interest rate(3) 5.01% 5.08% 3.35%Expected life (in years)(4) 0.5 0.5 0.5
(1) The dividend yield is calculated based on semi-annual dividends paid and the fair market value of the Company’s stock at the period end date.
(2) The expected volatility is based on the historical volatility of the Company’s daily stock market prices over the previous six-month period.
(3) The risk-free interest rate is based on the Treasury constant maturity interest rate whose term is consistent with the expected term of ESPP options (i.e., 6 months).
(4) The expected life is based on the semi-annual purchase period.
The Company’s 1997 Incentive Compensation Plan (the “ICP”)
provides for the granting of up to 152.8 million shares of
common stock in the form of stock options and other awards
to selected officers, employees and directors of the Company.
The ICP allows for up to 7.2 million restricted shares to be issued.
The Company’s restricted awards are considered nonvested share
awards as defined under SFAS 123(R). The restricted awards require
no payment from the employee. Compensation cost is recorded
based on the market price on the grant date and is recognized on
a straight-line basis over the requisite service period.
The Company granted 5,000 and 427,000 shares of restricted
stock with a weighted average per share grant date fair value
of $28.71 and $24.80, in 2006 and 2005, respectively. In addition,
the Company granted 1,129,000, 673,000 and 812,000 restricted
stock units with a weighted average fair value of $33.75, $29.40
and $26.02 in 2007, 2006 and 2005, respectively. Compensation
costs for restricted shares and units totaled $12.1 million in 2007,
$9.2 million in 2006 and $5.9 million in 2005.
In 2007, the Board of Directors adopted and shareholders
approved the 2007 Incentive Plan. The terms of the 2007
Incentive Plan provide for grants of annual incentive and long-
term performance awards that may be settled in cash or other
property to executive officers and other officers and employees
of the Company or any subsidiary of the Company. No awards
were granted from the 2007 Incentive Plan during 2007.
Following is a summary of the restricted share award activity under the ICP as of December 29, 2007:
2007 2006
Weighted Weighted Averagegrant Average Grant Shares in thousands shares DateFairvalue Shares Date Fair Value
Nonvested at beginning of year 306 $ 22.08 501 $ 20.80Granted – – 5 28.71Vested (129) 32.75 (197) 18.94Forfeited (16) 22.00 (3) 24.71Nonvested at end of year 161 $ 22.40 306 $ 22.08
Following is a summary of the restricted unit award activity under the ICP as of December 29, 2007:
2007 2006
Weighted Weighted Averagegrant Average Grant Units in thousands units DateFairvalue Units Date Fair Value
Nonvested at beginning of year 2,009 $ 25.22 1,377 $ 23.10Granted 1,129 33.75 673 29.40Vested (198) 34.99 (16) 33.80Forfeited (25) 23.24 (25) 25.22Nonvested at end of year 2,915 $ 28.23 2,009 $ 25.22

notestoconsoliDateDfinancialstateMents
60
I C
VS
Car
emar
k
Following is a summary of the Company’s stock option activity as of December 29, 2007:
WeightedAverage WeightedAverage remaining AggregateShares in thousands shares Exerciseprice contractualTerm intrinsicvalue
Outstanding at December 30, 2006 41,617 $ 21.35 – –Granted 12,958 34.66 – –Issued in Caremark Merger 36,838 16.44 – –Exercised (29,868) 16.47 – –Forfeited (1,165) 30.49 – –Expired (358) 18.39 – –Outstanding at December 29, 2007 60,022 $ 23.47 5.00 $ 992,215,995Exercisable at December 29, 2007 40,492 $ 19.23 4.61 $ 840,981,532
All grants under the ICP are awarded at fair market value on
the date of grant. The fair value of stock options is estimated
using the Black-Scholes Option Pricing Model and compensation
expense is recognized on a straight-line basis over the requisite
service period. Options granted prior to 2004 generally become
exercisable over a four-year period from the grant date and expire
ten years after the date of grant. Options granted during and
subsequent to fiscal 2004 generally become exercisable over a
three-year period from the grant date and expire seven years
after the date of grant. As of December 29, 2007, there were
73.4 million shares available for future grants under the ICP.
SFAS No. 123(R) requires that the benefit of tax deductions
in excess of recognized compensation cost be reported as a
financing cash flow, rather than as an operating cash flow as
required under prior guidance. Excess tax benefits of $97.8 mil-
lion and $42.6 million were included in financing activities in
the accompanying consolidated statement of cash flow during
2007 and 2006, respectively. Cash received from stock options
exercised, which includes the ESPP, totaled $552.4 million and
$187.6 million during 2007 and 2006, respectively. The total
intrinsic value of options exercised during 2007 was $642.3 mil-
lion, compared to $117.8 million and $117.5 million in 2006 and
2005, respectively. The fair value of options exercised during 2007
was $1.2 billion, compared to $257.1 million and $263.3 million
during 2006 and 2005, respectively.
The fair value of each stock option is estimated using the Black-
Scholes Option Pricing Model based on the following assumptions at
the time of grant:
2007 2006 2005
Dividend yield(1) 0.69% 0.50% 0.56%Expected volatility(2) 23.84% 24.58% 34.00%Risk-free interest rate(3) 4.49% 4.7% 4.3%Expected life (in years) (4) 5.12 4.2 5.7Weighted average grant date fair value $ 8.29 $ 8.46 $ 8.46
(1) The dividend yield is based on annual dividends paid and the fair market value of the Company’s stock at the period end date.
(2) The expected volatility is estimated using the Company’s historical volatility over a period equal to the expected life of each option grant after adjustments for infrequent events such as stock splits.
(3) The risk-free interest rate is selected based on yields from U.S. Treasury zero-coupon issues with a remaining term equal to the expected term of the options being valued.
(4) The expected life represents the number of years the options are expected to be outstanding from grant date based on historical option holder exercise experience.
As of December 29, 2007, unrecognized compensation expense
related to unvested options totaled $126.0 million, which the
Company expects to be recognized over a weighted-average
period of 1.8 years. After considering anticipated forfeitures, the
Company expects approximately 18.7 million of the unvested
options to vest over the requisite service period.

notestoconsoliDateDfinancialstateMents
61 I 2007 An
nu
al Rep
ort
Commitments & ContingenciesBetween 1991 and 1997, the Company sold or spun off a
number of subsidiaries, including Bob’s Stores, Linens ’n Things,
Marshalls, Kay-Bee Toys, Wilsons, This End Up and Footstar.
In many cases, when a former subsidiary leased a store, the
Company provided a guarantee of the store’s lease obligations.
When the subsidiaries were disposed of, the Company’s guaran-
tees remained in place, although each initial purchaser has
indemnified the Company for any lease obligations the Company
was required to satisfy. If any of the purchasers or any of the
former subsidiaries were to become insolvent and failed to make
the required payments under a store lease, the Company could
be required to satisfy these obligations. As of December 29,
2007, the Company guaranteed approximately 220 such store
leases, with the maximum remaining lease term extending
through 2022. Assuming that each respective purchaser became
insolvent and the Company was required to assume all of these
lease obligations, management estimates that the Company
could settle the obligations for approximately $325 to $375 mil-
lion as of December 29, 2007.
Management believes the ultimate disposition of any of the
guarantees will not have a material adverse effect on the
Company’s consolidated financial condition, results of operations
or future cash flows.
In 2006, a number of shareholder derivative lawsuits have been
filed in the Tennessee state court and the Tennessee federal court
against Caremark and various officers and directors of Caremark
seeking, among other things, a declaration that the directors
breached their fiduciary duties, imposition of a constructive trust
upon any illegal profits received by the defendants and punitive
and other damages. The cases brought in the Tennessee federal
court were consolidated into one action in August 2006, and
the consolidated action was voluntarily dismissed without
prejudice by the plaintiffs in March 2007. The cases brought in
the Tennessee state court were also consolidated into one action,
and the plaintiffs amended their complaint to add CVS and
its directors as defendants and to allege class action claims.
A stipulation of settlement was entered into by the parties on
July 5, 2007, which provided, among other things, that (i) the
plaintiffs will dismiss the case and release the defendants from
claims asserted in the action, (ii) a temporary restraining order
issued by the court in March 2007 will be vacated, (iii) defendants
will agree to maintain for at least four years a number of
corporate governance provisions relating to the granting, exercise
and disclosure of stock option awards and (iv) the defendants will
not oppose plaintiffs’ petition for an award of attorneys’ fees and
expenses not to exceed $7.5 million. As part of the settlement,
the defendants specifically denied any liability or wrongdoing
with respect to all claims alleged in the litigation, including claims
relating to stock option backdating, and acknowledged that they
entered into the settlement solely to avoid the distraction, burden
and expense of the pending litigation. The settlement was orally
approved by the court, but it remains subject to final court
approval. The settlement is also subject to a pending application
for extraordinary appeal filed by plaintiffs’ counsel relating to the
court’s prior rulings concerning the settlement and the award of
attorney’s fees and expenses.
Caremark’s subsidiary Caremark, Inc. (now known as Caremark,
L.L.C.) is a defendant in a qui tam lawsuit initially filed by a relator
on behalf of various state and federal government agencies in
Texas federal court in 1999. The case was unsealed in May 2005.
The case seeks money damages and alleges that Caremark’s
processing of Medicaid and certain other government claims on
behalf of its clients violates applicable federal or state false claims
acts and fraud statutes. The U.S. Department of Justice and the
States of Texas, Tennessee, Florida, Arkansas, Louisiana and
California intervened in the lawsuit, but Tennessee and Florida
withdrew from the lawsuit in August 2006 and May 2007,
respectively. A phased approach to discovery is ongoing. The parties
have filed cross motions for partial summary judgment, argued
those motions before the court, and final rulings are pending.
In December 2007, the Company received a document subpoena
from the Office of Inspector General within the United States
Department of Health and Human Services requesting certain
information relating to the processing of Medicaid claims and
claims of certain other government programs on an adjudication
platform of AdvancePCS (now known as CaremarkPCS, L.L.C.).
The Company will cooperate with these requests for information
and cannot predict the timing, outcome, or consequence of the
review of such information.
#11

notestoconsoliDateDfinancialstateMents
62
I C
VS
Car
emar
k
Caremark’s subsidiary Caremark Inc. (now known as Caremark,
L.L.C.) has been named in a putative class action lawsuit filed
in July 2004, in Tennessee federal court by an individual named
Robert Moeckel, purportedly on behalf of the John Morrell
Employee Benefits Plan, which is an employee benefit plan
sponsored by a former Caremark client. The lawsuit, which seeks
unspecified damages and injunctive relief, alleges that Caremark
acts as a fiduciary under ERISA and has breached certain alleged
fiduciary duties under ERISA. In November 2007, the court
granted Caremark Inc.’s motion for partial summary judgment
finding that it is not an ERISA fiduciary under the applicable
PBM agreements and that the plaintiff may not sustain claims
for breach of fiduciary duty.
In 2004, Caremark received Civil Investigative Demands or
similar requests for information relating to certain PBM business
practices of its Caremark Inc. (now known as Caremark, L.L.C.)
and AdvancePCS, (now known as CaremarkPCS, L.L.C.) subsidiar-
ies under state consumer protection statutes from 28 states plus
the District of Columbia. On February 14, 2008, Caremark
entered into a settlement concluding this investigation. Caremark
agreed to pay $12 million in settlement on behalf of AdvancePCS,
$10 million in settlement on behalf of Caremark Inc., $16.5 million
in state investigative costs and up to $2.5 million to reimburse
certain medical tests. In addition, Caremark entered into a
consent order requiring it to maintain certain PBM business
practices. Caremark has expressly denied all wrongdoing and
entered into the settlement to avoid the uncertainty and expense
of the investigation.
Caremark was named in a putative class action lawsuit filed
on October 22, 2003 in Alabama state court by John Lauriello,
purportedly on behalf of participants in the 1999 settlement
of various securities class action and derivative lawsuits against
Caremark and others. Other defendants include insurance
companies that provided coverage to Caremark with respect to
the settled lawsuits. The Lauriello lawsuit seeks approximately
$3.2 billion in compensatory damages plus other non-specified
damages based on allegations that the amount of insurance
coverage available for the settled lawsuits was misrepresented
and suppressed. A similar lawsuit was filed on November 5, 2003,
by Frank McArthur, also in Alabama state court, naming as
defendants Caremark, several insurance companies, attorneys
and law firms involved in the 1999 settlement. This lawsuit was
subsequently stayed by the court as a later-filed class action.
In 2005, the trial court in the Lauriello case issued an order
allowing the Lauriello case to proceed on behalf of the settlement
class in the 1999 securities class action. McArthur then sought to
intervene in the Lauriello case and to challenge the adequacy of
Lauriello as class representative and his lawyers as class counsel.
The trial court denied McArthur’s motion to intervene, but the
Alabama Supreme Court subsequently ordered the lower court
to vacate its prior order on class certification and allow McArthur
to intervene. Caremark and other defendants filed motions
to dismiss the complaint in intervention filed by McArthur. In
November 2007, the trial court dismissed the attorneys and
law firms named as defendants in the McArthur complaint in
intervention and denied the motions to dismiss that complaint
filed by Caremark and the insurance company defendants. In
January 2008, Lauriello filed a motion to dismiss McArthur’s
complaint in intervention, appealed the court’s dismissal of the
attorney and law firm defendants and filed a motion to stay
proceedings pending his appeal.
Various lawsuits have been filed alleging that Caremark and its
subsidiaries Caremark Inc. (now known as Caremark, L.L.C.) and
AdvancePCS (now known as CaremarkPCS, L.L.C.) have violated
applicable antitrust laws in establishing and maintaining retail
pharmacy networks for client health plans. In August 2003,
Bellevue Drug Co., Robert Schreiber, Inc. d/b/a Burns Pharmacy
and Rehn-Huerbinger Drug Co. d/b/a Parkway Drugs #4, together
with Pharmacy Freedom Fund and the National Community
Pharmacists Association filed a putative class action against
AdvancePCS in Pennsylvania federal court, seeking treble damages
and injunctive relief. The claims were initially sent to arbitration
based on contract terms between the pharmacies and AdvancePCS.
In October 2003, two independent pharmacies, North Jackson
Pharmacy, Inc. and C&C, Inc. d/b/a Big C Discount Drugs, Inc.
filed a putative class action complaint in Alabama federal court
against Caremark, Caremark Inc. AdvancePCS and two PBM
competitors, seeking treble damages and injunctive relief. The
case against Caremark and Caremark Inc. was transferred to
Illinois federal court, and the AdvancePCS case was sent to
arbitration based on contract terms between the pharmacies
and AdvancePCS. The arbitration was then stayed by the parties
pending developments in Caremark’s court case.

notestoconsoliDateDfinancialstateMents
63 I 2007 An
nu
al Rep
ort
In August 2006, the Bellevue case and the North Jackson
Pharmacy case were transferred to Pennsylvania federal court by
the Judicial Panel on Multidistrict Litigation for coordinated and
consolidated proceedings with other cases before the panel,
including cases against other PBMs. Caremark has appealed a
decision which vacated the order compelling arbitration and
staying the proceedings in the Bellevue case to the Third Circuit
Court of Appeals. Motions for class certification in the coordinated
cases within the multidistrict litigation, including the North Jackson
Pharmacy case, remain pending. The consolidated action is now
known as the In Re Pharmacy Benefit Managers Antitrust Litigation.
Caremark and its subsidiaries Caremark Inc. (now known as
Caremark, L.L.C.) and AdvancePCS (now known as CaremarkPCS,
L.L.C.) have been named in a putative class action lawsuit filed
in California state court by an individual named Robert Irwin,
purportedly on behalf of California members of non-ERISA health
plans and/or all California taxpayers. The lawsuit, which also
names other PBMs as defendants, alleges violations of California’s
unfair competition laws and challenges alleged business practices
of PBMs, including practices relating to pricing, rebates, formulary
management, data utilization and accounting and administrative
processes. Discovery in the case is ongoing.
The Rhode Island Attorney General’s Office, the Rhode Island
Ethics Commission, and the United States Attorney’s Office
for the District of Rhode Island have been investigating the
business relationships between certain former members of
the Rhode Island General Assembly and various Rhode Island
companies, including Roger Williams Medical Center, Blue Cross
& Blue Shield of Rhode Island and CVS. In connection with the
investigation of these business relationships, a former state
senator was criminally charged in 2005 by federal and state
authorities and has pled guilty to those charges, and a former
state representative was criminally charged in October 2007
by federal authorities and pled guilty to those charges. In
January 2007, two CVS employees on administrative leave from
the Company were indicted on federal charges relating to their
involvement in entering into a $12,000 per year consulting
agreement with the former state senator eight years ago. The
indictment alleges that the two CVS employees concealed the
true nature of the Company’s relationship with the former state
senator from other Company officials and others. CVS will
continue to cooperate fully in this investigation, the timing and
outcome of which cannot be predicted with certainty at this time.
The Company has been named in a putative class action lawsuit
filed in California state court by Gabe Tong, purportedly on behalf
of current and former pharmacists working in the Company’s
California stores. The lawsuit alleges that CVS failed to provide
pharmacists in the purported class with meal and rest periods or
to pay overtime as required under California law. In October
2007, the Company reached a conditional agreement, subject to
the approval by the court, to resolve this matter. In addition, the
Company is party to other employment litigation arising in the
normal course of its business. The Company cannot predict the
outcome of any of these employment litigation matters at this
time, however, none of these matters are expected to be material
to the Company.
The United States Department of Justice and several state
attorneys general are investigating whether any civil or criminal
violations resulted from certain practices engaged in by CVS
and others in the pharmacy industry with regard to dispensing
one of two different dosage forms of a generic drug under
circumstances in which some state Medicaid programs at various
times reimbursed one dosage form at a different rate from the
other. The Company is in discussions with various governmental
agencies involved to resolve this matter on a civil basis and
without any admission or finding of any violation.
The Company is also a party to other litigation arising in the
normal course of its business, none of which is expected to be
material to the Company. The Company can give no assurance,
however, that our operating results and financial condition
will not be materially adversely affected, or that we will not be
required to materially change our business practices, based on:
(i) future enactment of new healthcare or other laws or regula-
tions; (ii) the interpretation or application of existing laws or
regulations, as they may relate to our business or the pharmacy
services industry; (iii) pending or future federal or state govern-
mental investigations of our business or the pharmacy services
industry; (iv) institution of government enforcement actions
against us; (v) adverse developments in any pending qui tam
lawsuit against us, whether sealed or unsealed, or in any future
qui tam lawsuit that may be filed against us; or (vi) adverse
developments in other pending or future legal proceedings
against us or affecting the pharmacy services industry.

notestoconsoliDateDfinancialstateMents
64
I C
VS
Car
emar
k
Income TaxesThe income tax provision consisted of the following for the
respective years:
In millions 2007 2006 2005
Current: Federal $ 1,250.8 $ 676.6 $ 632.8 State 241.3 127.3 31.7 1,492.1 803.9 664.5Deferred: Federal 206.0 47.6 17.9 State 23.6 5.4 1.9 229.6 53.0 19.8Total $ 1,721.7 $ 856.9 $ 684.3
Following is a reconciliation of the statutory income tax rate to
the Company’s effective tax rate for the respective years:
2007 2006 2005
Statutory income tax rate 35.0% 35.0% 35.0%State income taxes, net of federal tax benefit 4.2 3.9 3.9Other 0.3 0.1 (0.3)Federal and net State reserve release – (0.5) (2.8)Effective tax rate 39.5% 38.5% 35.8%
Following is a summary of the significant components of the
Company’s deferred tax assets and liabilities as of the respective
balance sheet dates:
Dec.29, Dec. 30, In millions 2007 2006
Deferred tax assets: Lease and rents $ 276.2 $ 265.8 Inventory 56.7 74.3 Employee benefits 186.0 82.4 Accumulated other comprehensive items 34.7 41.8 Allowance for bad debt 74.6 36.6 Retirement benefits 6.2 4.0 Other 170.9 68.5 NOL 26.9 26.3 Total deferred tax assets 832.2 599.7Deferred tax liabilities: Depreciation and amortization (3,928.9) (234.6)Total deferred tax liabilities (3,928.9) (234.6)Net deferred tax (liability)/assets $ (3,096.7) $ 365.1
The Company believes it is more likely than not the deferred
tax assets included in the above table will be realized during
future periods.
During the fourth quarters of 2006 and 2005, an assessment
of tax reserves resulted in the Company recording reductions of
previously recorded tax reserves through the income tax provision
of $11.0 million and $52.6 million, respectively.
The Company adopted FASB Interpretation No. 48, “Accounting
for Uncertainty in Income Taxes – an interpretation of FASB
Statement No. 109” (“FIN 48”), at the beginning of fiscal year
2007. As a result of the implementation, the Company reduced
its reserves for uncertain income tax positions by approximately
$4.0 million, which was accounted for as an increase to the
December 31, 2006 balance of retained earnings. The income
tax reserve increased during 2007 primarily due to the
Caremark Merger.
The following is a summary of our income tax reserve:
In millions 2007
Beginning Balance $ 43.2 Additions based on tax positions related to the current year 207.5 Additions based on tax positions of prior years 4.5 Reductions for tax positions of prior years (6.7) Expiration of statute of limitations (2.0) Settlements (13.1)Ending Balance $ 233.4
The Company and its subsidiaries are subject to U.S. federal
income tax as well as income tax of multiple state and local
jurisdictions. Substantially all material income tax matters have
been concluded for fiscal years through 1992.
On March 30, 2007, the Internal Revenue Service (the “IRS”)
completed an examination of the consolidated U.S. income tax
returns for AdvancePCS and its subsidiaries for the tax years
ended March 31, 2002, March 31, 2003 and March 24, 2004,
the date on which Caremark acquired AdvancePCS. In July 2007,
the IRS completed an examination of the Company’s consolidated
U.S. income tax returns for fiscal years 2004 and 2005.
During 2007, the IRS commenced an examination of the consoli-
dated U.S. income tax return of the Company for fiscal year 2007
pursuant to the Compliance Assurance Process (“CAP”) program.
The CAP program is a voluntary program under which taxpayers
seek to resolve all or most issues with the IRS prior to the filing
of their U.S. income tax returns in lieu of being audited in the
traditional manner.
#12

notestoconsoliDateDfinancialstateMents
65 I 2007 An
nu
al Rep
ort
In addition to the CAP examination, the IRS is examining
the Company’s consolidated U.S. income tax return for fiscal year
2006 and the consolidated U.S. income tax returns of Caremark
for fiscal years 2004 and 2005, which benefit from net operating
loss carry-forwards going back to 1993. The Company and its
subsidiaries are also currently under examination by various state
and local jurisdictions. As of December 29, 2007, no examination
has resulted in any proposed adjustments that would result in a
material change to the Company’s results of operations, financial
condition or liquidity.
The Company recognizes interest accrued related to unrecognized
tax benefits and penalties in income tax expense. During the
fiscal year ended December 29, 2007, the Company recognized
interest of approximately $17.8 million. The Company had
approximately $44.3 million accrued for interest and penalties
as of December 29, 2007.
There are no material reserves established at December 29,
2007 for income tax positions for which the ultimate deductibility
is highly certain but for which there is uncertainty about the
timing of such deductibility. If present, such items would impact
deferred tax accounting, not the annual effective income tax rate,
and would accelerate the payment of cash to the taxing authority
to an earlier period.
The total amount of unrecognized tax benefits that, if recognized,
would affect the effective income tax rate is approximately
$26.9 million, after considering the federal benefit of state
income taxes.
We are currently unable to estimate if there will be any significant
changes in the amount of unrecognized tax benefits over the next
twelve months. Pursuant to SFAS No. 141, “Business Combinations,”
and EITF No. 93-7, “Uncertainties Related to Income Taxes in a
Purchase Business Combination” (“EITF 93-7”), any income tax
adjustments made in the Company’s 2008 financial statements
that are related to pre-acquisition tax periods will result in
modifications to the assets acquired and liabilities assumed in
the applicable business combination.
Business SegmentsThe Company currently operates two business segments:
Retail Pharmacy and Pharmacy Services. The operating segments
are businesses of the Company for which separate financial
information is available and for which operating results are
evaluated on a regular basis by executive management in
deciding how to allocate resources and in assessing performance.
The Company’s business segments offer different products and
services and require distinct technology and marketing strategies.
As of December 29, 2007, the Retail Pharmacy Segment
included 6,245 retail drugstores, the Company’s online retail
website, CVS.com® and its retail healthcare clinics. The retail
drugstores are located in 40 states and the District of Columbia
and operate under the CVS® or CVS/pharmacy® name. The retail
healthcare clinics utilize nationally recognized medical protocols
to diagnose and treat minor health conditions and are staffed by
board-certified nurse practitioners and physician assistants. The
retail healthcare clinics operate under the MinuteClinic® name
and include 462 clinics located in 25 states, 437 of which are
located within the Company’s retail drugstores.
The Pharmacy Services Segment provides a full range of phar-
macy benefit management services to employers, managed care
providers and other organizations. These services include mail
order pharmacy services, specialty pharmacy services, plan design
and administration, formulary management and claims process-
ing, as well as providing insurance and reinsurance services in
conjunction with prescription drug benefit plans. The specialty
pharmacy business focuses on supporting individuals that require
complex and expensive drug therapies. Currently, the Pharmacy
Services Segment operates under the Caremark Pharmacy
Services®, PharmaCare Management Services® and PharmaCare
Pharmacy® names.
As of December 29, 2007, the Pharmacy Services Segment
included 56 retail specialty drugstores, 20 specialty mail order
pharmacies and 9 mail service pharmacies located in 26 states
and the District of Columbia.
The Company evaluates segment performance based on net
revenues, gross profit and operating profit before the effect
of certain intersegment activities and charges. The accounting
policies of the segments are substantially the same as those
described in Note 1.
#13

notestoconsoliDateDfinancialstateMents
66
I C
VS
Car
emar
k
Following is a reconciliation of the Company’s business segments to the consolidated financial statements:
Retail Pharmacy Pharmacy Services Intersegment ConsolidatedIn millions Segment Segment(1) Eliminations(2) Totals
2007: Net revenues $ 45,086.5 $ 34,938.4 $ (3,695.4) $ 76,329.5 Gross profit 13,110.6 2,997.1 16,107.7 Operating profit 2,691.3 2,102.0 4,793.3 Depreciation and amortization 805.3 289.3 1,094.6 Total assets 19,962.6 35,015.1 (255.8) 54,721.9 Goodwill 2,585.7 21,336.6 23,922.3 Additions to property and equipment 1,711.2 94.1 1,805.3
2006: Net revenues $ 40,285.6 $ 3,691.3 $ (155.5) $ 43,821.4 Gross profit 11,283.4 458.8 11,742.2 Operating profit 2,123.5 318.1 2,441.6 Depreciation and amortization 691.9 41.4 733.3 Total assets 19,038.8 1,603.4 (68.1) 20,574.1 Goodwill 2,572.4 622.8 3,195.2 Additions to property and equipment 1,750.5 18.4 1,768.9
2005: Net revenues $ 34,094.6 $ 2,956.7 $ (44.6) $ 37,006.7 Gross profit 9,349.1 345.5 9,694.6 Operating profit 1,797.1 222.4 2,019.5 Depreciation and amortization 548.5 40.6 589.1 Total assets 13,878.5 1,368.1 15,246.6 Goodwill 1,152.4 637.5 1,789.9 Additions to property and equipment 1,471.3 24.1 1,495.4
(1) Net Revenues of the Pharmacy Services Segment include approximately $4,618.2 million of Retail Co-Payments in 2007.
(2) Intersegment eliminations relate to intersegment revenues and accounts receivable that occur when a Pharmacy Services Segment customer uses a Retail Pharmacy Segment store to purchase covered products. When this occurs, both segments record the revenue on a standalone basis.

notestoconsoliDateDfinancialstateMents
67 I 2007 An
nu
al Rep
ort
Reconciliation of Earnings per Common ShareFollowing is a reconciliation of basic and diluted earnings per common share for the respective years:
In millions, except per share amounts 2007 2006 2005
numErATorForEArningspErcommonshArEcAlculATion: Net earnings $ 2,637.0 $ 1,368.9 $ 1,224.7 Preference dividends, net of income tax benefit (14.2) (13.9) (14.1) Net earnings available to common shareholders, basic $ 2,622.8 $ 1,355.0 $ 1,210.6 Net earnings $ 2,637.0 $ 1,368.9 $ 1,224.7 Dilutive earnings adjustment (3.6) (4.2) (4.4) Net earnings available to common shareholders, diluted $ 2,633.4 $ 1,364.7 $ 1,220.3
DEnominATorForEArningspErcommonshArEcAlculATion: Weighted average common shares, basic 1,328.2 820.6 811.4 Preference stock 18.0 18.8 19.5 Stock options 22.3 11.5 9.9 Restricted stock units 3.3 2.3 0.8 Weighted average common shares, diluted 1,371.8 853.2 841.6
BAsicEArningspErcommonshArE: Net earnings $ 1.97 $ 1.65 $ 1.49
DiluTEDEArningspErcommonshArE: Net earnings $ 1.92 $ 1.60 $ 1.45
#14

notestoconsoliDateDfinancialstateMents
68
I C
VS
Car
emar
k
Quarterly Financial Information (Unaudited)In millions, except per share amounts First Quarter Second Quarter Third Quarter Fourth Quarter Fiscal Year
2007: Net revenues $ 13,188.6 $ 20,703.3 $ 20,495.2 $ 21,942.4 $ 76,329.5 Gross profit 3,303.2 4,158.5 4,195.2 4,450.8 16,107.7 Operating profit 736.5 1,309.8 1,271.1 1,475.9 4,793.3 Net earnings 408.9 723.6 689.5 815.0 2,637.0 Net earnings per common share, basic 0.45 0.48 0.47 0.56 1.97 Net earnings per common share, diluted 0.43 0.47 0.45 0.55 1.92 Dividends per common share 0.04875 0.06000 0.06000 0.06000 0.22875 Stock price: (New York Stock Exchange) High 34.93 39.44 39.85 42.60 42.60 Low 30.45 34.14 34.80 36.43 30.45 Registered shareholders at year-end 16,706
2006: Net revenues $ 9,979.9 $ 10,564.4 $ 11,208.8 $ 12,068.3 $ 43,821.4 Gross profit 2,594.8 2,794.7 3,035.6 3,317.1 11,742.2 Operating profit 560.5 595.0 536.8 749.3 2,441.6 Net earnings(1) 329.6 337.9 284.2 417.2 1,368.9 Net earnings per common share, basic(1) 0.40 0.41 0.34 0.50 1.65 Net earnings per common share, diluted(1) 0.39 0.40 0.33 0.49 1.60 Dividends per common share 0.03875 0.03875 0.03875 0.03875 0.15500 Stock price: (New York Stock Exchange) High 30.98 31.89 36.14 32.26 36.14 Low 26.06 27.51 29.85 27.09 26.06
(1) Net earnings and net earnings per common share for the fourth quarter and fiscal year 2006 include the $24.7 million after-tax effect of adopting SAB No. 108.
#15
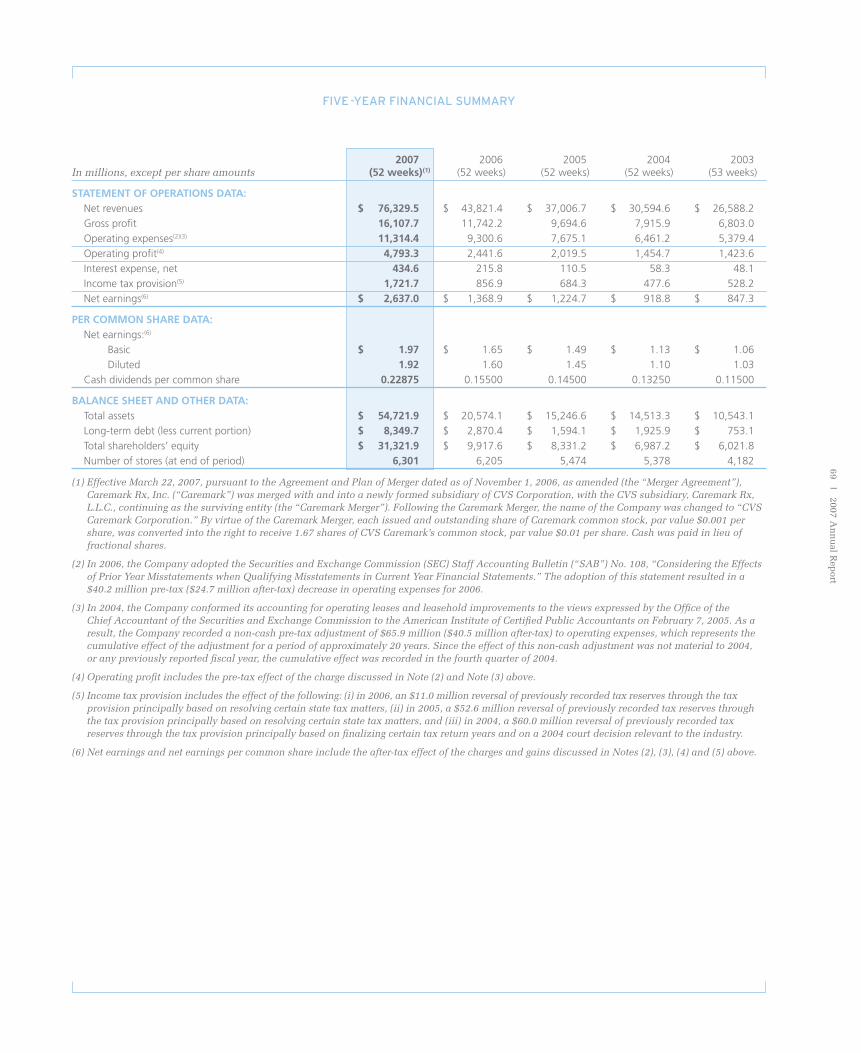
69 I 2007 An
nu
al Rep
ort
five-yeaRfinancialsuMMaRy
2007 2006 2005 2004 2003 In millions, except per share amounts (52weeks)(1) (52 weeks) (52 weeks) (52 weeks) (53 weeks)
sTATEmEnToFopErATionsDATA: Net revenues $ 76,329.5 $ 43,821.4 $ 37,006.7 $ 30,594.6 $ 26,588.2 Gross profit 16,107.7 11,742.2 9,694.6 7,915.9 6,803.0 Operating expenses(2)(3) 11,314.4 9,300.6 7,675.1 6,461.2 5,379.4 Operating profit(4) 4,793.3 2,441.6 2,019.5 1,454.7 1,423.6 Interest expense, net 434.6 215.8 110.5 58.3 48.1 Income tax provision(5) 1,721.7 856.9 684.3 477.6 528.2 Net earnings(6) $ 2,637.0 $ 1,368.9 $ 1,224.7 $ 918.8 $ 847.3
pErcommonshArEDATA: Net earnings:(6)
Basic $ 1.97 $ 1.65 $ 1.49 $ 1.13 $ 1.06 Diluted 1.92 1.60 1.45 1.10 1.03 Cash dividends per common share 0.22875 0.15500 0.14500 0.13250 0.11500
BAlAncEshEETAnDoThErDATA: Total assets $ 54,721.9 $ 20,574.1 $ 15,246.6 $ 14,513.3 $ 10,543.1 Long-term debt (less current portion) $ 8,349.7 $ 2,870.4 $ 1,594.1 $ 1,925.9 $ 753.1 Total shareholders’ equity $ 31,321.9 $ 9,917.6 $ 8,331.2 $ 6,987.2 $ 6,021.8 Number of stores (at end of period) 6,301 6,205 5,474 5,378 4,182
(1) Effective March 22, 2007, pursuant to the Agreement and Plan of Merger dated as of November 1, 2006, as amended (the “Merger Agreement”), Caremark Rx, Inc. (“Caremark”) was merged with and into a newly formed subsidiary of CVS Corporation, with the CVS subsidiary, Caremark Rx, L.L.C., continuing as the surviving entity (the “Caremark Merger”). Following the Caremark Merger, the name of the Company was changed to “CVS Caremark Corporation.” By virtue of the Caremark Merger, each issued and outstanding share of Caremark common stock, par value $0.001 per share, was converted into the right to receive 1.67 shares of CVS Caremark’s common stock, par value $0.01 per share. Cash was paid in lieu of fractional shares.
(2) In 2006, the Company adopted the Securities and Exchange Commission (SEC) Staff Accounting Bulletin (“SAB”) No. 108, “Considering the Effects of Prior Year Misstatements when Qualifying Misstatements in Current Year Financial Statements.” The adoption of this statement resulted in a $40.2 million pre-tax ($24.7 million after-tax) decrease in operating expenses for 2006.
(3) In 2004, the Company conformed its accounting for operating leases and leasehold improvements to the views expressed by the Office of the Chief Accountant of the Securities and Exchange Commission to the American Institute of Certified Public Accountants on February 7, 2005. As a result, the Company recorded a non-cash pre-tax adjustment of $65.9 million ($40.5 million after-tax) to operating expenses, which represents the cumulative effect of the adjustment for a period of approximately 20 years. Since the effect of this non-cash adjustment was not material to 2004, or any previously reported fiscal year, the cumulative effect was recorded in the fourth quarter of 2004.
(4) Operating profit includes the pre-tax effect of the charge discussed in Note (2) and Note (3) above.
(5) Income tax provision includes the effect of the following: (i) in 2006, an $11.0 million reversal of previously recorded tax reserves through the tax provision principally based on resolving certain state tax matters, (ii) in 2005, a $52.6 million reversal of previously recorded tax reserves through the tax provision principally based on resolving certain state tax matters, and (iii) in 2004, a $60.0 million reversal of previously recorded tax reserves through the tax provision principally based on finalizing certain tax return years and on a 2004 court decision relevant to the industry.
(6) Net earnings and net earnings per common share include the after-tax effect of the charges and gains discussed in Notes (2), (3), (4) and (5) above.

70
I C
VS
Car
emar
k
RepoRtofinDepenDentRegisteReDpublicaccountingfiRM
The Board of Directors and Shareholders CVS Caremark Corporation
We have audited the accompanying consolidated balance sheet of CVS Caremark Corporation as of December 29, 2007, and the related consolidated statements of operations, shareholders’ equity and cash flows for the fifty-two week period ended December 29, 2007. These consolidated financial statements are the responsibility of the Company’s management. Our responsibility is to express an opinion on these consolidated financial statements based on our audit.
We conducted our audit in accordance with the standards of the Public Company Accounting Oversight Board (United States). Those standards require that we plan and perform the audit to obtain reasonable assurance about whether the financial statements are free of material misstatement. An audit includes examining, on a test basis, evidence supporting the amounts and disclosures in the financial statements. An audit also includes assessing the accounting principles used and significant estimates made by management, as well as evaluating the overall financial statement presentation. We believe that our audit provides a reasonable basis for our opinion.
In our opinion, the 2007 consolidated financial statements referred to above present fairly, in all material respects, the consolidated financial position of CVS Caremark Corporation at December 29, 2007, and the consolidated results of its operations and its cash flows for the fifty-two week period ended December 29, 2007, in conformity with U.S. generally accepted accounting principles.
As discussed in Note 1 to the consolidated financial statements, effective December 31, 2006, CVS Caremark Corporation adopted Financial Accounting Standards Board (FASB) Interpretation No. 48, Accounting for Uncertainty in Income Taxes – an interpretation of FASB Statement No.109.
We also have audited, in accordance with the standards of the Public Company Accounting Oversight Board (United States), CVS Caremark Corporation’s internal control over financial reporting as of December 29, 2007, based on criteria established in Internal Control – Integrated Framework issued by the Committee of Sponsoring Organizations of the Treadway Commission and our report dated February 25, 2008 expressed an unqualified opinion thereon.
Boston, Massachusetts
February 25, 2008

71 I 2007 An
nu
al Rep
ort
RepoRtofinDepenDentRegisteReDpublicaccountingfiRM
The Board of Directors and Shareholders CVS Caremark Corporation:
We have audited the accompanying consolidated balance sheet of CVS Caremark Corporation and subsidiaries (formerly CVS Corporation) as of December 30, 2006 and the related consolidated statements of operations, shareholders’ equity and cash flows for the fifty-two week periods ended December 30, 2006, and December 31, 2005. These consolidated financial statements are the responsibility of the Company’s management. Our responsibility is to express an opinion on these consolidated financial statements based on our audits.
We conducted our audits in accordance with the standards of the Public Company Accounting Oversight Board (United States). Those standards require that we plan and perform the audit to obtain reasonable assurance about whether the financial statements are free of material misstatement. An audit includes examining, on a test basis, evidence supporting the amounts and disclosures in the financial statements. An audit also includes assessing the accounting principles used and significant estimates made by management, as well as evaluating the overall financial statement presentation. We believe that our audits provide a reasonable basis for our opinion.
In our opinion, the consolidated financial statements referred to above present fairly, in all material respects, the financial position of CVS Caremark Corporation and subsidiaries as of December 30, 2006 and the results of their operations and their cash flows for the fifty-two week periods ended December 30, 2006 and December 31, 2005, in conformity with U.S. generally accepted accounting principles.
As discussed in Note 1 to the consolidated financial statements, CVS Caremark Corporation adopted the provisions of Statement of Financial Accounting Standards No. 123 (revised 2004), “Share-Based Payment,” effective January 1, 2006.
KPMG LLP Providence, Rhode Island February 27, 2007

shaReholDeRinfoRMation
72 i
C
VS
Car
emar
k
OfficersThomas M. RyanChairman of the Board, President and Chief Executive Officer
David B. RickardExecutive Vice President, Chief Financial Officer and Chief Administrative Officer
Chris W. BodineExecutive Vice President and President – CVS Caremark Health Care Services
Howard A. McLureExecutive Vice President and President – Caremark Pharmacy Services
Larry J. MerloExecutive Vice President President – CVS/pharmacy-Retail
Douglas A. SgarroExecutive Vice President and Chief Legal Officer President, CVS Realty Co.
V. Michael FerdinandiSenior Vice President – Human Resources and Corporate Communications
Jonathan C. RobertsSenior Vice President and Chief Information Officer
David M. DentonSenior Vice President – Finance and Controller
Nancy R. ChristalSenior Vice President – Investor Relations
Carol A. DeNaleVice President and Corporate Treasurer
Zenon P. LankowskyCorporate Secretary
Officers’ Certifications The Company has filed the required certifica-tions under Section 302 of the Sarbanes-Oxley Act of 2002 regarding the quality of our public disclosures as Exhibits 31.1 and 31.2 to our annual report on Form 10-K for the fiscal year ended December 29, 2007. After our 2007 annual meeting of stockholders, the Company filed with the New York Stock Exchange the CEO certification regarding its compliance with the NYSE corporate governance listing standards as required by NYSE Rule 303A.12(a).
DirectorsEdwin M. Banks(1)(3)
Founder and Managing Partner Washington Corner Capital Management, LLC
C. David Brown II(2)(3)
Chairman of the Firm Broad and Cassel
David W. Dorman(2)(3)
Managing Director and Senior Advisor Warburg Pincus LLC
Kristen Gibney Williams(1)
Former Executive
Prescription Benefits Management Division
of Caremark International, Inc.
Marian L. Heard(1)(3)
President and Chief Executive Officer
Oxen Hill Partners
William H. Joyce(1) Former Chairman of the Board and Chief Executive Officer Nalco Company
Jean-Pierre Millon(2)
Former President and Chief Executive Officer PCS Health Services, Inc.
Terrence Murray(2)(4)
Former Chairman of the Board and Chief Executive Officer FleetBoston Financial Corporation
C.A. Lance PiccoloChief Executive Officer HealthPic Consultants, Inc.
Sheli Z. Rosenberg(2)(3)
Former President, Chief Executive Officer and Vice Chairwoman Equity Group Investments, LLC
Thomas M. RyanChairman of the Board, President and Chief Executive Officer CVS Caremark Corporation
Richard J. Swift(1)
Former Chairman of the Board, President and Chief Executive Officer Foster Wheeler Ltd.
(1) Member of the Audit Committee
(2) Member of the Management Planning and Development Committee
(3) Member of the Nominating and Corporate Governance Committee
(4) Lead Director
Shareholder InformationCorporate HeadquartersCVS Caremark Corporation One CVS Drive, Woonsocket, RI 02895 (401) 765-1500
Annual Shareholders’ MeetingMay 7, 2008 CVS Caremark Corporate Headquarters
Stock Market ListingThe New York Stock Exchange Symbol: CVS
Transfer Agent and RegistrarQuestions regarding stock holdings, certificate replacement/transfer, dividends and address changes should be directed to:
BNY Mellon Shareowner Services P.O. Box 358035 Pittsburgh, PA 15252-8035 Toll-free: (877) CVSPLAN (287-7526) Foreign Shareholders: (201) 680-6578 TDD for hearing impaired: 1 (800) 231-5469
Via the Internet: http://www.bnymellon.com/shareowner/isd
Direct Stock Purchase/Dividend Reinvestment ProgramBuyDIRECTSM provides a convenient and economical way for you to purchase your first shares or additional shares of CVS Caremark common stock. The program is sponsored and administered by BNY Mellon. For more information, including an enrollment form, please contact:
BNY Mellon at (877) 287-7526
Financial and Other Company InformationThe Company’s Annual Report on Form 10-K will be sent without charge to any shareholder upon request by contacting:
Nancy R. Christal Senior Vice President – Investor Relations CVS Caremark Corporation 670 White Plains Road – Suite 210 Scarsdale, NY 10583 (800) 201-0938
In addition, financial reports and recent filings with the Securities and Exchange Commission, including our Form 10-K, as well as other Company information, are available via the Internet at http://investor.cvs.com.

Reaching Out to CVS Caremark Communities
CVS Caremark colleagues
and family members are
regular participants in
Easter Seals Walk With Me
fundraising events around
the country, such as this
one in Chicago, Illinois. Our
colleagues are scheduled
to participate in a total of
43 during 2008.
Boston Red Sox Hitting Coach
Dave Magadan with Cheshire
Challengers baseball team
member Sean Chamberland at
CVS Caremark All Kids Can
Baseball Camp at Fenway Park.
There are currently 122
Boundless™ playgrounds in
24 states where children of
all abilities can play together.
Many more are on the way
due in part to financial
assistance provided by
CVS Caremark.