Embed Size (px)
Citation preview

Competitive Effects of Trade: Theory and MeasurementADEMU – Pierre Werner Chair Lecture
Marc J. Melitz
Harvard University
September 20, 2016

Starting Point: Selection and Competition Effects of TradeIn models with producer heterogeneity:
Trade induces many different reallocations across firms and products:
Selection effects (extensive margin):
Which products are sold where (across domestic and exportmarkets)Which firms survive; which firms export (and where)
But also competition effects (intensive margin):
Conditional on selection (same products sold in a given market) –trade affects the relative market shares of those products
These reallocations generate (endogenous) productivity changes that areindependent of “technology”This endogenous productivity response, in turn, contributes to theaggregate gains from trade
Handout p.1
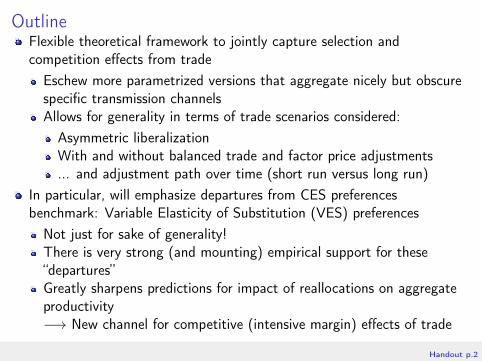
OutlineFlexible theoretical framework to jointly capture selection andcompetition effects from trade
Eschew more parametrized versions that aggregate nicely but obscurespecific transmission channelsAllows for generality in terms of trade scenarios considered:Asymmetric liberalizationWith and without balanced trade and factor price adjustments... and adjustment path over time (short run versus long run)
In particular, will emphasize departures from CES preferencesbenchmark: Variable Elasticity of Substitution (VES) preferences
Not just for sake of generality!There is very strong (and mounting) empirical support for these“departures”Greatly sharpens predictions for impact of reallocations on aggregateproductivity−→ New channel for competitive (intensive margin) effects of trade
Handout p.2

Outline (Cont.)
Examine the link between trade, reallocations and productivityempirically
Use data on French multi-product firms to measure the reallocationseffects of trade within firms (across products)−→ Highlight strong evidence for competitive effects stemming fromVES preferences
Directly measure productivity response of French firms to tradeBottom line: Can explain 1% annual growth rate for Frenchmanufacturing from 1995-2005
Connect back productivity gains to overall welfare gains from trade(theoretically)
Handout p.3
VES Monopolistic Competition and Trade
Open economy version of Zhelodbodko et al (2012)... along with long – and growing – literature on trade models withendogenous markupsAdditively separable preferences (nests CES) but most results usingresidual demand curve can be extended to non-separable preferences
Handout p.4
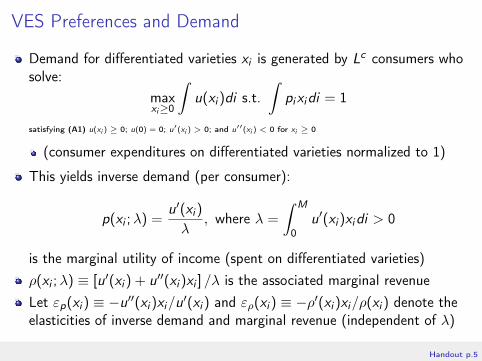
VES Preferences and Demand
Demand for differentiated varieties xi is generated by Lc consumers whosolve:
maxxi≥0
∫u(xi )di s.t.
∫pixidi = 1
satisfying (A1) u(xi ) ≥ 0; u(0) = 0; u′(xi ) > 0; and u′′(xi ) < 0 for xi ≥ 0
(consumer expenditures on differentiated varieties normalized to 1)
This yields inverse demand (per consumer):
p(xi ;λ) =u′(xi )
λ, where λ =
∫ M
0u′(xi )xidi > 0
is the marginal utility of income (spent on differentiated varieties)ρ(xi ;λ) ≡ [u′(xi ) + u′′(xi )xi ] /λ is the associated marginal revenueLet εp(xi ) ≡ −u′′(xi )xi/u′(xi ) and ερ(xi ) ≡ −ρ′(xi )xi/ρ(xi ) denote theelasticities of inverse demand and marginal revenue (independent of λ)
Handout p.5
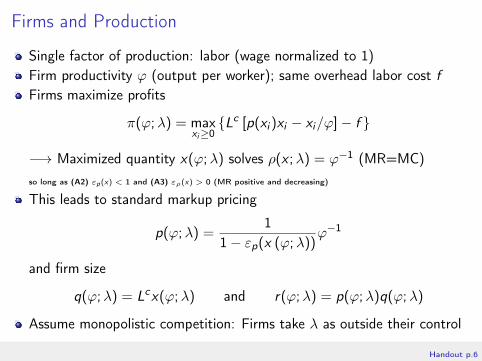
Firms and Production
Single factor of production: labor (wage normalized to 1)Firm productivity ϕ (output per worker); same overhead labor cost fFirms maximize profits
π(ϕ;λ) = maxxi≥0{Lc [p(xi )xi − xi/ϕ]− f }
−→ Maximized quantity x(ϕ;λ) solves ρ(x ;λ) = ϕ−1 (MR=MC)so long as (A2) εp(x) < 1 and (A3) ερ(x) > 0 (MR positive and decreasing)
This leads to standard markup pricing
p(ϕ;λ) =1
1− εp(x (ϕ;λ))ϕ−1
and firm size
q(ϕ;λ) = Lcx(ϕ;λ) and r(ϕ;λ) = p(ϕ;λ)q(ϕ;λ)
Assume monopolistic competition: Firms take λ as outside their control
Handout p.6
Firms and Production (Cont.)
λ is a key endogenous market-level variable capturing the extent ofcompetition for a given level of market demandAnalogous to the CES price indexIncreases in λ shift down/in the firms’ demand curves, and lowers thefirms’ optimal choice of price and quantity, and resulting profits−→ Increased competition
Handout p.7
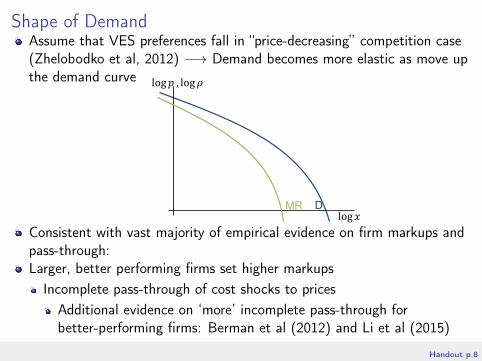
Shape of DemandAssume that VES preferences fall in “price-decreasing” competition case(Zhelobodko et al, 2012) −→ Demand becomes more elastic as move upthe demand curve
DMR
log𝑝 , log𝜌
log𝑥Consistent with vast majority of empirical evidence on firm markups andpass-through:Larger, better performing firms set higher markups
Incomplete pass-through of cost shocks to pricesAdditional evidence on ‘more’ incomplete pass-through forbetter-performing firms: Berman et al (2012) and Li et al (2015)
Handout p.8
Shape of Demand and Competition
D
Δ log𝐿
Δλ
log𝑝
log𝑥D
Δ log𝐿Δλ
log𝑝
log𝑥
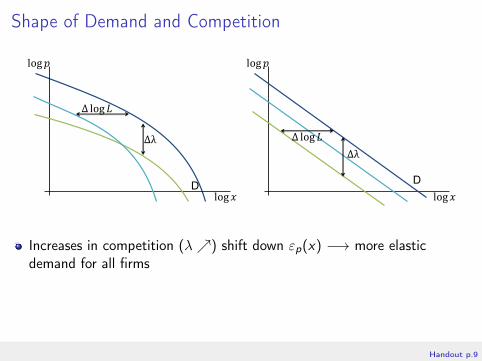
Increases in competition (λ↗) shift down εp(x) −→ more elasticdemand for all firms
Handout p.9
Implications for Competition and Firm Performance
log𝜋%& , log 𝑟 , log𝑞
log𝜑
Δ log𝐿
Δλ
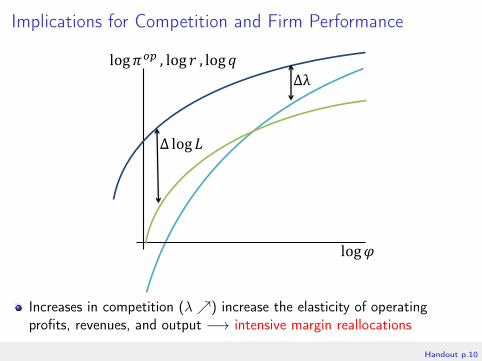
Increases in competition (λ↗) increase the elasticity of operatingprofits, revenues, and output −→ intensive margin reallocations
Handout p.10

Closed Economy EquilibriumIrreversible investment fE (in labor units) for firms to enter
Uncertain return: draw from a productivity distribution G (ϕ)
2 key equilibrium conditions:Endogenous exit: Zero profit cutoff productivity such thatπ(ϕ∗;λ) = 0. Firms with ϕ < ϕ∗ exitFree entry: ∫ ∞
ϕ∗π(ϕ;λ)dG (ϕ) = fE
These 2 equilibrium conditions jointly determine cutoff productivity ϕ∗
and competition level λResponse of entry and wages depend on how model is closed:
Single sector (GE): Exogenous labor supply of workers Lw = Lc .Wages adjust to ensure labor market equilibrium.Multiple sectors (PE): Exogenous expenditures on given sector (Lc
consumers). Endogenous labor supply of workers at exogenouseconomy-wide wage.
Handout p.11
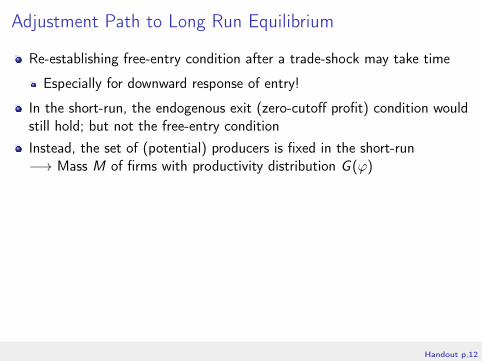
Adjustment Path to Long Run Equilibrium
Re-establishing free-entry condition after a trade-shock may take time
Especially for downward response of entry!
In the short-run, the endogenous exit (zero-cutoff profit) condition wouldstill hold; but not the free-entry conditionInstead, the set of (potential) producers is fixed in the short-run−→ Mass M of firms with productivity distribution G (ϕ)
Handout p.12
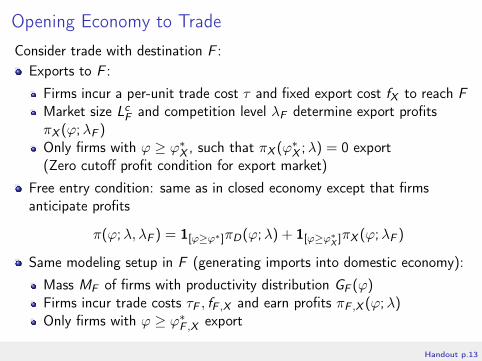
Opening Economy to TradeConsider trade with destination F :
Exports to F :
Firms incur a per-unit trade cost τ and fixed export cost fX to reach FMarket size LcF and competition level λF determine export profitsπX (ϕ;λF )Only firms with ϕ ≥ ϕ∗X , such that πX (ϕ∗X ;λ) = 0 export(Zero cutoff profit condition for export market)
Free entry condition: same as in closed economy except that firmsanticipate profits
π(ϕ;λ, λF ) = 1[ϕ≥ϕ∗]πD(ϕ;λ) + 1[ϕ≥ϕ∗X ]πX (ϕ;λF )
Same modeling setup in F (generating imports into domestic economy):
Mass MF of firms with productivity distribution GF (ϕ)Firms incur trade costs τF , fF ,X and earn profits πF ,X (ϕ;λ)Only firms with ϕ ≥ ϕ∗F ,X export
Handout p.13
Predictions for the Impact of Trade
Across all different types of trade liberalization scenarios:
Import and export trade liberalizationSingle sector (GE) and multiple sector (PE)Short run and long run
... Competition effect from liberalization (λ↗) induces additionalintensive and extensive margin reallocations
Handout p.14

A Specific Example (Related to Empirical Results)
3 countries: destination D, France F , and W (ROW)Demand shock in D: LcD ↗In order to focus on demand shocks and competition in D:
Assume that D is small relative to F and W−→ Demand shocks in D do not affect country-wide equilibriumvariables in F or W (Apart from those related to exports to D)Do not model any feedback loop from changes in exports from D
−→ Focus on equilibrium response in D
Handout p.15
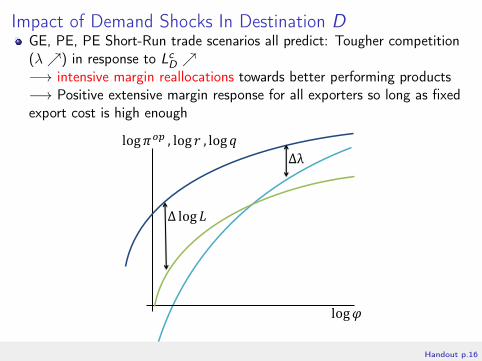
Impact of Demand Shocks In Destination DGE, PE, PE Short-Run trade scenarios all predict: Tougher competition(λ↗) in response to LcD ↗−→ intensive margin reallocations towards better performing products−→ Positive extensive margin response for all exporters so long as fixedexport cost is high enough
log𝜋%& , log 𝑟 , log𝑞
log𝜑
Δ log𝐿
Δλ
Handout p.16
Impact of Demand Shocks In Destination D: Productivity
Consequences for productivity:
Intensive margin effect unambiguously increases productivityExtensive margin effect increases productivity – so long as newexported products are more productive than firm average
Handout p.17

Measuring the Reallocation Effects of Trade Within Multi-Product Firms
Handout p.18

Why Within Multi-Product Firms?
It is very hard to measure the reallocation effects across firms at thecountry/industry level:
Shocks that affect trade (institutions, technology, ...) are also likely toaffect the distribution of market shares across firms
Recent theoretical models of multi-product firms highlight how tradeinduces a similar pattern of reallocations within firms as it does acrossfirms
Also fewer impediments to resource reallocation within firmsWhen measuring reallocations within multi-product firms, can:
Isolate trade shocks that are exogenous to individual firms –controlling for country/industry effectsControl for firm-level technology changesLook at same set of (narrowly defined products) sold by same firmacross destinations or time
Aside: Multi-product firms dominate world trade
Handout p.19
Similar Reallocations Across Firms and WithinMulti-Product FirmsFirms
Stable performance ranking for firms based on performance in any givenmarket (including domestic market) or worldwide salesBetter performing firms export to more destinationsWorse performing firms are most likely to exit (overall, or from any givenexport market)
Products within Firms
Stable performance ranking across destinations (and for worldwide sales)Better performing products are sold in more destinationsWorse performing products are most likely to be dropped from any givenmarket
Handout p.20
Data on French Multi-Product ExportersComprehensive customs data for firm-product exports to 229destinations (d) for 1995-2005 (t)
Exclude service and wholesale/distribution firms (keep manufacturingand agriculture)Products recorded at 8-digit level (over 10,000 product codes)
Also country, sector (ISIC-3), and product (HS6) level trade for thosedestinations:
GDP and other country level variablesImports by destination (d) at ISIC3 (M I
d ,t) and HS6 (Msd ,t) level
Handout p.21
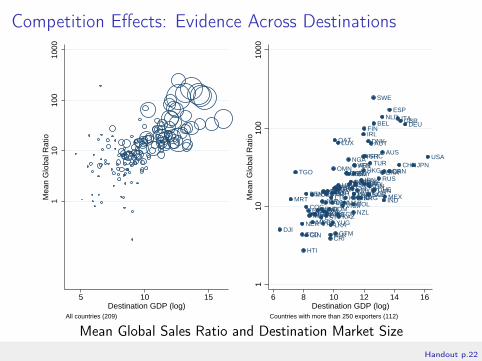
Competition Effects: Evidence Across Destinations
110
100
1000
Mea
n G
loba
l Rat
io
5 10 15Destination GDP (log)
All countries (209)
AGO
ARE
ARG
AUSAUT
BEL
BEN
BFA
BGD
BGR
BHR
BLR
BRACAN
CHECHL
CHN
CIV
CMR
COG COL
CRI
CYP
CZE
DEU
DJI
DNK
DOM
DZA
ECU
EGY
ESP
EST
FIN
GAB
GBR
GHA
GIN
GRC
GTM
HKG
HRV
HTI
HUNIDN
IND
IRL
IRN
ISL
ISR
ITA
JOR
JPN
KAZ
KEN
KOR
KWTLBN
LBY
LKA
LTU
LUX
LVAMAR
MDG
MEX
MLIMLT
MRTMUS
MYS
NER
NGA
NLD
NOR
NZL
OMN
PAKPAN
PER
PHL
POL
PRT
QAT
ROMRUS
SAU
SEN
SGPSVKSVN
SWE
SYR
TCD
TGO
THATUN
TUR
TWN
UKR
URY
USAVEN
VNM
YEM
YUG
ZAF
110
100
1000
Mea
n G
loba
l Rat
io
6 8 10 12 14 16Destination GDP (log)
Countries with more than 250 exporters (112)
Mean Global Sales Ratio and Destination Market SizeHandout p.22
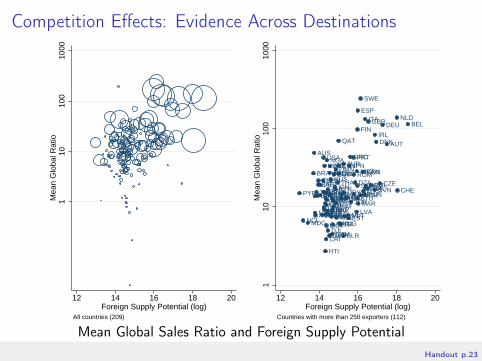
Competition Effects: Evidence Across Destinations
110
100
1000
Mea
n G
loba
l Rat
io
12 14 16 18 20Foreign Supply Potential (log)
All countries (209)
AGO
ANT
ARE
ARG
AUSAUT
BEL
BEN
BFA
BGD
BGR
BHR
BLR
BRA CAN
CHECHL
CHN
CIV
CMR
COGCOL
CRI
CYP
CZE
DEU
DJI
DNK
DOM
DZA
ECU
EGY
ESP
EST
FIN
GAB
GBR
GHA
GIN
GRC
GTM
HKG
HRV
HTI
HUNIDN
IND
IRL
IRN
ISL
ISR
ITA
JOR
JPN
KAZ
KEN
KOR
KWTLBN
LBY
LKA
LTU
LVAMAR
MDG
MEX
MLI MLT
MRTMUS
MYS
NCLNER
NGA
NLD
NOR
NZL
OMN
PAKPAN
PER
PHL
POL
PRT
PYF
QAT
ROMRUS
SAU
SEN
SGPSPM
SVKSVN
SWE
SYR
TCD
TGO
THATUN
TUR
UKR
URY
USAVEN
VNM
YEM
YUG
ZAF
110
100
1000
Mea
n G
loba
l Rat
io
12 14 16 18 20Foreign Supply Potential (log)
Countries with more than 250 exporters (112)
Mean Global Sales Ratio and Foreign Supply PotentialHandout p.23
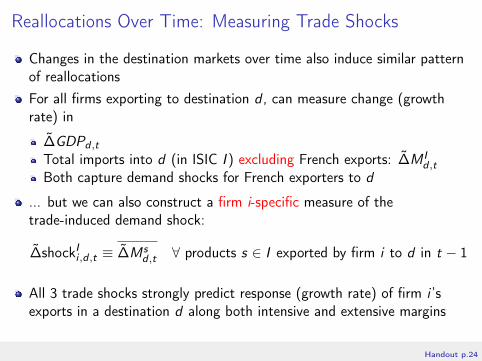
Reallocations Over Time: Measuring Trade Shocks
Changes in the destination markets over time also induce similar patternof reallocationsFor all firms exporting to destination d , can measure change (growthrate) in
∆̃GDPd ,t
Total imports into d (in ISIC I ) excluding French exports: ∆̃M Id ,t
Both capture demand shocks for French exporters to d
... but we can also construct a firm i-specific measure of thetrade-induced demand shock:
∆̃shockIi ,d ,t ≡ ∆̃Msd ,t ∀ products s ∈ I exported by firm i to d in t − 1
All 3 trade shocks strongly predict response (growth rate) of firm i ’sexports in a destination d along both intensive and extensive margins
Handout p.24
Impact of Trade Shocks on Reallocations Over TimeDestination-level over time:
Trade shock strongly predicts increased skewness of firm’s product mixTheoretical connection with preferences satisfying previous evidence onmarkups and pass-through
Aggregating up to firm-level:Use (lagged) firm-destination export sharesTrade shocks strongly predict increased skewness of firm’s global productmix (global exports and total production)
Handout p.25

Impact of Trade Shocks on Firm Productivity
Handout p.26

New Data and Productivity
Merge trade data with production data (comprehensive annual census)
Adds firm level variables (by year) for input and output use
Measure productivity as deflated value-added per worker
Aggregates (using firm labor shares) to welfare-relevant realvalue-added per worker for French manufacturing:Firm/product level:
ΦQi =
Yi/Pi
LiΦRi =
Yi/P̃S
Li
Sector/aggregate level:
ΦQS =
YS/P̃S
LS=
∑i∈S
LiLS
ΦRi
Handout p.27
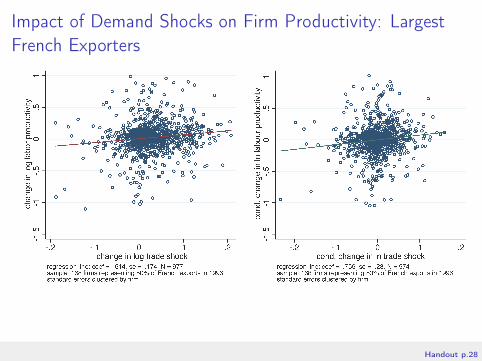
Impact of Demand Shocks on Firm Productivity: LargestFrench Exporters
Handout p.28
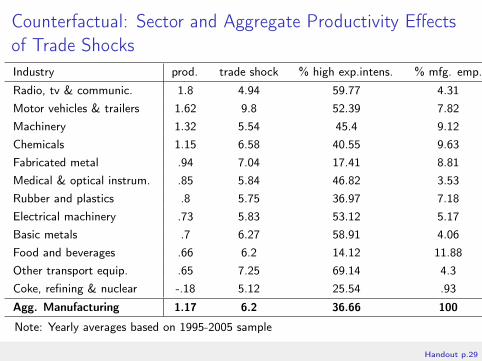
Counterfactual: Sector and Aggregate Productivity Effectsof Trade ShocksIndustry prod. trade shock % high exp.intens. % mfg. emp.
Radio, tv & communic. 1.8 4.94 59.77 4.31Motor vehicles & trailers 1.62 9.8 52.39 7.82Machinery 1.32 5.54 45.4 9.12Chemicals 1.15 6.58 40.55 9.63Fabricated metal .94 7.04 17.41 8.81Medical & optical instrum. .85 5.84 46.82 3.53Rubber and plastics .8 5.75 36.97 7.18Electrical machinery .73 5.83 53.12 5.17Basic metals .7 6.27 58.91 4.06Food and beverages .66 6.2 14.12 11.88Other transport equip. .65 7.25 69.14 4.3Coke, refining & nuclear -.18 5.12 25.54 .93
Agg. Manufacturing 1.17 6.2 36.66 100
Note: Yearly averages based on 1995-2005 sample
Handout p.29

Endogenous Productivity Changes and Gains From Trade
Do productivity changes generated by reallocations contribute toaggregate gains from trade?
Handout p.30

Endogenous Productivity Changes and Gains From Trade
Theoretical comparative static experiment: change the degree of firmheterogeneity holding all other structural parameters constant
CES preferences case (Melitz & Redding, 2015):
Compare a heterogeneous firm model to a model with a degenerateproductivity distribution for exporters and non-exporters−→ Welfare gains from trade liberalization are strictly higher in modelwith endogenous selection (generated by the endogenous productivityresponse)Holds for general productivity distributions under firm heterogeneity
VES preferences case (Dhingra & Morrow, 2015):
Welfare effect is even stronger as intensive margin reallocationstowards higher productivity firms and lower average markups furthercontribute to welfare gains
Handout p.31
Conclusion
Theory: Robust predictions for role of trade and competition in boostingindustrial productivity and gains from trade – especially when consideringmore general VES preferences (relative to CES)
Within class of VES preferences featuring “price-decreasing”competition
Demand shocks in export destinations induce French exporters to skewtheir export sales towards their better performing products
−→ Strong evidence for competitive effects stemming from VESpreferences−→ Substantial productivity response for French exporters mostimpacted by those demand shocks
Handout p.32


![05[2] Strategy competitors, competitive rivalry, competitive behavior, and competitive dynamics · PDF fileDefine competitors, competitive rivalry, competitive behavior, and competitive](https://img.pdfslide.us/doc/110x75/5aa5b2eb7f8b9ac8748d8018/052-strategy-competitors-competitive-rivalry-competitive-behavior-and-competitive.jpg)