Embed Size (px)
Citation preview
Final Report …helping organizations make better decisions since 1982
Submitted to the City of Des Peres, Missouri by: ETC Institute 725 W. Frontier Lane, Olathe, Kansas 66061
June 2014 66061
‘14 2014 City of Des Peres Community Survey
Contents
Executive Summary .................................................................................. i
Section 1: Charts and Graphs .................................................................. 1
Section 2: Importance-Satisfaction Analysis ......................................... 21
Section 3: Benchmarking Analysis ........................................................ 35
Section 4: Tabular Data ......................................................................... 42
Section 5: Survey Instrument ................................................................. 84
Appendix A: GIS Maps ....................................................................... A-1
2014 City of Des Peres Community Survey
ETC Institute (2014) i
Executive Su
mmary R
eport
2014 City of Des Peres Executive Summary Report
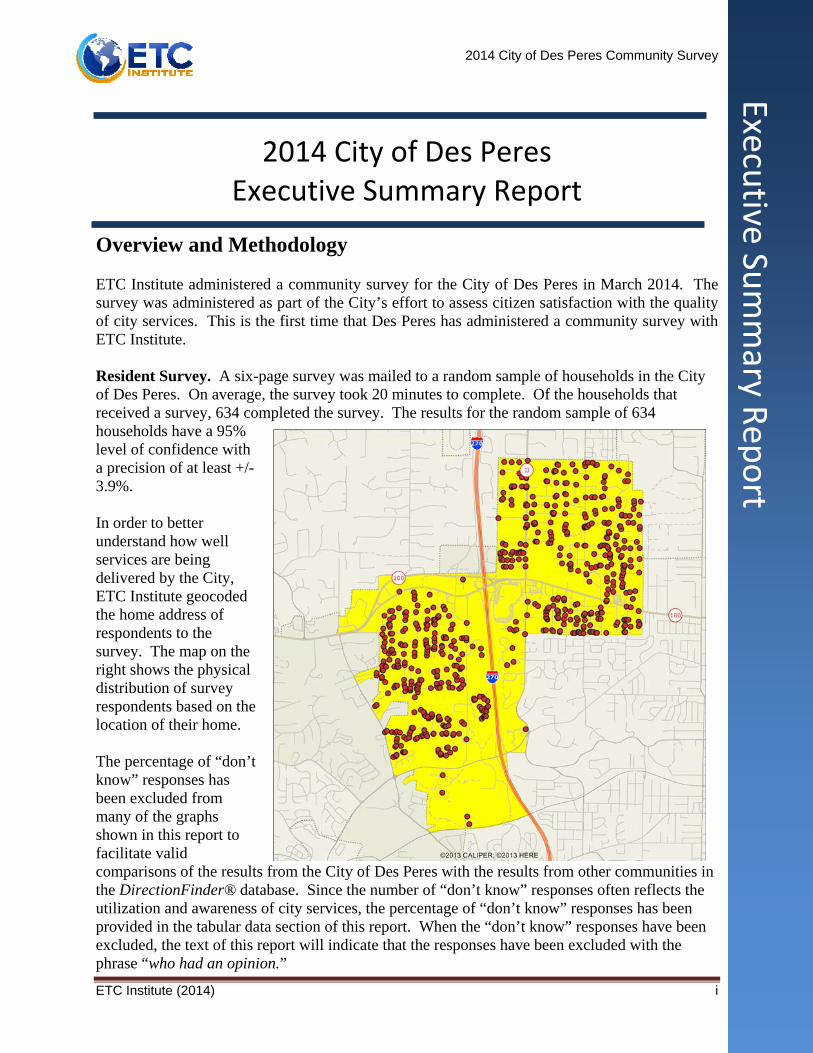
Overview and Methodology ETC Institute administered a community survey for the City of Des Peres in March 2014. The survey was administered as part of the City’s effort to assess citizen satisfaction with the quality of city services. This is the first time that Des Peres has administered a community survey with ETC Institute. Resident Survey. A six-page survey was mailed to a random sample of households in the City of Des Peres. On average, the survey took 20 minutes to complete. Of the households that received a survey, 634 completed the survey. The results for the random sample of 634 households have a 95% level of confidence with a precision of at least +/-3.9%. In order to better understand how well services are being delivered by the City, ETC Institute geocoded the home address of respondents to the survey. The map on the right shows the physical distribution of survey respondents based on the location of their home. The percentage of “don’t know” responses has been excluded from many of the graphs shown in this report to facilitate valid comparisons of the results from the City of Des Peres with the results from other communities in the DirectionFinder® database. Since the number of “don’t know” responses often reflects the utilization and awareness of city services, the percentage of “don’t know” responses has been provided in the tabular data section of this report. When the “don’t know” responses have been excluded, the text of this report will indicate that the responses have been excluded with the phrase “who had an opinion.”
2014 City of Des Peres Community Survey
ETC Institute (2014) ii
Executive Su
mmary R
eport
This report contains:
a summary of the methodology for administering the survey charts and graphs showing the major findings
importance-satisfaction analysis
benchmarking data that show how the results for Des Peres compare to other cities
tables that show the results for each question on the survey
a copy of the survey instrument
GIS maps that show the results of selected questions as maps of the City.
Major Findings Overall City Services. Ninety-seven percent (97%) of the residents surveyed, who had
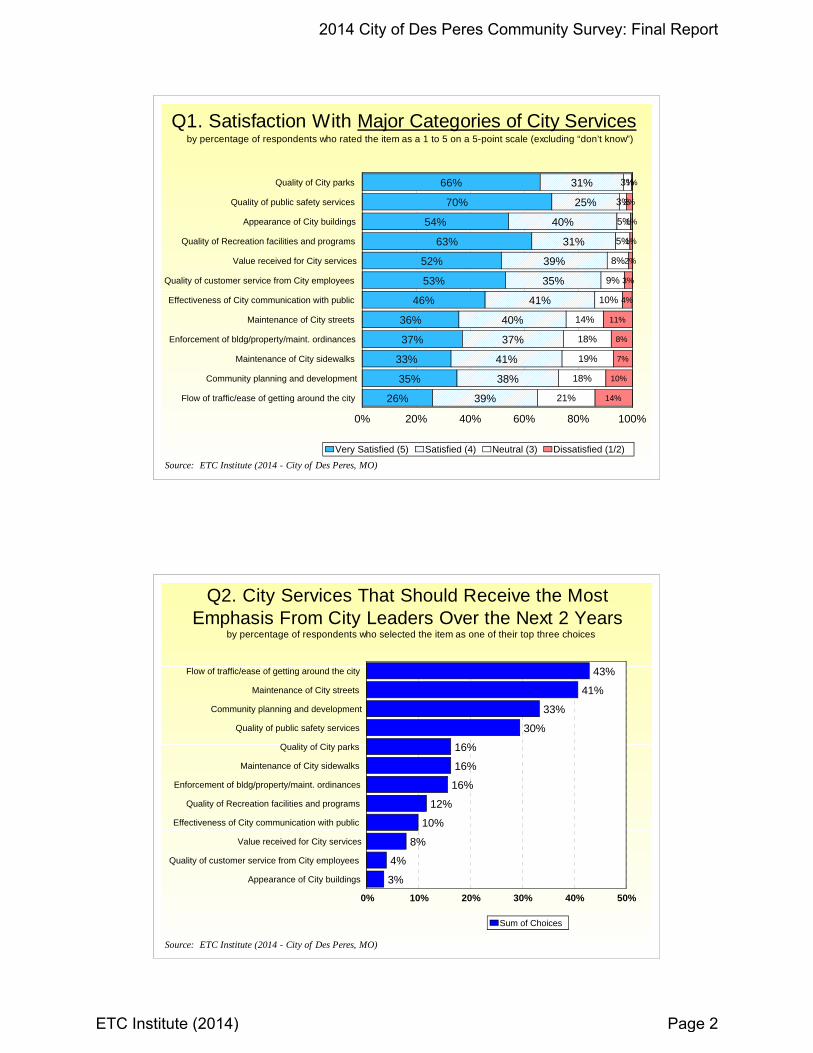
an opinion, were satisfied (rating of 4 or 5 on a 5-point scale) with the quality of City parks; 95% were satisfied with the quality of public safety services; 94% were satisfied with the appearance of City buildings, and 94% were satisfied with the quality of recreation facilities and programs. Residents were least satisfied with the flow of traffic and ease of getting around the city (65%).
Services That Should Receive the Most Emphasis Over the Next Two Years. Based on the sum of their top three choices, the City services that residents thought should receive the most emphasis over the next two years were: 1) the flow of traffic and ease of getting around the city, 2) the maintenance of City streets, and 3) community planning and development.
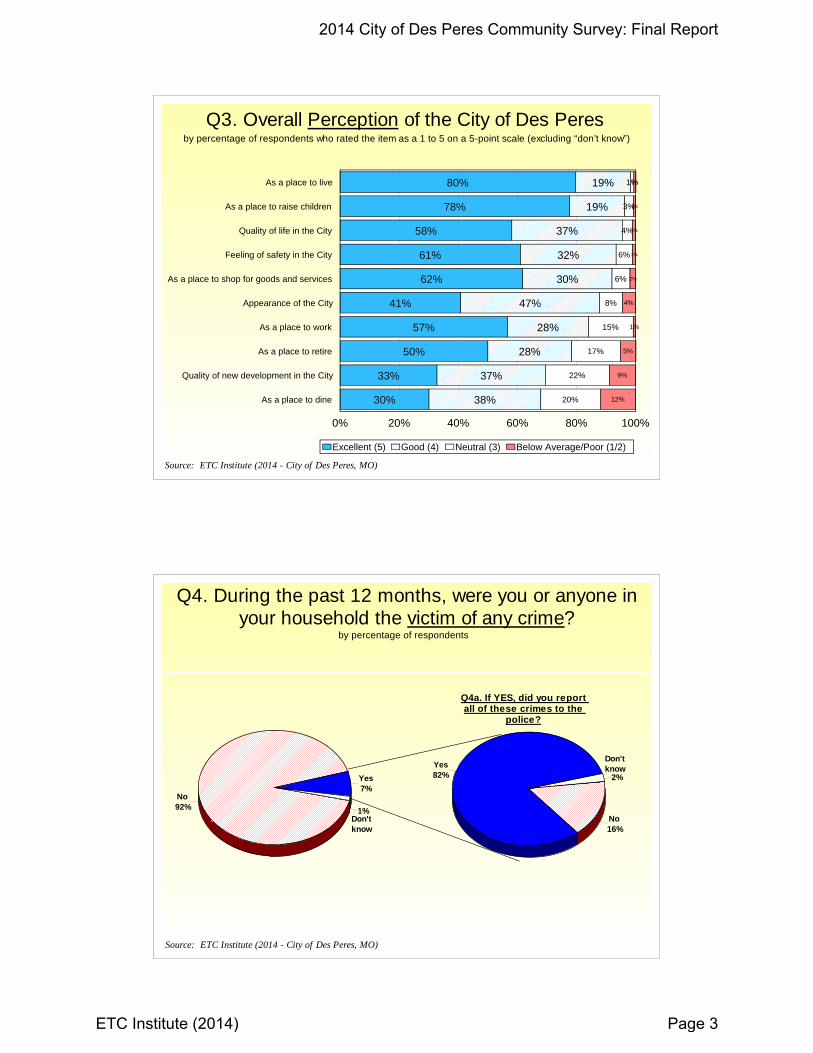
Perceptions of the City. Nearly all (99%) of the residents surveyed, who had an
opinion, indicated that they were satisfied (rating of 4 or 5 on a 5-point scale) with the City of Des Peres as a place to live; 97% were satisfied with the city as a place to raise children, and 95% were satisfied with quality of life in the City.
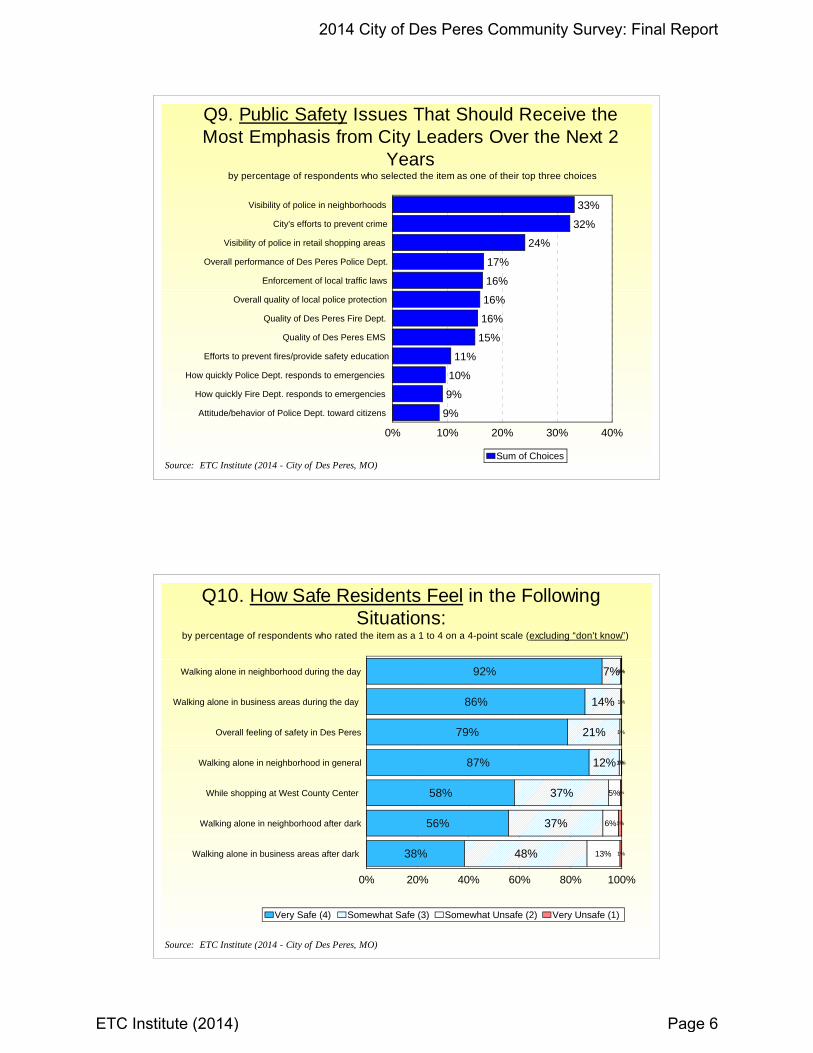
Public Safety. Ninety-three percent (93%) of the residents surveyed, who had an opinion, were satisfied (rating of 4 or 5 on a 5-point scale) with the overall performance of the Des Peres Police Department; 93% were satisfied with the overall quality of local police protection; 90% were satisfied with the quality of the Des Peres Fire Department, and 90% were satisfied with the quality of the Des Peres EMS. Residents were least satisfied with the visibility of police in retail shopping areas (73%).
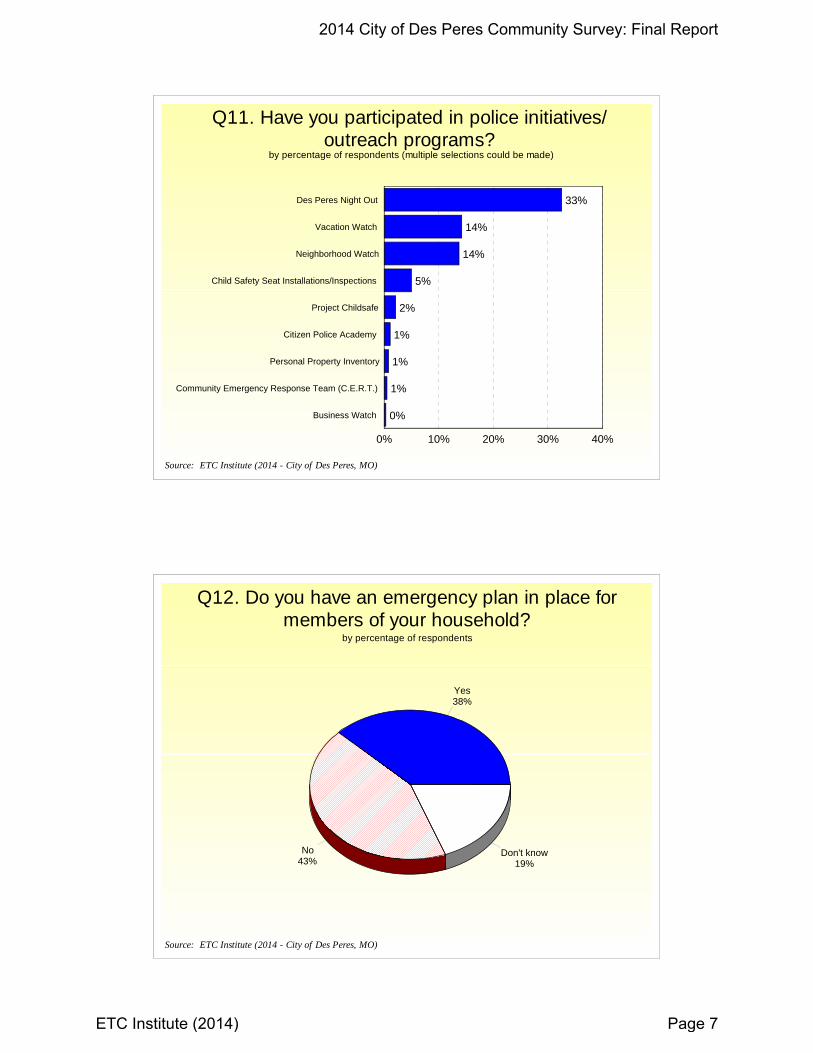
Public Safety Issues That Should Receive the Most Emphasis Over the Next Two Years. Based on the sum of their top three choices, the public safety areas that residents thought should receive the most emphasis from the City of Des Peres over the next two years were: 1) visibility of police in neighborhoods, 2) the City’s efforts to prevent crime, and 3) visibility of police in retail shopping areas.
2014 City of Des Peres Community Survey
ETC Institute (2014) iii
Executive Su
mmary R
eport
City Maintenance. Ninety-two percent (92%) of the residents surveyed, who had an opinion, were satisfied (rating of 4 or 5 on a 5-point scale) with the cleanliness of City streets and other public areas; 90% were satisfied with the maintenance of City buildings; 89% were satisfied with the maintenance of City traffic signals and street signs, and 88% were satisfied with snow removal on major City streets. Residents were least satisfied with maintenance of streets in their neighborhood (69%).
City Maintenance Issues That Should Receive the Most Emphasis Over the Next Two Years. Based on the sum of their top three choices, the City maintenance issues that residents thought should receive the most emphasis over the next two years were: 1) maintenance of streets in their neighborhood, 2) maintenance of major City streets, and 3) availability of pedestrian walkways/sidewalks.
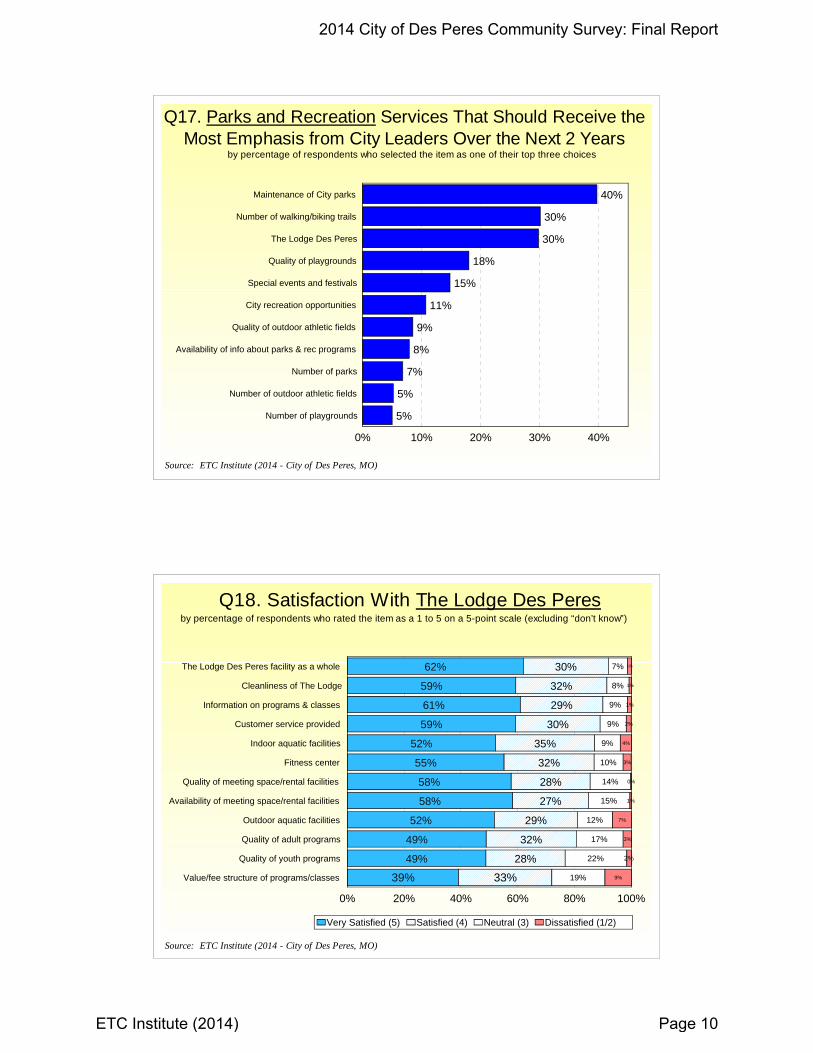
Parks and Recreation. Ninety-six percent (96%) of the residents, who had an opinion, were satisfied (rating of 4 or 5 on a 5-point scale) with the maintenance of City parks; 94% were satisfied with the number of parks; 92% were satisfied with The Lodge Des Peres, and 91% were satisfied with the availability of information about parks and recreation programs. Residents were least satisfied with the number of walking and biking trails (79%).
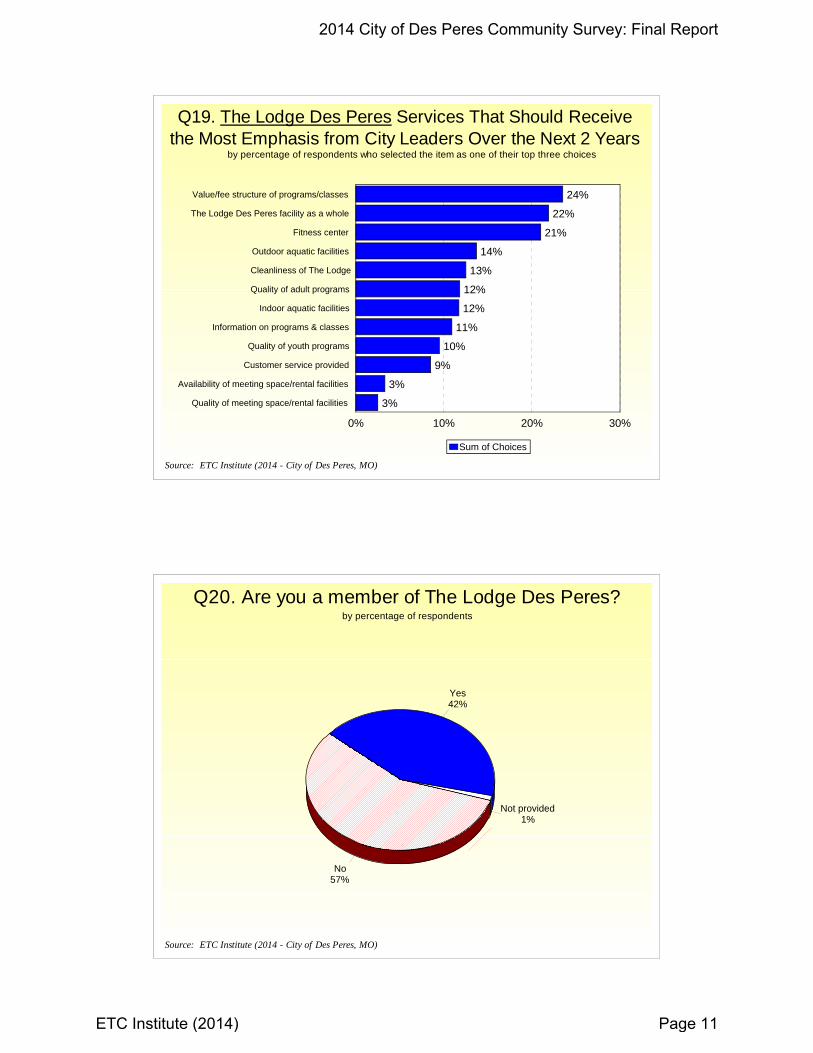
Parks and Recreation Services That Should Receive the Most Emphasis Over the Next Two Years. Based on the sum of their top three choices, the parks and recreation services that residents thought should receive the most emphasis over the next two years were: 1) maintenance of City parks, 2) number of walking and biking trails, and 3) The Lodge Des Peres.
The Lodge Des Peres. Ninety-two percent (92%) of the residents, who had an opinion, were satisfied (rating of 4 or 5 on a 5-point scale) with The Lodge Des Peres facility as a whole; 91% were satisfied with the cleanliness of The Lodge; 90% were satisfied with information on programs and classes, and 89% were satisfied with customer service provided. Residents were least satisfied with the value and fee structure of programs and classes (72%).
The Lodge Des Peres Services That Should Receive the Most Emphasis Over the Next Two Years. Based on the sum of their top three choices, The Lodge Des Peres services that residents thought should receive the most emphasis over the next two years were: 1) value and fee structure of programs and classes, 2) The Lodge Des Peres facility as a whole, and 3) the fitness center.
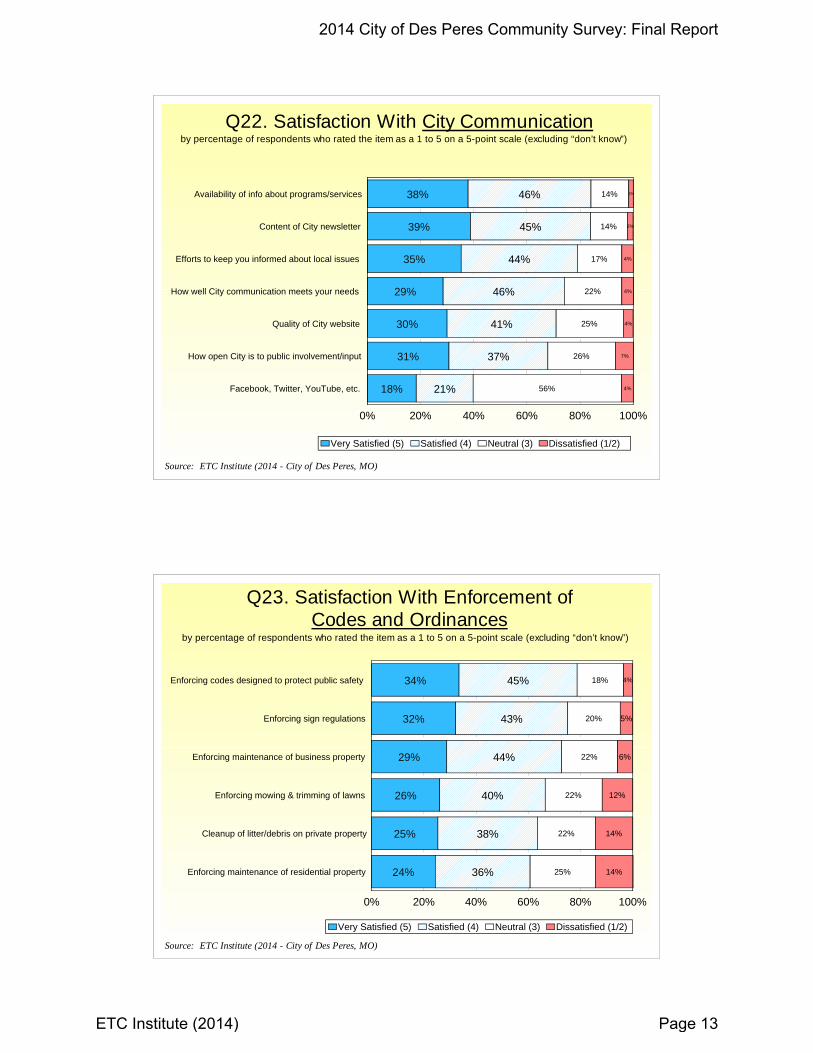
City Communication. Eighty-four percent (84%) of the residents, who had an opinion,
were satisfied (rating of 4 or 5 on a 5-point scale) with the availability of information about programs and services in Des Peres; 84% were satisfied with the content of the City newsletter, and 79% were satisfied with the City’s efforts to keep residents informed about local issues. Residents were least satisfied with social media (Facebook, Twitter, etc.) for City communication (39%).
2014 City of Des Peres Community Survey
ETC Institute (2014) iv
Executive Su
mmary R
eport
Codes and Ordinances. Seventy-nine percent (79%) of the residents surveyed, who had
an opinion, were satisfied (rating of 4 or 5 on a 5-point scale) with enforcing codes designed to protect public safety; 75% were satisfied with enforcing sign regulations, and 73% were satisfied with enforcing maintenance of business property. Residents were least satisfied with enforcing the maintenance of residential property (60%).
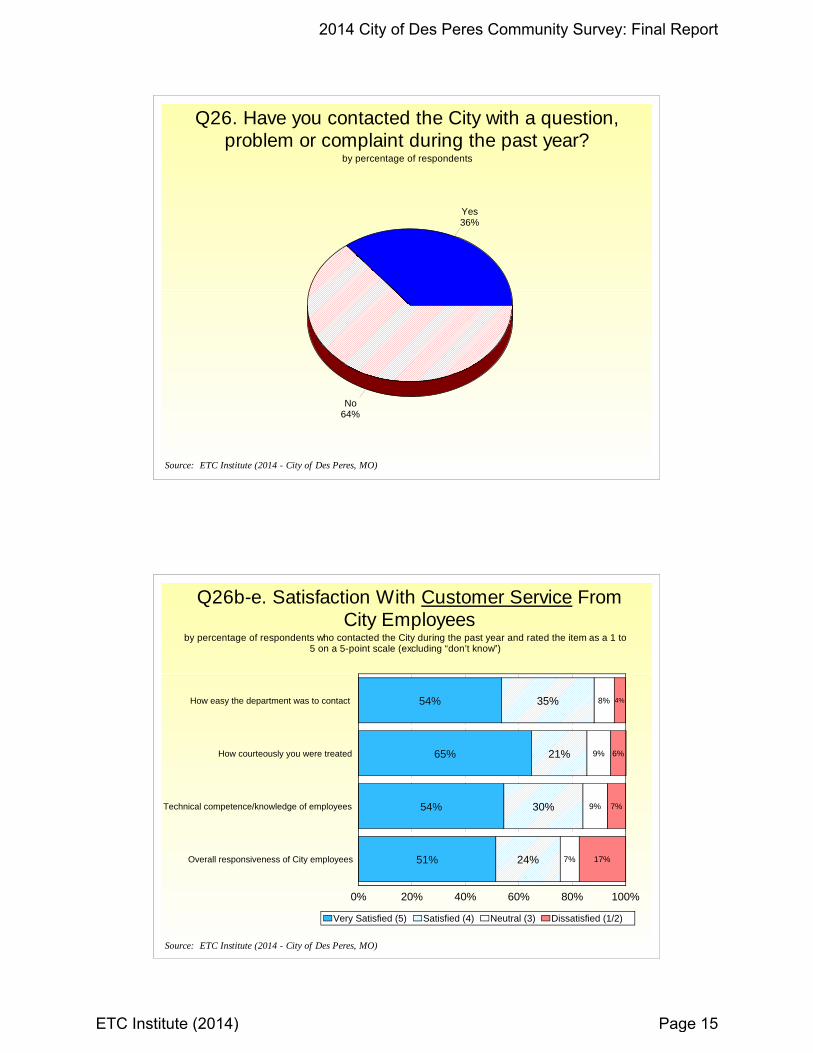
Customer Service. Of the residents who indicated they had contacted the City with a question, problem or complaint during the past year, 89% of those surveyed, who had an opinion, were satisfied (rating of 4 or 5 on a 5-point scale) with how easy the department was to contact; 86% were satisfied with how courteously they were treated; 84% were satisfied with the technical competence and knowledge of employees, and 75% were satisfied with the overall responsiveness of City employees.
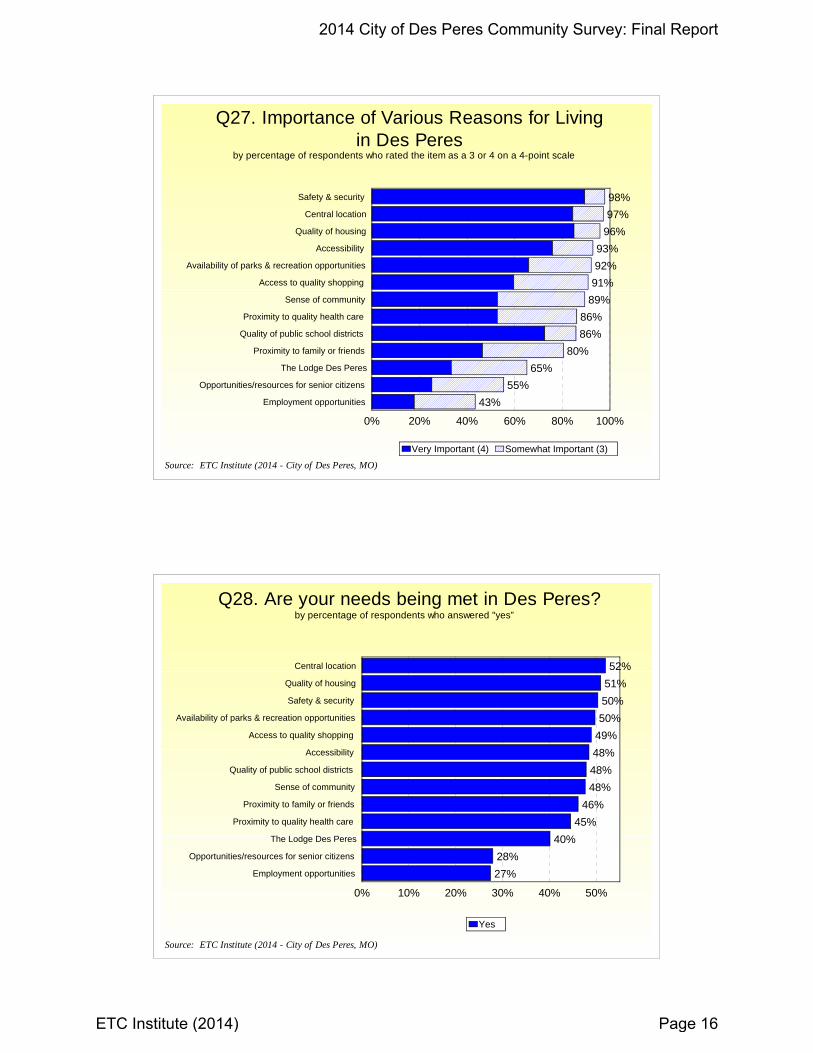
The Importance of Various Factors in Decision to Live in Des Peres. Residents were
asked to choose from a list of 13 issues – the issues that were most important in their decision to live in Des Peres. The top three reasons were: 1st) safety and security, 2nd) central location, and 3rd) quality of housing. With the same 13 issues, residents were asked if their needs were being met in Des Peres. The greatest GAP between the order of importance and needs being met were with: Safety and security – 1st in importance – 3rd at being met – GAP is -2 Accessibility – 4th in importance – 6th at being met – GAP is -2 Proximity to quality health care – 8th in importance – 10th at being met – GAP is -2
Other Findings
38% of residents surveyed have an emergency plan in place for members of their
household. Three-fourths (75%) of the residents rated the street and road conditions in their
neighborhood as either “good” or “mostly good”.
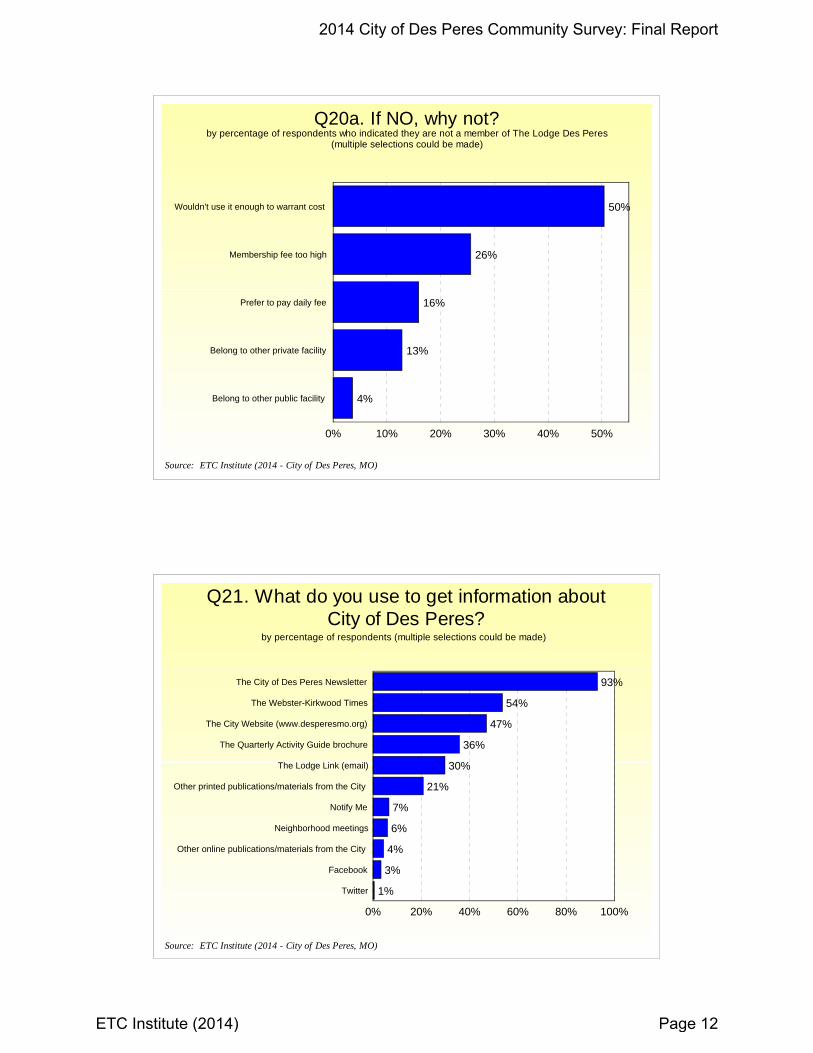
42% of residents indicated that they are members of The Lodge Des Peres.
93% of residents surveyed get information about the City through The City of Des Peres Newsletter.
Comparative Benchmarks Where possible, survey results for Des Peres were compared to the U.S. and the Missouri/ Kansas region of the country. Des Peres rated significantly higher in overall city services, public safety, city maintenance, parks and recreation, communication, code enforcement and customer service than either the U.S. in total or the Missouri/Kansas region.
Section 1: Charts and Graphs
2014 City of Des Peres Community Survey: Final Report
ETC Institute (2014) Page 1
66%
70%
54%
63%
52%
53%
46%
36%
37%
33%
35%
26%
31%
25%
40%
31%
39%
35%
41%
40%
37%
41%
38%
39%
3%
3%
5%
5%
8%
9%
10%
14%
18%
19%
18%
21%
1%
2%
1%
1%
2%
3%
4%
11%
8%
7%
10%
14%
Quality of City parks
Quality of public safety services
Appearance of City buildings
Quality of Recreation facilities and programs
Value received for City services
Quality of customer service from City employees
Effectiveness of City communication with public
Maintenance of City streets
Enforcement of bldg/property/maint. ordinances
Maintenance of City sidewalks
Community planning and development
Flow of traffic/ease of getting around the city
0% 20% 40% 60% 80% 100%
Very Satisfied (5) Satisfied (4) Neutral (3) Dissatisfied (1/2)
Q1. Satisfaction With Major Categories of City Services by percentage of respondents who rated the item as a 1 to 5 on a 5-point scale (excluding “don’t know”)
Source: ETC Institute (2014 - City of Des Peres, MO)
Q2. City Services That Should Receive the Most Emphasis From City Leaders Over the Next 2 Years
43%
41%
33%
30%
16%
16%
16%
12%
10%
8%
4%
3%
Flow of traffic/ease of getting around the city
Maintenance of City streets
Community planning and development
Quality of public safety services
Quality of City parks
Maintenance of City sidewalks
Enforcement of bldg/property/maint. ordinances
Quality of Recreation facilities and programs
Effectiveness of City communication with public
Value received for City services
Quality of customer service from City employees
Appearance of City buildings
0% 10% 20% 30% 40% 50%
Sum of Choices
by percentage of respondents who selected the item as one of their top three choices
Source: ETC Institute (2014 - City of Des Peres, MO)
2014 City of Des Peres Community Survey: Final Report
ETC Institute (2014) Page 2
80%
78%
58%
61%
62%
41%
57%
50%
33%
30%
19%
19%
37%
32%
30%
47%
28%
28%
37%
38%
1%
3%
4%
6%
6%
8%
15%
17%
22%
20%
1%
1%
1%
1%
2%
4%
1%
5%
9%
12%
As a place to live
As a place to raise children
Quality of life in the City
Feeling of safety in the City
As a place to shop for goods and services
Appearance of the City
As a place to work
As a place to retire
Quality of new development in the City
As a place to dine
0% 20% 40% 60% 80% 100%
Excellent (5) Good (4) Neutral (3) Below Average/Poor (1/2)
Q3. Overall Perception of the City of Des Peres by percentage of respondents who rated the item as a 1 to 5 on a 5-point scale (excluding “don’t know”)
Source: ETC Institute (2014 - City of Des Peres, MO)
Yes7%
No 92% 1%
by percentage of respondents
Q4. During the past 12 months, were you or anyone in your household the victim of any crime?
Source: ETC Institute (2014 - City of Des Peres, MO)
Don't know
Yes82%
No 16%
2%
Q4a. If YES, did you report all of these crimes to the
police?
Don't know
2014 City of Des Peres Community Survey: Final Report
ETC Institute (2014) Page 3
Yes39%
No 60%
1%
by percentage of respondents
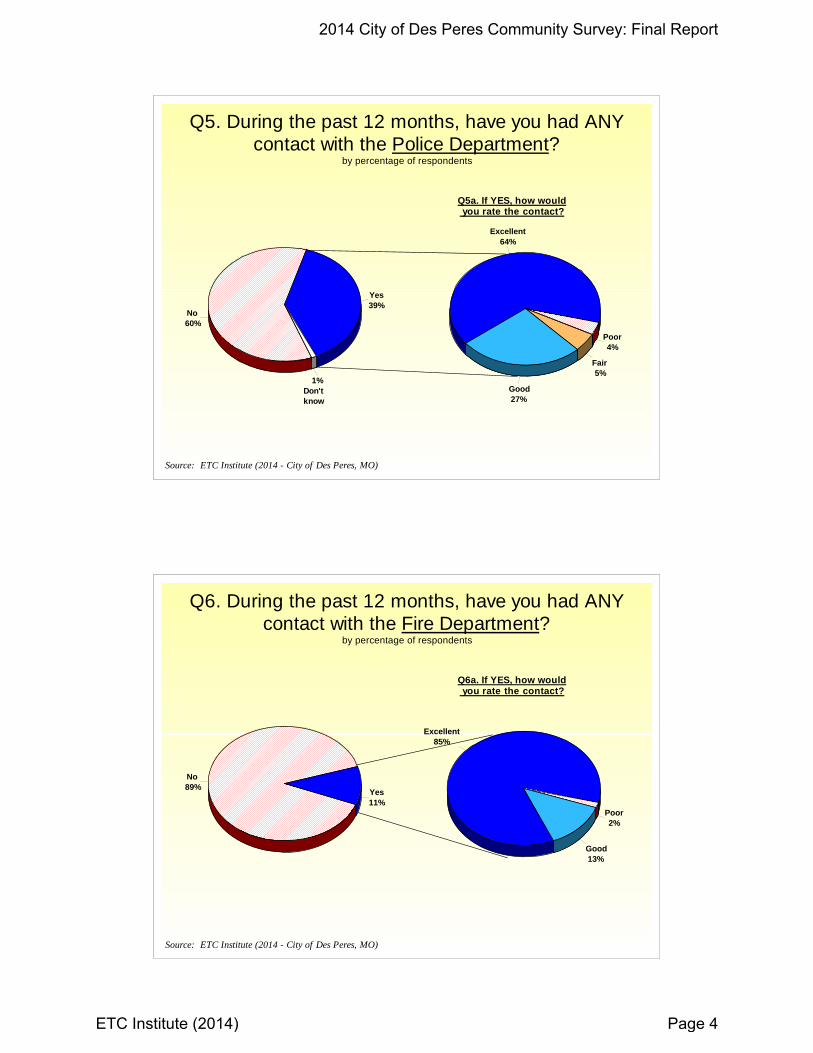
Q5. During the past 12 months, have you had ANY contact with the Police Department?
Source: ETC Institute (2014 - City of Des Peres, MO)
Don't know
Excellent64%
Good27%
Fair 5%
Poor4%
Q5a. If YES, how would you rate the contact?
Yes11%
No 89%
by percentage of respondents
Q6. During the past 12 months, have you had ANY contact with the Fire Department?
Source: ETC Institute (2014 - City of Des Peres, MO)
Excellent85%
Good13%
Poor2%
Q6a. If YES, how would you rate the contact?
2014 City of Des Peres Community Survey: Final Report
ETC Institute (2014) Page 4
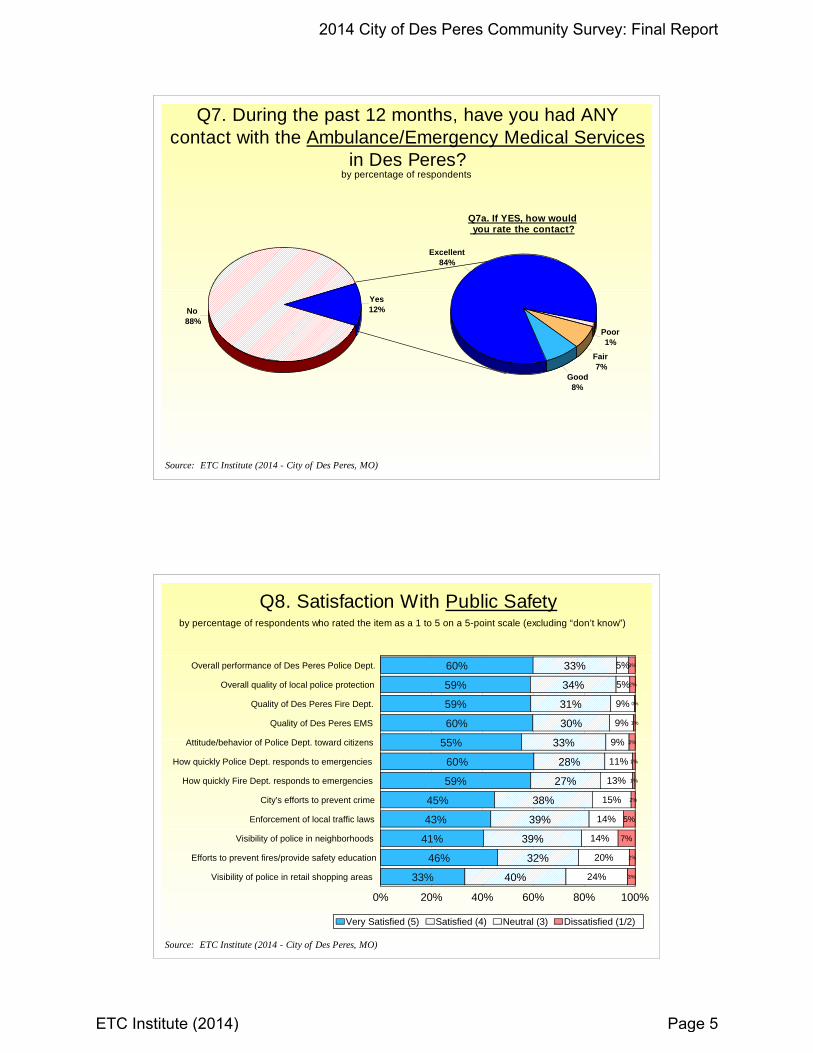
Yes12%No
88%
by percentage of respondents
Q7. During the past 12 months, have you had ANY contact with the Ambulance/Emergency Medical Services
in Des Peres?
Source: ETC Institute (2014 - City of Des Peres, MO)
Excellent84%
Good8%
Fair 7%
Poor1%
Q7a. If YES, how would you rate the contact?
60%
59%
59%
60%
55%
60%
59%
45%
43%
41%
46%
33%
33%
34%
31%
30%
33%
28%
27%
38%
39%
39%
32%
40%
5%
5%
9%
9%
9%
11%
13%
15%
14%
14%
20%
24%
3%
2%
0%
1%
2%
1%
1%
2%
5%
7%
2%
3%
Overall performance of Des Peres Police Dept.
Overall quality of local police protection
Quality of Des Peres Fire Dept.
Quality of Des Peres EMS
Attitude/behavior of Police Dept. toward citizens
How quickly Police Dept. responds to emergencies
How quickly Fire Dept. responds to emergencies
City's efforts to prevent crime
Enforcement of local traffic laws
Visibility of police in neighborhoods
Efforts to prevent fires/provide safety education
Visibility of police in retail shopping areas
0% 20% 40% 60% 80% 100%
Very Satisfied (5) Satisfied (4) Neutral (3) Dissatisfied (1/2)
Q8. Satisfaction With Public Safety by percentage of respondents who rated the item as a 1 to 5 on a 5-point scale (excluding “don’t know”)
Source: ETC Institute (2014 - City of Des Peres, MO)
2014 City of Des Peres Community Survey: Final Report
ETC Institute (2014) Page 5
33%
32%
24%
17%
16%
16%
16%
15%
11%
10%
9%
9%
Visibility of police in neighborhoods
City's efforts to prevent crime
Visibility of police in retail shopping areas
Overall performance of Des Peres Police Dept.
Enforcement of local traffic laws
Overall quality of local police protection
Quality of Des Peres Fire Dept.
Quality of Des Peres EMS
Efforts to prevent fires/provide safety education
How quickly Police Dept. responds to emergencies
How quickly Fire Dept. responds to emergencies
Attitude/behavior of Police Dept. toward citizens
0% 10% 20% 30% 40%
Sum of Choices
Q9. Public Safety Issues That Should Receive the Most Emphasis from City Leaders Over the Next 2
Years
Source: ETC Institute (2014 - City of Des Peres, MO)
by percentage of respondents who selected the item as one of their top three choices
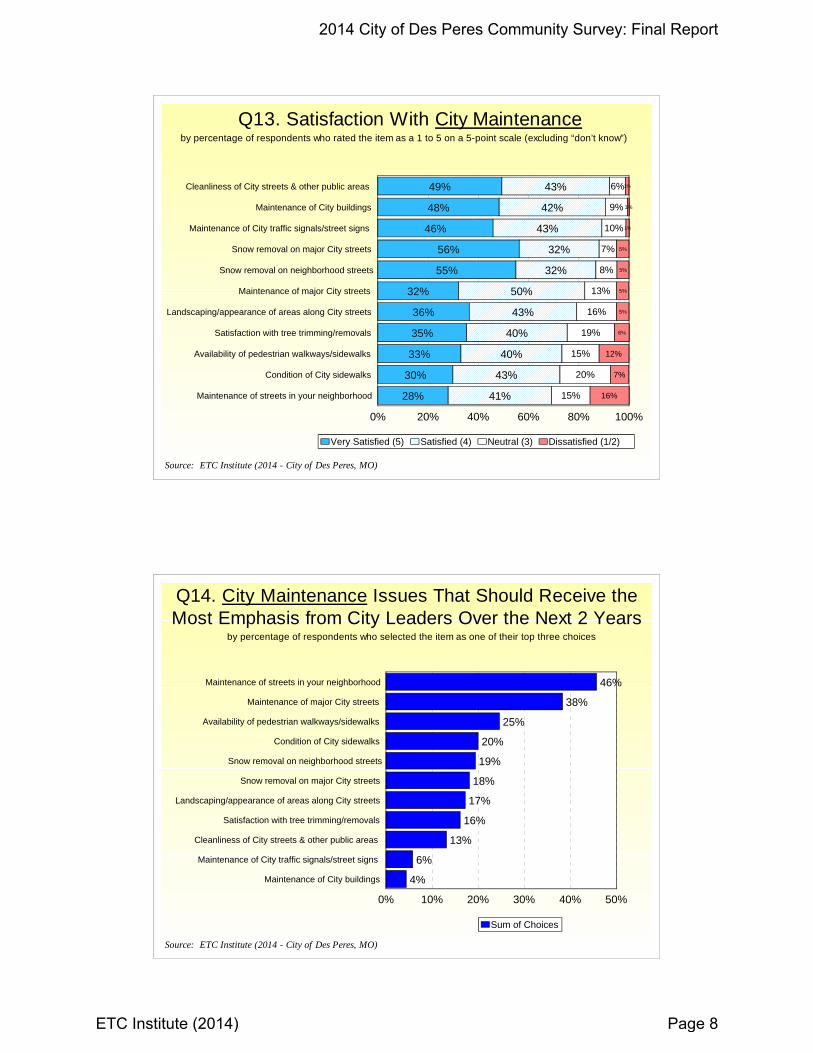
92%
86%
79%
87%
58%
56%
38%
7%
14%
21%
12%
37%
37%
48%
0%
1%
1%
1%
5%
6%
13%
0%
0%
1%
1%
1%
Walking alone in neighborhood during the day
Walking alone in business areas during the day
Overall feeling of safety in Des Peres
Walking alone in neighborhood in general
While shopping at West County Center
Walking alone in neighborhood after dark
Walking alone in business areas after dark
0% 20% 40% 60% 80% 100%
Very Safe (4) Somewhat Safe (3) Somewhat Unsafe (2) Very Unsafe (1)
Q10. How Safe Residents Feel in the Following Situations:
by percentage of respondents who rated the item as a 1 to 4 on a 4-point scale (excluding “don't know”)
Source: ETC Institute (2014 - City of Des Peres, MO)
2014 City of Des Peres Community Survey: Final Report
ETC Institute (2014) Page 6
33%
14%
14%
5%
2%
1%
1%
1%
0%
Des Peres Night Out
Vacation Watch
Neighborhood Watch
Child Safety Seat Installations/Inspections
Project Childsafe
Citizen Police Academy
Personal Property Inventory
Community Emergency Response Team (C.E.R.T.)
Business Watch
0% 10% 20% 30% 40%
Q11. Have you participated in police initiatives/outreach programs?
Source: ETC Institute (2014 - City of Des Peres, MO)
by percentage of respondents (multiple selections could be made)
Yes38%
No43%
Don't know19%
by percentage of respondents
Q12. Do you have an emergency plan in place for members of your household?
Source: ETC Institute (2014 - City of Des Peres, MO)
2014 City of Des Peres Community Survey: Final Report
ETC Institute (2014) Page 7
49%
48%
46%
56%
55%
32%
36%
35%
33%
30%
28%
43%
42%
43%
32%
32%
50%
43%
40%
40%
43%
41%
6%
9%
10%
7%
8%
13%
16%
19%
15%
20%
15%
1%
1%
1%
5%
5%
5%
5%
6%
12%
7%
16%
Cleanliness of City streets & other public areas
Maintenance of City buildings
Maintenance of City traffic signals/street signs
Snow removal on major City streets
Snow removal on neighborhood streets
Maintenance of major City streets
Landscaping/appearance of areas along City streets
Satisfaction with tree trimming/removals
Availability of pedestrian walkways/sidewalks
Condition of City sidewalks
Maintenance of streets in your neighborhood
0% 20% 40% 60% 80% 100%
Very Satisfied (5) Satisfied (4) Neutral (3) Dissatisfied (1/2)
Q13. Satisfaction With City Maintenanceby percentage of respondents who rated the item as a 1 to 5 on a 5-point scale (excluding “don’t know”)
Source: ETC Institute (2014 - City of Des Peres, MO)
46%
38%
25%
20%
19%
18%
17%
16%
13%
6%
4%
Maintenance of streets in your neighborhood
Maintenance of major City streets
Availability of pedestrian walkways/sidewalks
Condition of City sidewalks
Snow removal on neighborhood streets
Snow removal on major City streets
Landscaping/appearance of areas along City streets
Satisfaction with tree trimming/removals
Cleanliness of City streets & other public areas
Maintenance of City traffic signals/street signs
Maintenance of City buildings
0% 10% 20% 30% 40% 50%
Sum of Choices
Source: ETC Institute (2014 - City of Des Peres, MO)
Q14. City Maintenance Issues That Should Receive the Most Emphasis from City Leaders Over the Next 2 Years
by percentage of respondents who selected the item as one of their top three choices
2014 City of Des Peres Community Survey: Final Report
ETC Institute (2014) Page 8
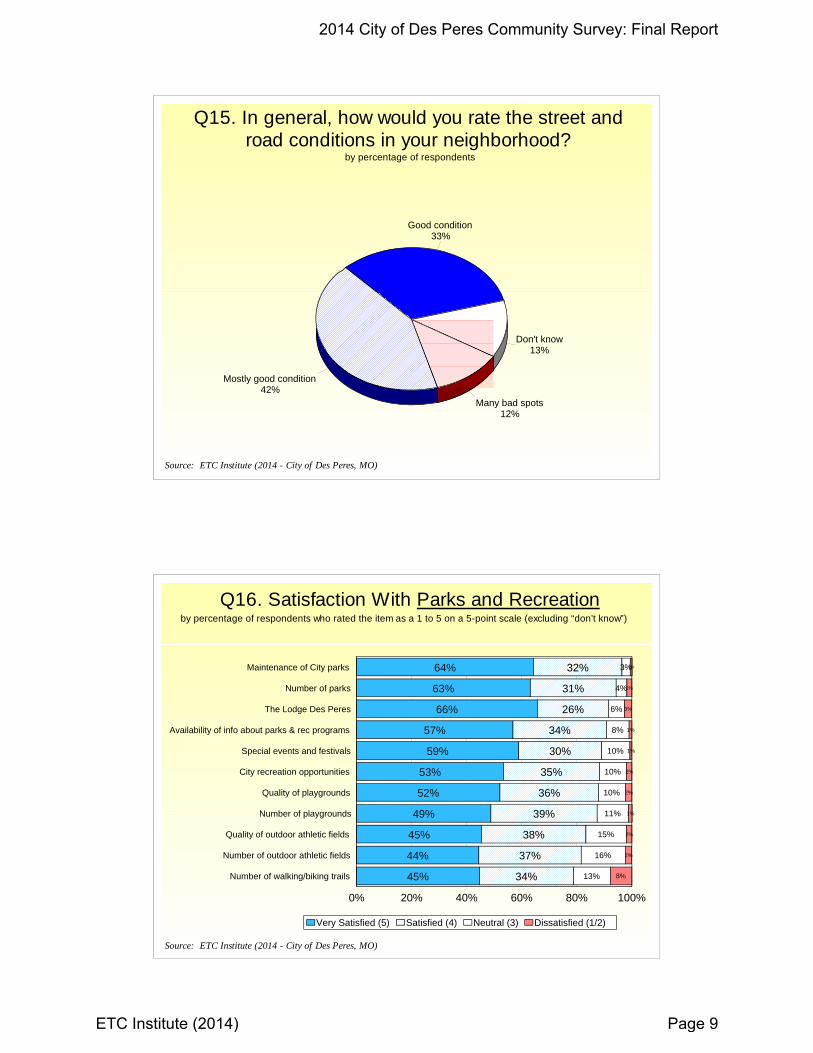
Good condition33%
Mostly good condition42%
Many bad spots12%
Don't know13%
by percentage of respondents
Q15. In general, how would you rate the street and road conditions in your neighborhood?
Source: ETC Institute (2014 - City of Des Peres, MO)
64%
63%
66%
57%
59%
53%
52%
49%
45%
44%
45%
32%
31%
26%
34%
30%
35%
36%
39%
38%
37%
34%
3%
4%
6%
8%
10%
10%
10%
11%
15%
16%
13%
1%
2%
3%
1%
1%
2%
2%
1%
2%
2%
8%
Maintenance of City parks
Number of parks
The Lodge Des Peres
Availability of info about parks & rec programs
Special events and festivals
City recreation opportunities
Quality of playgrounds
Number of playgrounds
Quality of outdoor athletic fields
Number of outdoor athletic fields
Number of walking/biking trails
0% 20% 40% 60% 80% 100%
Very Satisfied (5) Satisfied (4) Neutral (3) Dissatisfied (1/2)
Q16. Satisfaction With Parks and Recreation by percentage of respondents who rated the item as a 1 to 5 on a 5-point scale (excluding “don’t know”)
Source: ETC Institute (2014 - City of Des Peres, MO)
2014 City of Des Peres Community Survey: Final Report
ETC Institute (2014) Page 9
40%
30%
30%
18%
15%
11%
9%
8%
7%
5%
5%
Maintenance of City parks
Number of walking/biking trails
The Lodge Des Peres
Quality of playgrounds
Special events and festivals
City recreation opportunities
Quality of outdoor athletic fields
Availability of info about parks & rec programs
Number of parks
Number of outdoor athletic fields
Number of playgrounds
0% 10% 20% 30% 40%
Source: ETC Institute (2014 - City of Des Peres, MO)
Q17. Parks and Recreation Services That Should Receive the Most Emphasis from City Leaders Over the Next 2 Years
by percentage of respondents who selected the item as one of their top three choices
62%
59%
61%
59%
52%
55%
58%
58%
52%
49%
49%
39%
30%
32%
29%
30%
35%
32%
28%
27%
29%
32%
28%
33%
7%
8%
9%
9%
9%
10%
14%
15%
12%
17%
22%
19%
1%
1%
1%
2%
4%
3%
0%
1%
7%
3%
2%
9%
The Lodge Des Peres facility as a whole
Cleanliness of The Lodge
Information on programs & classes
Customer service provided
Indoor aquatic facilities
Fitness center
Quality of meeting space/rental facilities
Availability of meeting space/rental facilities
Outdoor aquatic facilities
Quality of adult programs
Quality of youth programs
Value/fee structure of programs/classes
0% 20% 40% 60% 80% 100%
Very Satisfied (5) Satisfied (4) Neutral (3) Dissatisfied (1/2)
Q18. Satisfaction With The Lodge Des Peresby percentage of respondents who rated the item as a 1 to 5 on a 5-point scale (excluding “don’t know”)
Source: ETC Institute (2014 - City of Des Peres, MO)
2014 City of Des Peres Community Survey: Final Report
ETC Institute (2014) Page 10
24%
22%
21%
14%
13%
12%
12%
11%
10%
9%
3%
3%
Value/fee structure of programs/classes
The Lodge Des Peres facility as a whole
Fitness center
Outdoor aquatic facilities
Cleanliness of The Lodge
Quality of adult programs
Indoor aquatic facilities
Information on programs & classes
Quality of youth programs
Customer service provided
Availability of meeting space/rental facilities
Quality of meeting space/rental facilities
0% 10% 20% 30%
Sum of Choices
Source: ETC Institute (2014 - City of Des Peres, MO)
Q19. The Lodge Des Peres Services That Should Receive the Most Emphasis from City Leaders Over the Next 2 Years
by percentage of respondents who selected the item as one of their top three choices
Yes42%
No57%
Not provided1%
by percentage of respondents
Q20. Are you a member of The Lodge Des Peres?
Source: ETC Institute (2014 - City of Des Peres, MO)
2014 City of Des Peres Community Survey: Final Report
ETC Institute (2014) Page 11
50%
26%
16%
13%
4%
Wouldn't use it enough to warrant cost
Membership fee too high
Prefer to pay daily fee
Belong to other private facility
Belong to other public facility
0% 10% 20% 30% 40% 50%
Source: ETC Institute (2014 - City of Des Peres, MO)
Q20a. If NO, why not?by percentage of respondents who indicated they are not a member of The Lodge Des Peres
(multiple selections could be made)
93%
54%
47%
36%
30%
21%
7%
6%
4%
3%
1%
The City of Des Peres Newsletter
The Webster-Kirkwood Times
The City Website (www.desperesmo.org)
The Quarterly Activity Guide brochure
The Lodge Link (email)
Other printed publications/materials from the City
Notify Me
Neighborhood meetings
Other online publications/materials from the City
0% 20% 40% 60% 80% 100%
Source: ETC Institute (2014 - City of Des Peres, MO)
Q21. What do you use to get information aboutCity of Des Peres?
by percentage of respondents (multiple selections could be made)
2014 City of Des Peres Community Survey: Final Report
ETC Institute (2014) Page 12
38%
39%
35%
29%
30%
31%
18%
46%
45%
44%
46%
41%
37%
21%
14%
14%
17%
22%
25%
26%
56%
2%
2%
4%
4%
4%
7%
4%
Availability of info about programs/services
Content of City newsletter
Efforts to keep you informed about local issues
How well City communication meets your needs
Quality of City website
How open City is to public involvement/input
Facebook, Twitter, YouTube, etc.
0% 20% 40% 60% 80% 100%
Very Satisfied (5) Satisfied (4) Neutral (3) Dissatisfied (1/2)
Q22. Satisfaction With City Communicationby percentage of respondents who rated the item as a 1 to 5 on a 5-point scale (excluding “don’t know”)
Source: ETC Institute (2014 - City of Des Peres, MO)
34%
32%
29%
26%
25%
24%
45%
43%
44%
40%
38%
36%
18%
20%
22%
22%
22%
25%
4%
5%
6%
12%
14%
14%
Enforcing codes designed to protect public safety
Enforcing sign regulations
Enforcing maintenance of business property
Enforcing mowing & trimming of lawns
Cleanup of litter/debris on private property
Enforcing maintenance of residential property
0% 20% 40% 60% 80% 100%
Very Satisfied (5) Satisfied (4) Neutral (3) Dissatisfied (1/2)
Q23. Satisfaction With Enforcement of Codes and Ordinances
by percentage of respondents who rated the item as a 1 to 5 on a 5-point scale (excluding “don’t know”)
Source: ETC Institute (2014 - City of Des Peres, MO)
2014 City of Des Peres Community Survey: Final Report
ETC Institute (2014) Page 13
70%
57%
44%
43%
42%
30%
25%
24%
17%
Dine out/restaurants
Home furnishings
Personal grooming
Technology/computer equipment
Clothing
Entertainment, movies, video games
Banking
Sporting goods
Groceries
0% 20% 40% 60%
Source: ETC Institute (2014 - City of Des Peres, MO)
Q24. For which goods and services do you typically shop outside Des Peres?
by percentage of respondents (multiple selections could be made)
36%
33%
17%
16%
14%
7%
7%
1%
Clothing
Technology/computer equipment
Home furnishings
Entertainment, movies, video games
Sporting goods
Pet supplies
Personal grooming supplies
Groceries
0% 10% 20% 30% 40%
Source: ETC Institute (2014 - City of Des Peres, MO)
Q25. Which of the following goods and services do you typically shop for on the Internet?
by percentage of respondents (multiple selections could be made)
2014 City of Des Peres Community Survey: Final Report
ETC Institute (2014) Page 14
Yes36%
No64%
by percentage of respondents
Q26. Have you contacted the City with a question, problem or complaint during the past year?
Source: ETC Institute (2014 - City of Des Peres, MO)
54%
65%
54%
51%
35%
21%
30%
24%
8%
9%
9%
7%
4%
6%
7%
17%
How easy the department was to contact
How courteously you were treated
Technical competence/knowledge of employees
Overall responsiveness of City employees
0% 20% 40% 60% 80% 100%
Very Satisfied (5) Satisfied (4) Neutral (3) Dissatisfied (1/2)
Q26b-e. Satisfaction With Customer Service From City Employees
by percentage of respondents who contacted the City during the past year and rated the item as a 1 to 5 on a 5-point scale (excluding “don’t know”)
Source: ETC Institute (2014 - City of Des Peres, MO)
2014 City of Des Peres Community Survey: Final Report
ETC Institute (2014) Page 15
98%
97%
96%
93%
92%
91%
89%
86%
86%
80%
65%
55%
43%
Safety & security
Central location
Quality of housing
Accessibility
Availability of parks & recreation opportunities
Access to quality shopping
Sense of community
Proximity to quality health care
Quality of public school districts
Proximity to family or friends
The Lodge Des Peres
Opportunities/resources for senior citizens
Employment opportunities
0% 20% 40% 60% 80% 100%
Very Important (4) Somewhat Important (3)
Q27. Importance of Various Reasons for Living in Des Peres
Source: ETC Institute (2014 - City of Des Peres, MO)
by percentage of respondents who rated the item as a 3 or 4 on a 4-point scale
52%
51%
50%
50%
49%
48%
48%
48%
46%
45%
40%
28%
27%
Central location
Quality of housing
Safety & security
Availability of parks & recreation opportunities
Access to quality shopping
Accessibility
Quality of public school districts
Sense of community
Proximity to family or friends
Proximity to quality health care
The Lodge Des Peres
Opportunities/resources for senior citizens
Employment opportunities
0% 10% 20% 30% 40% 50%
Yes
Q28. Are your needs being met in Des Peres?
Source: ETC Institute (2014 - City of Des Peres, MO)
by percentage of respondents who answered "yes”
2014 City of Des Peres Community Survey: Final Report
ETC Institute (2014) Page 16
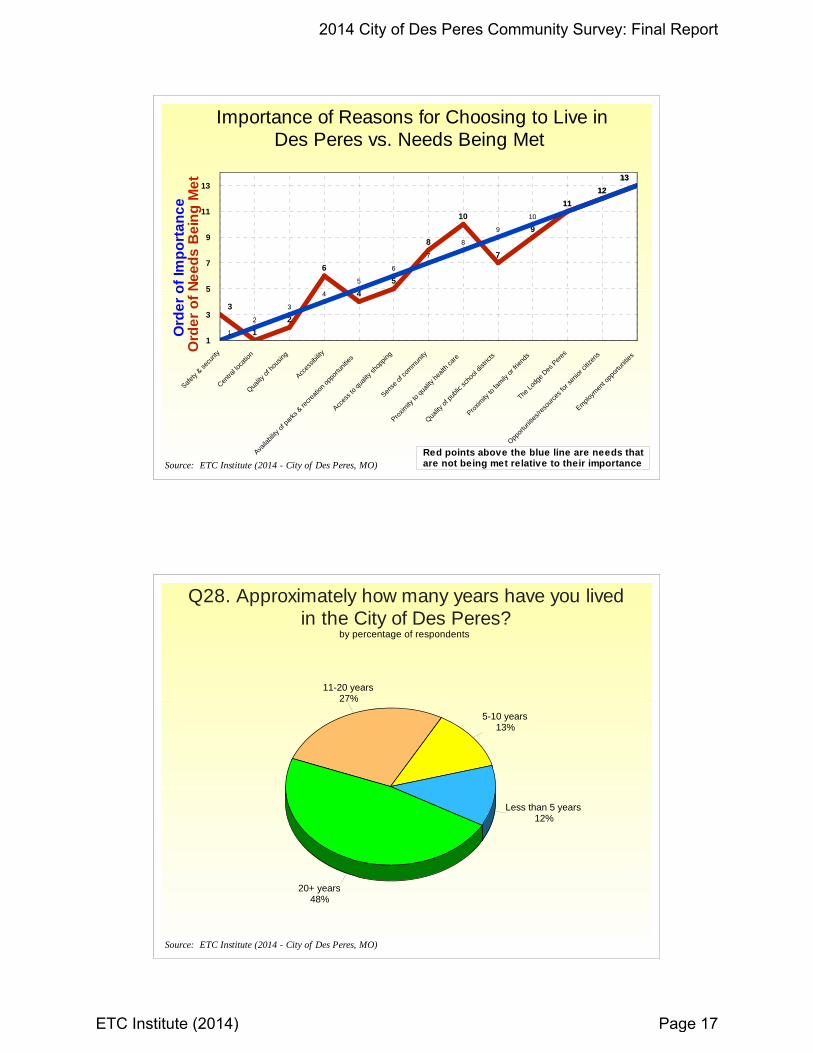
Importance of Reasons for Choosing to Live in Des Peres vs. Needs Being Met
3
1
2
6
4
5
8
10
7
9
11
12
13
1
2
3
4
5
6
7
8
9
10
11
12
13
Safet
y & se
curit
y
Centra
l loca
tion
Quality
of h
ousin
g
Acces
sibilit
y
Availa
bility
of p
arks
& re
crea
tion
oppo
rtunit
ies
Acces
s to
quali
ty sh
oppin
g
Sense
of c
omm
unity
Proxim
ity to
qua
lity h
ealth
care
Quality
of p
ublic
scho
ol dis
tricts
Proxim
ity to
fam
ily o
r frie
nds
The L
odge
Des
Per
es
Oppor
tunit
ies/re
sour
ces f
or se
nior c
itizen
s
Emplo
ymen
t opp
ortu
nities
1
3
5
7
9
11
13O
rde
r o
f Im
po
rta
nc
eO
rde
r o
f N
ee
ds
Be
ing
Me
t
Red points above the blue line are needs that are not being met relative to their importanceSource: ETC Institute (2014 - City of Des Peres, MO)
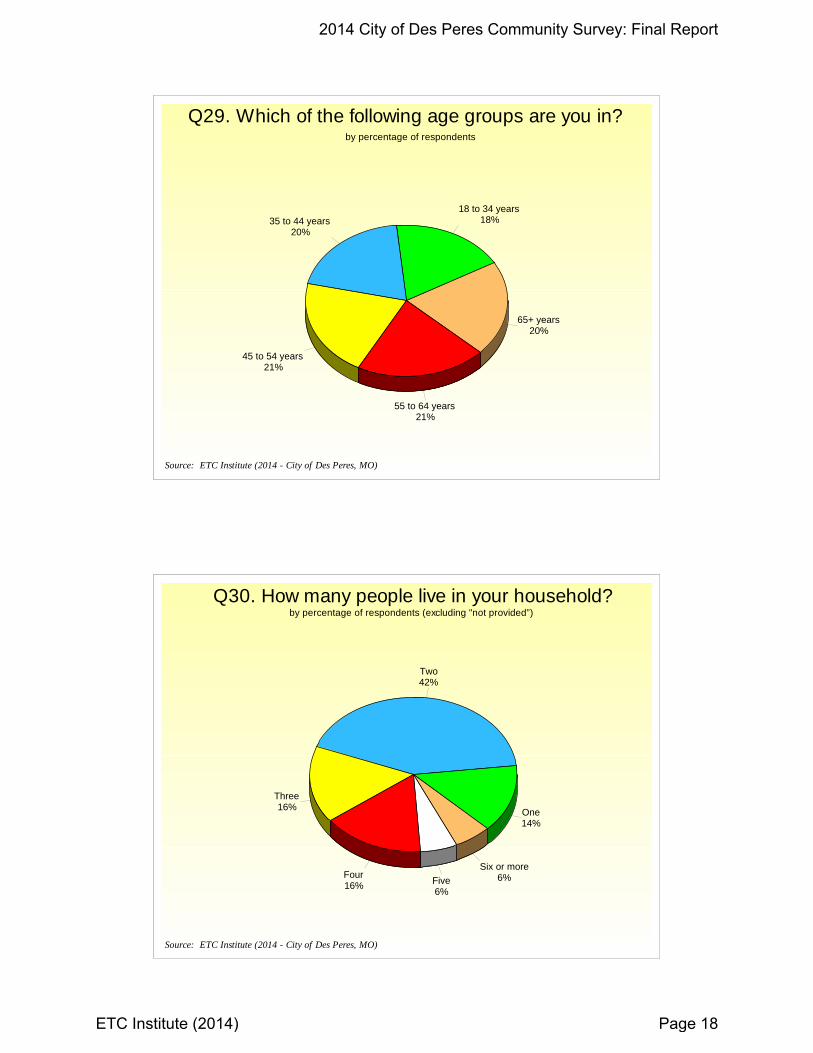
Q28. Approximately how many years have you lived in the City of Des Peres?
by percentage of respondents
Less than 5 years12%
5-10 years13%
11-20 years27%
20+ years48%
Source: ETC Institute (2014 - City of Des Peres, MO)
2014 City of Des Peres Community Survey: Final Report
ETC Institute (2014) Page 17
18 to 34 years18%35 to 44 years
20%
45 to 54 years21%
55 to 64 years21%
65+ years20%
Q29. Which of the following age groups are you in?by percentage of respondents
Source: ETC Institute (2014 - City of Des Peres, MO)
One14%
Two42%
Three16%
Four16% Five
6%
Six or more6%
Q30. How many people live in your household?by percentage of respondents (excluding "not provided”)
Source: ETC Institute (2014 - City of Des Peres, MO)
2014 City of Des Peres Community Survey: Final Report
ETC Institute (2014) Page 18
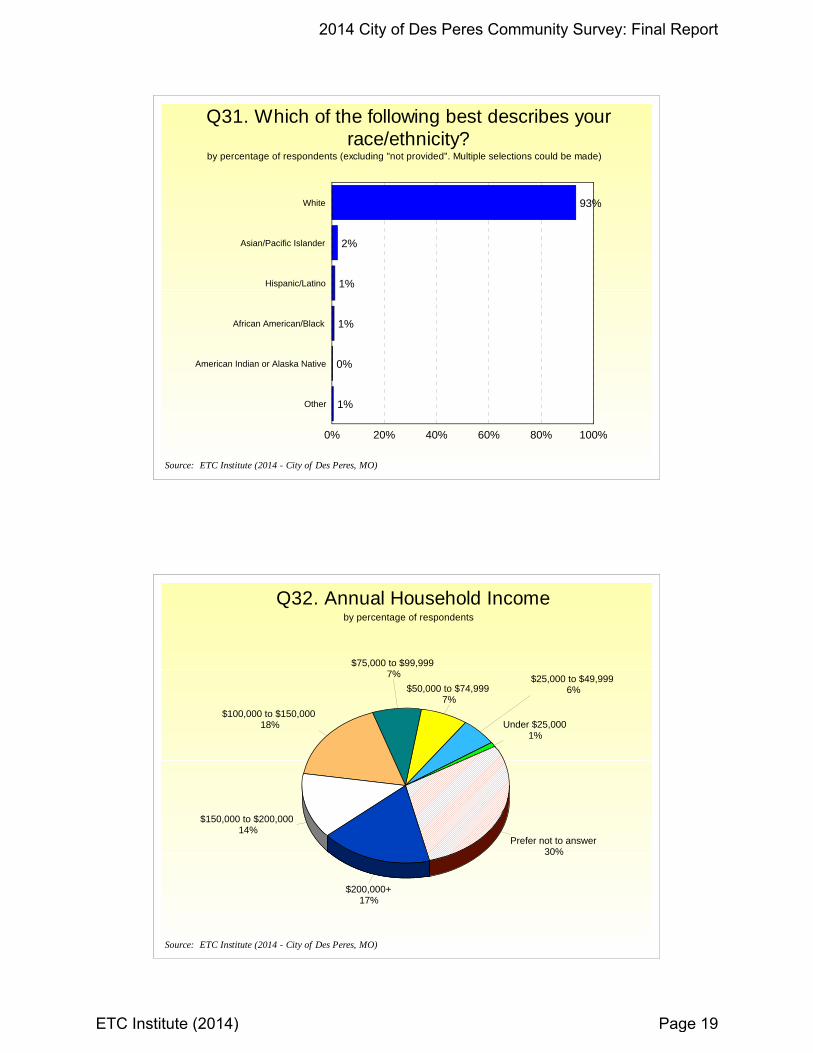
93%
2%
1%
1%
0%
1%
White
Asian/Pacific Islander
Hispanic/Latino
African American/Black
American Indian or Alaska Native
Other
0% 20% 40% 60% 80% 100%
Q31. Which of the following best describes your race/ethnicity?
by percentage of respondents (excluding "not provided”. Multiple selections could be made)
Source: ETC Institute (2014 - City of Des Peres, MO)
Under $25,0001%
$25,000 to $49,9996%$50,000 to $74,999
7%
$75,000 to $99,9997%
$100,000 to $150,00018%
$150,000 to $200,00014%
$200,000+17%
Prefer not to answer30%
Q32. Annual Household Incomeby percentage of respondents
Source: ETC Institute (2014 - City of Des Peres, MO)
2014 City of Des Peres Community Survey: Final Report
ETC Institute (2014) Page 19
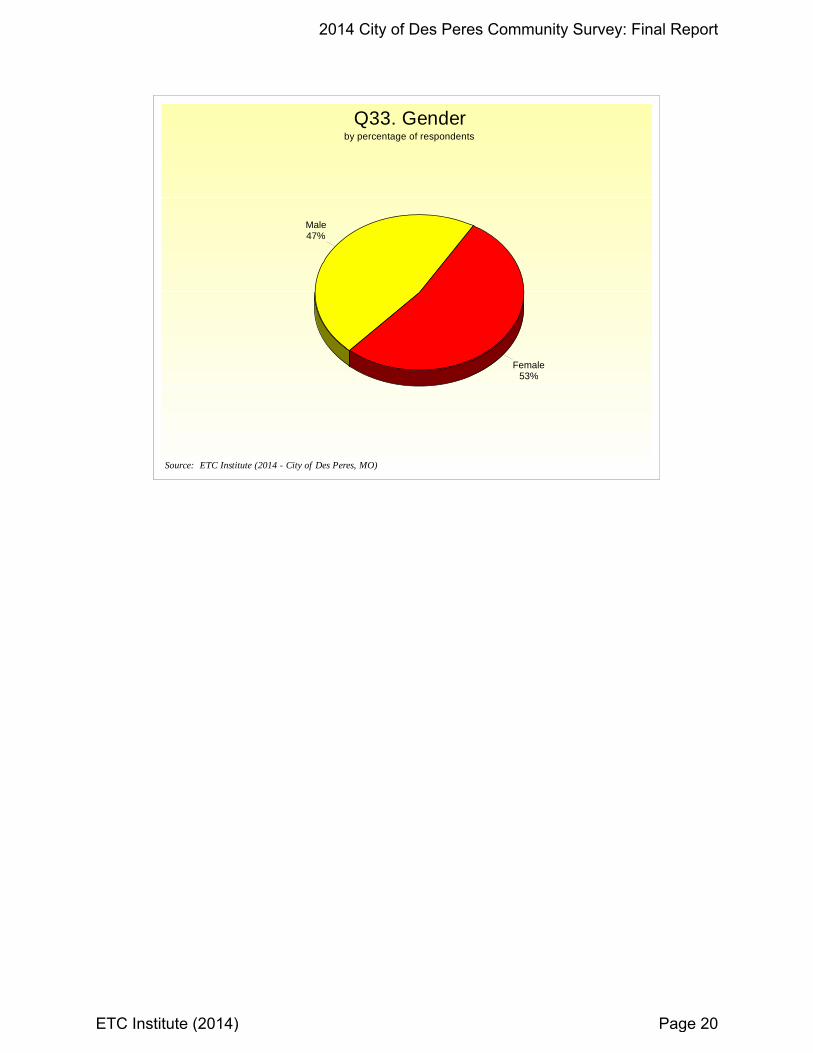
Male47%
Female53%
Q33. Gender by percentage of respondents
Source: ETC Institute (2014 - City of Des Peres, MO)
2014 City of Des Peres Community Survey: Final Report
ETC Institute (2014) Page 20
Section 2: Importance-Satisfaction Analysis
2014 City of Des Peres Community Survey: Final Report
ETC Institute (2014) Page 21
Importan
ce‐Satisfaction Analysis
Importance‐Satisfaction Analysis The City of Des Peres, MO
Overview Today, city officials have limited resources which need to be targeted to activities that are of the most benefit to their citizens. Two of the most important criteria for decision making are (1) to target resources toward services of the highest importance to citizens; and (2) to target resources toward those services where citizens are the least satisfied. The Importance‐Satisfaction (IS) rating is a unique tool that allows public officials to better understand both of these highly important decision making criteria for each of the services they are providing. The Importance‐Satisfaction rating is based on the concept that cities will maximize overall citizen satisfaction by emphasizing improvements in those service categories where the level of satisfaction is relatively low and the perceived importance of the service is relatively high.
Methodology
The rating is calculated by summing the percentage of responses for items selected as the first, second, and third most important services for the City to emphasize over the next two years. This sum is then multiplied by 1 minus the percentage of respondents that indicated they were positively satisfied with the City’s performance in the related area (the sum of the ratings of 4 and 5 on a 5‐point scale excluding “don't know” responses). “Don't know” responses are excluded from the calculation to ensure that the satisfaction ratings among service categories are comparable. [IS=Importance x (1‐Satisfaction)]. Example of the Calculation. Respondents were asked to identify the major services they thought were the most important for the City to provide. Approximately forty‐three percent (42.9%) of residents selected “overall flow of traffic and ease of getting around the city” as the most important major service to provide.
2014 City of Des Peres Community Survey: Final Report
ETC Institute (2014) Page 22
Importan
ce‐Satisfaction Analysis
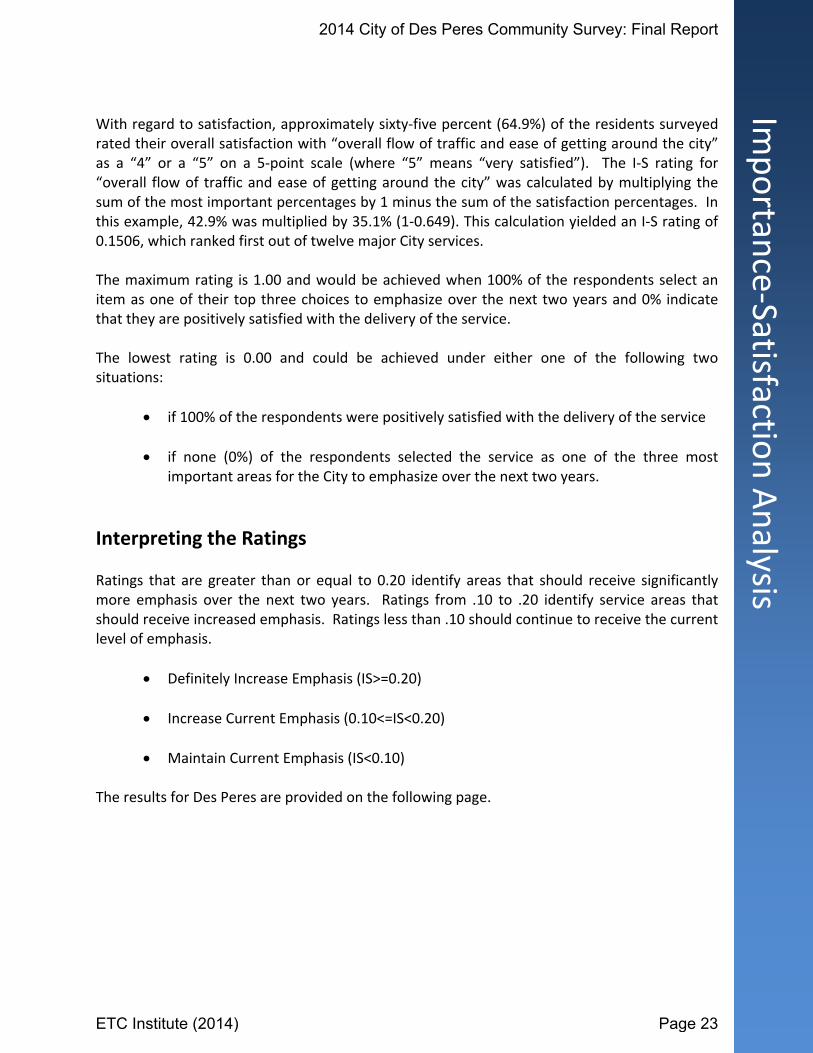
With regard to satisfaction, approximately sixty‐five percent (64.9%) of the residents surveyed rated their overall satisfaction with “overall flow of traffic and ease of getting around the city” as a “4” or a “5” on a 5‐point scale (where “5” means “very satisfied”). The I‐S rating for “overall flow of traffic and ease of getting around the city” was calculated by multiplying the sum of the most important percentages by 1 minus the sum of the satisfaction percentages. In this example, 42.9% was multiplied by 35.1% (1‐0.649). This calculation yielded an I‐S rating of 0.1506, which ranked first out of twelve major City services. The maximum rating is 1.00 and would be achieved when 100% of the respondents select an item as one of their top three choices to emphasize over the next two years and 0% indicate that they are positively satisfied with the delivery of the service. The lowest rating is 0.00 and could be achieved under either one of the following two situations:
if 100% of the respondents were positively satisfied with the delivery of the service
if none (0%) of the respondents selected the service as one of the three most important areas for the City to emphasize over the next two years.
Interpreting the Ratings Ratings that are greater than or equal to 0.20 identify areas that should receive significantly more emphasis over the next two years. Ratings from .10 to .20 identify service areas that should receive increased emphasis. Ratings less than .10 should continue to receive the current level of emphasis.
Definitely Increase Emphasis (IS>=0.20)
Increase Current Emphasis (0.10<=IS<0.20)
Maintain Current Emphasis (IS<0.10) The results for Des Peres are provided on the following page.
2014 City of Des Peres Community Survey: Final Report
ETC Institute (2014) Page 23
Importance-Satisfaction RatingCity of Des Peres, MO
OVERALL
Category of ServiceMost
Important %
Most Important
Rank Satisfaction %Satisfaction
Rank
Importance-Satisfaction
RatingI-S Rating
Rank
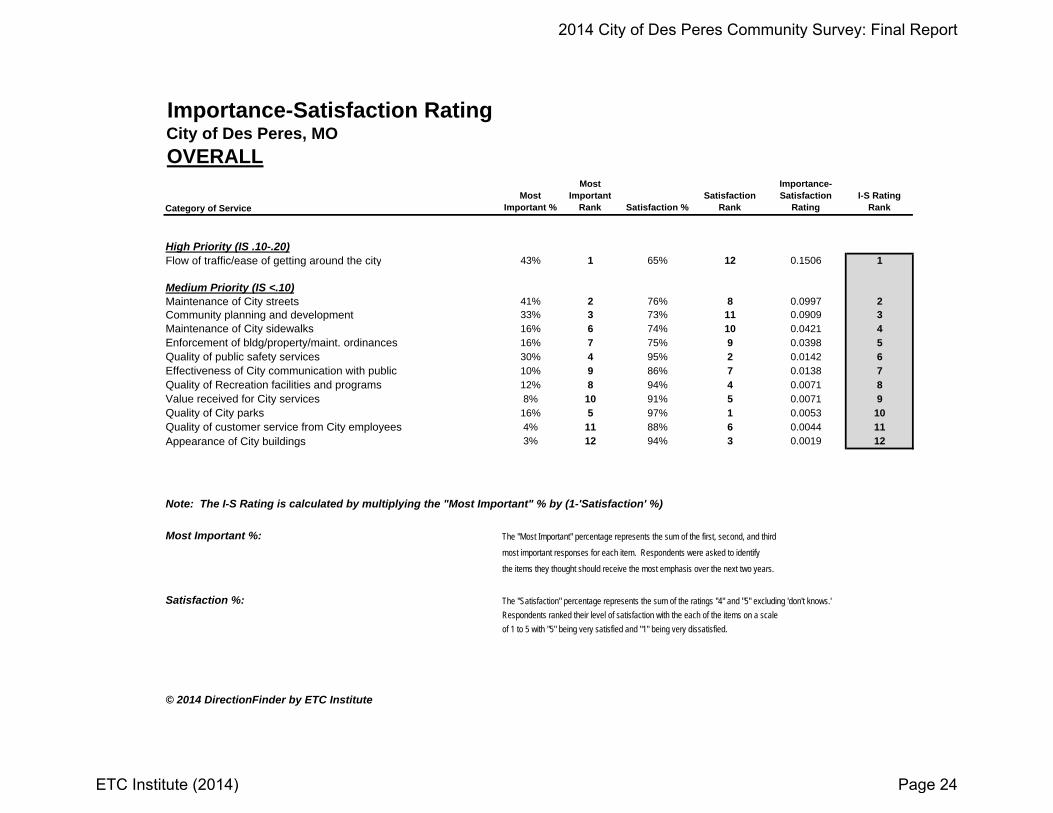
High Priority (IS .10-.20)Flow of traffic/ease of getting around the city 43% 1 65% 12 0.1506 1
Medium Priority (IS <.10)Maintenance of City streets 41% 2 76% 8 0.0997 2Community planning and development 33% 3 73% 11 0.0909 3
Maintenance of City sidewalks 16% 6 74% 10 0.0421 4
Enforcement of bldg/property/maint. ordinances 16% 7 75% 9 0.0398 5
Quality of public safety services 30% 4 95% 2 0.0142 6
Effectiveness of City communication with public 10% 9 86% 7 0.0138 7
Quality of Recreation facilities and programs 12% 8 94% 4 0.0071 8
Value received for City services 8% 10 91% 5 0.0071 9
Quality of City parks 16% 5 97% 1 0.0053 10
Quality of customer service from City employees 4% 11 88% 6 0.0044 11
Appearance of City buildings 3% 12 94% 3 0.0019 12
Note: The I-S Rating is calculated by multiplying the "Most Important" % by (1-'Satisfaction' %)
Most Important %: The "Most Important" percentage represents the sum of the first, second, and third
most important responses for each item. Respondents were asked to identify
the items they thought should receive the most emphasis over the next two years.
Satisfaction %: The "Satisfaction" percentage represents the sum of the ratings "4" and "5" excluding 'don't knows.'Respondents ranked their level of satisfaction with the each of the items on a scaleof 1 to 5 with "5" being very satisfied and "1" being very dissatisfied.
© 2014 DirectionFinder by ETC Institute
2014 City of Des Peres Community Survey: Final Report
ETC Institute (2014) Page 24
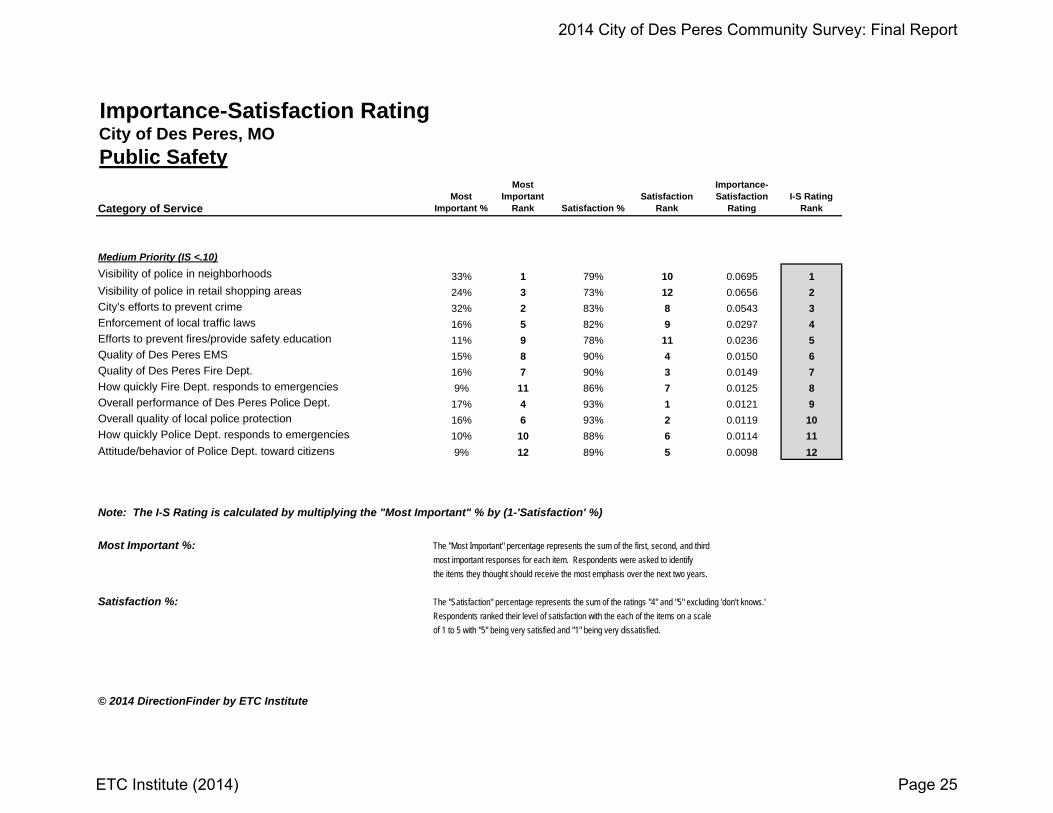
Importance-Satisfaction RatingCity of Des Peres, MO
Public Safety
Category of ServiceMost
Important %
Most Important
Rank Satisfaction %Satisfaction
Rank
Importance-Satisfaction
RatingI-S Rating
Rank
Medium Priority (IS <.10)Visibility of police in neighborhoods 33% 1 79% 10 0.0695 1
Visibility of police in retail shopping areas 24% 3 73% 12 0.0656 2
City's efforts to prevent crime 32% 2 83% 8 0.0543 3
Enforcement of local traffic laws 16% 5 82% 9 0.0297 4
Efforts to prevent fires/provide safety education 11% 9 78% 11 0.0236 5
Quality of Des Peres EMS 15% 8 90% 4 0.0150 6
Quality of Des Peres Fire Dept. 16% 7 90% 3 0.0149 7
How quickly Fire Dept. responds to emergencies 9% 11 86% 7 0.0125 8
Overall performance of Des Peres Police Dept. 17% 4 93% 1 0.0121 9
Overall quality of local police protection 16% 6 93% 2 0.0119 10
How quickly Police Dept. responds to emergencies 10% 10 88% 6 0.0114 11
Attitude/behavior of Police Dept. toward citizens 9% 12 89% 5 0.0098 12
Note: The I-S Rating is calculated by multiplying the "Most Important" % by (1-'Satisfaction' %)
Most Important %: The "Most Important" percentage represents the sum of the first, second, and thirdmost important responses for each item. Respondents were asked to identifythe items they thought should receive the most emphasis over the next two years.
Satisfaction %: The "Satisfaction" percentage represents the sum of the ratings "4" and "5" excluding 'don't knows.'Respondents ranked their level of satisfaction with the each of the items on a scaleof 1 to 5 with "5" being very satisfied and "1" being very dissatisfied.
© 2014 DirectionFinder by ETC Institute
2014 City of Des Peres Community Survey: Final Report
ETC Institute (2014) Page 25
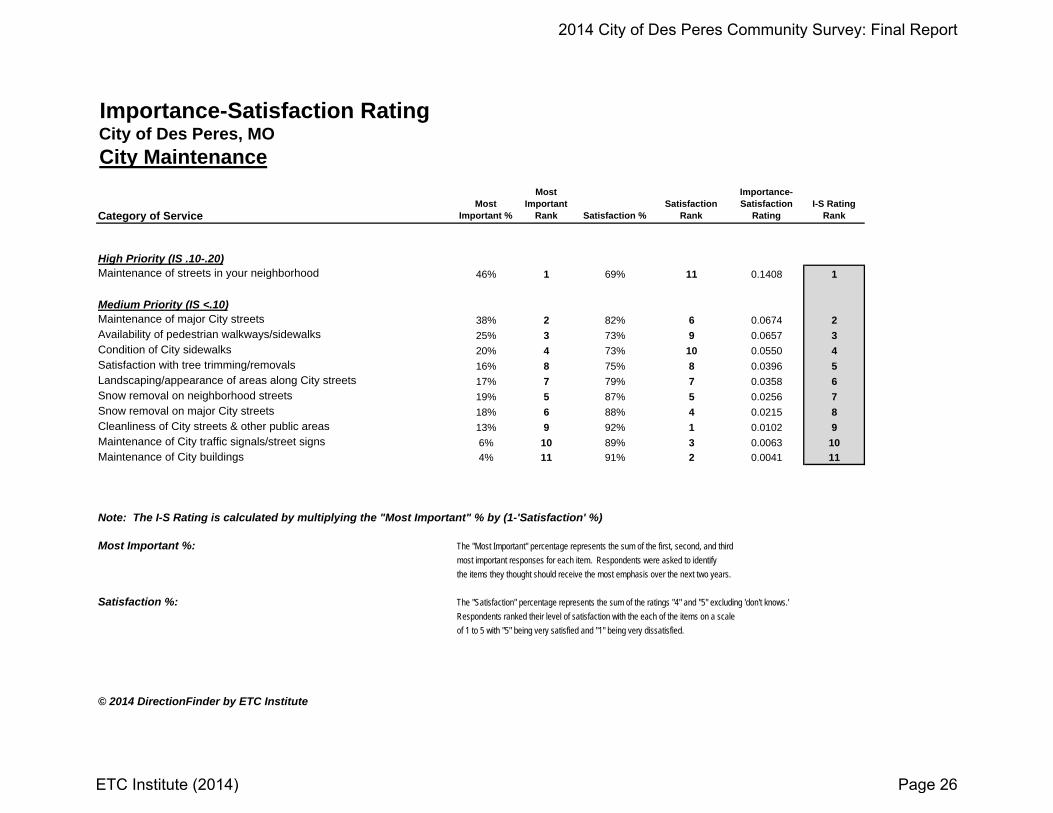
Importance-Satisfaction RatingCity of Des Peres, MO
City Maintenance
Category of ServiceMost
Important %
Most Important
Rank Satisfaction %Satisfaction
Rank
Importance-Satisfaction
RatingI-S Rating
Rank
High Priority (IS .10-.20)Maintenance of streets in your neighborhood 46% 1 69% 11 0.1408 1
Medium Priority (IS <.10)Maintenance of major City streets 38% 2 82% 6 0.0674 2
Availability of pedestrian walkways/sidewalks 25% 3 73% 9 0.0657 3
Condition of City sidewalks 20% 4 73% 10 0.0550 4
Satisfaction with tree trimming/removals 16% 8 75% 8 0.0396 5
Landscaping/appearance of areas along City streets 17% 7 79% 7 0.0358 6
Snow removal on neighborhood streets 19% 5 87% 5 0.0256 7
Snow removal on major City streets 18% 6 88% 4 0.0215 8
Cleanliness of City streets & other public areas 13% 9 92% 1 0.0102 9
Maintenance of City traffic signals/street signs 6% 10 89% 3 0.0063 10
Maintenance of City buildings 4% 11 91% 2 0.0041 11
Note: The I-S Rating is calculated by multiplying the "Most Important" % by (1-'Satisfaction' %)
Most Important %: The "Most Important" percentage represents the sum of the first, second, and thirdmost important responses for each item. Respondents were asked to identifythe items they thought should receive the most emphasis over the next two years.
Satisfaction %: The "Satisfaction" percentage represents the sum of the ratings "4" and "5" excluding 'don't knows.'Respondents ranked their level of satisfaction with the each of the items on a scaleof 1 to 5 with "5" being very satisfied and "1" being very dissatisfied.
© 2014 DirectionFinder by ETC Institute
2014 City of Des Peres Community Survey: Final Report
ETC Institute (2014) Page 26
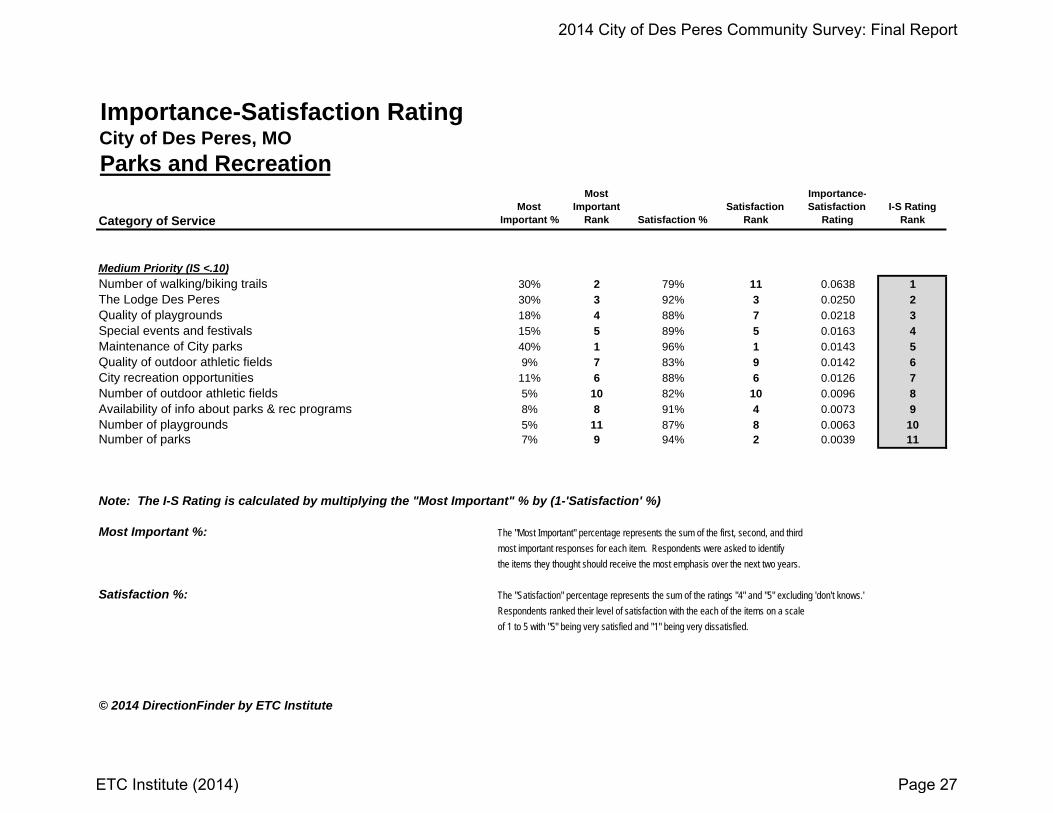
Importance-Satisfaction RatingCity of Des Peres, MO
Parks and Recreation
Category of ServiceMost
Important %
Most Important
Rank Satisfaction %Satisfaction
Rank
Importance-Satisfaction
RatingI-S Rating
Rank
Medium Priority (IS <.10)
Number of walking/biking trails 30% 2 79% 11 0.0638 1
The Lodge Des Peres 30% 3 92% 3 0.0250 2
Quality of playgrounds 18% 4 88% 7 0.0218 3
Special events and festivals 15% 5 89% 5 0.0163 4
Maintenance of City parks 40% 1 96% 1 0.0143 5
Quality of outdoor athletic fields 9% 7 83% 9 0.0142 6
City recreation opportunities 11% 6 88% 6 0.0126 7
Number of outdoor athletic fields 5% 10 82% 10 0.0096 8
Availability of info about parks & rec programs 8% 8 91% 4 0.0073 9
Number of playgrounds 5% 11 87% 8 0.0063 10Number of parks 7% 9 94% 2 0.0039 11
Note: The I-S Rating is calculated by multiplying the "Most Important" % by (1-'Satisfaction' %)
Most Important %: The "Most Important" percentage represents the sum of the first, second, and thirdmost important responses for each item. Respondents were asked to identifythe items they thought should receive the most emphasis over the next two years.
Satisfaction %: The "Satisfaction" percentage represents the sum of the ratings "4" and "5" excluding 'don't knows.'Respondents ranked their level of satisfaction with the each of the items on a scaleof 1 to 5 with "5" being very satisfied and "1" being very dissatisfied.
© 2014 DirectionFinder by ETC Institute
2014 City of Des Peres Community Survey: Final Report
ETC Institute (2014) Page 27
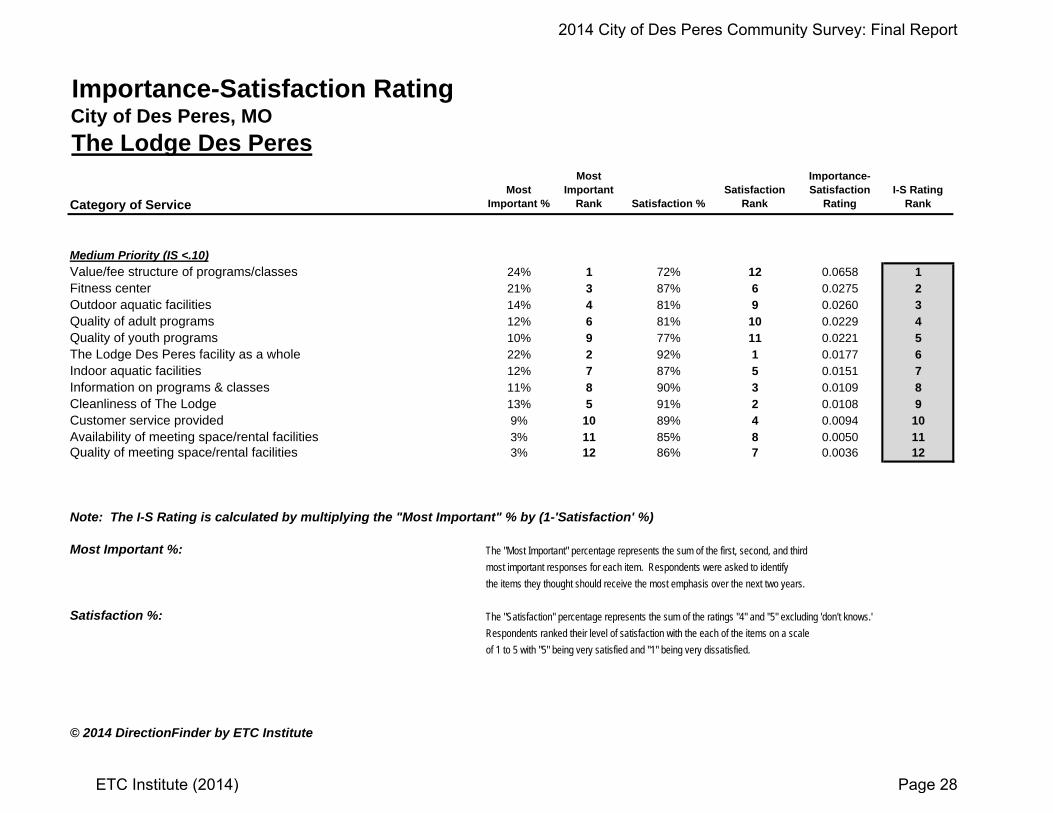
Importance-Satisfaction RatingCity of Des Peres, MO
The Lodge Des Peres
Category of ServiceMost
Important %
Most Important
Rank Satisfaction %Satisfaction
Rank
Importance-Satisfaction
RatingI-S Rating
Rank
Medium Priority (IS <.10)Value/fee structure of programs/classes 24% 1 72% 12 0.0658 1Fitness center 21% 3 87% 6 0.0275 2Outdoor aquatic facilities 14% 4 81% 9 0.0260 3Quality of adult programs 12% 6 81% 10 0.0229 4Quality of youth programs 10% 9 77% 11 0.0221 5The Lodge Des Peres facility as a whole 22% 2 92% 1 0.0177 6Indoor aquatic facilities 12% 7 87% 5 0.0151 7Information on programs & classes 11% 8 90% 3 0.0109 8Cleanliness of The Lodge 13% 5 91% 2 0.0108 9Customer service provided 9% 10 89% 4 0.0094 10Availability of meeting space/rental facilities 3% 11 85% 8 0.0050 11Quality of meeting space/rental facilities 3% 12 86% 7 0.0036 12
Note: The I-S Rating is calculated by multiplying the "Most Important" % by (1-'Satisfaction' %)
Most Important %: The "Most Important" percentage represents the sum of the first, second, and thirdmost important responses for each item. Respondents were asked to identifythe items they thought should receive the most emphasis over the next two years.
Satisfaction %: The "Satisfaction" percentage represents the sum of the ratings "4" and "5" excluding 'don't knows.'Respondents ranked their level of satisfaction with the each of the items on a scaleof 1 to 5 with "5" being very satisfied and "1" being very dissatisfied.
© 2014 DirectionFinder by ETC Institute
2014 City of Des Peres Community Survey: Final Report
ETC Institute (2014) Page 28
Importan
ce‐Satisfaction Analysis
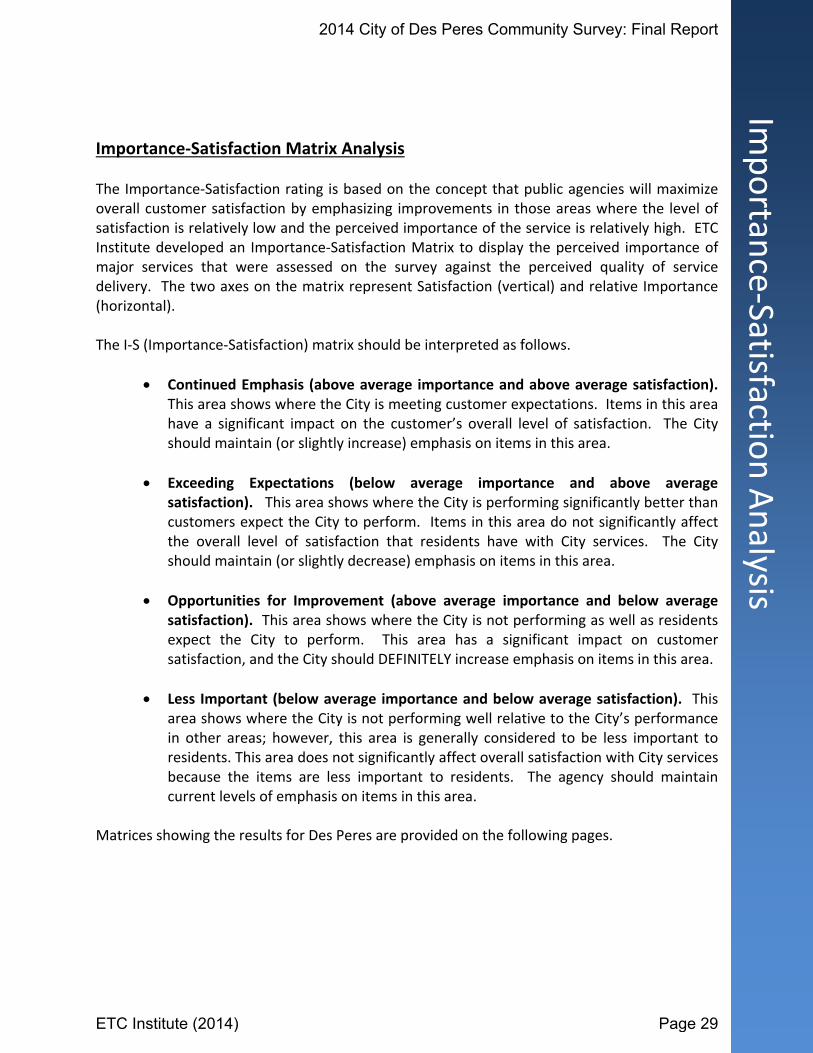
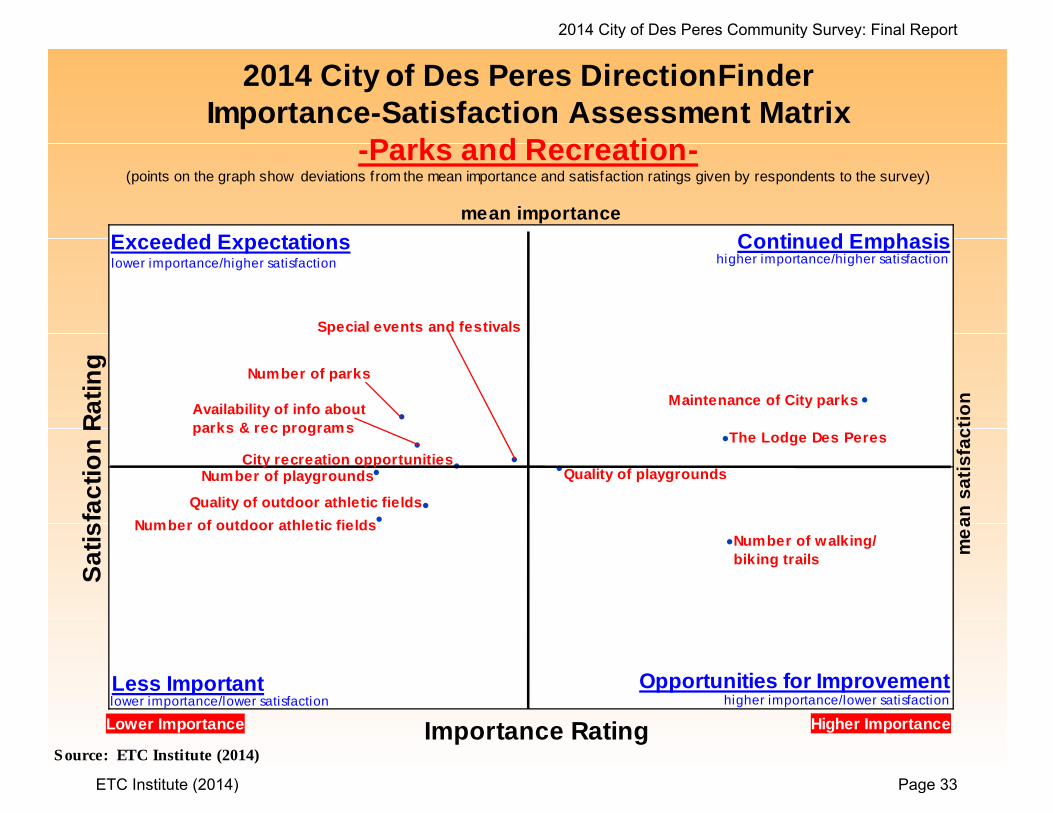
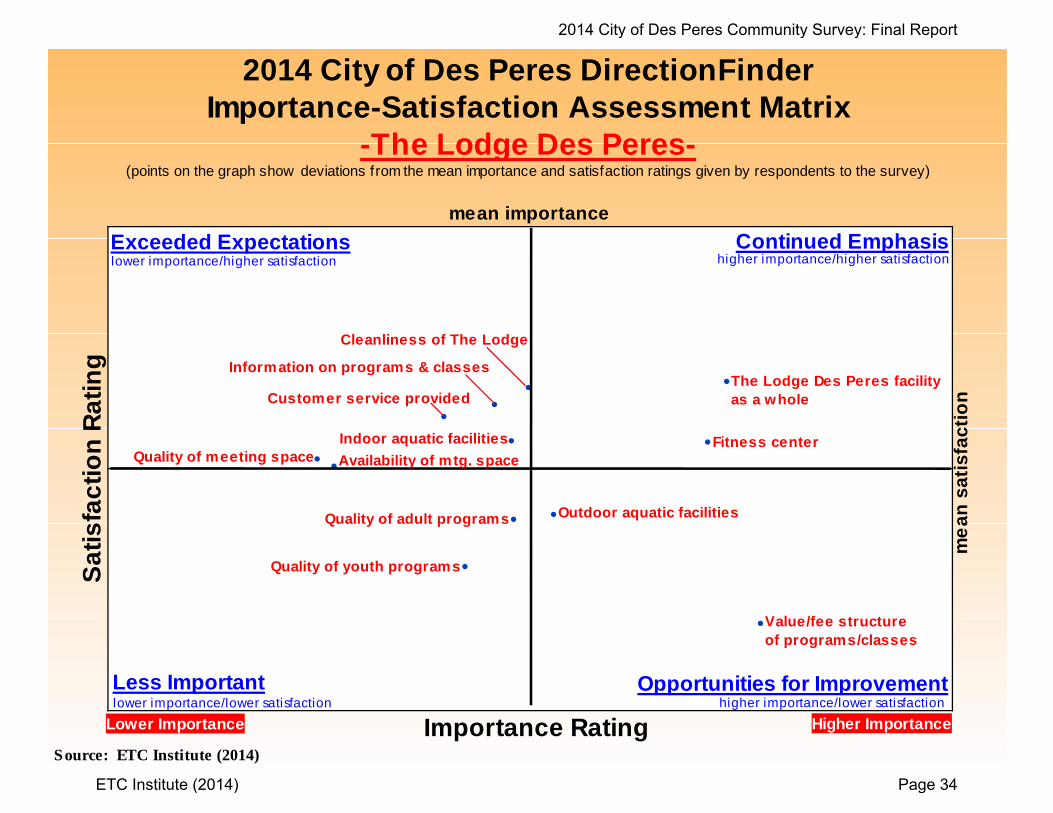
Importance‐Satisfaction Matrix Analysis The Importance‐Satisfaction rating is based on the concept that public agencies will maximize overall customer satisfaction by emphasizing improvements in those areas where the level of satisfaction is relatively low and the perceived importance of the service is relatively high. ETC Institute developed an Importance‐Satisfaction Matrix to display the perceived importance of major services that were assessed on the survey against the perceived quality of service delivery. The two axes on the matrix represent Satisfaction (vertical) and relative Importance (horizontal). The I‐S (Importance‐Satisfaction) matrix should be interpreted as follows.
Continued Emphasis (above average importance and above average satisfaction). This area shows where the City is meeting customer expectations. Items in this area have a significant impact on the customer’s overall level of satisfaction. The City should maintain (or slightly increase) emphasis on items in this area.
Exceeding Expectations (below average importance and above average satisfaction). This area shows where the City is performing significantly better than customers expect the City to perform. Items in this area do not significantly affect the overall level of satisfaction that residents have with City services. The City should maintain (or slightly decrease) emphasis on items in this area.
Opportunities for Improvement (above average importance and below average satisfaction). This area shows where the City is not performing as well as residents expect the City to perform. This area has a significant impact on customer satisfaction, and the City should DEFINITELY increase emphasis on items in this area.
Less Important (below average importance and below average satisfaction). This area shows where the City is not performing well relative to the City’s performance in other areas; however, this area is generally considered to be less important to residents. This area does not significantly affect overall satisfaction with City services because the items are less important to residents. The agency should maintain current levels of emphasis on items in this area.
Matrices showing the results for Des Peres are provided on the following pages.
2014 City of Des Peres Community Survey: Final Report
ETC Institute (2014) Page 29
!
!
!! !
!!
!
!!!!
Sa
tis
f ac
tio
n R
ati
ng
me
an
sa
tis
fac
tio
n
Opportunities for Improvement
mean importance
Importance RatingLower Importance Higher Importance
lower importance/higher satisfaction higher importance/higher satisfaction
lower importance/lower satisfaction higher importance/lower satisfaction
Exceeded Expectations
Less Important
Continued Emphasis
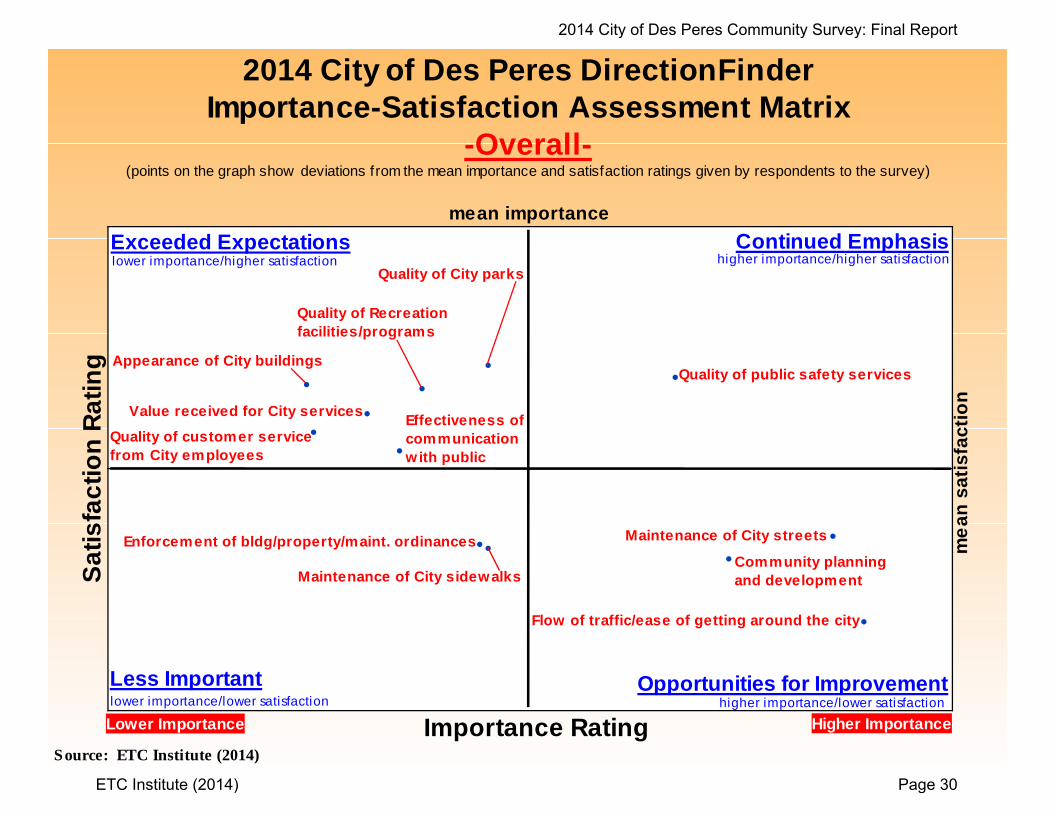
2014 City of Des Peres DirectionFinder Importance-Satisfaction Assessment Matrix
-Overall-(points on the graph show deviations from the mean importance and satisfaction ratings given by respondents to the survey)
Source: ETC Institute (2014)
Quality of City parks
Quality of public safety servicesAppearance of City buildings
Quality of Recreation facilities/programs
Value received for City services
Quality of customer service from City employees
Effectiveness of communicationwith public
Maintenance of City streetsEnforcement of bldg/property/maint. ordinances
Maintenance of City sidewalksCommunity planningand development
Flow of traffic/ease of getting around the city
2014 City of Des Peres Community Survey: Final Report
ETC Institute (2014) Page 30
!
!
!
!!! !!
!!
!!
Sa
tis
f ac
tio
n R
ati
ng
me
an
sa
tis
fac
tio
n
Opportunities for Improvement
mean importance
Importance RatingLower Importance Higher Importance
lower importance/higher satisfaction higher importance/higher satisfaction
lower importance/lower satisfaction higher importance/lower satisfaction
Exceeded Expectations
Less Important
Continued Emphasis
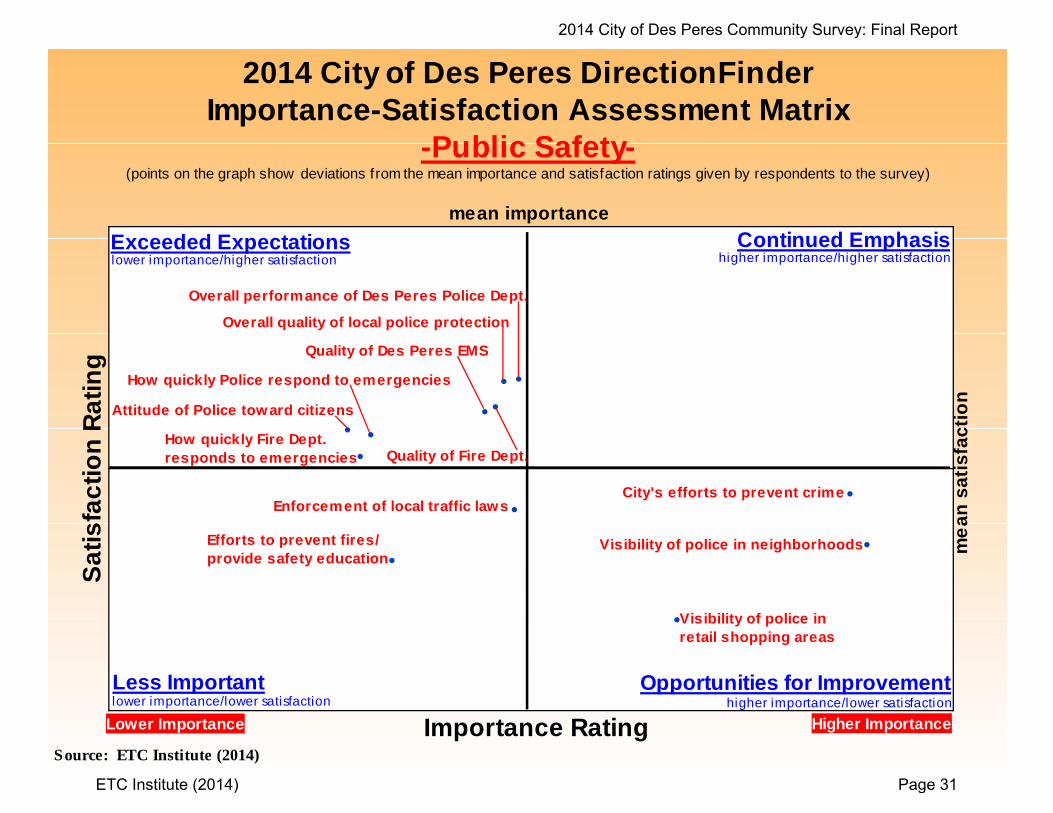
2014 City of Des Peres DirectionFinder Importance-Satisfaction Assessment Matrix
-Public Safety-(points on the graph show deviations from the mean importance and satisfaction ratings given by respondents to the survey)
Source: ETC Institute (2014)
Overall performance of Des Peres Police Dept.
Overall quality of local police protection
Quality of Fire Dept.
Quality of Des Peres EMS
Attitude of Police toward citizens
How quickly Police respond to emergencies
How quickly Fire Dept. responds to emergencies
City's efforts to prevent crimeEnforcement of local traffic laws
Visibility of police in neighborhoodsEfforts to prevent fires/provide safety education
Visibility of police inretail shopping areas
2014 City of Des Peres Community Survey: Final Report
ETC Institute (2014) Page 31
!
!
!! !
!
!
!
!!!
Sa
tis
f ac
tio
n R
ati
ng
me
an
sa
tis
fac
tio
n
Opportunities for Improvement
mean importance
Importance RatingLower Importance Higher Importance
lower importance/higher satisfaction higher importance/higher satisfaction
lower importance/lower satisfaction higher importance/lower satisfaction
Exceeded Expectations
Less Important
Continued Emphasis
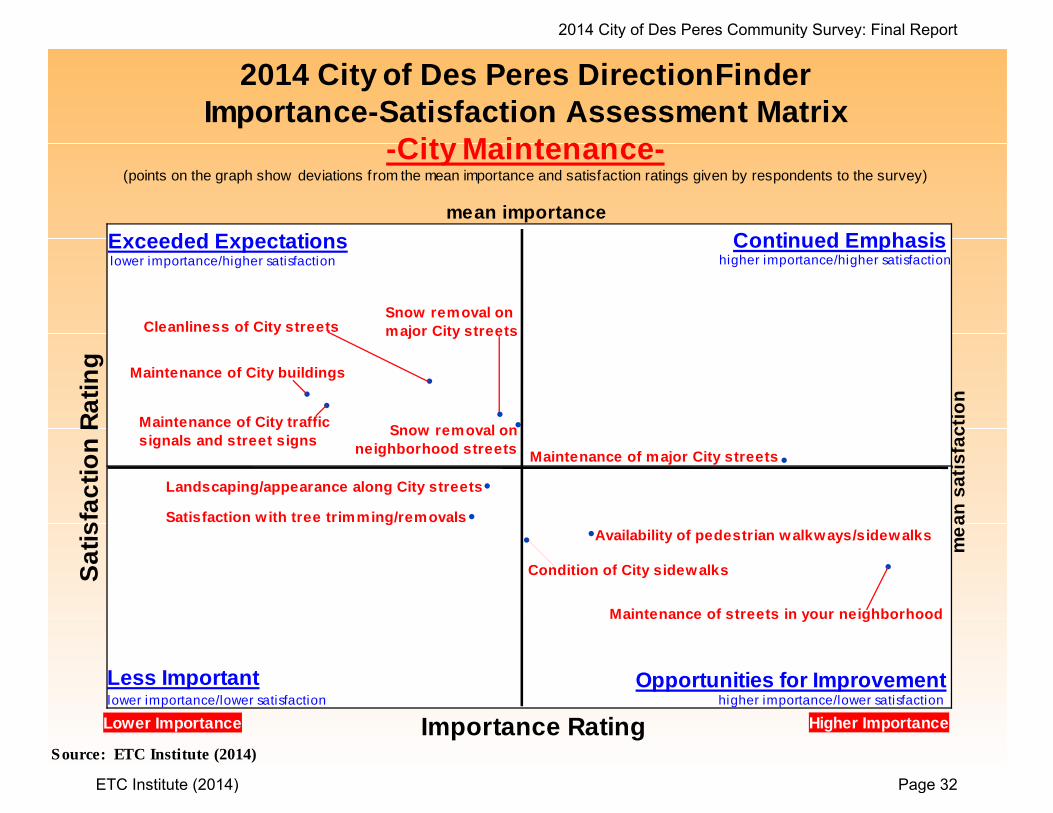
2014 City of Des Peres DirectionFinder Importance-Satisfaction Assessment Matrix
-City Maintenance-(points on the graph show deviations from the mean importance and satisfaction ratings given by respondents to the survey)
Source: ETC Institute (2014)
Cleanliness of City streets
Maintenance of City buildings
Maintenance of City traffic signals and street signs
Snow removal on major City streets
Snow removal on neighborhood streets Maintenance of major City streets
Landscaping/appearance along City streets
Satisfaction with tree trimming/removalsAvailability of pedestrian walkways/sidewalks
Condition of City sidewalks
Maintenance of streets in your neighborhood
2014 City of Des Peres Community Survey: Final Report
ETC Institute (2014) Page 32
Sa
tis
f ac
tio
n R
ati
ng
!
!
!!!
!! !!
!!
me
an
sa
tis
fac
tio
n
Opportunities for Improvement
mean importance
Importance RatingLower Importance Higher Importance
lower importance/higher satisfaction higher importance/higher satisfaction
lower importance/lower satisfaction higher importance/lower satisfaction
Exceeded Expectations
Less Important
Continued Emphasis
2014 City of Des Peres DirectionFinder Importance-Satisfaction Assessment Matrix
-Parks and Recreation-(points on the graph show deviations from the mean importance and satisfaction ratings given by respondents to the survey)
Source: ETC Institute (2014)
Maintenance of City parks
Number of parks
The Lodge Des Peres
Availability of info about parks & rec programs
Special events and festivals
City recreation opportunitiesQuality of playgroundsNumber of playgrounds
Quality of outdoor athletic fields
Number of outdoor athletic fieldsNumber of walking/biking trails
2014 City of Des Peres Community Survey: Final Report
ETC Institute (2014) Page 33
!
!
!!
!
! !! !
!!
!Sa
tis
f ac
tio
n R
ati
ng
me
an
sa
tis
fac
tio
n
Opportunities for Improvement
mean importance
Importance RatingLower Importance Higher Importance
lower importance/higher satisfaction higher importance/higher satisfaction
lower importance/lower satisfaction higher importance/lower satisfaction
Exceeded Expectations
Less Important
Continued Emphasis
2014 City of Des Peres DirectionFinder Importance-Satisfaction Assessment Matrix
-The Lodge Des Peres-(points on the graph show deviations from the mean importance and satisfaction ratings given by respondents to the survey)
Source: ETC Institute (2014)
The Lodge Des Peres facility as a whole
Cleanliness of The Lodge
Information on programs & classes
Customer service provided
Indoor aquatic facilities Fitness centerQuality of meeting space Availability of mtg. space
Outdoor aquatic facilitiesQuality of adult programs
Quality of youth programs
Value/fee structure of programs/classes
2014 City of Des Peres Community Survey: Final Report
ETC Institute (2014) Page 34
Section 3: Benchmarking Analysis
2014 City of Des Peres Community Survey: Final Report
ETC Institute (2014) Page 35
Ben
chmarkin
g Analysis
DirectionFinder® Survey Year 2014 Benchmarking Summary Report
Overview ETC Institute's DirectionFinder® program was originally developed in 1999 to help community leaders in Kansas and Missouri use statistically valid community survey data as a tool for making better decisions. Since November 1999, the survey has been administered in more than 210 cities and counties in 43 states. This report contains benchmarking data from three sources: (1) a national survey that was administered by ETC Institute during the Summer of 2012 to a random sample of 3,926 residents in the continental United States, (2) a regional survey that was administered by ETC Institute in the Summer of 2012 to a random sample of 456 residents in Kansas and Missouri communities, and (3) surveys that have been administered by ETC Institute in 30 communities in Kansas and Missouri between January 2009 and April 2014. Some of the Kansas and Missouri communities represented in this report include:
• Ballwin, Missouri • Blue Springs, Missouri • Bonner Springs, Kansas • Butler, Missouri • Columbia, Missouri • Excelsior Springs, Missouri • Gardner, Kansas • Grandview, Missouri • Harrisonville, Missouri • Independence, Missouri • Johnson County, Kansas • Kansas City, Missouri • Lawrence, Kansas • Leawood, Kansas • Lee’s Summit, Missouri
• Lenexa, Kansas • Liberty, Missouri • Merriam, Kansas • Mission, Kansas • O’Fallon, Missouri • Olathe, Kansas • Overland Park, Kansas • Platte City, Missouri • Pleasant Hill, Missouri • Raymore, Missouri • Riverside, Missouri • Roeland Park, Kansas • Shawnee, Kansas • Spring Hill, Kansas • Unified Government of Kansas City and Wyandotte County
Interpreting the Charts The charts on the following pages provide comparisons for several items that were rated on the survey. The percentages shown reflect the sum of the positive ratings given by respondents excluding “don’t knows.” The blue bar on the charts shows the results for Des Peres, the red bar shows the results for the Kansas/Missouri regional data, and the tan bar shows the results of the national survey.
2014 City of Des Peres Community Survey: Final Report
ETC Institute (2014) Page 36
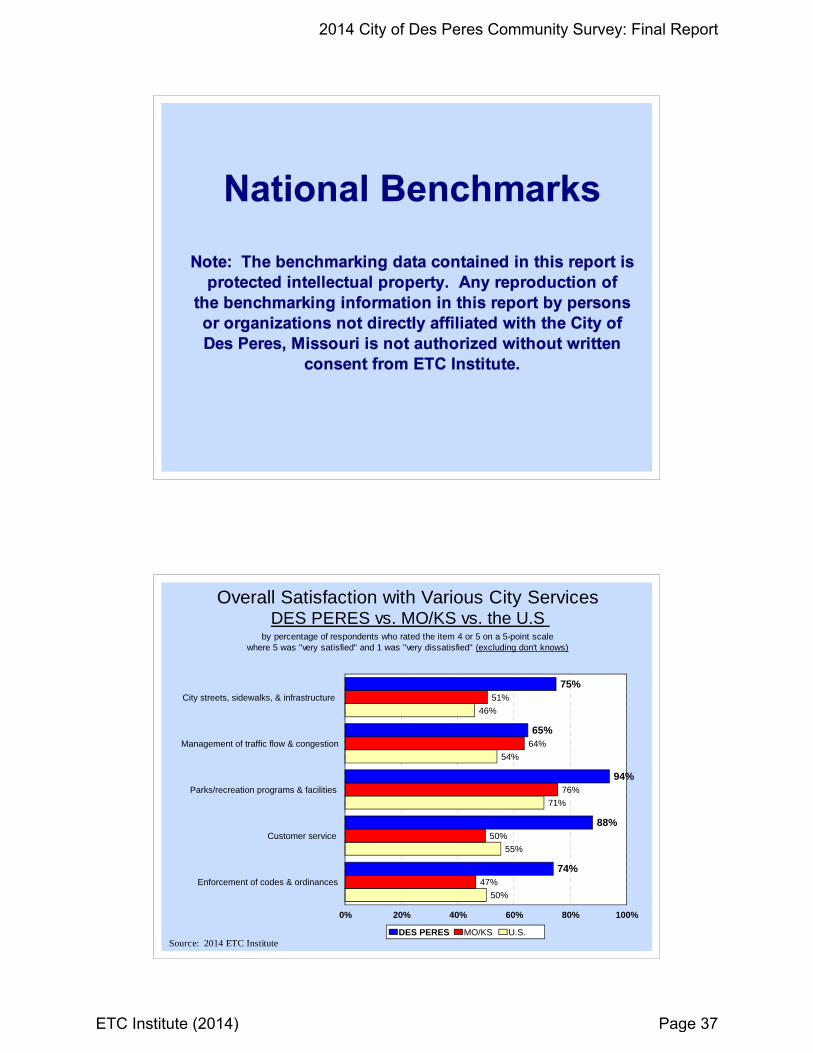
75%
65%
94%
88%
74%
51%
64%
76%
50%
47%
46%
54%
71%
55%
50%
City streets, sidewalks, & infrastructure
Management of traffic flow & congestion
Parks/recreation programs & facilities
Customer service
Enforcement of codes & ordinances
0% 20% 40% 60% 80% 100%
DES PERES MO/KS U.S.
by percentage of respondents who rated the item 4 or 5 on a 5-point scalewhere 5 was "very satisfied" and 1 was "very dissatisfied" (excluding don't knows)
Source: 2014 ETC Institute
Overall Satisfaction with Various City ServicesDES PERES vs. MO/KS vs. the U.S
2014 City of Des Peres Community Survey: Final Report
ETC Institute (2014) Page 37
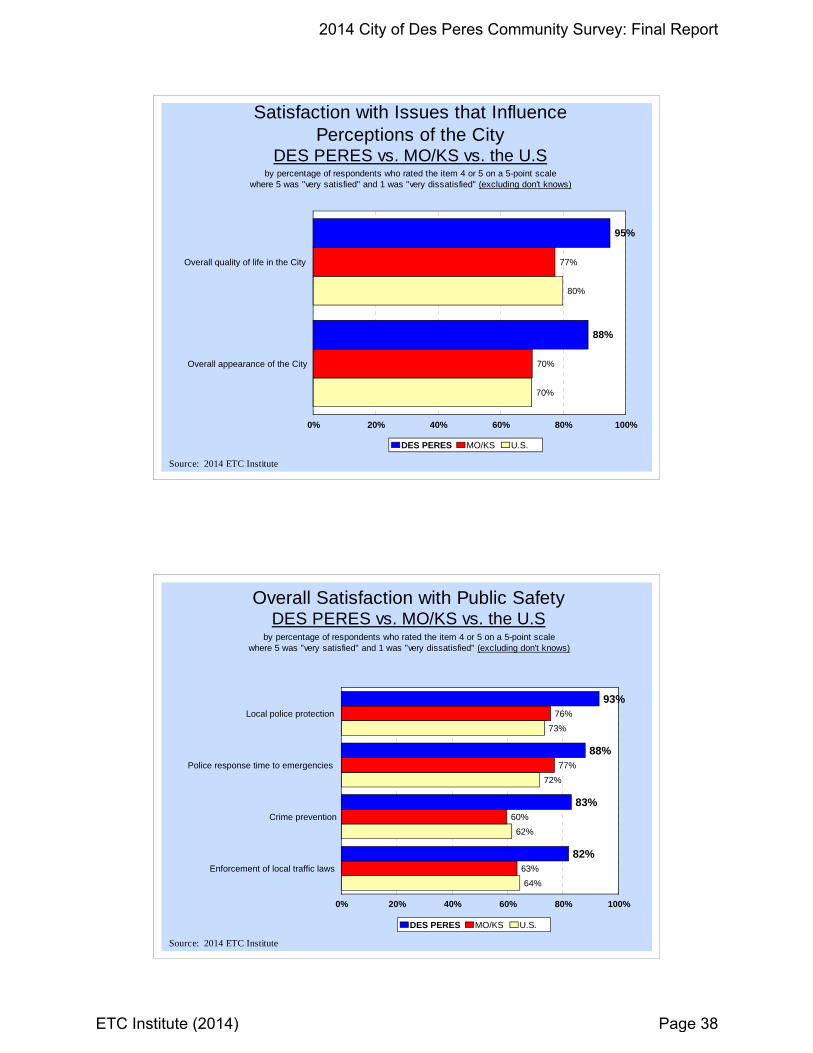
95%
88%
77%
70%
80%
70%
Overall quality of life in the City
Overall appearance of the City
0% 20% 40% 60% 80% 100%
DES PERES MO/KS U.S.
by percentage of respondents who rated the item 4 or 5 on a 5-point scalewhere 5 was "very satisfied" and 1 was "very dissatisfied" (excluding don't knows)
Source: 2014 ETC Institute
Satisfaction with Issues that Influence Perceptions of the City
DES PERES vs. MO/KS vs. the U.S
93%
88%
83%
82%
76%
77%
60%
63%
73%
72%
62%
64%
Local police protection
Police response time to emergencies
Crime prevention
Enforcement of local traffic laws
0% 20% 40% 60% 80% 100%
DES PERES MO/KS U.S.
Overall Satisfaction with Public SafetyDES PERES vs. MO/KS vs. the U.S
by percentage of respondents who rated the item 4 or 5 on a 5-point scalewhere 5 was "very satisfied" and 1 was "very dissatisfied" (excluding don't knows)
Source: 2014 ETC Institute
2014 City of Des Peres Community Survey: Final Report
ETC Institute (2014) Page 38
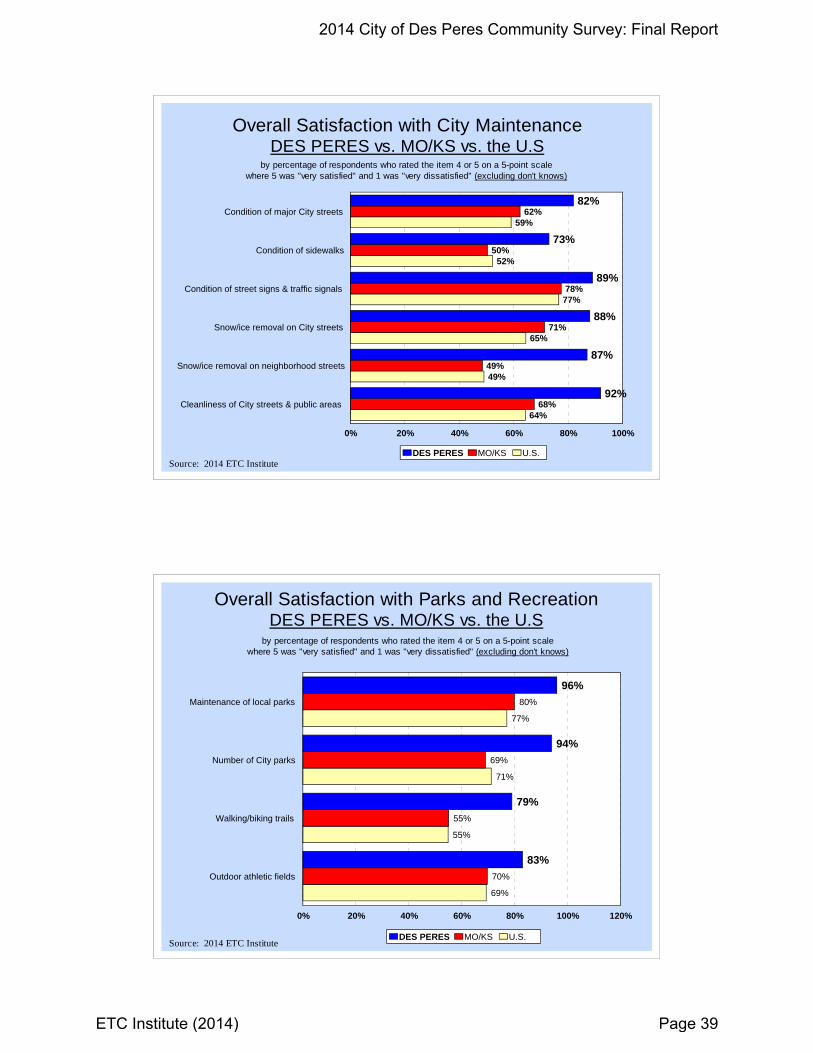
82%
73%
89%
88%
87%
92%
62%
50%
78%
71%
49%
68%
59%
52%
77%
65%
49%
64%
Condition of major City streets
Condition of sidewalks
Condition of street signs & traffic signals
Snow/ice removal on City streets
Snow/ice removal on neighborhood streets
Cleanliness of City streets & public areas
0% 20% 40% 60% 80% 100%
DES PERES MO/KS U.S.
Overall Satisfaction with City MaintenanceDES PERES vs. MO/KS vs. the U.S
by percentage of respondents who rated the item 4 or 5 on a 5-point scalewhere 5 was "very satisfied" and 1 was "very dissatisfied" (excluding don't knows)
Source: 2014 ETC Institute
96%
94%
79%
83%
80%
69%
55%
70%
77%
71%
55%
69%
Maintenance of local parks
Number of City parks
Walking/biking trails
Outdoor athletic fields
0% 20% 40% 60% 80% 100% 120%
DES PERES MO/KS U.S.
Overall Satisfaction with Parks and RecreationDES PERES vs. MO/KS vs. the U.S
by percentage of respondents who rated the item 4 or 5 on a 5-point scalewhere 5 was "very satisfied" and 1 was "very dissatisfied" (excluding don't knows)
Source: 2014 ETC Institute
2014 City of Des Peres Community Survey: Final Report
ETC Institute (2014) Page 39
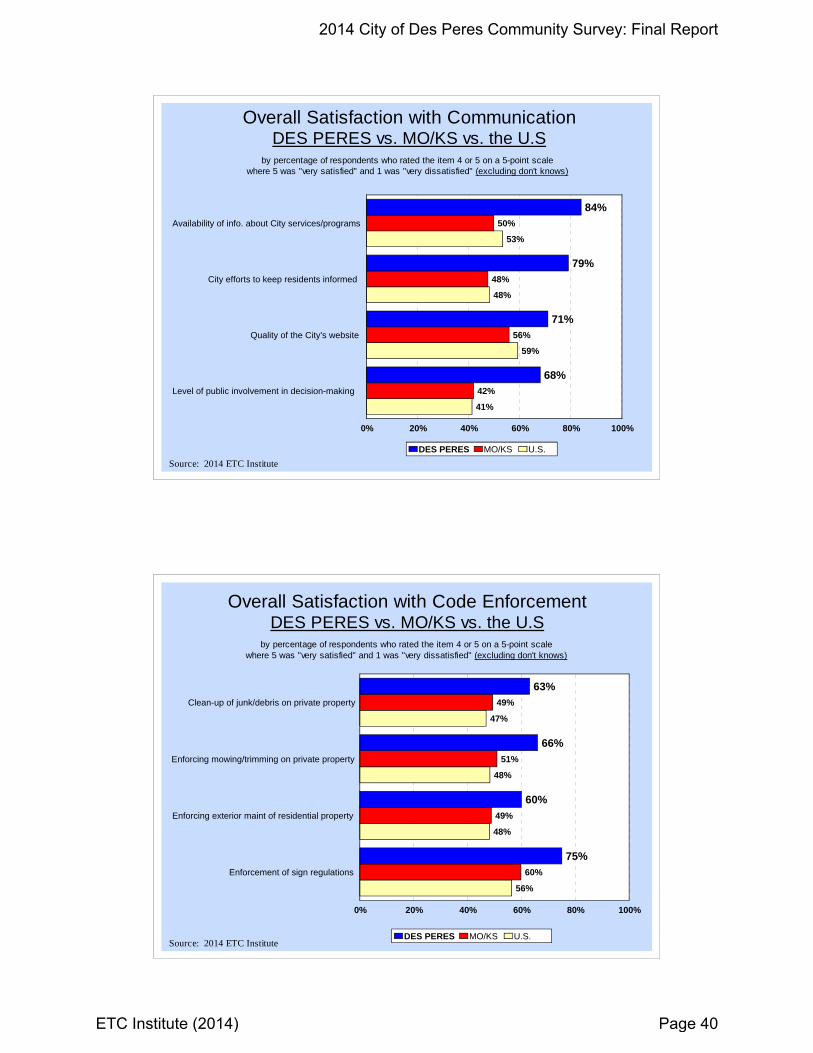
84%
79%
71%
68%
50%
48%
56%
42%
53%
48%
59%
41%
Availability of info. about City services/programs
City efforts to keep residents informed
Quality of the City's website
Level of public involvement in decision-making
0% 20% 40% 60% 80% 100%
DES PERES MO/KS U.S.
Overall Satisfaction with CommunicationDES PERES vs. MO/KS vs. the U.S
by percentage of respondents who rated the item 4 or 5 on a 5-point scalewhere 5 was "very satisfied" and 1 was "very dissatisfied" (excluding don't knows)
Source: 2014 ETC Institute
63%
66%
60%
75%
49%
51%
49%
60%
47%
48%
48%
56%
Clean-up of junk/debris on private property
Enforcing mowing/trimming on private property
Enforcing exterior maint of residential property
Enforcement of sign regulations
0% 20% 40% 60% 80% 100%
DES PERES MO/KS U.S.
Overall Satisfaction with Code EnforcementDES PERES vs. MO/KS vs. the U.S
by percentage of respondents who rated the item 4 or 5 on a 5-point scalewhere 5 was "very satisfied" and 1 was "very dissatisfied" (excluding don't knows)
Source: 2014 ETC Institute
2014 City of Des Peres Community Survey: Final Report
ETC Institute (2014) Page 40
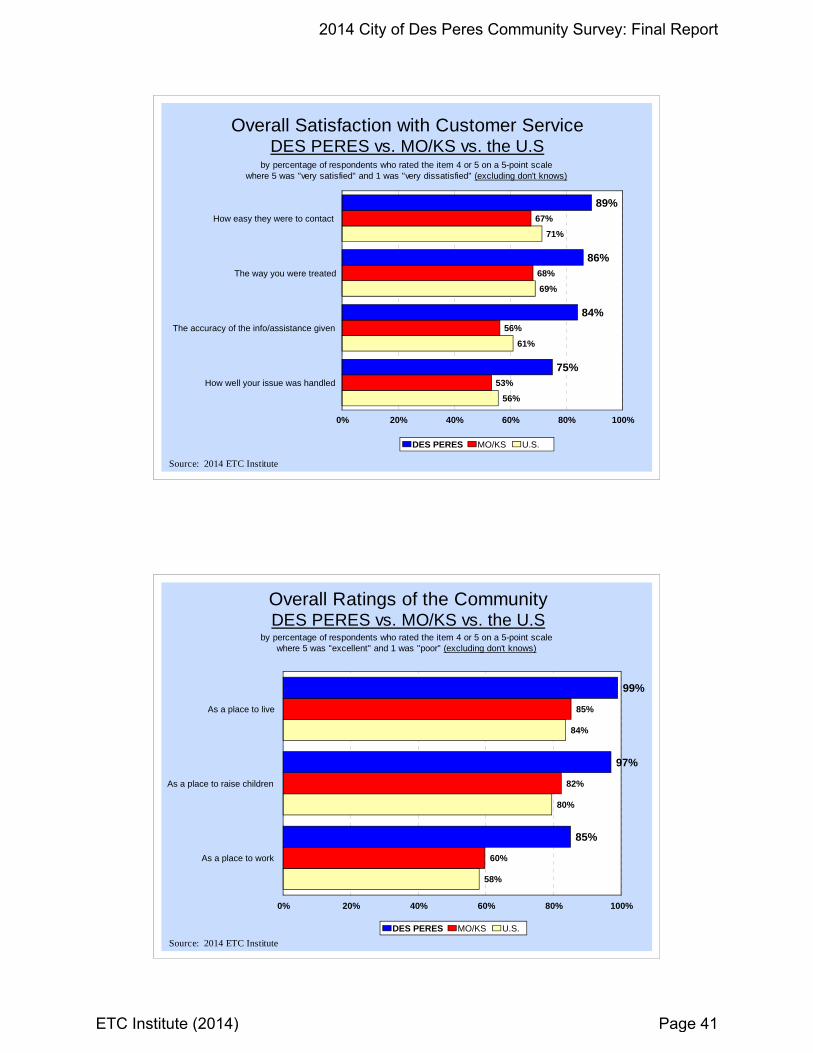
89%
86%
84%
75%
67%
68%
56%
53%
71%
69%
61%
56%
How easy they were to contact
The way you were treated
The accuracy of the info/assistance given
How well your issue was handled
0% 20% 40% 60% 80% 100%
DES PERES MO/KS U.S.
Overall Satisfaction with Customer ServiceDES PERES vs. MO/KS vs. the U.S
by percentage of respondents who rated the item 4 or 5 on a 5-point scalewhere 5 was "very satisfied" and 1 was "very dissatisfied" (excluding don't knows)
Source: 2014 ETC Institute
99%
97%
85%
85%
82%
60%
84%
80%
58%
As a place to live
As a place to raise children
As a place to work
0% 20% 40% 60% 80% 100%
DES PERES MO/KS U.S.
Overall Ratings of the CommunityDES PERES vs. MO/KS vs. the U.S
by percentage of respondents who rated the item 4 or 5 on a 5-point scalewhere 5 was "excellent" and 1 was "poor" (excluding don't knows)
Source: 2014 ETC Institute
2014 City of Des Peres Community Survey: Final Report
ETC Institute (2014) Page 41
Section 4:
Tabular Data
2014 City of Des Peres Community Survey: Final Report
ETC Institute (2014) Page 42
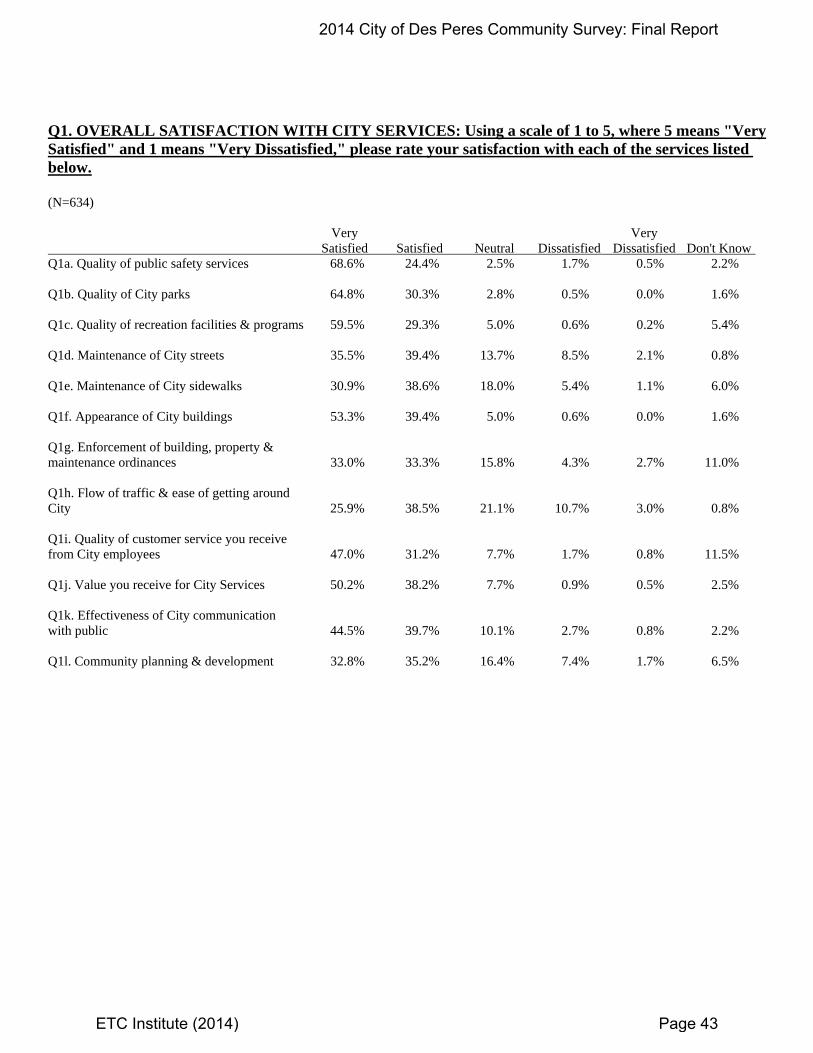
Q1. OVERALL SATISFACTION WITH CITY SERVICES: Using a scale of 1 to 5, where 5 means "Very Satisfied" and 1 means "Very Dissatisfied," please rate your satisfaction with each of the services listed below. (N=634) Very Very Satisfied Satisfied Neutral Dissatisfied Dissatisfied Don't Know Q1a. Quality of public safety services 68.6% 24.4% 2.5% 1.7% 0.5% 2.2% Q1b. Quality of City parks 64.8% 30.3% 2.8% 0.5% 0.0% 1.6% Q1c. Quality of recreation facilities & programs 59.5% 29.3% 5.0% 0.6% 0.2% 5.4% Q1d. Maintenance of City streets 35.5% 39.4% 13.7% 8.5% 2.1% 0.8% Q1e. Maintenance of City sidewalks 30.9% 38.6% 18.0% 5.4% 1.1% 6.0% Q1f. Appearance of City buildings 53.3% 39.4% 5.0% 0.6% 0.0% 1.6% Q1g. Enforcement of building, property & maintenance ordinances 33.0% 33.3% 15.8% 4.3% 2.7% 11.0% Q1h. Flow of traffic & ease of getting around City 25.9% 38.5% 21.1% 10.7% 3.0% 0.8% Q1i. Quality of customer service you receive from City employees 47.0% 31.2% 7.7% 1.7% 0.8% 11.5% Q1j. Value you receive for City Services 50.2% 38.2% 7.7% 0.9% 0.5% 2.5% Q1k. Effectiveness of City communication with public 44.5% 39.7% 10.1% 2.7% 0.8% 2.2% Q1l. Community planning & development 32.8% 35.2% 16.4% 7.4% 1.7% 6.5%
2014 City of Des Peres Community Survey: Final Report
ETC Institute (2014) Page 43
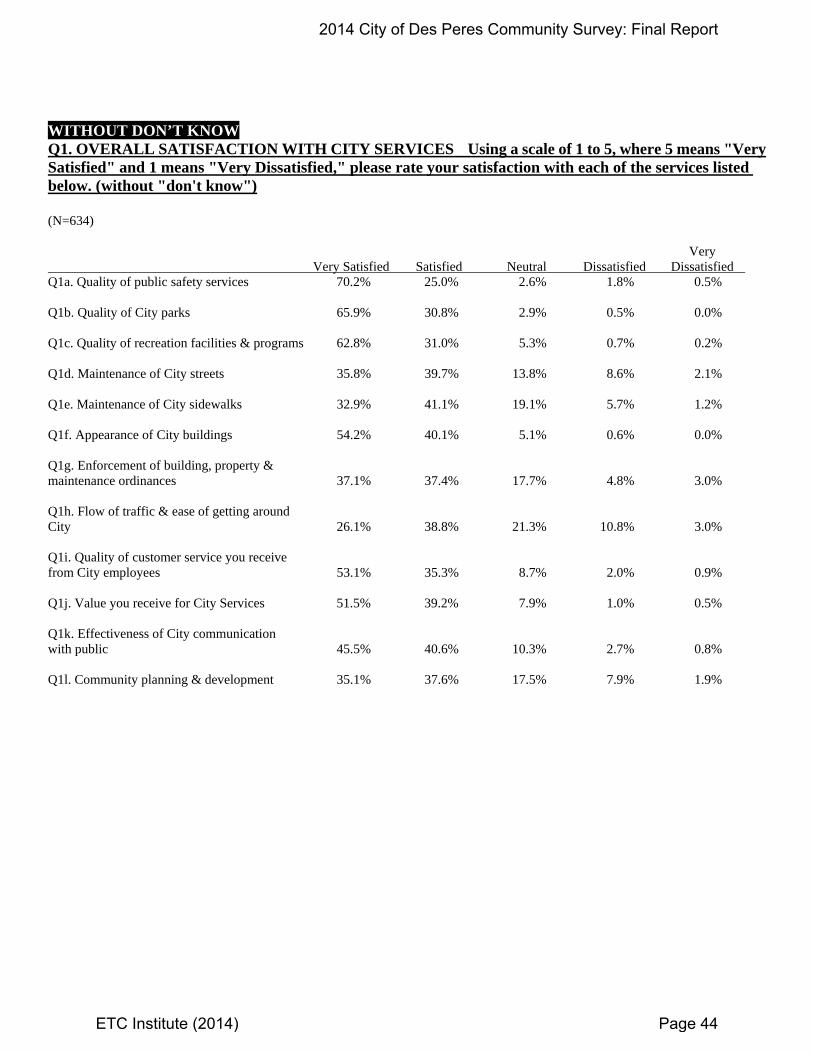
WITHOUT DON’T KNOW Q1. OVERALL SATISFACTION WITH CITY SERVICES Using a scale of 1 to 5, where 5 means "Very Satisfied" and 1 means "Very Dissatisfied," please rate your satisfaction with each of the services listed below. (without "don't know") (N=634) Very Very Satisfied Satisfied Neutral Dissatisfied Dissatisfied Q1a. Quality of public safety services 70.2% 25.0% 2.6% 1.8% 0.5% Q1b. Quality of City parks 65.9% 30.8% 2.9% 0.5% 0.0% Q1c. Quality of recreation facilities & programs 62.8% 31.0% 5.3% 0.7% 0.2% Q1d. Maintenance of City streets 35.8% 39.7% 13.8% 8.6% 2.1% Q1e. Maintenance of City sidewalks 32.9% 41.1% 19.1% 5.7% 1.2% Q1f. Appearance of City buildings 54.2% 40.1% 5.1% 0.6% 0.0% Q1g. Enforcement of building, property & maintenance ordinances 37.1% 37.4% 17.7% 4.8% 3.0% Q1h. Flow of traffic & ease of getting around City 26.1% 38.8% 21.3% 10.8% 3.0% Q1i. Quality of customer service you receive from City employees 53.1% 35.3% 8.7% 2.0% 0.9% Q1j. Value you receive for City Services 51.5% 39.2% 7.9% 1.0% 0.5% Q1k. Effectiveness of City communication with public 45.5% 40.6% 10.3% 2.7% 0.8% Q1l. Community planning & development 35.1% 37.6% 17.5% 7.9% 1.9%
2014 City of Des Peres Community Survey: Final Report
ETC Institute (2014) Page 44
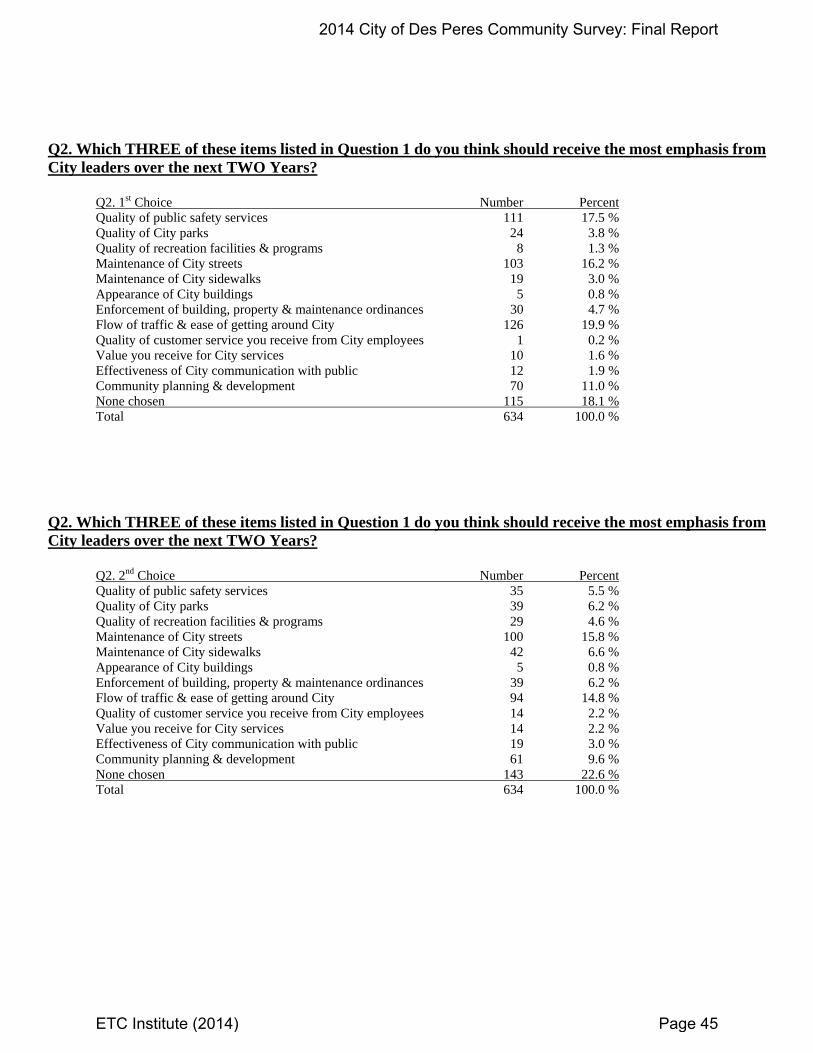
Q2. Which THREE of these items listed in Question 1 do you think should receive the most emphasis from City leaders over the next TWO Years? Q2. 1st Choice Number Percent Quality of public safety services 111 17.5 % Quality of City parks 24 3.8 % Quality of recreation facilities & programs 8 1.3 % Maintenance of City streets 103 16.2 % Maintenance of City sidewalks 19 3.0 % Appearance of City buildings 5 0.8 % Enforcement of building, property & maintenance ordinances 30 4.7 % Flow of traffic & ease of getting around City 126 19.9 % Quality of customer service you receive from City employees 1 0.2 % Value you receive for City services 10 1.6 % Effectiveness of City communication with public 12 1.9 % Community planning & development 70 11.0 % None chosen 115 18.1 % Total 634 100.0 % Q2. Which THREE of these items listed in Question 1 do you think should receive the most emphasis from City leaders over the next TWO Years? Q2. 2nd Choice Number Percent Quality of public safety services 35 5.5 % Quality of City parks 39 6.2 % Quality of recreation facilities & programs 29 4.6 % Maintenance of City streets 100 15.8 % Maintenance of City sidewalks 42 6.6 % Appearance of City buildings 5 0.8 % Enforcement of building, property & maintenance ordinances 39 6.2 % Flow of traffic & ease of getting around City 94 14.8 % Quality of customer service you receive from City employees 14 2.2 % Value you receive for City services 14 2.2 % Effectiveness of City communication with public 19 3.0 % Community planning & development 61 9.6 % None chosen 143 22.6 % Total 634 100.0 %
2014 City of Des Peres Community Survey: Final Report
ETC Institute (2014) Page 45
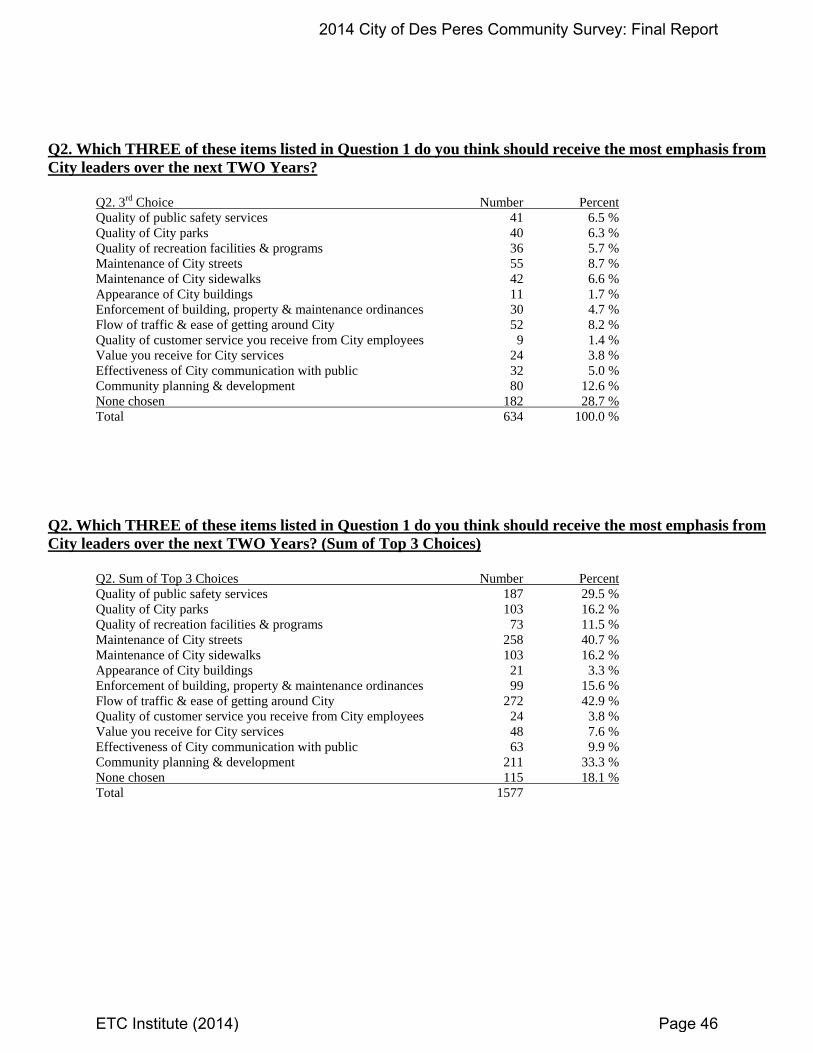
Q2. Which THREE of these items listed in Question 1 do you think should receive the most emphasis from City leaders over the next TWO Years? Q2. 3rd Choice Number Percent Quality of public safety services 41 6.5 % Quality of City parks 40 6.3 % Quality of recreation facilities & programs 36 5.7 % Maintenance of City streets 55 8.7 % Maintenance of City sidewalks 42 6.6 % Appearance of City buildings 11 1.7 % Enforcement of building, property & maintenance ordinances 30 4.7 % Flow of traffic & ease of getting around City 52 8.2 % Quality of customer service you receive from City employees 9 1.4 % Value you receive for City services 24 3.8 % Effectiveness of City communication with public 32 5.0 % Community planning & development 80 12.6 % None chosen 182 28.7 % Total 634 100.0 %
Q2. Which THREE of these items listed in Question 1 do you think should receive the most emphasis from City leaders over the next TWO Years? (Sum of Top 3 Choices) Q2. Sum of Top 3 Choices Number Percent Quality of public safety services 187 29.5 % Quality of City parks 103 16.2 % Quality of recreation facilities & programs 73 11.5 % Maintenance of City streets 258 40.7 % Maintenance of City sidewalks 103 16.2 % Appearance of City buildings 21 3.3 % Enforcement of building, property & maintenance ordinances 99 15.6 % Flow of traffic & ease of getting around City 272 42.9 % Quality of customer service you receive from City employees 24 3.8 % Value you receive for City services 48 7.6 % Effectiveness of City communication with public 63 9.9 % Community planning & development 211 33.3 % None chosen 115 18.1 % Total 1577
2014 City of Des Peres Community Survey: Final Report
ETC Institute (2014) Page 46
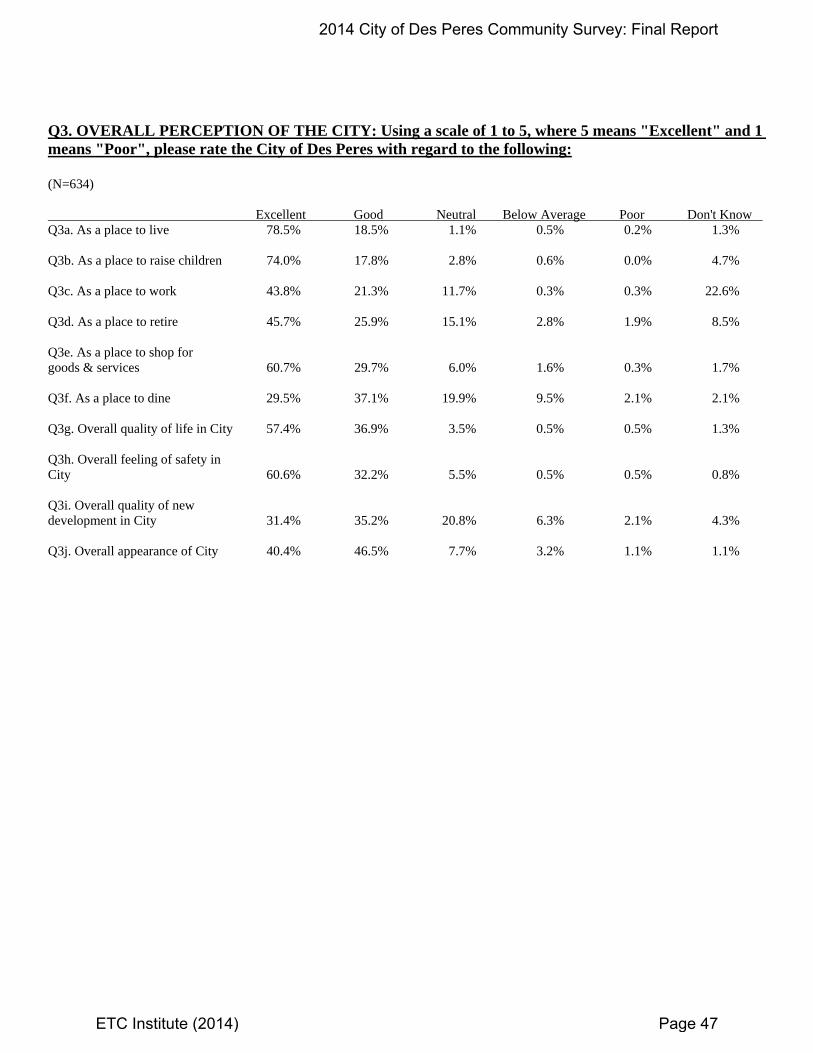
Q3. OVERALL PERCEPTION OF THE CITY: Using a scale of 1 to 5, where 5 means "Excellent" and 1 means "Poor", please rate the City of Des Peres with regard to the following: (N=634) Excellent Good Neutral Below Average Poor Don't Know Q3a. As a place to live 78.5% 18.5% 1.1% 0.5% 0.2% 1.3% Q3b. As a place to raise children 74.0% 17.8% 2.8% 0.6% 0.0% 4.7% Q3c. As a place to work 43.8% 21.3% 11.7% 0.3% 0.3% 22.6% Q3d. As a place to retire 45.7% 25.9% 15.1% 2.8% 1.9% 8.5% Q3e. As a place to shop for goods & services 60.7% 29.7% 6.0% 1.6% 0.3% 1.7% Q3f. As a place to dine 29.5% 37.1% 19.9% 9.5% 2.1% 2.1% Q3g. Overall quality of life in City 57.4% 36.9% 3.5% 0.5% 0.5% 1.3% Q3h. Overall feeling of safety in City 60.6% 32.2% 5.5% 0.5% 0.5% 0.8% Q3i. Overall quality of new development in City 31.4% 35.2% 20.8% 6.3% 2.1% 4.3% Q3j. Overall appearance of City 40.4% 46.5% 7.7% 3.2% 1.1% 1.1%
2014 City of Des Peres Community Survey: Final Report
ETC Institute (2014) Page 47
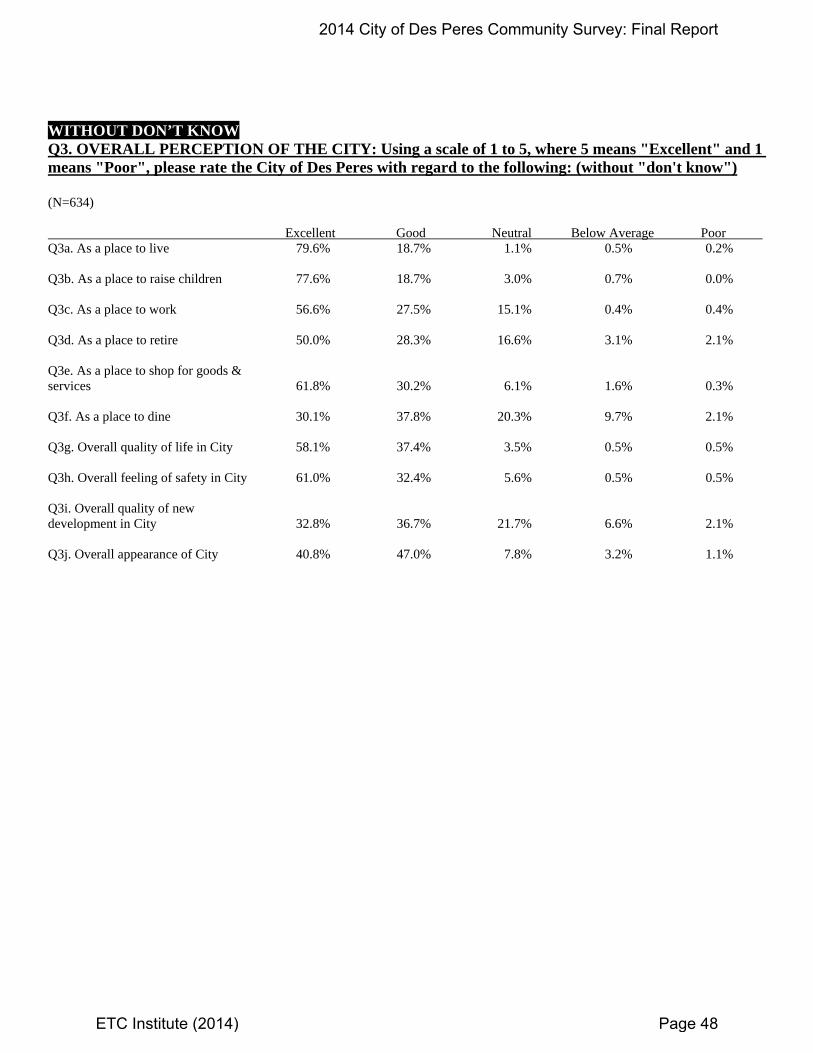
WITHOUT DON’T KNOW Q3. OVERALL PERCEPTION OF THE CITY: Using a scale of 1 to 5, where 5 means "Excellent" and 1 means "Poor", please rate the City of Des Peres with regard to the following: (without "don't know") (N=634) Excellent Good Neutral Below Average Poor Q3a. As a place to live 79.6% 18.7% 1.1% 0.5% 0.2% Q3b. As a place to raise children 77.6% 18.7% 3.0% 0.7% 0.0% Q3c. As a place to work 56.6% 27.5% 15.1% 0.4% 0.4% Q3d. As a place to retire 50.0% 28.3% 16.6% 3.1% 2.1% Q3e. As a place to shop for goods & services 61.8% 30.2% 6.1% 1.6% 0.3% Q3f. As a place to dine 30.1% 37.8% 20.3% 9.7% 2.1% Q3g. Overall quality of life in City 58.1% 37.4% 3.5% 0.5% 0.5% Q3h. Overall feeling of safety in City 61.0% 32.4% 5.6% 0.5% 0.5% Q3i. Overall quality of new development in City 32.8% 36.7% 21.7% 6.6% 2.1% Q3j. Overall appearance of City 40.8% 47.0% 7.8% 3.2% 1.1%
2014 City of Des Peres Community Survey: Final Report
ETC Institute (2014) Page 48
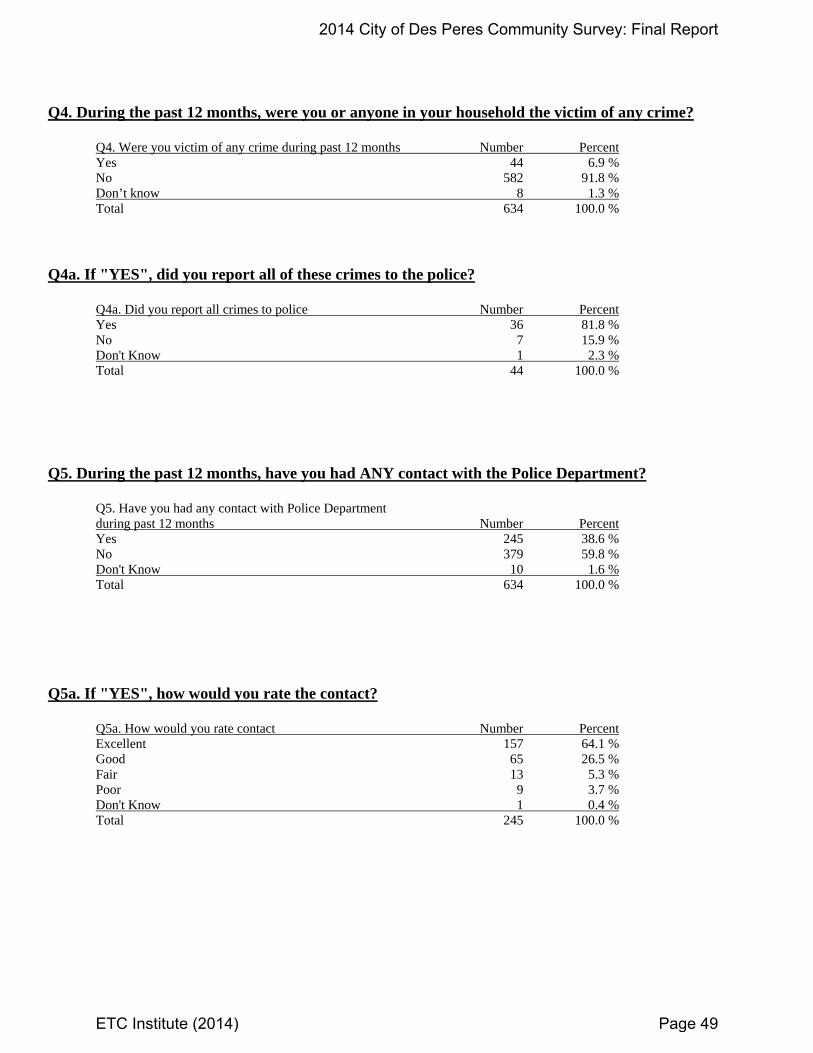
Q4. During the past 12 months, were you or anyone in your household the victim of any crime? Q4. Were you victim of any crime during past 12 months Number Percent Yes 44 6.9 % No 582 91.8 % Don’t know 8 1.3 % Total 634 100.0 % Q4a. If "YES", did you report all of these crimes to the police? Q4a. Did you report all crimes to police Number Percent Yes 36 81.8 % No 7 15.9 % Don't Know 1 2.3 % Total 44 100.0 %
Q5. During the past 12 months, have you had ANY contact with the Police Department? Q5. Have you had any contact with Police Department during past 12 months Number Percent Yes 245 38.6 % No 379 59.8 % Don't Know 10 1.6 % Total 634 100.0 %
Q5a. If "YES", how would you rate the contact? Q5a. How would you rate contact Number Percent Excellent 157 64.1 % Good 65 26.5 % Fair 13 5.3 % Poor 9 3.7 % Don't Know 1 0.4 % Total 245 100.0 %
2014 City of Des Peres Community Survey: Final Report
ETC Institute (2014) Page 49
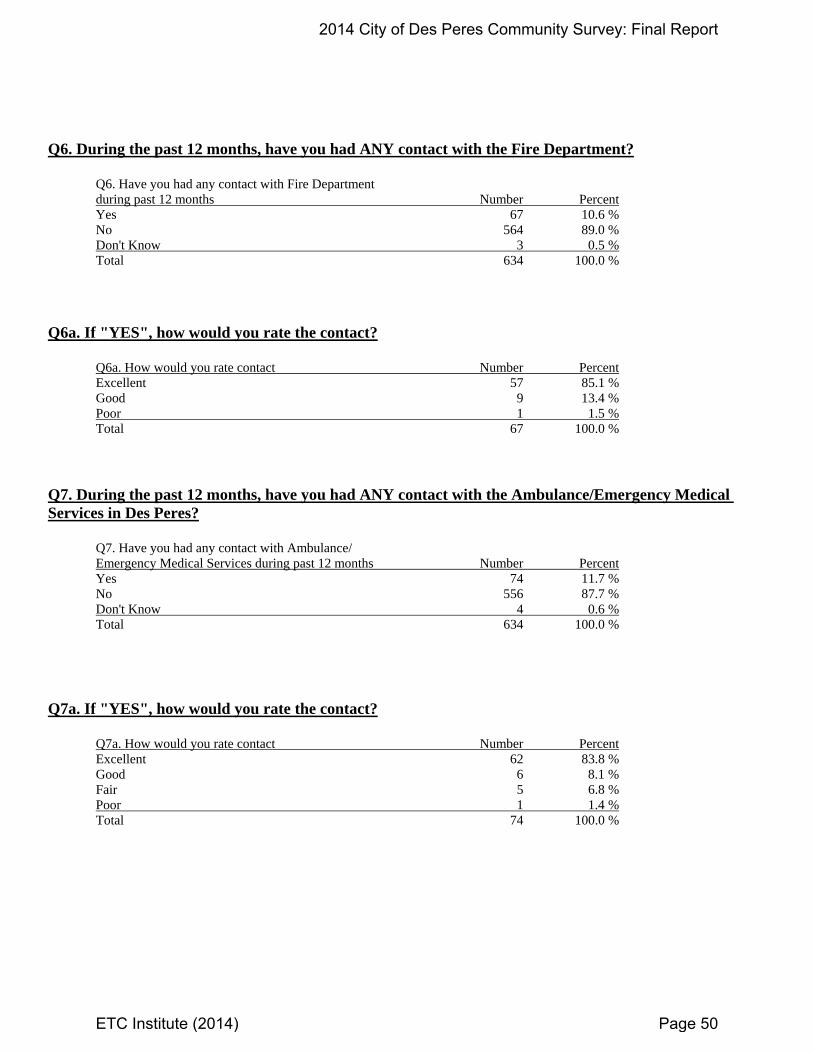
Q6. During the past 12 months, have you had ANY contact with the Fire Department? Q6. Have you had any contact with Fire Department during past 12 months Number Percent Yes 67 10.6 % No 564 89.0 % Don't Know 3 0.5 % Total 634 100.0 %
Q6a. If "YES", how would you rate the contact? Q6a. How would you rate contact Number Percent Excellent 57 85.1 % Good 9 13.4 % Poor 1 1.5 % Total 67 100.0 % Q7. During the past 12 months, have you had ANY contact with the Ambulance/Emergency Medical Services in Des Peres? Q7. Have you had any contact with Ambulance/ Emergency Medical Services during past 12 months Number Percent Yes 74 11.7 % No 556 87.7 % Don't Know 4 0.6 % Total 634 100.0 % Q7a. If "YES", how would you rate the contact? Q7a. How would you rate contact Number Percent Excellent 62 83.8 % Good 6 8.1 % Fair 5 6.8 % Poor 1 1.4 % Total 74 100.0 %
2014 City of Des Peres Community Survey: Final Report
ETC Institute (2014) Page 50
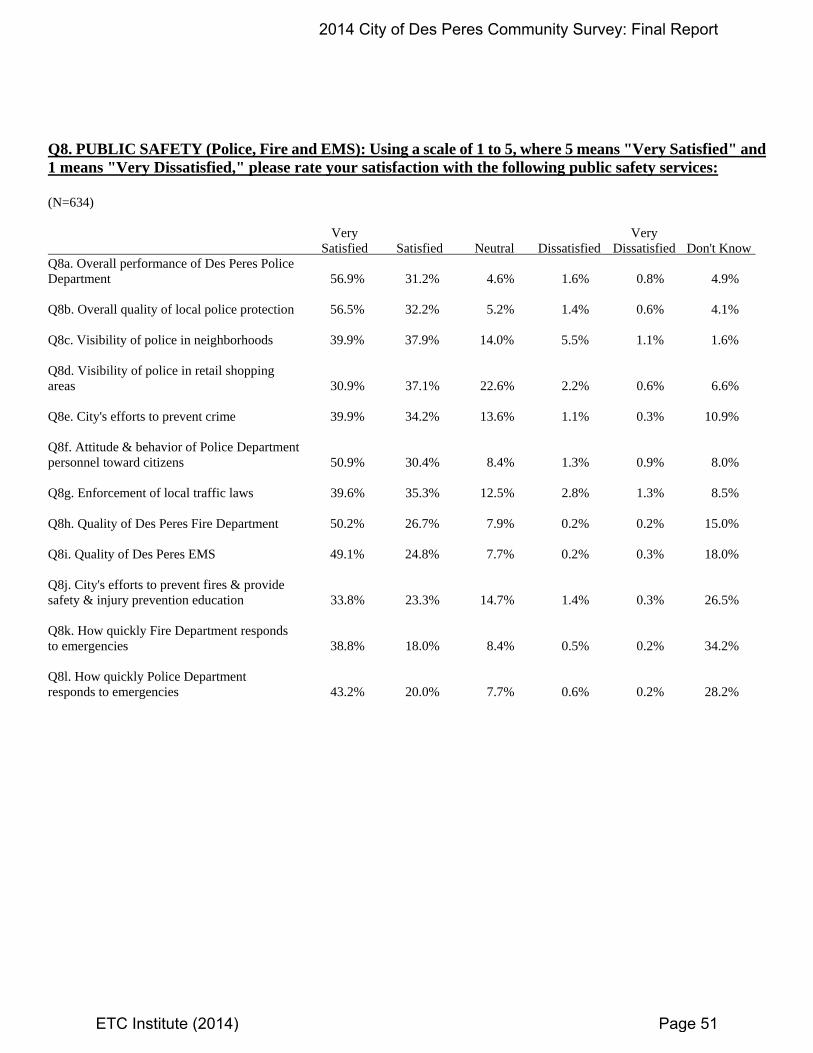
Q8. PUBLIC SAFETY (Police, Fire and EMS): Using a scale of 1 to 5, where 5 means "Very Satisfied" and 1 means "Very Dissatisfied," please rate your satisfaction with the following public safety services: (N=634) Very Very Satisfied Satisfied Neutral Dissatisfied Dissatisfied Don't Know Q8a. Overall performance of Des Peres Police Department 56.9% 31.2% 4.6% 1.6% 0.8% 4.9% Q8b. Overall quality of local police protection 56.5% 32.2% 5.2% 1.4% 0.6% 4.1% Q8c. Visibility of police in neighborhoods 39.9% 37.9% 14.0% 5.5% 1.1% 1.6% Q8d. Visibility of police in retail shopping areas 30.9% 37.1% 22.6% 2.2% 0.6% 6.6% Q8e. City's efforts to prevent crime 39.9% 34.2% 13.6% 1.1% 0.3% 10.9% Q8f. Attitude & behavior of Police Department personnel toward citizens 50.9% 30.4% 8.4% 1.3% 0.9% 8.0% Q8g. Enforcement of local traffic laws 39.6% 35.3% 12.5% 2.8% 1.3% 8.5% Q8h. Quality of Des Peres Fire Department 50.2% 26.7% 7.9% 0.2% 0.2% 15.0% Q8i. Quality of Des Peres EMS 49.1% 24.8% 7.7% 0.2% 0.3% 18.0% Q8j. City's efforts to prevent fires & provide safety & injury prevention education 33.8% 23.3% 14.7% 1.4% 0.3% 26.5% Q8k. How quickly Fire Department responds to emergencies 38.8% 18.0% 8.4% 0.5% 0.2% 34.2% Q8l. How quickly Police Department responds to emergencies 43.2% 20.0% 7.7% 0.6% 0.2% 28.2%
2014 City of Des Peres Community Survey: Final Report
ETC Institute (2014) Page 51
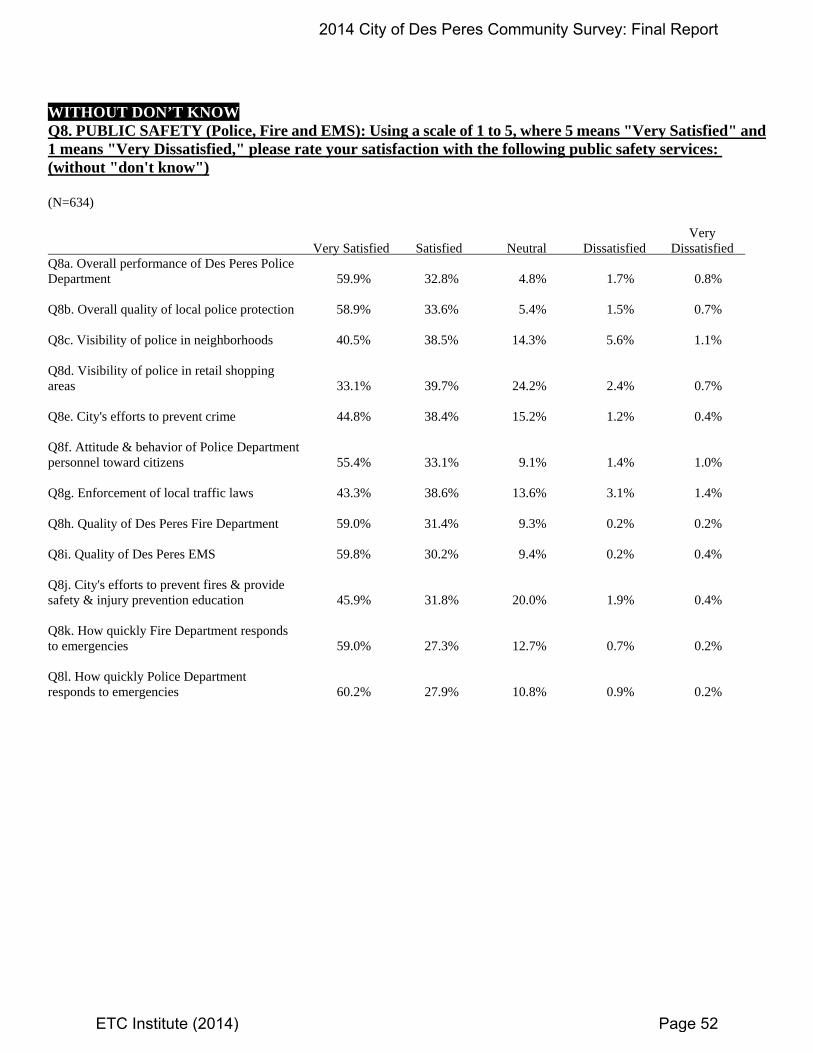
WITHOUT DON’T KNOW Q8. PUBLIC SAFETY (Police, Fire and EMS): Using a scale of 1 to 5, where 5 means "Very Satisfied" and 1 means "Very Dissatisfied," please rate your satisfaction with the following public safety services: (without "don't know") (N=634) Very Very Satisfied Satisfied Neutral Dissatisfied Dissatisfied Q8a. Overall performance of Des Peres Police Department 59.9% 32.8% 4.8% 1.7% 0.8% Q8b. Overall quality of local police protection 58.9% 33.6% 5.4% 1.5% 0.7% Q8c. Visibility of police in neighborhoods 40.5% 38.5% 14.3% 5.6% 1.1% Q8d. Visibility of police in retail shopping areas 33.1% 39.7% 24.2% 2.4% 0.7% Q8e. City's efforts to prevent crime 44.8% 38.4% 15.2% 1.2% 0.4% Q8f. Attitude & behavior of Police Department personnel toward citizens 55.4% 33.1% 9.1% 1.4% 1.0% Q8g. Enforcement of local traffic laws 43.3% 38.6% 13.6% 3.1% 1.4% Q8h. Quality of Des Peres Fire Department 59.0% 31.4% 9.3% 0.2% 0.2% Q8i. Quality of Des Peres EMS 59.8% 30.2% 9.4% 0.2% 0.4% Q8j. City's efforts to prevent fires & provide safety & injury prevention education 45.9% 31.8% 20.0% 1.9% 0.4% Q8k. How quickly Fire Department responds to emergencies 59.0% 27.3% 12.7% 0.7% 0.2% Q8l. How quickly Police Department responds to emergencies 60.2% 27.9% 10.8% 0.9% 0.2%
2014 City of Des Peres Community Survey: Final Report
ETC Institute (2014) Page 52
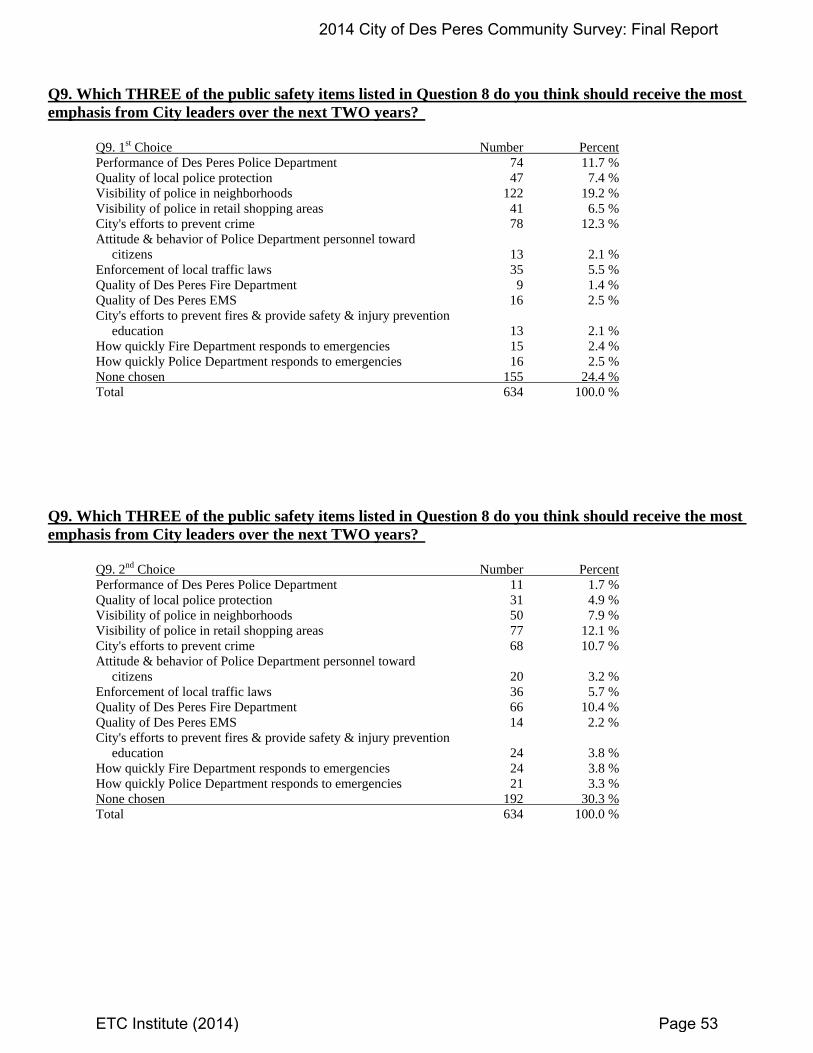
Q9. Which THREE of the public safety items listed in Question 8 do you think should receive the most emphasis from City leaders over the next TWO years? Q9. 1st Choice Number Percent Performance of Des Peres Police Department 74 11.7 % Quality of local police protection 47 7.4 % Visibility of police in neighborhoods 122 19.2 % Visibility of police in retail shopping areas 41 6.5 % City's efforts to prevent crime 78 12.3 % Attitude & behavior of Police Department personnel toward citizens 13 2.1 % Enforcement of local traffic laws 35 5.5 % Quality of Des Peres Fire Department 9 1.4 % Quality of Des Peres EMS 16 2.5 % City's efforts to prevent fires & provide safety & injury prevention education 13 2.1 % How quickly Fire Department responds to emergencies 15 2.4 % How quickly Police Department responds to emergencies 16 2.5 % None chosen 155 24.4 % Total 634 100.0 %
Q9. Which THREE of the public safety items listed in Question 8 do you think should receive the most emphasis from City leaders over the next TWO years? Q9. 2nd Choice Number Percent Performance of Des Peres Police Department 11 1.7 % Quality of local police protection 31 4.9 % Visibility of police in neighborhoods 50 7.9 % Visibility of police in retail shopping areas 77 12.1 % City's efforts to prevent crime 68 10.7 % Attitude & behavior of Police Department personnel toward citizens 20 3.2 % Enforcement of local traffic laws 36 5.7 % Quality of Des Peres Fire Department 66 10.4 % Quality of Des Peres EMS 14 2.2 % City's efforts to prevent fires & provide safety & injury prevention education 24 3.8 % How quickly Fire Department responds to emergencies 24 3.8 % How quickly Police Department responds to emergencies 21 3.3 % None chosen 192 30.3 % Total 634 100.0 %
2014 City of Des Peres Community Survey: Final Report
ETC Institute (2014) Page 53
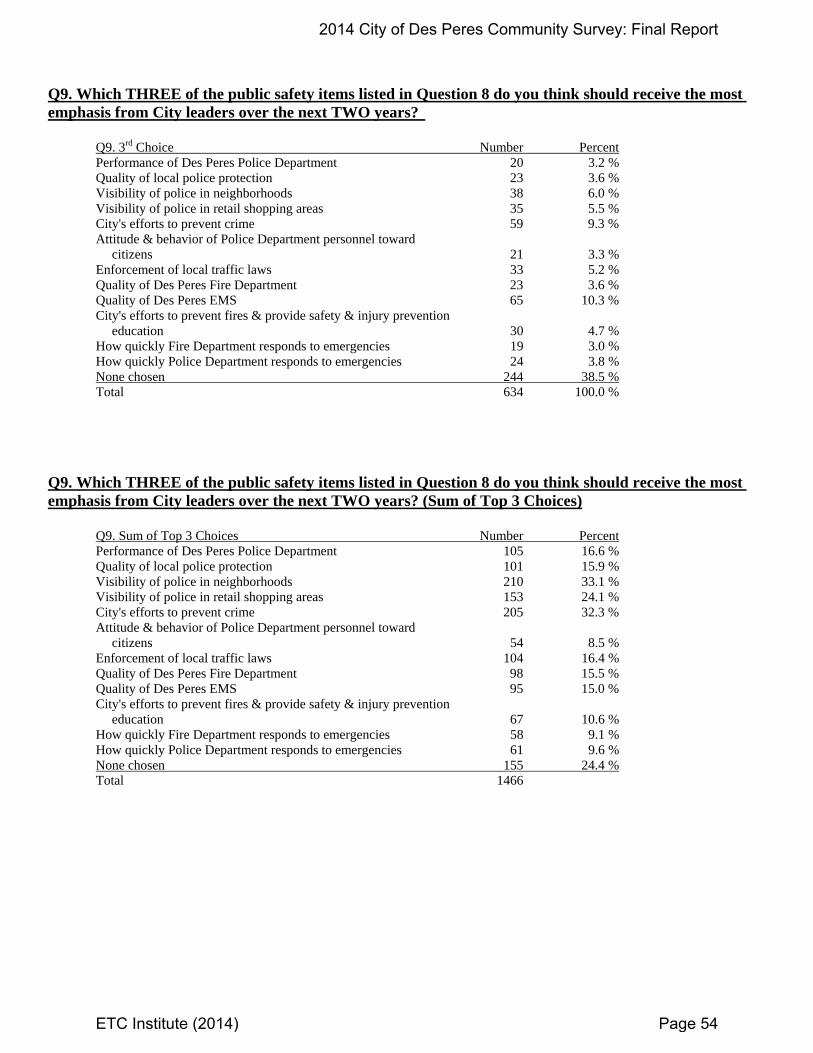
Q9. Which THREE of the public safety items listed in Question 8 do you think should receive the most emphasis from City leaders over the next TWO years? Q9. 3rd Choice Number Percent Performance of Des Peres Police Department 20 3.2 % Quality of local police protection 23 3.6 % Visibility of police in neighborhoods 38 6.0 % Visibility of police in retail shopping areas 35 5.5 % City's efforts to prevent crime 59 9.3 % Attitude & behavior of Police Department personnel toward citizens 21 3.3 % Enforcement of local traffic laws 33 5.2 % Quality of Des Peres Fire Department 23 3.6 % Quality of Des Peres EMS 65 10.3 % City's efforts to prevent fires & provide safety & injury prevention education 30 4.7 % How quickly Fire Department responds to emergencies 19 3.0 % How quickly Police Department responds to emergencies 24 3.8 % None chosen 244 38.5 % Total 634 100.0 %
Q9. Which THREE of the public safety items listed in Question 8 do you think should receive the most emphasis from City leaders over the next TWO years? (Sum of Top 3 Choices) Q9. Sum of Top 3 Choices Number Percent Performance of Des Peres Police Department 105 16.6 % Quality of local police protection 101 15.9 % Visibility of police in neighborhoods 210 33.1 % Visibility of police in retail shopping areas 153 24.1 % City's efforts to prevent crime 205 32.3 % Attitude & behavior of Police Department personnel toward citizens 54 8.5 % Enforcement of local traffic laws 104 16.4 % Quality of Des Peres Fire Department 98 15.5 % Quality of Des Peres EMS 95 15.0 % City's efforts to prevent fires & provide safety & injury prevention education 67 10.6 % How quickly Fire Department responds to emergencies 58 9.1 % How quickly Police Department responds to emergencies 61 9.6 % None chosen 155 24.4 % Total 1466
2014 City of Des Peres Community Survey: Final Report
ETC Institute (2014) Page 54
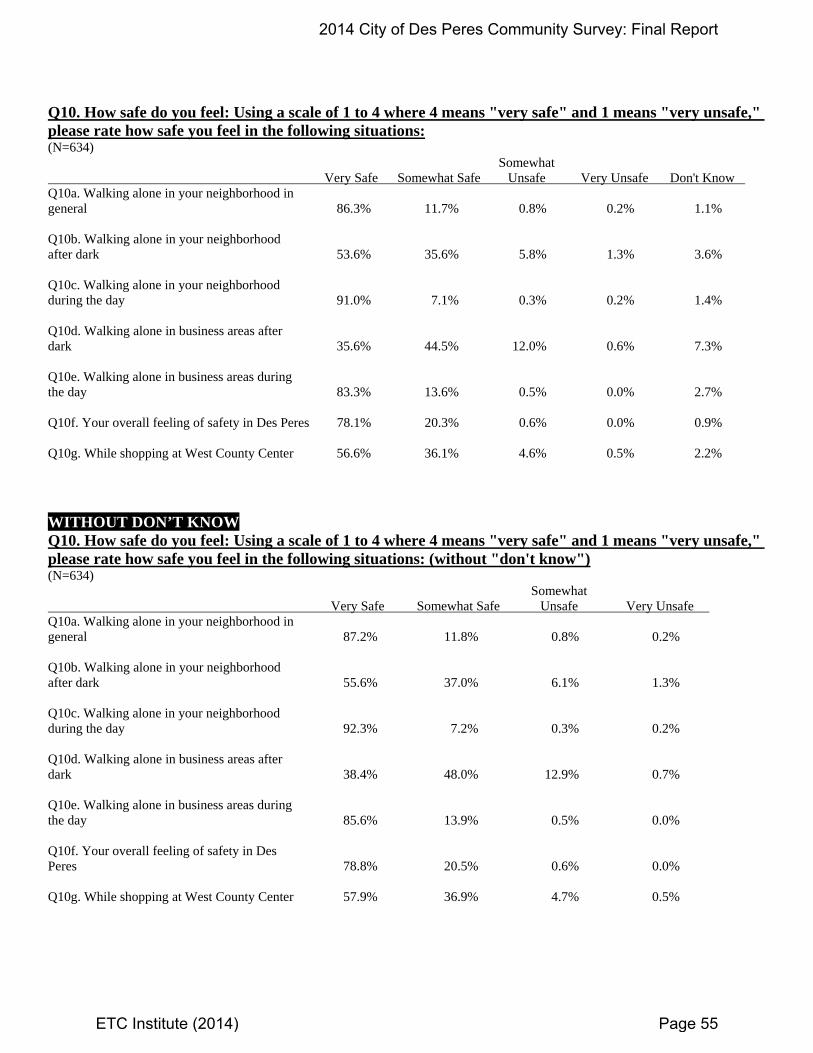
Q10. How safe do you feel: Using a scale of 1 to 4 where 4 means "very safe" and 1 means "very unsafe," please rate how safe you feel in the following situations: (N=634) Somewhat Very Safe Somewhat Safe Unsafe Very Unsafe Don't Know Q10a. Walking alone in your neighborhood in general 86.3% 11.7% 0.8% 0.2% 1.1% Q10b. Walking alone in your neighborhood after dark 53.6% 35.6% 5.8% 1.3% 3.6% Q10c. Walking alone in your neighborhood during the day 91.0% 7.1% 0.3% 0.2% 1.4% Q10d. Walking alone in business areas after dark 35.6% 44.5% 12.0% 0.6% 7.3% Q10e. Walking alone in business areas during the day 83.3% 13.6% 0.5% 0.0% 2.7% Q10f. Your overall feeling of safety in Des Peres 78.1% 20.3% 0.6% 0.0% 0.9% Q10g. While shopping at West County Center 56.6% 36.1% 4.6% 0.5% 2.2%
WITHOUT DON’T KNOW Q10. How safe do you feel: Using a scale of 1 to 4 where 4 means "very safe" and 1 means "very unsafe," please rate how safe you feel in the following situations: (without "don't know") (N=634) Somewhat Very Safe Somewhat Safe Unsafe Very Unsafe Q10a. Walking alone in your neighborhood in general 87.2% 11.8% 0.8% 0.2% Q10b. Walking alone in your neighborhood after dark 55.6% 37.0% 6.1% 1.3% Q10c. Walking alone in your neighborhood during the day 92.3% 7.2% 0.3% 0.2% Q10d. Walking alone in business areas after dark 38.4% 48.0% 12.9% 0.7% Q10e. Walking alone in business areas during the day 85.6% 13.9% 0.5% 0.0% Q10f. Your overall feeling of safety in Des Peres 78.8% 20.5% 0.6% 0.0% Q10g. While shopping at West County Center 57.9% 36.9% 4.7% 0.5%
2014 City of Des Peres Community Survey: Final Report
ETC Institute (2014) Page 55
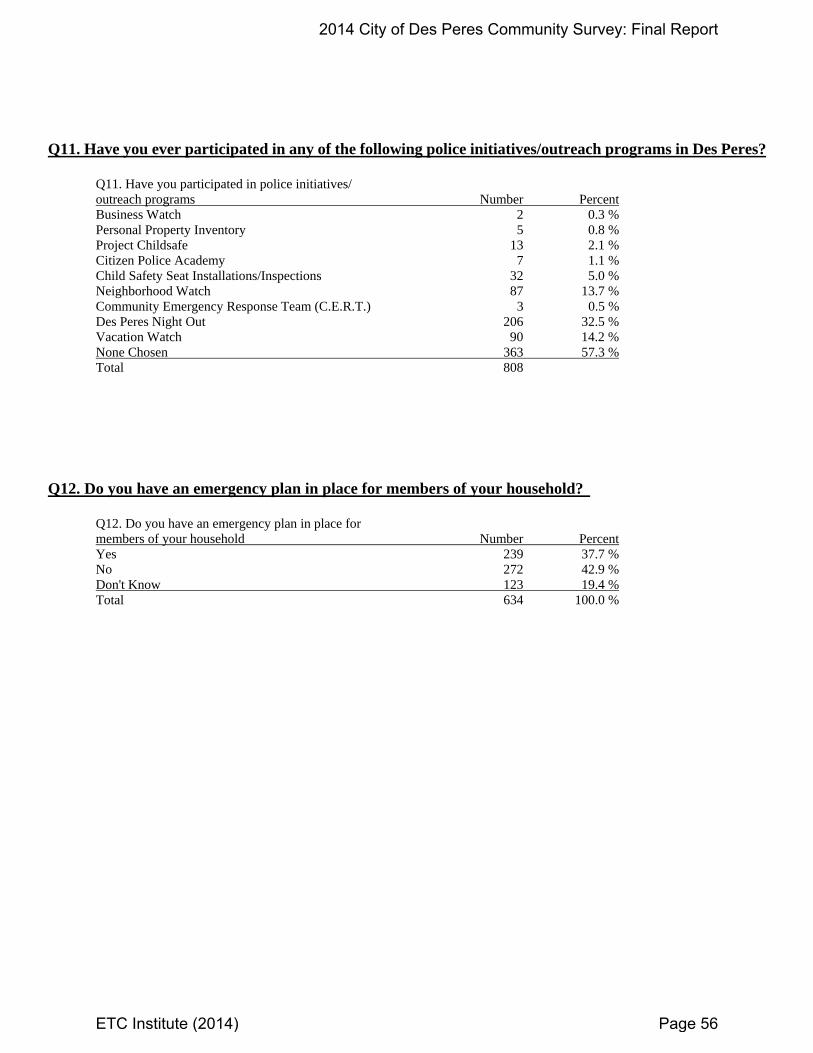
Q11. Have you ever participated in any of the following police initiatives/outreach programs in Des Peres? Q11. Have you participated in police initiatives/ outreach programs Number Percent Business Watch 2 0.3 % Personal Property Inventory 5 0.8 % Project Childsafe 13 2.1 % Citizen Police Academy 7 1.1 % Child Safety Seat Installations/Inspections 32 5.0 % Neighborhood Watch 87 13.7 % Community Emergency Response Team (C.E.R.T.) 3 0.5 % Des Peres Night Out 206 32.5 % Vacation Watch 90 14.2 % None Chosen 363 57.3 % Total 808 Q12. Do you have an emergency plan in place for members of your household? Q12. Do you have an emergency plan in place for members of your household Number Percent Yes 239 37.7 % No 272 42.9 % Don't Know 123 19.4 % Total 634 100.0 %
2014 City of Des Peres Community Survey: Final Report
ETC Institute (2014) Page 56
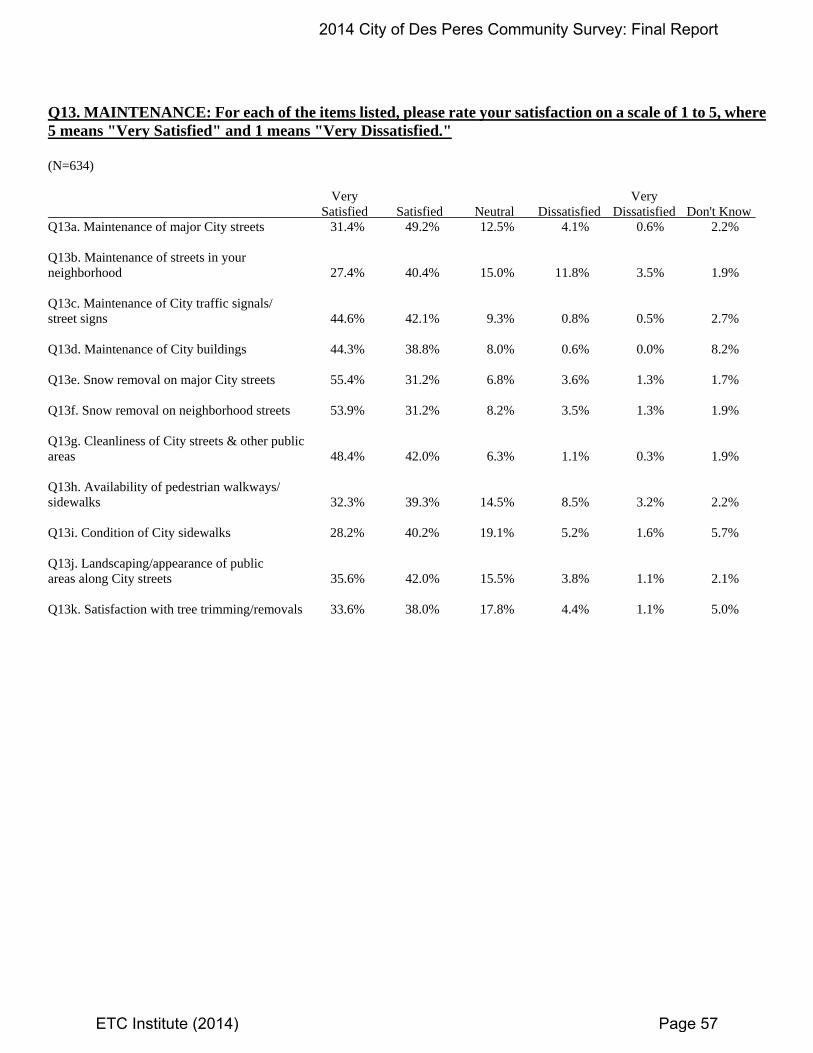
Q13. MAINTENANCE: For each of the items listed, please rate your satisfaction on a scale of 1 to 5, where 5 means "Very Satisfied" and 1 means "Very Dissatisfied." (N=634) Very Very Satisfied Satisfied Neutral Dissatisfied Dissatisfied Don't Know Q13a. Maintenance of major City streets 31.4% 49.2% 12.5% 4.1% 0.6% 2.2% Q13b. Maintenance of streets in your neighborhood 27.4% 40.4% 15.0% 11.8% 3.5% 1.9% Q13c. Maintenance of City traffic signals/ street signs 44.6% 42.1% 9.3% 0.8% 0.5% 2.7% Q13d. Maintenance of City buildings 44.3% 38.8% 8.0% 0.6% 0.0% 8.2% Q13e. Snow removal on major City streets 55.4% 31.2% 6.8% 3.6% 1.3% 1.7% Q13f. Snow removal on neighborhood streets 53.9% 31.2% 8.2% 3.5% 1.3% 1.9% Q13g. Cleanliness of City streets & other public areas 48.4% 42.0% 6.3% 1.1% 0.3% 1.9% Q13h. Availability of pedestrian walkways/ sidewalks 32.3% 39.3% 14.5% 8.5% 3.2% 2.2% Q13i. Condition of City sidewalks 28.2% 40.2% 19.1% 5.2% 1.6% 5.7% Q13j. Landscaping/appearance of public areas along City streets 35.6% 42.0% 15.5% 3.8% 1.1% 2.1% Q13k. Satisfaction with tree trimming/removals 33.6% 38.0% 17.8% 4.4% 1.1% 5.0%
2014 City of Des Peres Community Survey: Final Report
ETC Institute (2014) Page 57
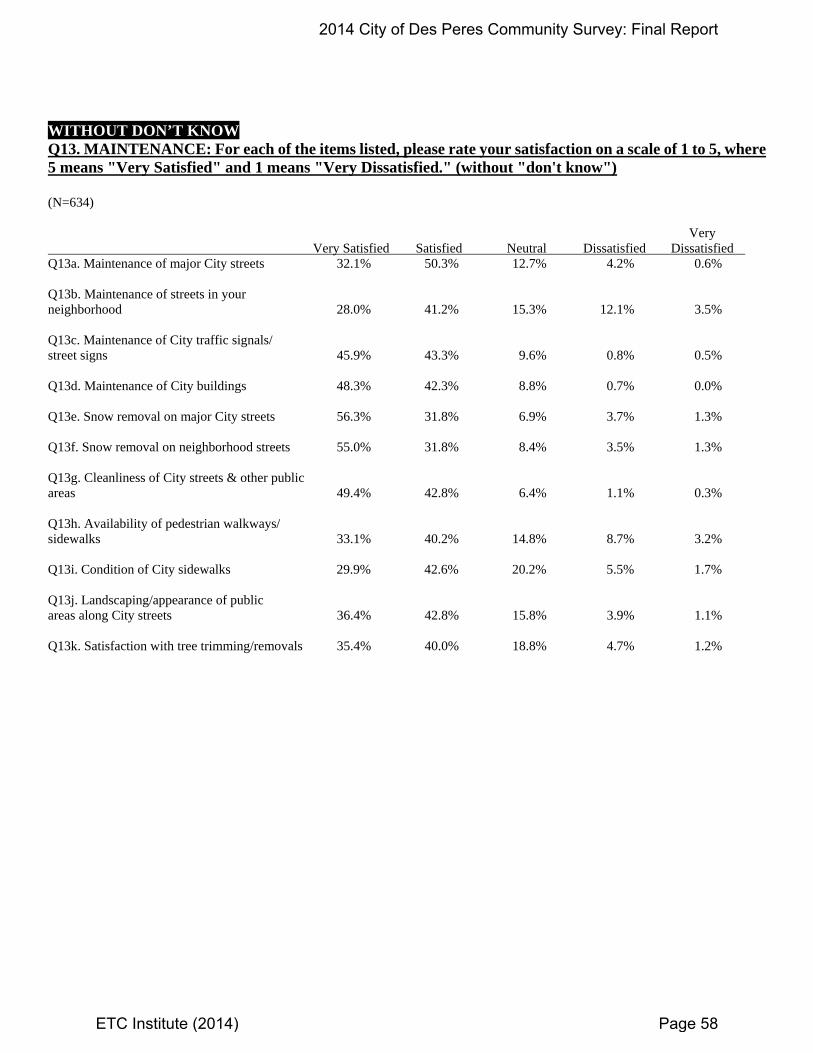
WITHOUT DON’T KNOW Q13. MAINTENANCE: For each of the items listed, please rate your satisfaction on a scale of 1 to 5, where 5 means "Very Satisfied" and 1 means "Very Dissatisfied." (without "don't know") (N=634) Very Very Satisfied Satisfied Neutral Dissatisfied Dissatisfied Q13a. Maintenance of major City streets 32.1% 50.3% 12.7% 4.2% 0.6% Q13b. Maintenance of streets in your neighborhood 28.0% 41.2% 15.3% 12.1% 3.5% Q13c. Maintenance of City traffic signals/ street signs 45.9% 43.3% 9.6% 0.8% 0.5% Q13d. Maintenance of City buildings 48.3% 42.3% 8.8% 0.7% 0.0% Q13e. Snow removal on major City streets 56.3% 31.8% 6.9% 3.7% 1.3% Q13f. Snow removal on neighborhood streets 55.0% 31.8% 8.4% 3.5% 1.3% Q13g. Cleanliness of City streets & other public areas 49.4% 42.8% 6.4% 1.1% 0.3% Q13h. Availability of pedestrian walkways/ sidewalks 33.1% 40.2% 14.8% 8.7% 3.2% Q13i. Condition of City sidewalks 29.9% 42.6% 20.2% 5.5% 1.7% Q13j. Landscaping/appearance of public areas along City streets 36.4% 42.8% 15.8% 3.9% 1.1% Q13k. Satisfaction with tree trimming/removals 35.4% 40.0% 18.8% 4.7% 1.2%
2014 City of Des Peres Community Survey: Final Report
ETC Institute (2014) Page 58
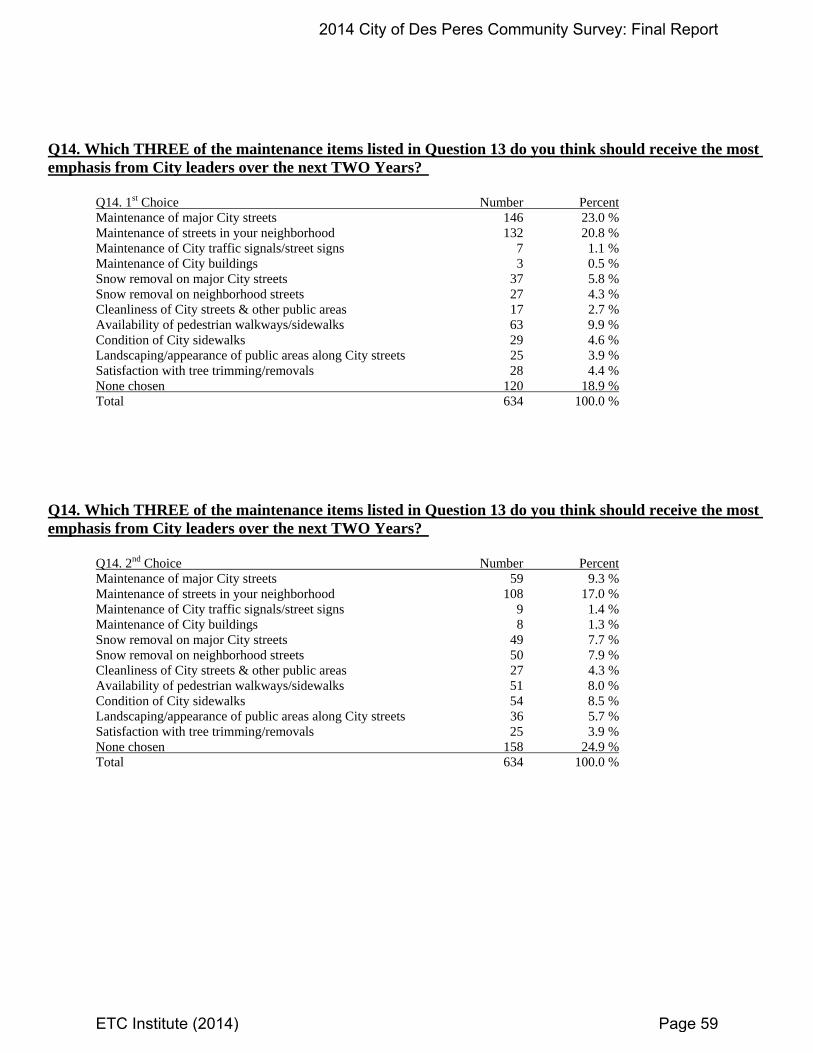
Q14. Which THREE of the maintenance items listed in Question 13 do you think should receive the most emphasis from City leaders over the next TWO Years? Q14. 1st Choice Number Percent Maintenance of major City streets 146 23.0 % Maintenance of streets in your neighborhood 132 20.8 % Maintenance of City traffic signals/street signs 7 1.1 % Maintenance of City buildings 3 0.5 % Snow removal on major City streets 37 5.8 % Snow removal on neighborhood streets 27 4.3 % Cleanliness of City streets & other public areas 17 2.7 % Availability of pedestrian walkways/sidewalks 63 9.9 % Condition of City sidewalks 29 4.6 % Landscaping/appearance of public areas along City streets 25 3.9 % Satisfaction with tree trimming/removals 28 4.4 % None chosen 120 18.9 % Total 634 100.0 %
Q14. Which THREE of the maintenance items listed in Question 13 do you think should receive the most emphasis from City leaders over the next TWO Years? Q14. 2nd Choice Number Percent Maintenance of major City streets 59 9.3 % Maintenance of streets in your neighborhood 108 17.0 % Maintenance of City traffic signals/street signs 9 1.4 % Maintenance of City buildings 8 1.3 % Snow removal on major City streets 49 7.7 % Snow removal on neighborhood streets 50 7.9 % Cleanliness of City streets & other public areas 27 4.3 % Availability of pedestrian walkways/sidewalks 51 8.0 % Condition of City sidewalks 54 8.5 % Landscaping/appearance of public areas along City streets 36 5.7 % Satisfaction with tree trimming/removals 25 3.9 % None chosen 158 24.9 % Total 634 100.0 %
2014 City of Des Peres Community Survey: Final Report
ETC Institute (2014) Page 59
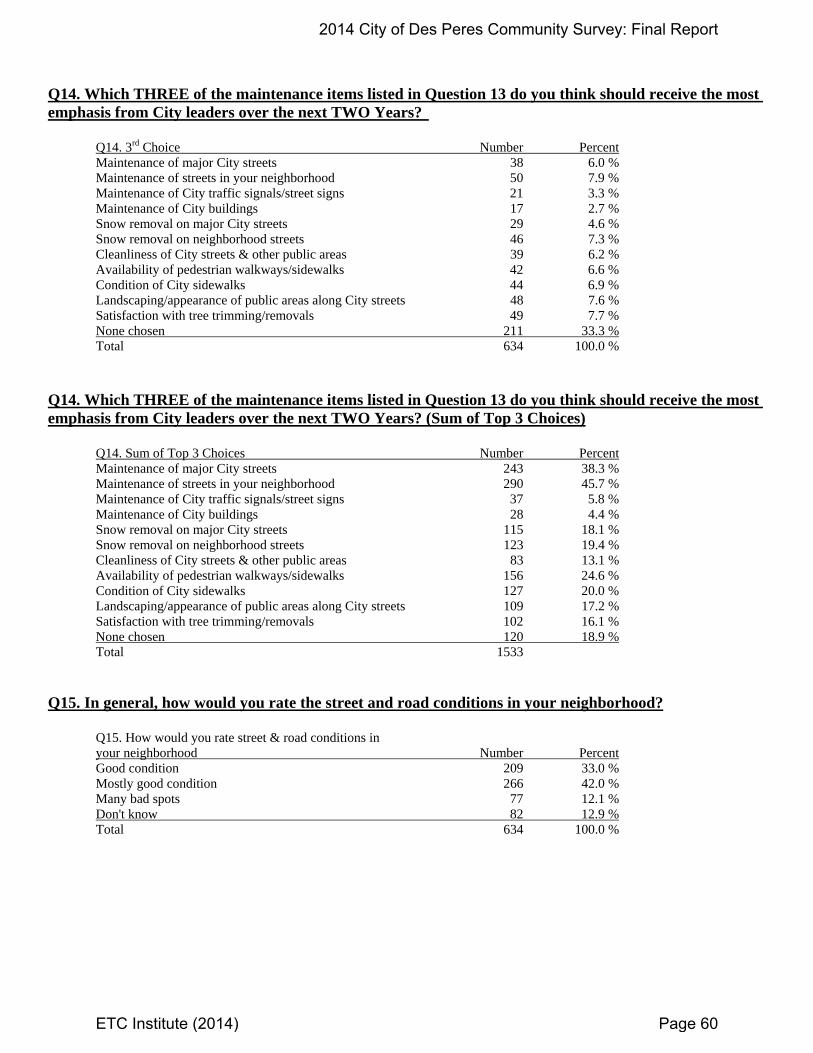
Q14. Which THREE of the maintenance items listed in Question 13 do you think should receive the most emphasis from City leaders over the next TWO Years? Q14. 3rd Choice Number Percent Maintenance of major City streets 38 6.0 % Maintenance of streets in your neighborhood 50 7.9 % Maintenance of City traffic signals/street signs 21 3.3 % Maintenance of City buildings 17 2.7 % Snow removal on major City streets 29 4.6 % Snow removal on neighborhood streets 46 7.3 % Cleanliness of City streets & other public areas 39 6.2 % Availability of pedestrian walkways/sidewalks 42 6.6 % Condition of City sidewalks 44 6.9 % Landscaping/appearance of public areas along City streets 48 7.6 % Satisfaction with tree trimming/removals 49 7.7 % None chosen 211 33.3 % Total 634 100.0 % Q14. Which THREE of the maintenance items listed in Question 13 do you think should receive the most emphasis from City leaders over the next TWO Years? (Sum of Top 3 Choices) Q14. Sum of Top 3 Choices Number Percent Maintenance of major City streets 243 38.3 % Maintenance of streets in your neighborhood 290 45.7 % Maintenance of City traffic signals/street signs 37 5.8 % Maintenance of City buildings 28 4.4 % Snow removal on major City streets 115 18.1 % Snow removal on neighborhood streets 123 19.4 % Cleanliness of City streets & other public areas 83 13.1 % Availability of pedestrian walkways/sidewalks 156 24.6 % Condition of City sidewalks 127 20.0 % Landscaping/appearance of public areas along City streets 109 17.2 % Satisfaction with tree trimming/removals 102 16.1 % None chosen 120 18.9 % Total 1533 Q15. In general, how would you rate the street and road conditions in your neighborhood? Q15. How would you rate street & road conditions in your neighborhood Number Percent Good condition 209 33.0 % Mostly good condition 266 42.0 % Many bad spots 77 12.1 % Don't know 82 12.9 % Total 634 100.0 %
2014 City of Des Peres Community Survey: Final Report
ETC Institute (2014) Page 60
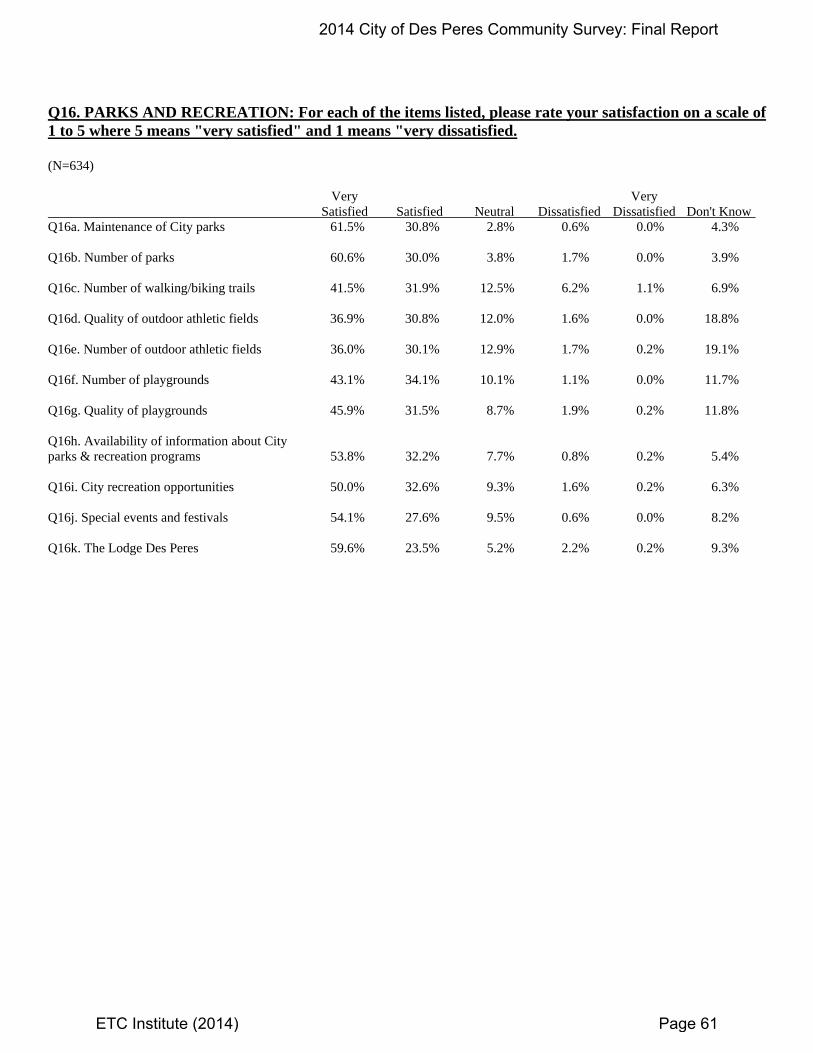
Q16. PARKS AND RECREATION: For each of the items listed, please rate your satisfaction on a scale of 1 to 5 where 5 means "very satisfied" and 1 means "very dissatisfied. (N=634) Very Very Satisfied Satisfied Neutral Dissatisfied Dissatisfied Don't Know Q16a. Maintenance of City parks 61.5% 30.8% 2.8% 0.6% 0.0% 4.3% Q16b. Number of parks 60.6% 30.0% 3.8% 1.7% 0.0% 3.9% Q16c. Number of walking/biking trails 41.5% 31.9% 12.5% 6.2% 1.1% 6.9% Q16d. Quality of outdoor athletic fields 36.9% 30.8% 12.0% 1.6% 0.0% 18.8% Q16e. Number of outdoor athletic fields 36.0% 30.1% 12.9% 1.7% 0.2% 19.1% Q16f. Number of playgrounds 43.1% 34.1% 10.1% 1.1% 0.0% 11.7% Q16g. Quality of playgrounds 45.9% 31.5% 8.7% 1.9% 0.2% 11.8% Q16h. Availability of information about City parks & recreation programs 53.8% 32.2% 7.7% 0.8% 0.2% 5.4% Q16i. City recreation opportunities 50.0% 32.6% 9.3% 1.6% 0.2% 6.3% Q16j. Special events and festivals 54.1% 27.6% 9.5% 0.6% 0.0% 8.2% Q16k. The Lodge Des Peres 59.6% 23.5% 5.2% 2.2% 0.2% 9.3%
2014 City of Des Peres Community Survey: Final Report
ETC Institute (2014) Page 61
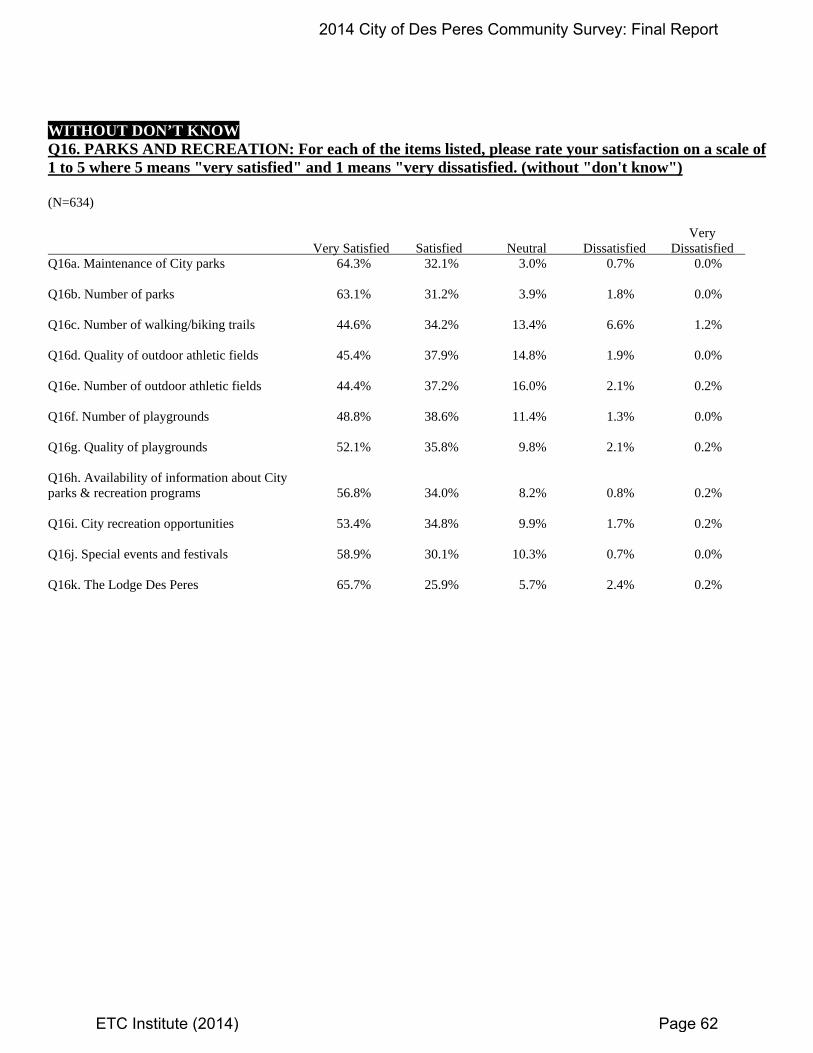
WITHOUT DON’T KNOW Q16. PARKS AND RECREATION: For each of the items listed, please rate your satisfaction on a scale of 1 to 5 where 5 means "very satisfied" and 1 means "very dissatisfied. (without "don't know") (N=634) Very Very Satisfied Satisfied Neutral Dissatisfied Dissatisfied Q16a. Maintenance of City parks 64.3% 32.1% 3.0% 0.7% 0.0% Q16b. Number of parks 63.1% 31.2% 3.9% 1.8% 0.0% Q16c. Number of walking/biking trails 44.6% 34.2% 13.4% 6.6% 1.2% Q16d. Quality of outdoor athletic fields 45.4% 37.9% 14.8% 1.9% 0.0% Q16e. Number of outdoor athletic fields 44.4% 37.2% 16.0% 2.1% 0.2% Q16f. Number of playgrounds 48.8% 38.6% 11.4% 1.3% 0.0% Q16g. Quality of playgrounds 52.1% 35.8% 9.8% 2.1% 0.2% Q16h. Availability of information about City parks & recreation programs 56.8% 34.0% 8.2% 0.8% 0.2% Q16i. City recreation opportunities 53.4% 34.8% 9.9% 1.7% 0.2% Q16j. Special events and festivals 58.9% 30.1% 10.3% 0.7% 0.0% Q16k. The Lodge Des Peres 65.7% 25.9% 5.7% 2.4% 0.2%
2014 City of Des Peres Community Survey: Final Report
ETC Institute (2014) Page 62
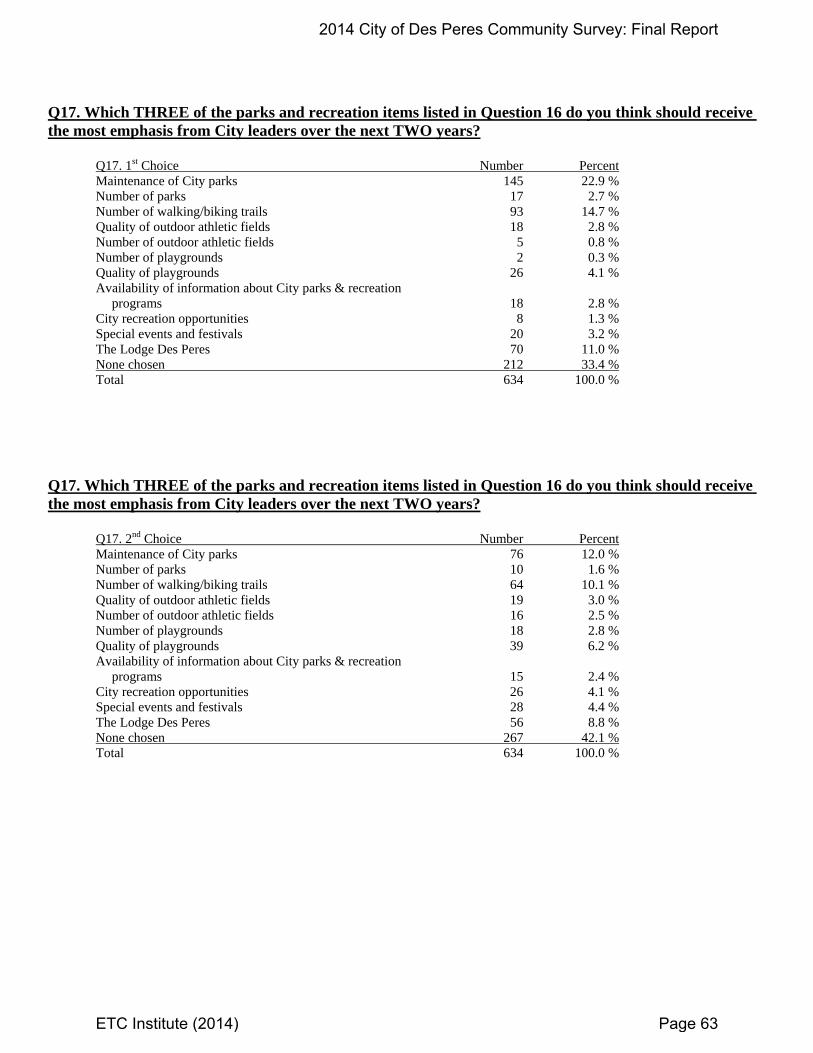
Q17. Which THREE of the parks and recreation items listed in Question 16 do you think should receive the most emphasis from City leaders over the next TWO years? Q17. 1st Choice Number Percent Maintenance of City parks 145 22.9 % Number of parks 17 2.7 % Number of walking/biking trails 93 14.7 % Quality of outdoor athletic fields 18 2.8 % Number of outdoor athletic fields 5 0.8 % Number of playgrounds 2 0.3 % Quality of playgrounds 26 4.1 % Availability of information about City parks & recreation programs 18 2.8 % City recreation opportunities 8 1.3 % Special events and festivals 20 3.2 % The Lodge Des Peres 70 11.0 % None chosen 212 33.4 % Total 634 100.0 % Q17. Which THREE of the parks and recreation items listed in Question 16 do you think should receive the most emphasis from City leaders over the next TWO years? Q17. 2nd Choice Number Percent Maintenance of City parks 76 12.0 % Number of parks 10 1.6 % Number of walking/biking trails 64 10.1 % Quality of outdoor athletic fields 19 3.0 % Number of outdoor athletic fields 16 2.5 % Number of playgrounds 18 2.8 % Quality of playgrounds 39 6.2 % Availability of information about City parks & recreation programs 15 2.4 % City recreation opportunities 26 4.1 % Special events and festivals 28 4.4 % The Lodge Des Peres 56 8.8 % None chosen 267 42.1 % Total 634 100.0 %
2014 City of Des Peres Community Survey: Final Report
ETC Institute (2014) Page 63
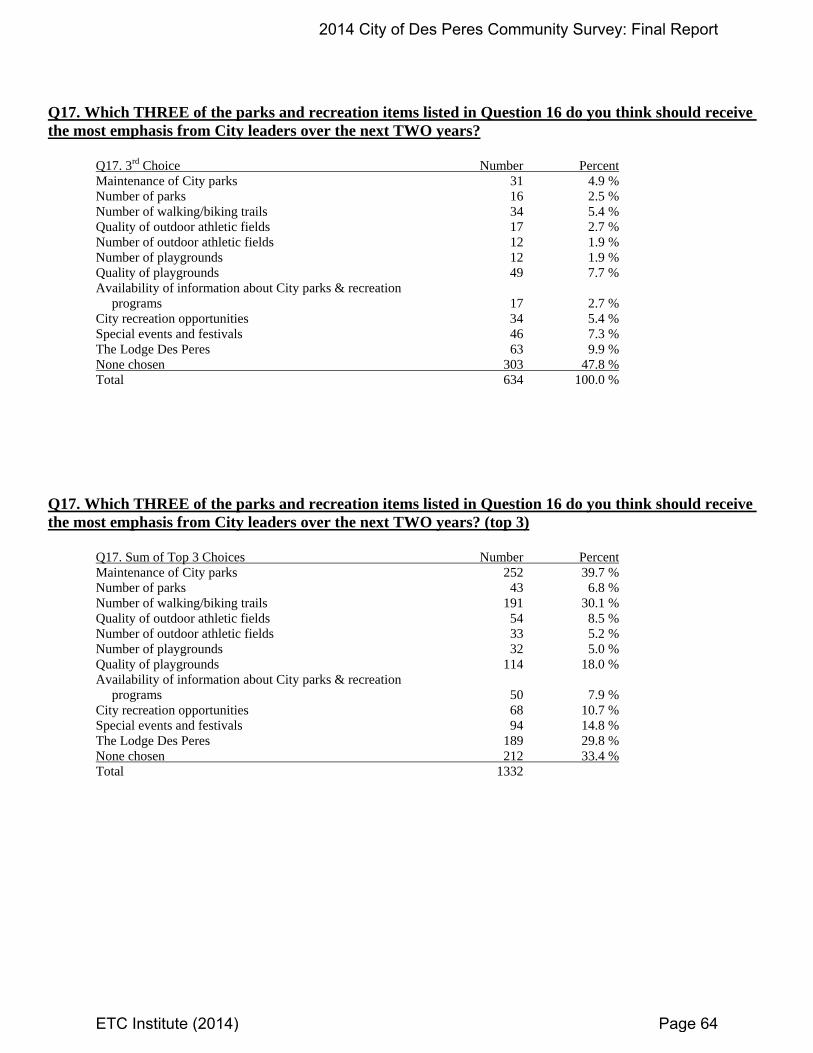
Q17. Which THREE of the parks and recreation items listed in Question 16 do you think should receive the most emphasis from City leaders over the next TWO years? Q17. 3rd Choice Number Percent Maintenance of City parks 31 4.9 % Number of parks 16 2.5 % Number of walking/biking trails 34 5.4 % Quality of outdoor athletic fields 17 2.7 % Number of outdoor athletic fields 12 1.9 % Number of playgrounds 12 1.9 % Quality of playgrounds 49 7.7 % Availability of information about City parks & recreation programs 17 2.7 % City recreation opportunities 34 5.4 % Special events and festivals 46 7.3 % The Lodge Des Peres 63 9.9 % None chosen 303 47.8 % Total 634 100.0 % Q17. Which THREE of the parks and recreation items listed in Question 16 do you think should receive the most emphasis from City leaders over the next TWO years? (top 3) Q17. Sum of Top 3 Choices Number Percent Maintenance of City parks 252 39.7 % Number of parks 43 6.8 % Number of walking/biking trails 191 30.1 % Quality of outdoor athletic fields 54 8.5 % Number of outdoor athletic fields 33 5.2 % Number of playgrounds 32 5.0 % Quality of playgrounds 114 18.0 % Availability of information about City parks & recreation programs 50 7.9 % City recreation opportunities 68 10.7 % Special events and festivals 94 14.8 % The Lodge Des Peres 189 29.8 % None chosen 212 33.4 % Total 1332
2014 City of Des Peres Community Survey: Final Report
ETC Institute (2014) Page 64
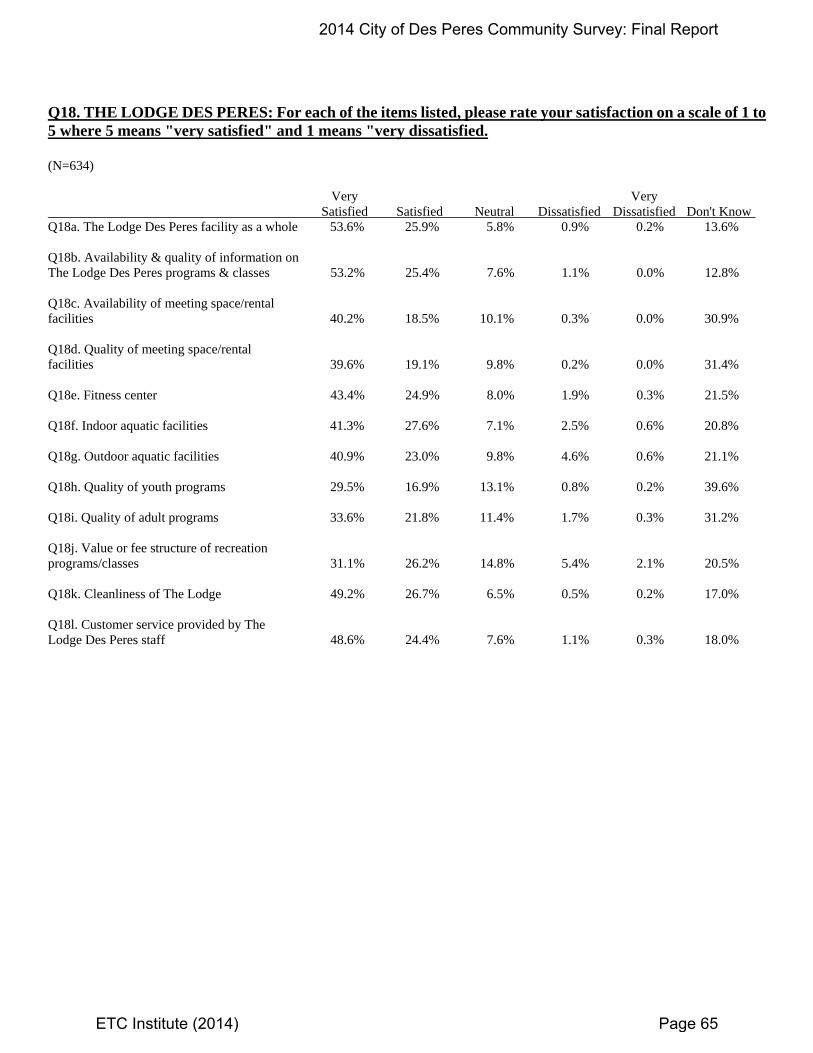
Q18. THE LODGE DES PERES: For each of the items listed, please rate your satisfaction on a scale of 1 to 5 where 5 means "very satisfied" and 1 means "very dissatisfied. (N=634) Very Very Satisfied Satisfied Neutral Dissatisfied Dissatisfied Don't Know Q18a. The Lodge Des Peres facility as a whole 53.6% 25.9% 5.8% 0.9% 0.2% 13.6% Q18b. Availability & quality of information on The Lodge Des Peres programs & classes 53.2% 25.4% 7.6% 1.1% 0.0% 12.8% Q18c. Availability of meeting space/rental facilities 40.2% 18.5% 10.1% 0.3% 0.0% 30.9% Q18d. Quality of meeting space/rental facilities 39.6% 19.1% 9.8% 0.2% 0.0% 31.4% Q18e. Fitness center 43.4% 24.9% 8.0% 1.9% 0.3% 21.5% Q18f. Indoor aquatic facilities 41.3% 27.6% 7.1% 2.5% 0.6% 20.8% Q18g. Outdoor aquatic facilities 40.9% 23.0% 9.8% 4.6% 0.6% 21.1% Q18h. Quality of youth programs 29.5% 16.9% 13.1% 0.8% 0.2% 39.6% Q18i. Quality of adult programs 33.6% 21.8% 11.4% 1.7% 0.3% 31.2% Q18j. Value or fee structure of recreation programs/classes 31.1% 26.2% 14.8% 5.4% 2.1% 20.5% Q18k. Cleanliness of The Lodge 49.2% 26.7% 6.5% 0.5% 0.2% 17.0% Q18l. Customer service provided by The Lodge Des Peres staff 48.6% 24.4% 7.6% 1.1% 0.3% 18.0%
2014 City of Des Peres Community Survey: Final Report
ETC Institute (2014) Page 65
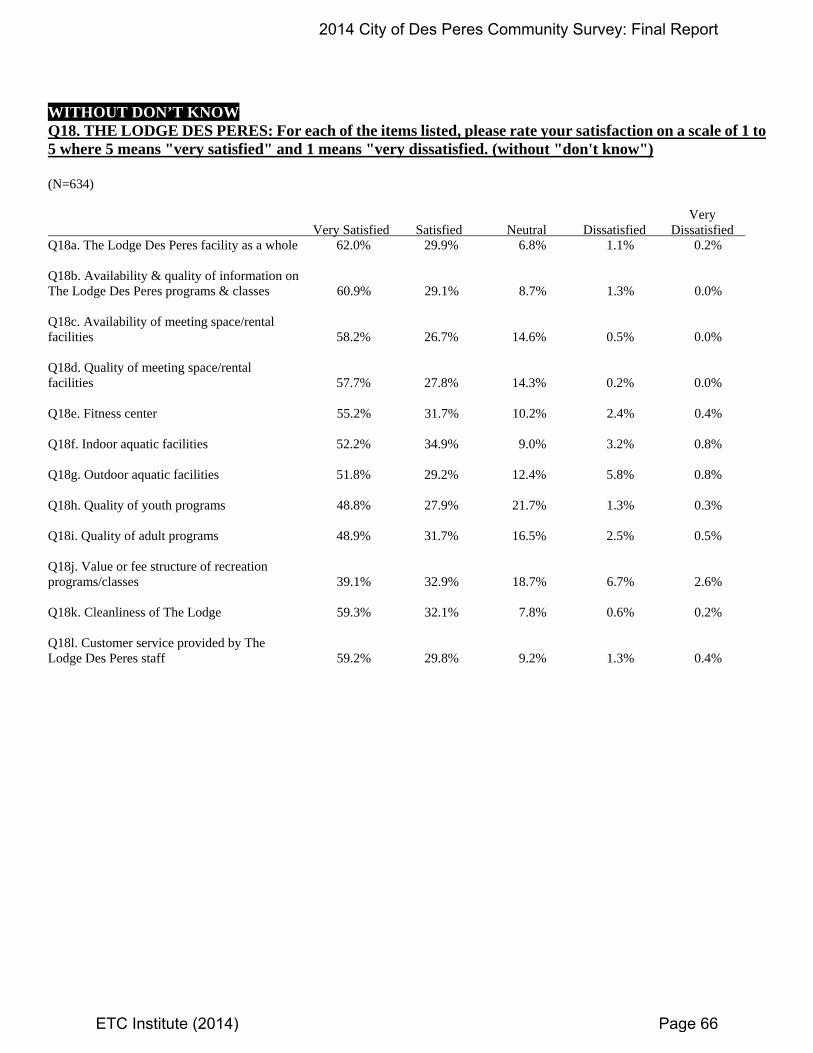
WITHOUT DON’T KNOW Q18. THE LODGE DES PERES: For each of the items listed, please rate your satisfaction on a scale of 1 to 5 where 5 means "very satisfied" and 1 means "very dissatisfied. (without "don't know") (N=634) Very Very Satisfied Satisfied Neutral Dissatisfied Dissatisfied Q18a. The Lodge Des Peres facility as a whole 62.0% 29.9% 6.8% 1.1% 0.2% Q18b. Availability & quality of information on The Lodge Des Peres programs & classes 60.9% 29.1% 8.7% 1.3% 0.0% Q18c. Availability of meeting space/rental facilities 58.2% 26.7% 14.6% 0.5% 0.0% Q18d. Quality of meeting space/rental facilities 57.7% 27.8% 14.3% 0.2% 0.0% Q18e. Fitness center 55.2% 31.7% 10.2% 2.4% 0.4% Q18f. Indoor aquatic facilities 52.2% 34.9% 9.0% 3.2% 0.8% Q18g. Outdoor aquatic facilities 51.8% 29.2% 12.4% 5.8% 0.8% Q18h. Quality of youth programs 48.8% 27.9% 21.7% 1.3% 0.3% Q18i. Quality of adult programs 48.9% 31.7% 16.5% 2.5% 0.5% Q18j. Value or fee structure of recreation programs/classes 39.1% 32.9% 18.7% 6.7% 2.6% Q18k. Cleanliness of The Lodge 59.3% 32.1% 7.8% 0.6% 0.2% Q18l. Customer service provided by The Lodge Des Peres staff 59.2% 29.8% 9.2% 1.3% 0.4%
2014 City of Des Peres Community Survey: Final Report
ETC Institute (2014) Page 66
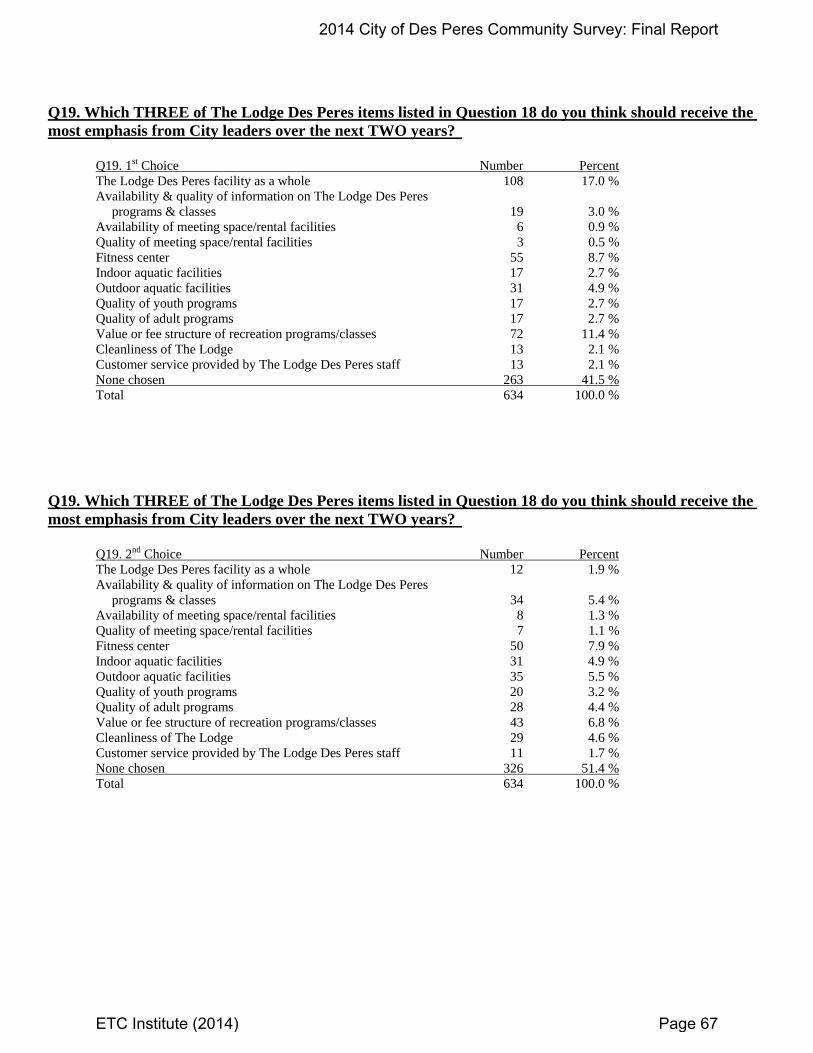
Q19. Which THREE of The Lodge Des Peres items listed in Question 18 do you think should receive the most emphasis from City leaders over the next TWO years? Q19. 1st Choice Number Percent The Lodge Des Peres facility as a whole 108 17.0 % Availability & quality of information on The Lodge Des Peres programs & classes 19 3.0 % Availability of meeting space/rental facilities 6 0.9 % Quality of meeting space/rental facilities 3 0.5 % Fitness center 55 8.7 % Indoor aquatic facilities 17 2.7 % Outdoor aquatic facilities 31 4.9 % Quality of youth programs 17 2.7 % Quality of adult programs 17 2.7 % Value or fee structure of recreation programs/classes 72 11.4 % Cleanliness of The Lodge 13 2.1 % Customer service provided by The Lodge Des Peres staff 13 2.1 % None chosen 263 41.5 % Total 634 100.0 %
Q19. Which THREE of The Lodge Des Peres items listed in Question 18 do you think should receive the most emphasis from City leaders over the next TWO years? Q19. 2nd Choice Number Percent The Lodge Des Peres facility as a whole 12 1.9 % Availability & quality of information on The Lodge Des Peres programs & classes 34 5.4 % Availability of meeting space/rental facilities 8 1.3 % Quality of meeting space/rental facilities 7 1.1 % Fitness center 50 7.9 % Indoor aquatic facilities 31 4.9 % Outdoor aquatic facilities 35 5.5 % Quality of youth programs 20 3.2 % Quality of adult programs 28 4.4 % Value or fee structure of recreation programs/classes 43 6.8 % Cleanliness of The Lodge 29 4.6 % Customer service provided by The Lodge Des Peres staff 11 1.7 % None chosen 326 51.4 % Total 634 100.0 %
2014 City of Des Peres Community Survey: Final Report
ETC Institute (2014) Page 67
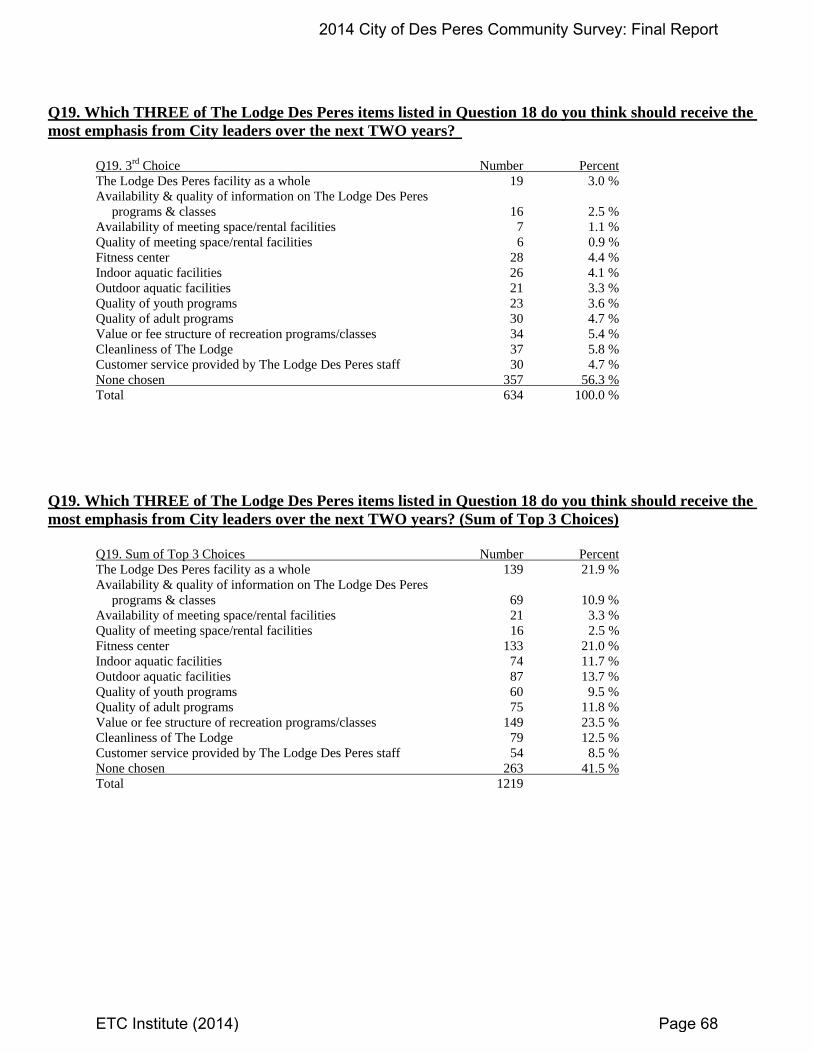
Q19. Which THREE of The Lodge Des Peres items listed in Question 18 do you think should receive the most emphasis from City leaders over the next TWO years? Q19. 3rd Choice Number Percent The Lodge Des Peres facility as a whole 19 3.0 % Availability & quality of information on The Lodge Des Peres programs & classes 16 2.5 % Availability of meeting space/rental facilities 7 1.1 % Quality of meeting space/rental facilities 6 0.9 % Fitness center 28 4.4 % Indoor aquatic facilities 26 4.1 % Outdoor aquatic facilities 21 3.3 % Quality of youth programs 23 3.6 % Quality of adult programs 30 4.7 % Value or fee structure of recreation programs/classes 34 5.4 % Cleanliness of The Lodge 37 5.8 % Customer service provided by The Lodge Des Peres staff 30 4.7 % None chosen 357 56.3 % Total 634 100.0 % Q19. Which THREE of The Lodge Des Peres items listed in Question 18 do you think should receive the most emphasis from City leaders over the next TWO years? (Sum of Top 3 Choices) Q19. Sum of Top 3 Choices Number Percent The Lodge Des Peres facility as a whole 139 21.9 % Availability & quality of information on The Lodge Des Peres programs & classes 69 10.9 % Availability of meeting space/rental facilities 21 3.3 % Quality of meeting space/rental facilities 16 2.5 % Fitness center 133 21.0 % Indoor aquatic facilities 74 11.7 % Outdoor aquatic facilities 87 13.7 % Quality of youth programs 60 9.5 % Quality of adult programs 75 11.8 % Value or fee structure of recreation programs/classes 149 23.5 % Cleanliness of The Lodge 79 12.5 % Customer service provided by The Lodge Des Peres staff 54 8.5 % None chosen 263 41.5 % Total 1219
2014 City of Des Peres Community Survey: Final Report
ETC Institute (2014) Page 68
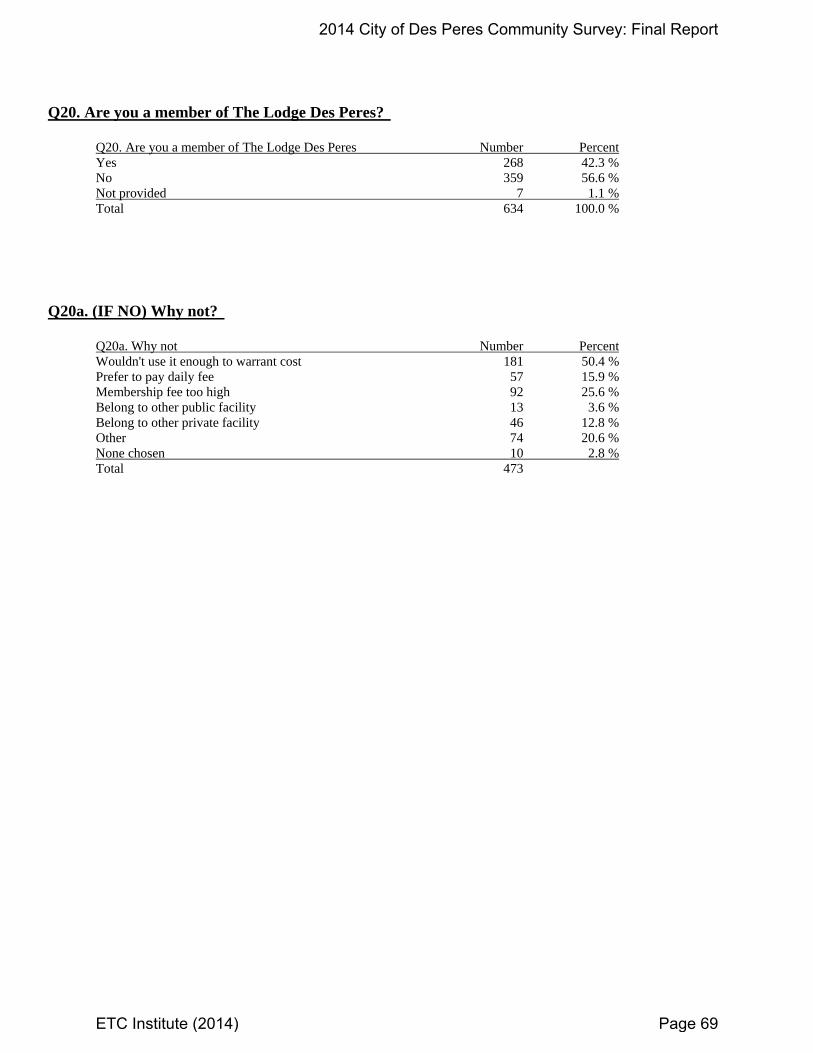
Q20. Are you a member of The Lodge Des Peres? Q20. Are you a member of The Lodge Des Peres Number Percent Yes 268 42.3 % No 359 56.6 % Not provided 7 1.1 % Total 634 100.0 % Q20a. (IF NO) Why not? Q20a. Why not Number Percent Wouldn't use it enough to warrant cost 181 50.4 % Prefer to pay daily fee 57 15.9 % Membership fee too high 92 25.6 % Belong to other public facility 13 3.6 % Belong to other private facility 46 12.8 % Other 74 20.6 % None chosen 10 2.8 % Total 473
2014 City of Des Peres Community Survey: Final Report
ETC Institute (2014) Page 69
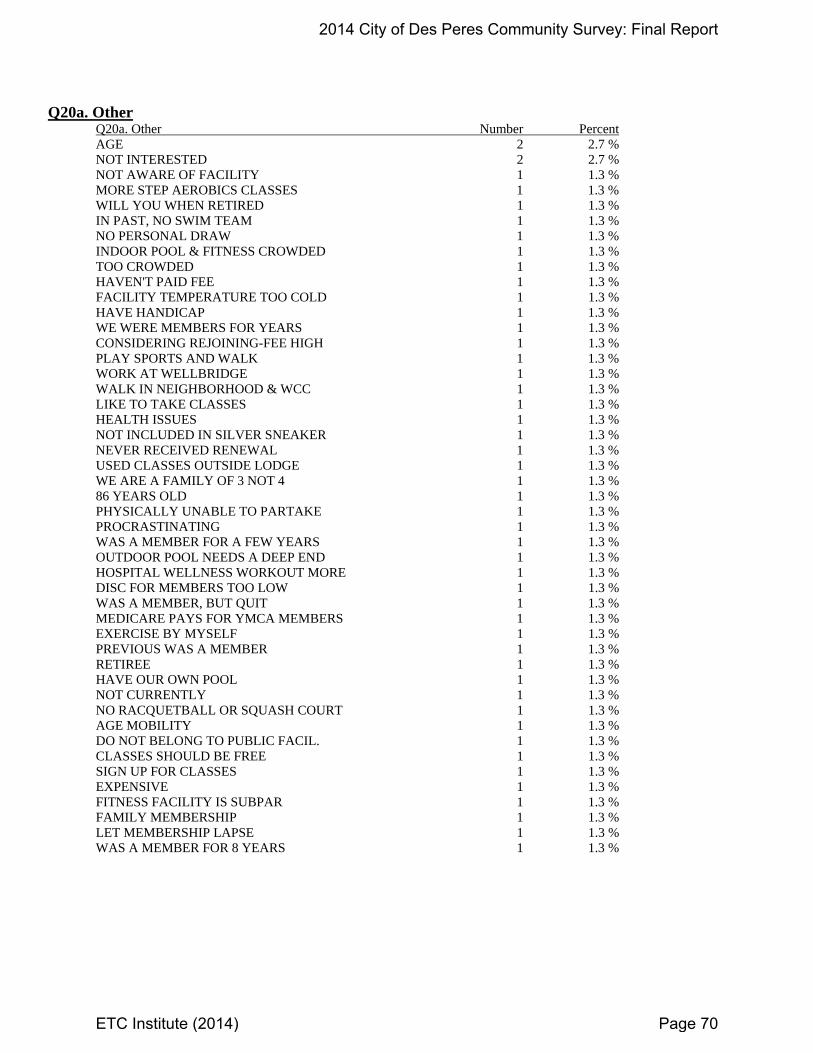
Q20a. Other Q20a. Other Number Percent AGE 2 2.7 % NOT INTERESTED 2 2.7 % NOT AWARE OF FACILITY 1 1.3 % MORE STEP AEROBICS CLASSES 1 1.3 % WILL YOU WHEN RETIRED 1 1.3 % IN PAST, NO SWIM TEAM 1 1.3 % NO PERSONAL DRAW 1 1.3 % INDOOR POOL & FITNESS CROWDED 1 1.3 % TOO CROWDED 1 1.3 % HAVEN'T PAID FEE 1 1.3 % FACILITY TEMPERATURE TOO COLD 1 1.3 % HAVE HANDICAP 1 1.3 % WE WERE MEMBERS FOR YEARS 1 1.3 % CONSIDERING REJOINING-FEE HIGH 1 1.3 % PLAY SPORTS AND WALK 1 1.3 % WORK AT WELLBRIDGE 1 1.3 % WALK IN NEIGHBORHOOD & WCC 1 1.3 % LIKE TO TAKE CLASSES 1 1.3 % HEALTH ISSUES 1 1.3 % NOT INCLUDED IN SILVER SNEAKER 1 1.3 % NEVER RECEIVED RENEWAL 1 1.3 % USED CLASSES OUTSIDE LODGE 1 1.3 % WE ARE A FAMILY OF 3 NOT 4 1 1.3 % 86 YEARS OLD 1 1.3 % PHYSICALLY UNABLE TO PARTAKE 1 1.3 % PROCRASTINATING 1 1.3 % WAS A MEMBER FOR A FEW YEARS 1 1.3 % OUTDOOR POOL NEEDS A DEEP END 1 1.3 % HOSPITAL WELLNESS WORKOUT MORE 1 1.3 % DISC FOR MEMBERS TOO LOW 1 1.3 % WAS A MEMBER, BUT QUIT 1 1.3 % MEDICARE PAYS FOR YMCA MEMBERS 1 1.3 % EXERCISE BY MYSELF 1 1.3 % PREVIOUS WAS A MEMBER 1 1.3 % RETIREE 1 1.3 % HAVE OUR OWN POOL 1 1.3 % NOT CURRENTLY 1 1.3 % NO RACQUETBALL OR SQUASH COURT 1 1.3 % AGE MOBILITY 1 1.3 % DO NOT BELONG TO PUBLIC FACIL. 1 1.3 % CLASSES SHOULD BE FREE 1 1.3 % SIGN UP FOR CLASSES 1 1.3 % EXPENSIVE 1 1.3 % FITNESS FACILITY IS SUBPAR 1 1.3 % FAMILY MEMBERSHIP 1 1.3 % LET MEMBERSHIP LAPSE 1 1.3 % WAS A MEMBER FOR 8 YEARS 1 1.3 %
2014 City of Des Peres Community Survey: Final Report
ETC Institute (2014) Page 70
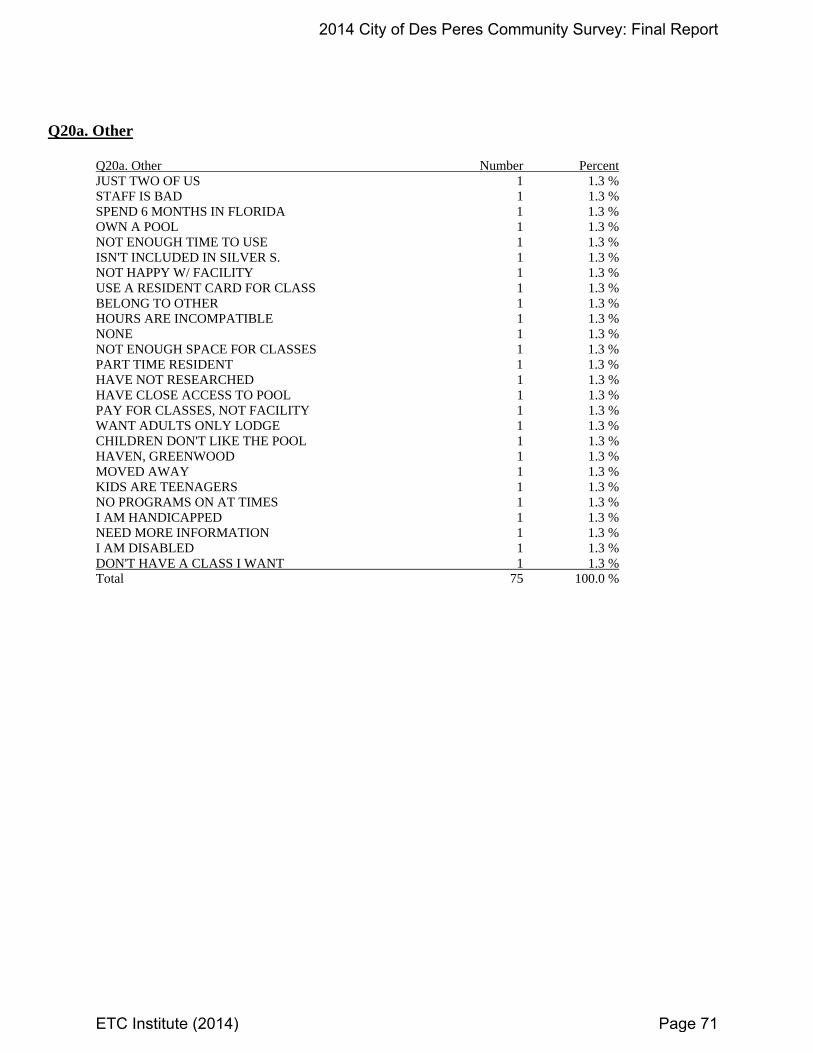
Q20a. Other Q20a. Other Number Percent JUST TWO OF US 1 1.3 % STAFF IS BAD 1 1.3 % SPEND 6 MONTHS IN FLORIDA 1 1.3 % OWN A POOL 1 1.3 % NOT ENOUGH TIME TO USE 1 1.3 % ISN'T INCLUDED IN SILVER S. 1 1.3 % NOT HAPPY W/ FACILITY 1 1.3 % USE A RESIDENT CARD FOR CLASS 1 1.3 % BELONG TO OTHER 1 1.3 % HOURS ARE INCOMPATIBLE 1 1.3 % NONE 1 1.3 % NOT ENOUGH SPACE FOR CLASSES 1 1.3 % PART TIME RESIDENT 1 1.3 % HAVE NOT RESEARCHED 1 1.3 % HAVE CLOSE ACCESS TO POOL 1 1.3 % PAY FOR CLASSES, NOT FACILITY 1 1.3 % WANT ADULTS ONLY LODGE 1 1.3 % CHILDREN DON'T LIKE THE POOL 1 1.3 % HAVEN, GREENWOOD 1 1.3 % MOVED AWAY 1 1.3 % KIDS ARE TEENAGERS 1 1.3 % NO PROGRAMS ON AT TIMES 1 1.3 % I AM HANDICAPPED 1 1.3 % NEED MORE INFORMATION 1 1.3 % I AM DISABLED 1 1.3 % DON'T HAVE A CLASS I WANT 1 1.3 % Total 75 100.0 %
2014 City of Des Peres Community Survey: Final Report
ETC Institute (2014) Page 71
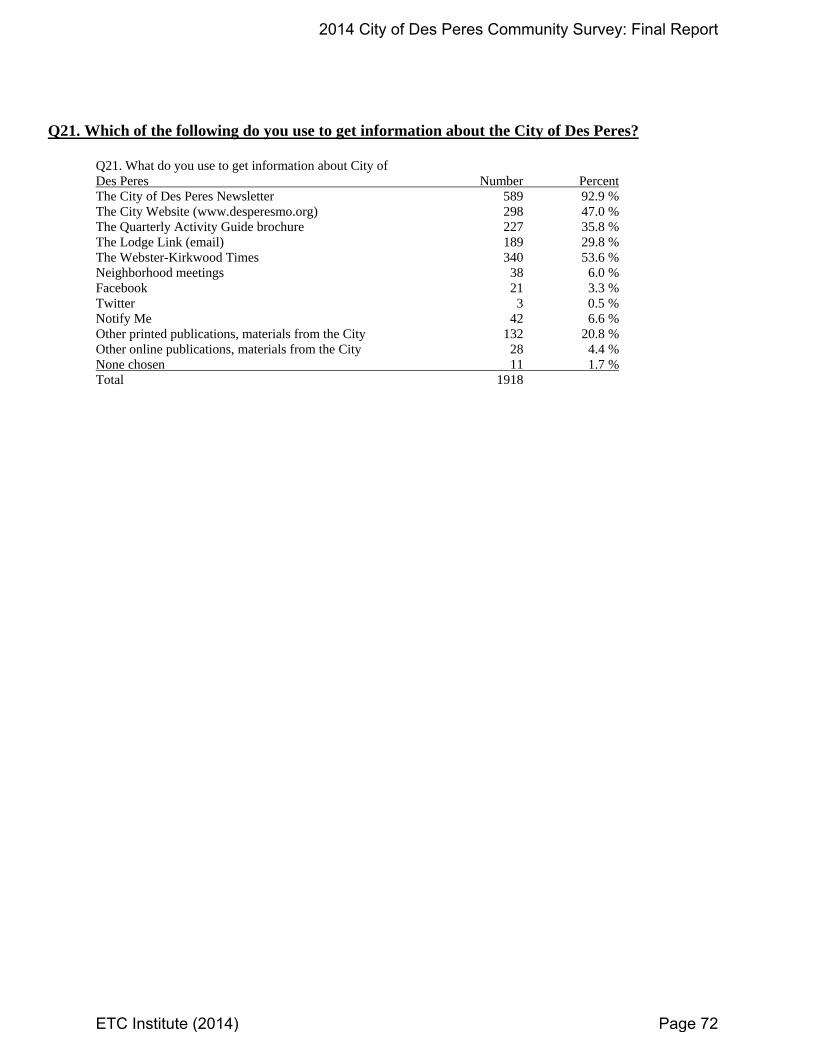
Q21. Which of the following do you use to get information about the City of Des Peres? Q21. What do you use to get information about City of Des Peres Number Percent The City of Des Peres Newsletter 589 92.9 % The City Website (www.desperesmo.org) 298 47.0 % The Quarterly Activity Guide brochure 227 35.8 % The Lodge Link (email) 189 29.8 % The Webster-Kirkwood Times 340 53.6 % Neighborhood meetings 38 6.0 % Facebook 21 3.3 % Twitter 3 0.5 % Notify Me 42 6.6 % Other printed publications, materials from the City 132 20.8 % Other online publications, materials from the City 28 4.4 % None chosen 11 1.7 % Total 1918
2014 City of Des Peres Community Survey: Final Report
ETC Institute (2014) Page 72
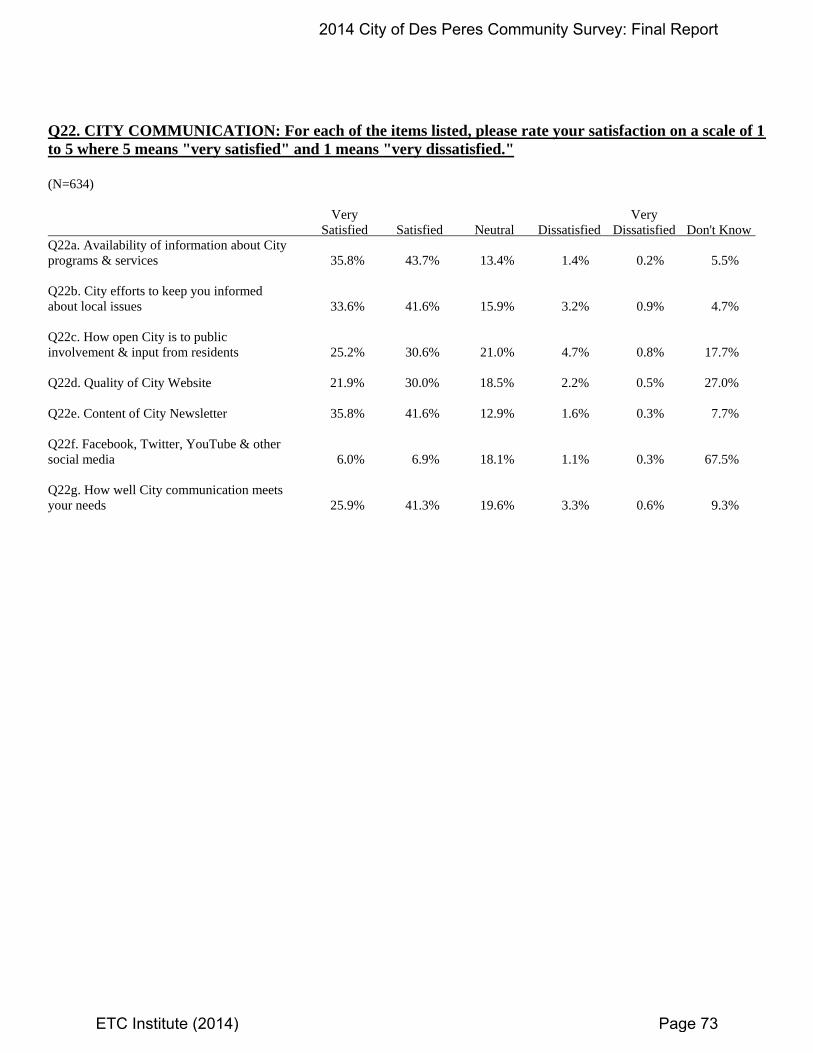
Q22. CITY COMMUNICATION: For each of the items listed, please rate your satisfaction on a scale of 1 to 5 where 5 means "very satisfied" and 1 means "very dissatisfied." (N=634) Very Very Satisfied Satisfied Neutral Dissatisfied Dissatisfied Don't Know Q22a. Availability of information about City programs & services 35.8% 43.7% 13.4% 1.4% 0.2% 5.5% Q22b. City efforts to keep you informed about local issues 33.6% 41.6% 15.9% 3.2% 0.9% 4.7% Q22c. How open City is to public involvement & input from residents 25.2% 30.6% 21.0% 4.7% 0.8% 17.7% Q22d. Quality of City Website 21.9% 30.0% 18.5% 2.2% 0.5% 27.0% Q22e. Content of City Newsletter 35.8% 41.6% 12.9% 1.6% 0.3% 7.7% Q22f. Facebook, Twitter, YouTube & other social media 6.0% 6.9% 18.1% 1.1% 0.3% 67.5% Q22g. How well City communication meets your needs 25.9% 41.3% 19.6% 3.3% 0.6% 9.3%
2014 City of Des Peres Community Survey: Final Report
ETC Institute (2014) Page 73
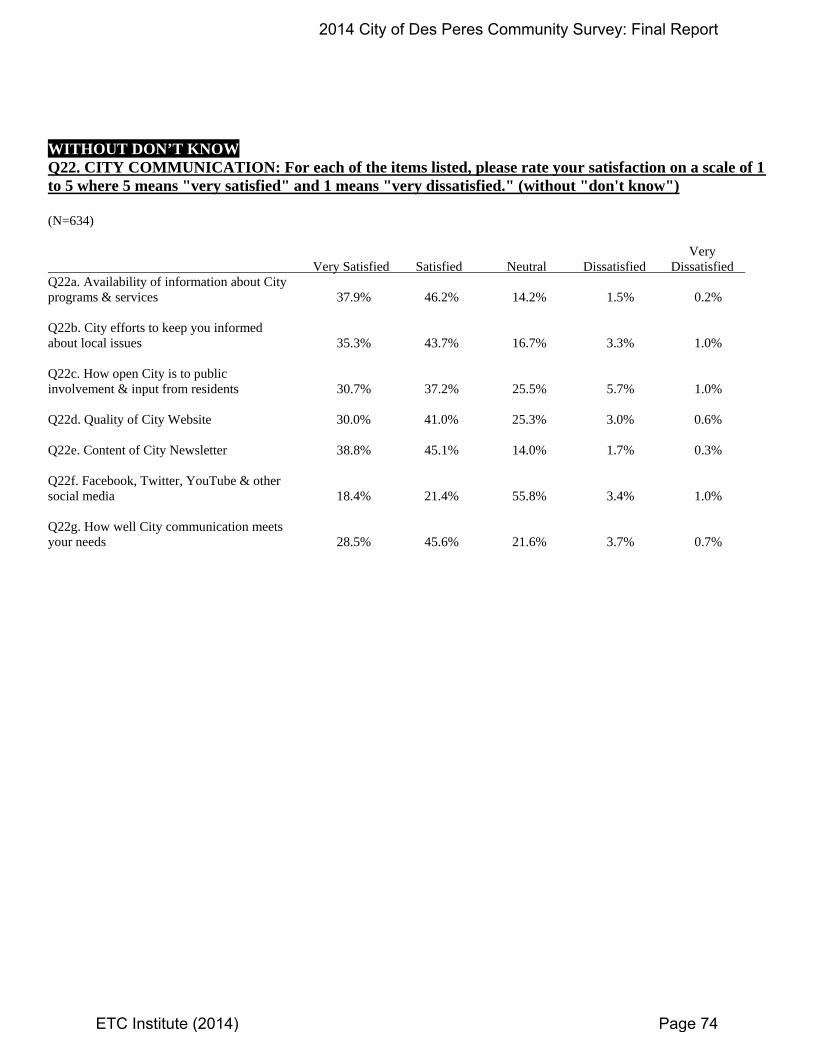
WITHOUT DON’T KNOW Q22. CITY COMMUNICATION: For each of the items listed, please rate your satisfaction on a scale of 1 to 5 where 5 means "very satisfied" and 1 means "very dissatisfied." (without "don't know") (N=634) Very Very Satisfied Satisfied Neutral Dissatisfied Dissatisfied Q22a. Availability of information about City programs & services 37.9% 46.2% 14.2% 1.5% 0.2% Q22b. City efforts to keep you informed about local issues 35.3% 43.7% 16.7% 3.3% 1.0% Q22c. How open City is to public involvement & input from residents 30.7% 37.2% 25.5% 5.7% 1.0% Q22d. Quality of City Website 30.0% 41.0% 25.3% 3.0% 0.6% Q22e. Content of City Newsletter 38.8% 45.1% 14.0% 1.7% 0.3% Q22f. Facebook, Twitter, YouTube & other social media 18.4% 21.4% 55.8% 3.4% 1.0% Q22g. How well City communication meets your needs 28.5% 45.6% 21.6% 3.7% 0.7%
2014 City of Des Peres Community Survey: Final Report
ETC Institute (2014) Page 74
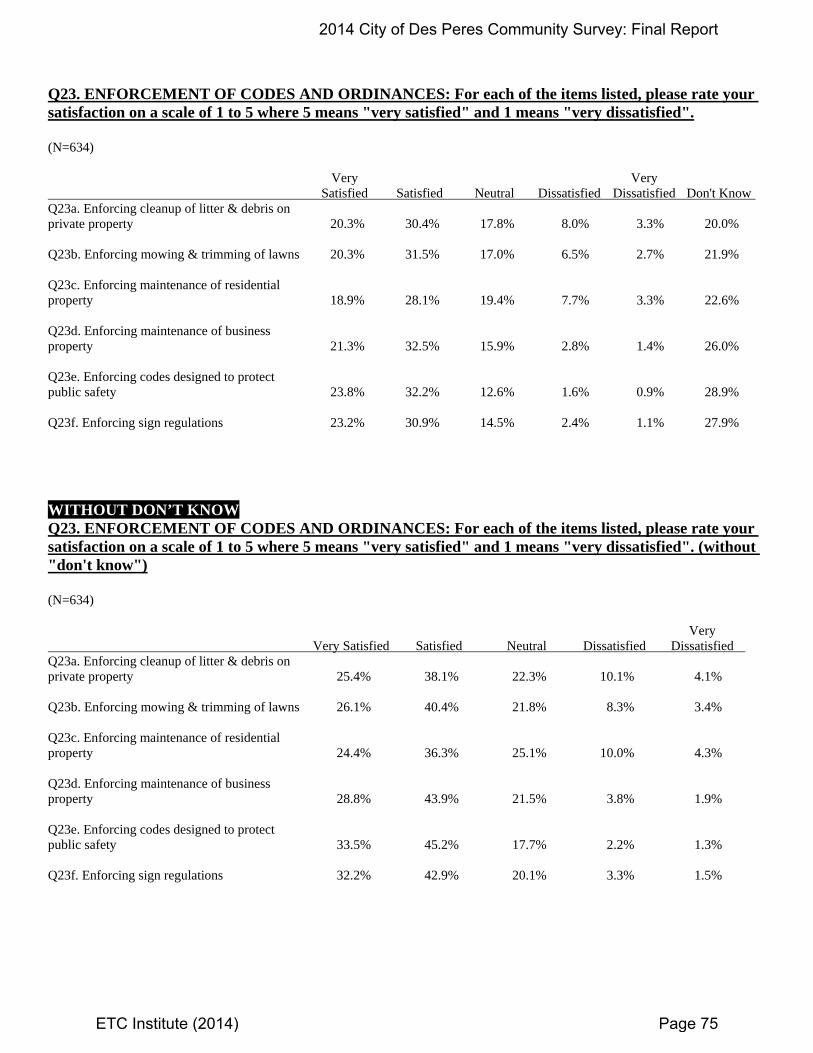
Q23. ENFORCEMENT OF CODES AND ORDINANCES: For each of the items listed, please rate your satisfaction on a scale of 1 to 5 where 5 means "very satisfied" and 1 means "very dissatisfied". (N=634) Very Very Satisfied Satisfied Neutral Dissatisfied Dissatisfied Don't Know Q23a. Enforcing cleanup of litter & debris on private property 20.3% 30.4% 17.8% 8.0% 3.3% 20.0% Q23b. Enforcing mowing & trimming of lawns 20.3% 31.5% 17.0% 6.5% 2.7% 21.9% Q23c. Enforcing maintenance of residential property 18.9% 28.1% 19.4% 7.7% 3.3% 22.6% Q23d. Enforcing maintenance of business property 21.3% 32.5% 15.9% 2.8% 1.4% 26.0% Q23e. Enforcing codes designed to protect public safety 23.8% 32.2% 12.6% 1.6% 0.9% 28.9% Q23f. Enforcing sign regulations 23.2% 30.9% 14.5% 2.4% 1.1% 27.9%
WITHOUT DON’T KNOW Q23. ENFORCEMENT OF CODES AND ORDINANCES: For each of the items listed, please rate your satisfaction on a scale of 1 to 5 where 5 means "very satisfied" and 1 means "very dissatisfied". (without "don't know") (N=634) Very Very Satisfied Satisfied Neutral Dissatisfied Dissatisfied Q23a. Enforcing cleanup of litter & debris on private property 25.4% 38.1% 22.3% 10.1% 4.1% Q23b. Enforcing mowing & trimming of lawns 26.1% 40.4% 21.8% 8.3% 3.4% Q23c. Enforcing maintenance of residential property 24.4% 36.3% 25.1% 10.0% 4.3% Q23d. Enforcing maintenance of business property 28.8% 43.9% 21.5% 3.8% 1.9% Q23e. Enforcing codes designed to protect public safety 33.5% 45.2% 17.7% 2.2% 1.3% Q23f. Enforcing sign regulations 32.2% 42.9% 20.1% 3.3% 1.5%
2014 City of Des Peres Community Survey: Final Report
ETC Institute (2014) Page 75
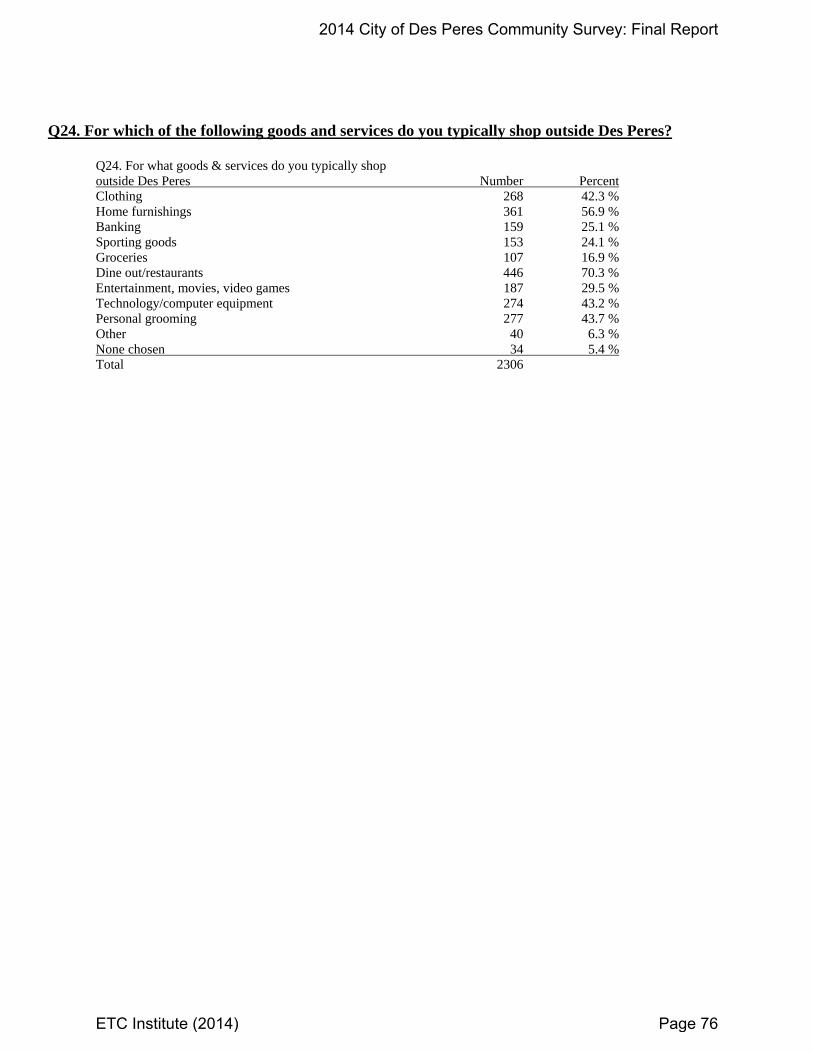
Q24. For which of the following goods and services do you typically shop outside Des Peres? Q24. For what goods & services do you typically shop outside Des Peres Number Percent Clothing 268 42.3 % Home furnishings 361 56.9 % Banking 159 25.1 % Sporting goods 153 24.1 % Groceries 107 16.9 % Dine out/restaurants 446 70.3 % Entertainment, movies, video games 187 29.5 % Technology/computer equipment 274 43.2 % Personal grooming 277 43.7 % Other 40 6.3 % None chosen 34 5.4 % Total 2306
2014 City of Des Peres Community Survey: Final Report
ETC Institute (2014) Page 76
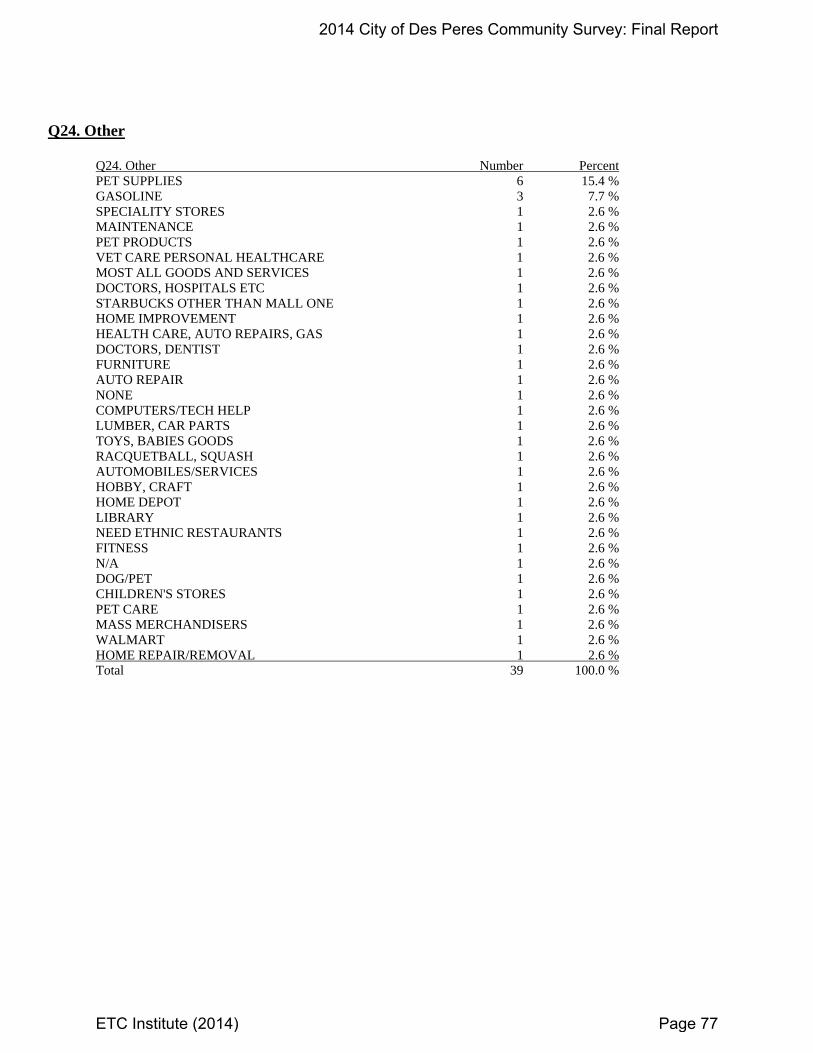
Q24. Other Q24. Other Number Percent PET SUPPLIES 6 15.4 % GASOLINE 3 7.7 % SPECIALITY STORES 1 2.6 % MAINTENANCE 1 2.6 % PET PRODUCTS 1 2.6 % VET CARE PERSONAL HEALTHCARE 1 2.6 % MOST ALL GOODS AND SERVICES 1 2.6 % DOCTORS, HOSPITALS ETC 1 2.6 % STARBUCKS OTHER THAN MALL ONE 1 2.6 % HOME IMPROVEMENT 1 2.6 % HEALTH CARE, AUTO REPAIRS, GAS 1 2.6 % DOCTORS, DENTIST 1 2.6 % FURNITURE 1 2.6 % AUTO REPAIR 1 2.6 % NONE 1 2.6 % COMPUTERS/TECH HELP 1 2.6 % LUMBER, CAR PARTS 1 2.6 % TOYS, BABIES GOODS 1 2.6 % RACQUETBALL, SQUASH 1 2.6 % AUTOMOBILES/SERVICES 1 2.6 % HOBBY, CRAFT 1 2.6 % HOME DEPOT 1 2.6 % LIBRARY 1 2.6 % NEED ETHNIC RESTAURANTS 1 2.6 % FITNESS 1 2.6 % N/A 1 2.6 % DOG/PET 1 2.6 % CHILDREN'S STORES 1 2.6 % PET CARE 1 2.6 % MASS MERCHANDISERS 1 2.6 % WALMART 1 2.6 % HOME REPAIR/REMOVAL 1 2.6 % Total 39 100.0 %
2014 City of Des Peres Community Survey: Final Report
ETC Institute (2014) Page 77
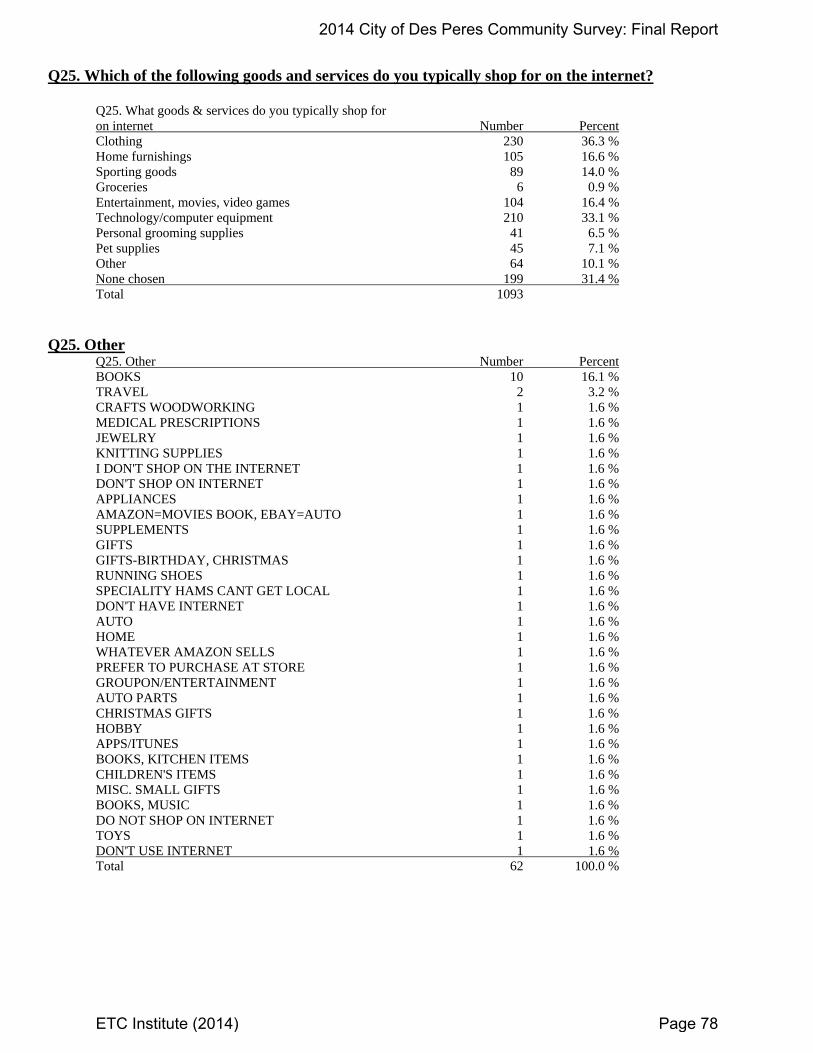
Q25. Which of the following goods and services do you typically shop for on the internet? Q25. What goods & services do you typically shop for on internet Number Percent Clothing 230 36.3 % Home furnishings 105 16.6 % Sporting goods 89 14.0 % Groceries 6 0.9 % Entertainment, movies, video games 104 16.4 % Technology/computer equipment 210 33.1 % Personal grooming supplies 41 6.5 % Pet supplies 45 7.1 % Other 64 10.1 % None chosen 199 31.4 % Total 1093 Q25. Other Q25. Other Number Percent BOOKS 10 16.1 % TRAVEL 2 3.2 % CRAFTS WOODWORKING 1 1.6 % MEDICAL PRESCRIPTIONS 1 1.6 % JEWELRY 1 1.6 % KNITTING SUPPLIES 1 1.6 % I DON'T SHOP ON THE INTERNET 1 1.6 % DON'T SHOP ON INTERNET 1 1.6 % APPLIANCES 1 1.6 % AMAZON=MOVIES BOOK, EBAY=AUTO 1 1.6 % SUPPLEMENTS 1 1.6 % GIFTS 1 1.6 % GIFTS-BIRTHDAY, CHRISTMAS 1 1.6 % RUNNING SHOES 1 1.6 % SPECIALITY HAMS CANT GET LOCAL 1 1.6 % DON'T HAVE INTERNET 1 1.6 % AUTO 1 1.6 % HOME 1 1.6 % WHATEVER AMAZON SELLS 1 1.6 % PREFER TO PURCHASE AT STORE 1 1.6 % GROUPON/ENTERTAINMENT 1 1.6 % AUTO PARTS 1 1.6 % CHRISTMAS GIFTS 1 1.6 % HOBBY 1 1.6 % APPS/ITUNES 1 1.6 % BOOKS, KITCHEN ITEMS 1 1.6 % CHILDREN'S ITEMS 1 1.6 % MISC. SMALL GIFTS 1 1.6 % BOOKS, MUSIC 1 1.6 % DO NOT SHOP ON INTERNET 1 1.6 % TOYS 1 1.6 % DON'T USE INTERNET 1 1.6 % Total 62 100.0 %
2014 City of Des Peres Community Survey: Final Report
ETC Institute (2014) Page 78
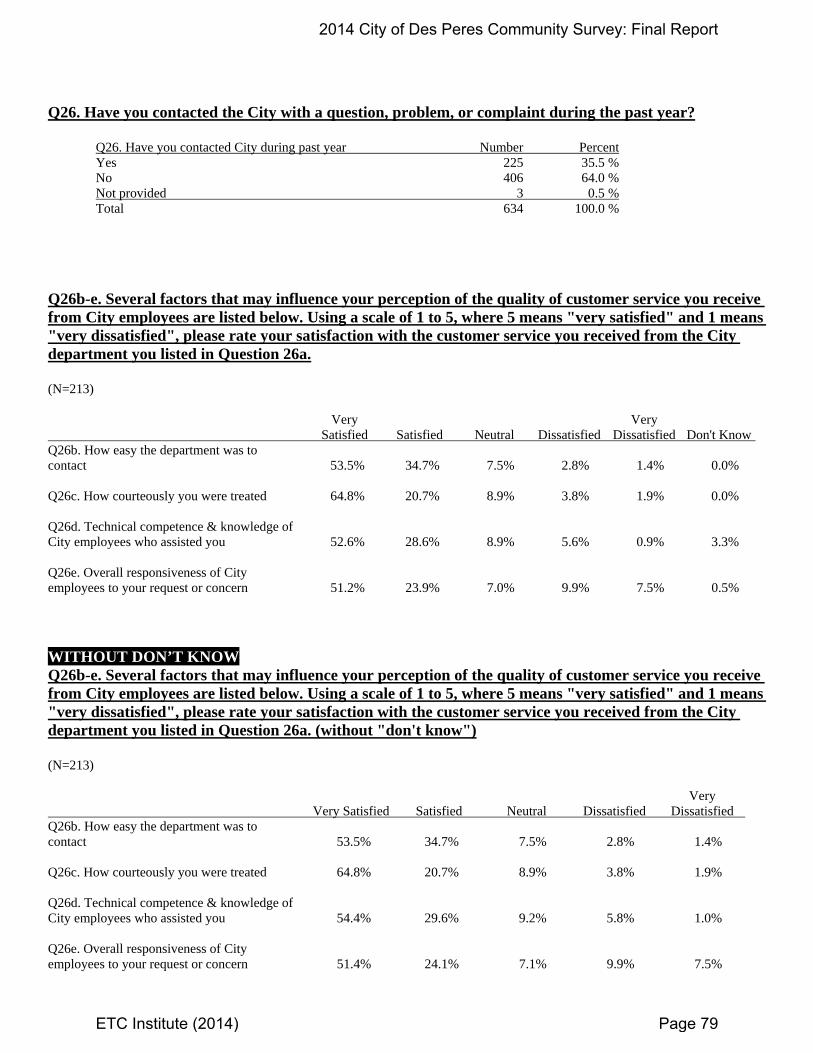
Q26. Have you contacted the City with a question, problem, or complaint during the past year? Q26. Have you contacted City during past year Number Percent Yes 225 35.5 % No 406 64.0 % Not provided 3 0.5 % Total 634 100.0 % Q26b-e. Several factors that may influence your perception of the quality of customer service you receive from City employees are listed below. Using a scale of 1 to 5, where 5 means "very satisfied" and 1 means "very dissatisfied", please rate your satisfaction with the customer service you received from the City department you listed in Question 26a. (N=213) Very Very Satisfied Satisfied Neutral Dissatisfied Dissatisfied Don't Know Q26b. How easy the department was to contact 53.5% 34.7% 7.5% 2.8% 1.4% 0.0% Q26c. How courteously you were treated 64.8% 20.7% 8.9% 3.8% 1.9% 0.0% Q26d. Technical competence & knowledge of City employees who assisted you 52.6% 28.6% 8.9% 5.6% 0.9% 3.3% Q26e. Overall responsiveness of City employees to your request or concern 51.2% 23.9% 7.0% 9.9% 7.5% 0.5% WITHOUT DON’T KNOW Q26b-e. Several factors that may influence your perception of the quality of customer service you receive from City employees are listed below. Using a scale of 1 to 5, where 5 means "very satisfied" and 1 means "very dissatisfied", please rate your satisfaction with the customer service you received from the City department you listed in Question 26a. (without "don't know") (N=213) Very Very Satisfied Satisfied Neutral Dissatisfied Dissatisfied Q26b. How easy the department was to contact 53.5% 34.7% 7.5% 2.8% 1.4% Q26c. How courteously you were treated 64.8% 20.7% 8.9% 3.8% 1.9% Q26d. Technical competence & knowledge of City employees who assisted you 54.4% 29.6% 9.2% 5.8% 1.0% Q26e. Overall responsiveness of City employees to your request or concern 51.4% 24.1% 7.1% 9.9% 7.5%
2014 City of Des Peres Community Survey: Final Report
ETC Institute (2014) Page 79
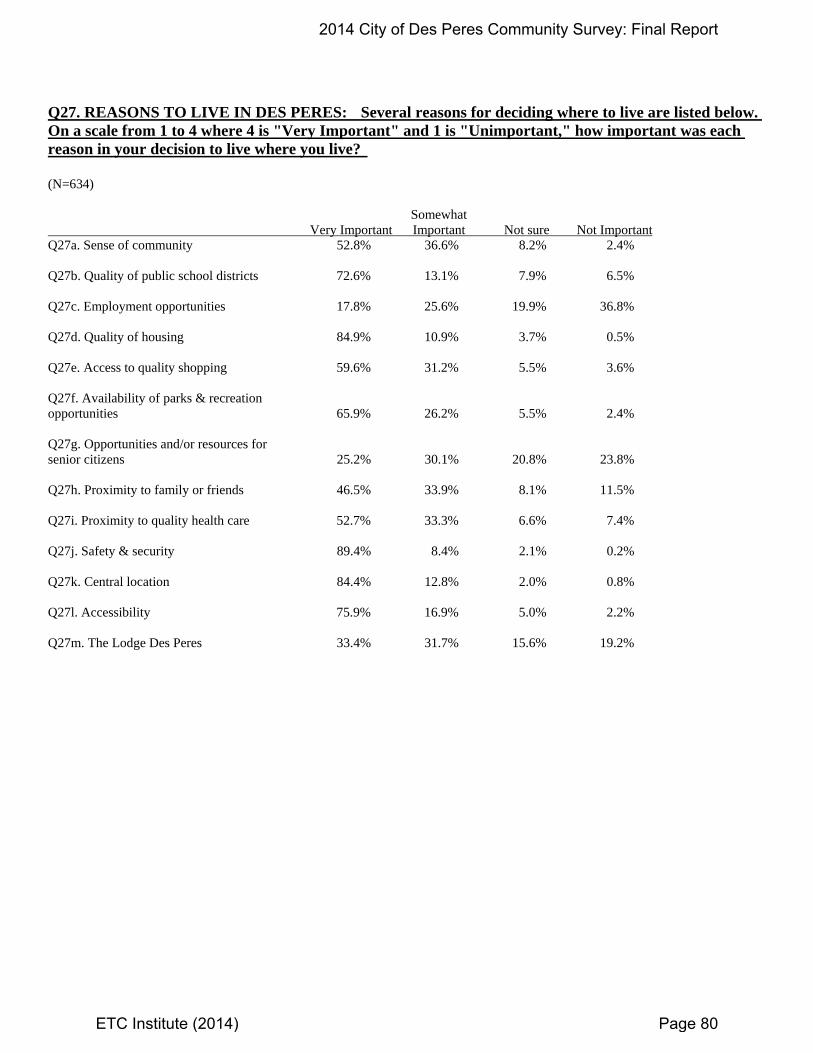
Q27. REASONS TO LIVE IN DES PERES: Several reasons for deciding where to live are listed below. On a scale from 1 to 4 where 4 is "Very Important" and 1 is "Unimportant," how important was each reason in your decision to live where you live? (N=634) Somewhat Very Important Important Not sure Not Important Q27a. Sense of community 52.8% 36.6% 8.2% 2.4% Q27b. Quality of public school districts 72.6% 13.1% 7.9% 6.5% Q27c. Employment opportunities 17.8% 25.6% 19.9% 36.8% Q27d. Quality of housing 84.9% 10.9% 3.7% 0.5% Q27e. Access to quality shopping 59.6% 31.2% 5.5% 3.6% Q27f. Availability of parks & recreation opportunities 65.9% 26.2% 5.5% 2.4% Q27g. Opportunities and/or resources for senior citizens 25.2% 30.1% 20.8% 23.8% Q27h. Proximity to family or friends 46.5% 33.9% 8.1% 11.5% Q27i. Proximity to quality health care 52.7% 33.3% 6.6% 7.4% Q27j. Safety & security 89.4% 8.4% 2.1% 0.2% Q27k. Central location 84.4% 12.8% 2.0% 0.8% Q27l. Accessibility 75.9% 16.9% 5.0% 2.2% Q27m. The Lodge Des Peres 33.4% 31.7% 15.6% 19.2%
2014 City of Des Peres Community Survey: Final Report
ETC Institute (2014) Page 80
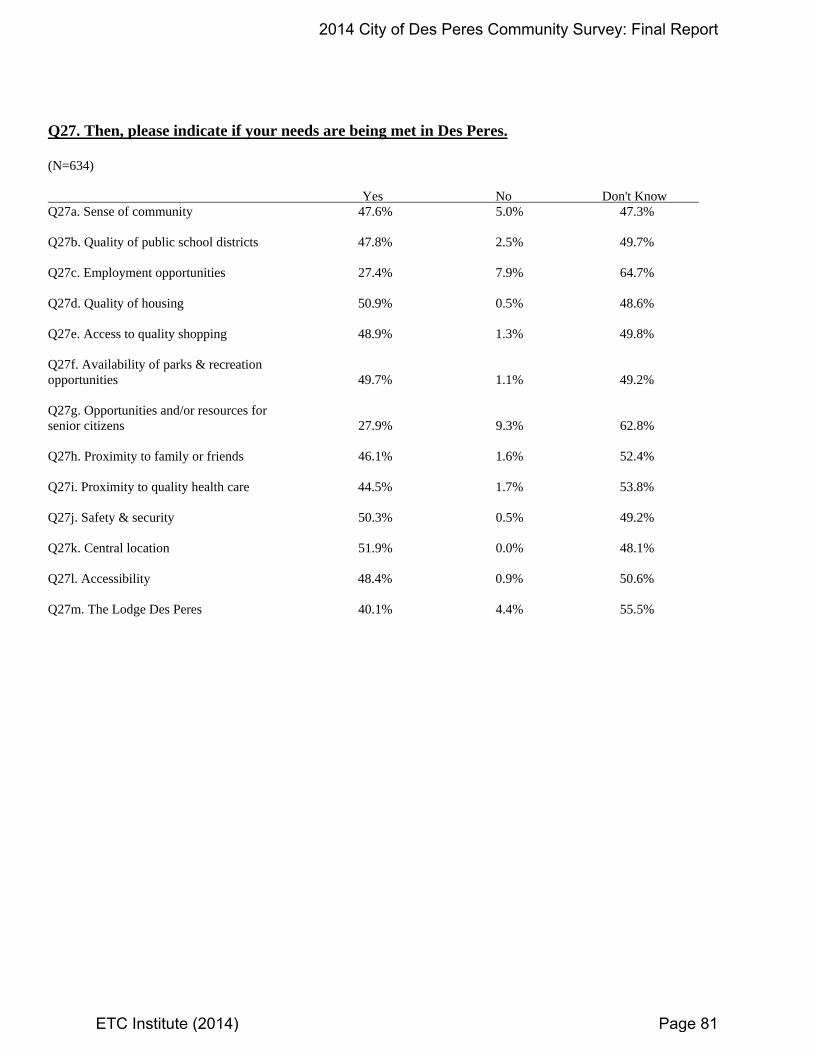
Q27. Then, please indicate if your needs are being met in Des Peres. (N=634) Yes No Don't Know Q27a. Sense of community 47.6% 5.0% 47.3% Q27b. Quality of public school districts 47.8% 2.5% 49.7% Q27c. Employment opportunities 27.4% 7.9% 64.7% Q27d. Quality of housing 50.9% 0.5% 48.6% Q27e. Access to quality shopping 48.9% 1.3% 49.8% Q27f. Availability of parks & recreation opportunities 49.7% 1.1% 49.2% Q27g. Opportunities and/or resources for senior citizens 27.9% 9.3% 62.8% Q27h. Proximity to family or friends 46.1% 1.6% 52.4% Q27i. Proximity to quality health care 44.5% 1.7% 53.8% Q27j. Safety & security 50.3% 0.5% 49.2% Q27k. Central location 51.9% 0.0% 48.1% Q27l. Accessibility 48.4% 0.9% 50.6% Q27m. The Lodge Des Peres 40.1% 4.4% 55.5%
2014 City of Des Peres Community Survey: Final Report
ETC Institute (2014) Page 81
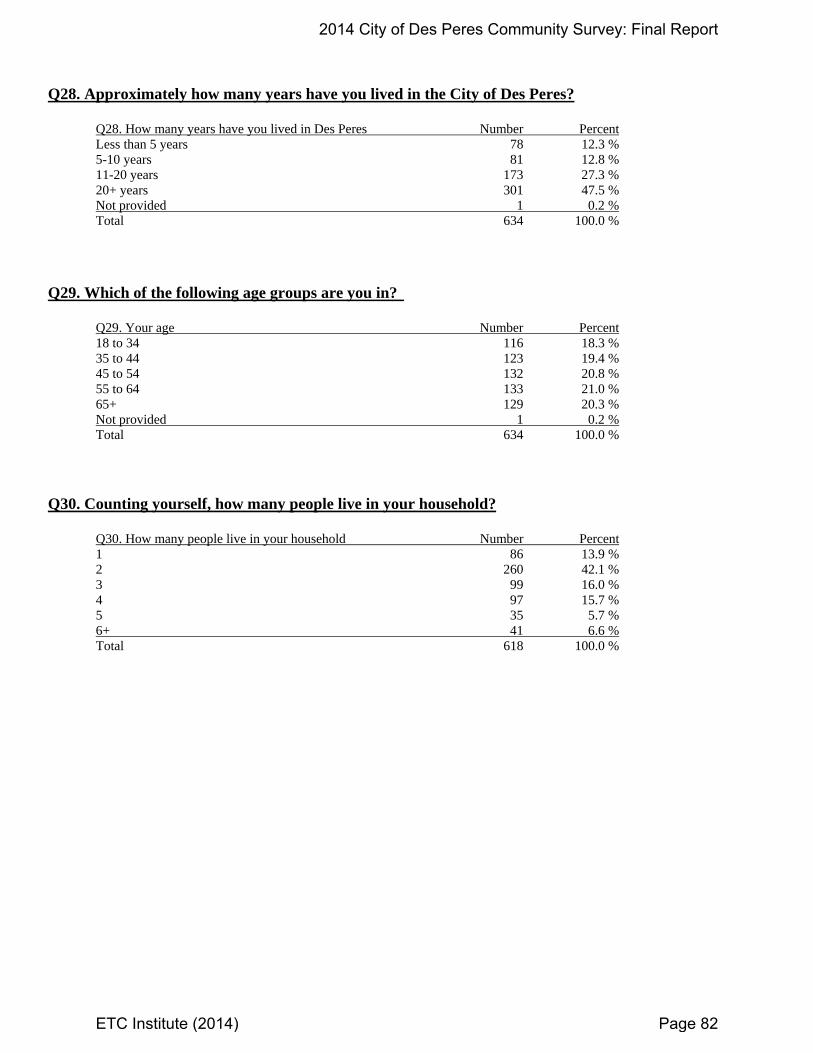
Q28. Approximately how many years have you lived in the City of Des Peres? Q28. How many years have you lived in Des Peres Number Percent Less than 5 years 78 12.3 % 5-10 years 81 12.8 % 11-20 years 173 27.3 % 20+ years 301 47.5 % Not provided 1 0.2 % Total 634 100.0 %
Q29. Which of the following age groups are you in? Q29. Your age Number Percent 18 to 34 116 18.3 % 35 to 44 123 19.4 % 45 to 54 132 20.8 % 55 to 64 133 21.0 % 65+ 129 20.3 % Not provided 1 0.2 % Total 634 100.0 % Q30. Counting yourself, how many people live in your household? Q30. How many people live in your household Number Percent 1 86 13.9 % 2 260 42.1 % 3 99 16.0 % 4 97 15.7 % 5 35 5.7 % 6+ 41 6.6 % Total 618 100.0 %
2014 City of Des Peres Community Survey: Final Report
ETC Institute (2014) Page 82
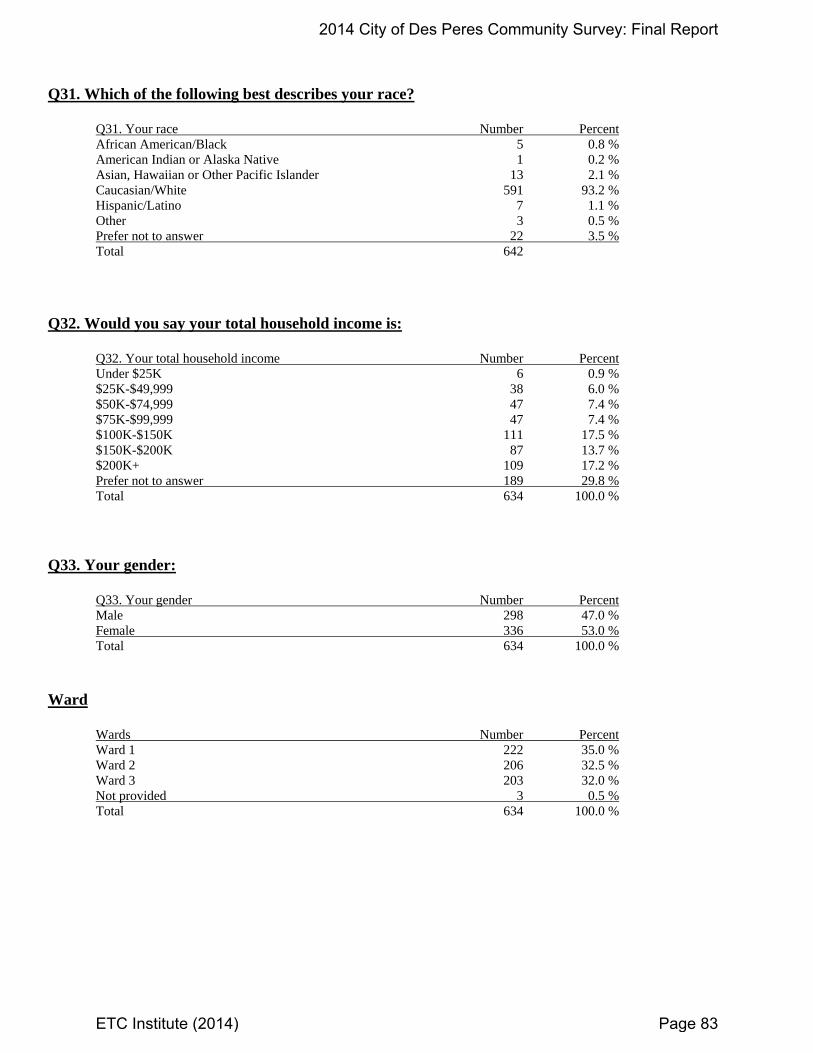
Q31. Which of the following best describes your race? Q31. Your race Number Percent African American/Black 5 0.8 % American Indian or Alaska Native 1 0.2 % Asian, Hawaiian or Other Pacific Islander 13 2.1 % Caucasian/White 591 93.2 % Hispanic/Latino 7 1.1 % Other 3 0.5 % Prefer not to answer 22 3.5 % Total 642 Q32. Would you say your total household income is: Q32. Your total household income Number Percent Under $25K 6 0.9 % $25K-$49,999 38 6.0 % $50K-$74,999 47 7.4 % $75K-$99,999 47 7.4 % $100K-$150K 111 17.5 % $150K-$200K 87 13.7 % $200K+ 109 17.2 % Prefer not to answer 189 29.8 % Total 634 100.0 % Q33. Your gender: Q33. Your gender Number Percent Male 298 47.0 % Female 336 53.0 % Total 634 100.0 % Ward Wards Number Percent Ward 1 222 35.0 % Ward 2 206 32.5 % Ward 3 203 32.0 % Not provided 3 0.5 % Total 634 100.0 %
2014 City of Des Peres Community Survey: Final Report
ETC Institute (2014) Page 83
Section 5: Survey Instrument
2014 City of Des Peres Community Survey: Final Report
ETC Institute (2014) Page 84
1.
Up
A.
B.
C.
D.
E.
F.
G.
H.
I.
J.
K.
L.
2. W[
3. O
Ut
A.
B.
C.
D.
E.
F.
G.
H.
I.
J.
PUBL4. D
_
4 5. Du
_
5
OVERALL SAT
Using a scale oplease rate you
Overall quali
Overall quali
Overall quali
Overall main
Overall main
Overall appe
Overall enfo
Overall flow
Overall quali
Overall value
Overall effec
Overall comm
Which THREE oWrite in the le
OVERALL PERCE
Using a scale othe City of Des
As a place to
As a place to
As a place to
As a place to
As a place to
As a place to
Overall qual
Overall feeli
Overall qual
Overall appe
LIC SAFETY ISSUuring the past_____ (1) Yes [g
4a. If “yes”, di
uring the past _____ (1) Yes [g
5a. If “yes”, ho_____ (1) E
20
Pleaseof the have qJennife
ISFACTION WI
of 1 to 5, whereur satisfaction
ity of public sa
ity of City park
ity of Recreatio
ntenance of Cit
ntenance of Cit
earance of City
rcement of bu
of traffic and e
ity of customer
e that you rece
ctiveness of Cit
munity plannin
of these items etters below u
EPTION OF TH
of 1 to 5, wheres Peres with re
o live
o raise children
o work
o retire
o shop for good
o dine
ity of life in the
ng of safety in
ity of new dev
earance of the
UES 12 months, wgo to Q4a]
id you report a
12 months, hago to Q5a]
ow would youExcellent ___
014 City
e take a few City's ongoiquestions, per Gray, at (
ITH CITY SERVI
e 5 means “Vewith each of t
fety services (p
s
on Facilities an
ty streets
ty Sidewalks
Buildings
ilding, propert
ease of getting
r service you re
eive for City Se
ty communicat
ng and develop
do you think ssing the letter
E CITY
e 5 means “Exegard to the fo
n
ds and services
e City
the City
elopment in th
City
were you or any_____ (2) No
all of these crim
ave you had A ____
rate the conta___ (2) Good
y of Des
minutes to ing effort tolease contac314) 835‐61
ICES
ery Satisfied” athe services lis
police, fire and
d Programs
ty and mainten
g around the ci
eceive from Cit
rvices
tion with the p
pment
should receivers from the list
1st
cellent” and 1llowing:
s
he City
yone in your ho [go to Q5]
mes to the pol
NY contact wit__ (2) No [go to
act? _____ (3) Fai
Peres C
complete tho identify anct the City o132.
and 1 means “Vsted below.
d ambulance)
nance ordinanc
ty
ty employees
ublic
e the most empt in Question 1
2nd
means “Poor”
household the _____ (3) Don
lice? _____ (1
th the Police Do Q6] ____
r _____ (4) P
Commu
his survey. Yd respond tof Des Peres
Very Dissatisfi
ces
phasis from Ci1 above.]
3rd
”, please rate
victim of any n’t know [go to
1) Yes ____
Department? __ (3) Don’t kno
Poor _____
unity Su
Your input io resident cAssistant Ci
ied,”
Very Satisfied
5
5
5
5
5
5
5
5
5
5
5
5
ity leaders ove
Excellent
5
5
5
5
5
5
5
5
5
5
crime? o Q5]
__ (2) No __
ow [go to Q6]
(5) Don’t know
urvey
s an importaconcerns. If yity Administ
Satisfied
Neu
tral f
d
4 3
4 3
4 3
4 3
4 3
4 3
4 3
4 3
4 3
4 3
4 3
4 3
er the next TW
Good
Neu
tral
Below
4 3
4 3
4 3
4 3
4 3
4 3
4 3
4 3
4 3
4 3
____ (3) Don’t
w
Page1
ant part you trator,
Dissatisfied
Very
Dissatisfied
2 1
2 1
2 1
2 1
2 1
2 1
2 1
2 1
2 1
2 1
2 1
2 1
WO Years?
Below
Average
Poor
2 1
2 1
2 1
2 1
2 1
2 1
2 1
2 1
2 1
2 1
know
1
Don't Know
9
9
9
9
9
9
9
9
9
9
9
9
Don't
Know
9
9
9
9
9
9
9
9
9
9
Page2
6. During the past 12 months, have you had ANY contact with the Fire Department? _____ (1) Yes [go to Q6a] _____ (2) No [go to Q7] _____ (3) Don’t know [go to Q7] 6a. If “yes”, how would you rate the contact?
_____ (1) Excellent _____ (2) Good _____ (3) Fair _____ (4) Poor _____ (5) Don’t know
7. During the past 12 months, have you had ANY contact with the ambulance/emergency medical services in Des Peres?
_____ (1) Yes [go to Q7a] _____ (2) No [go to Q8] _____ (3) Don’t know [go to Q8] 7a. If “yes”, how would you rate the contact?
_____ (1) Excellent _____ (2) Good _____ (3) Fair _____ (4) Poor _____ (5) Don’t know
9. Which THREE of the public safety items listed above do you think should receive the most emphasis from City leaders over the
next TWO Years? [Write in the letters below using the letters from the list in Question 8 above.]
1st 2nd 3rd
10. How safe do you feel: Using a scale of 1 to 4 where 4 means “very safe” and 1 means “very unsafe,” please rate how safe you feel in the following situations:
Very Safe Somewhat
Safe Somewhat Unsafe
Very
Unsafe
Don’t
Know
A. Walking alone in your neighborhood in general 4 3 2 1 9
B. Walking alone in your neighborhood after dark 4 3 2 1 9
C. Walking alone in your neighborhood during the day 4 3 2 1 9
D. Walking alone in business areas after dark 4 3 2 1 9
E. Walking alone in business areas during the day 4 3 2 1 9
F. Your overall feeling of safety in Des Peres 4 3 2 1 9
G. While shopping at West County Center 4 3 2 1 9
11. Have you ever participated in any of the following police initiatives/outreach programs in Des Peres? [Select all that apply.]____ (A) Business Watch ____ (B) Personal Property Inventory ____ (C) Project Childsafe ____ (D) Citizen Police Academy
____ (E) Child Safety Seat Installations/ Inspections ____ (F) Crisis Intervention Team (CIT) ____ (G) Neighborhood Watch
____ (H) Community Emergency Response Team (C.E.R.T.) ____ (I) Des Peres Night Out ____ (J) Vacation Watch
8. PUBLIC SAFETY (Police, Fire and EMS)
Using a scale of 1 to 5, where 5 means “Very Satisfied” and 1 means “Very Dissatisfied,” please rate your satisfaction with the following public safety services: V
ery Satisfied
Satisfied
Neu
tral
Dissatisfied
Very
Dissatisfied
Don't Know
A. Overall performance of the Des Peres Police Department 5 4 3 2 1 9
B. Overall quality of local police protection 5 4 3 2 1 9
C. The visibility of police in neighborhoods 5 4 3 2 1 9
D. The visibility of police in retail shopping areas 5 4 3 2 1 9
E. The City’s efforts to prevent crime 5 4 3 2 1 9
F. Overall attitude and behavior of Police Department personnel toward citizens 5 4 3 2 1 9
G. Enforcement of local traffic laws 5 4 3 2 1 9
H. Overall quality of Des Peres fire department 5 4 3 2 1 9
I. Overall quality of Des Peres EMS 5 4 3 2 1 9
J. City’s efforts to prevent fires and provide safety and injury prevention education 5 4 3 2 1 9
K. How quickly the Fire Department responds to emergencies 5 4 3 2 1 9
L. How quickly the Police Department responds to emergencies 5 4 3 2 1 9
Page 3
12. Do you have an emergency plan in place for members of your household?
_____ (1) Yes _____ (2) No _____ (3) Don’t know
13. MAINTENANCE
For each of the items listed, please rate your satisfaction on a scale of 1 to 5, where 5 means "Very Satisfied" and 1 means "Very Dissatisfied." V
ery
Satisfied
Satisfied
Neu
tral
Dissatisfied
Very
Dissatisfied
Don't
Know
A. Maintenance of major City streets 5 4 3 2 1 9
B. Maintenance of streets in your neighborhood 5 4 3 2 1 9
C. Maintenance of City traffic signals/street signs 5 4 3 2 1 9
D. Maintenance of City buildings 5 4 3 2 1 9
E. Snow removal on major City streets 5 4 3 2 1 9
F. Snow removal on neighborhood streets 5 4 3 2 1 9
G. Overall cleanliness of City streets and other public areas 5 4 3 2 1 9
H. Availability of pedestrian walkways/sidewalks 5 4 3 2 1 9
I. Condition of City sidewalks 5 4 3 2 1 9
J. Landscaping/appearance of public areas along City streets 5 4 3 2 1 9
K. Satisfaction with tree trimming/ removals (on City right of way) 5 4 3 2 1 9
14. Which THREE of the maintenance items listed above do you think should receive the most emphasis from City leaders over the
next TWO Years? [Write in the letters below using the letters from the list in Question 13 above.]
1st 2nd 3rd
15. In general, how would you rate the street and road conditions in your neighborhood? ____ (1) Good condition ____ (2) Mostly good condition ____ (3) Many bad spots ____ (4) Don’t know
16. PARKS AND RECREATION For each of the items listed, please rate your satisfaction on a scale of 1 to 5 where 5 means "very satisfied" and 1 means "very dissatisfied.
Very Satisfied
Satisfied Neutral Dissatisfied Very
DissatisfiedDon't Know
A. Maintenance of City parks 5 4 3 2 1 9
B. Number of parks 5 4 3 2 1 9
C. Number of walking/biking trails 5 4 3 2 1 9
D. Quality of outdoor athletic fields 5 4 3 2 1 9
E. Number of outdoor athletic fields 5 4 3 2 1 9
F. Number of playgrounds 5 4 3 2 1 9
G. Quality of playgrounds 5 4 3 2 1 9
H. Availability of information about City parks and recreation programs
5 4 3 2 1 9
I. City recreation opportunities 5 4 3 2 1 9
J. Special events and festivals (Concerts in the Park, Fall Festival, Egg Hunt, Arbor Day Celebration, etc.)
5 4 3 2 1 9
K. The Lodge Des Peres 5 4 3 2 1 9
17. Which THREE of the parks and recreation items listed above do you think should receive the most emphasis from City leaders over the next TWO Years? [Write in the letters below using the letters from the list in Question 16 above.]
1st 2nd 3rd
Page 4
18. THE LODGE DES PERES For each of the items listed, please rate your satisfaction on a scale of 1 to 5 where 5 means "very satisfied" and 1 means "very dissatisfied.
Very Satisfied
Satisfied Neutral Dissatisfied Very
DissatisfiedDon't Know
A. The Lodge Des Peres facility as a whole 5 4 3 2 1 9
B. Availability and quality of information on The Lodge Des Peres Programs and Classes
5 4 3 2 1 9
C. Availability of meeting space/rental facilities 5 4 3 2 1 9
D. Quality of meeting space/rental facilities 5 4 3 2 1 9
E. Fitness Center 5 4 3 2 1 9
F. Indoor Aquatic Facilities 5 4 3 2 1 9
G. Outdoor Aquatic Facilities 5 4 3 2 1 9
H. Quality of Youth Programs 5 4 3 2 1 9
I. Quality of Adult Programs 5 4 3 2 1 9
J. Value or Fee Structure of Recreation Programs/Classes 5 4 3 2 1 9
K. Cleanliness of The Lodge 5 4 3 2 1 9
L. Customer Service provided by The Lodge Des Peres Staff 5 4 3 2 1 9
19. Which THREE of The Lodge Des Peres items listed above do you think should receive the most emphasis from City leaders over
the next TWO years? (Write in the letters from the list in Question 18 above.)
1st 2nd 3rd
20. Are you a member of The Lodge Des Peres? ___ (1) Yes
____(2) No – answer #20a.
20a. [IF NO] Why not? ___(1) Wouldn’t Use it enough to Warrant Cost ___(2) Prefer to Pay Daily Fee ___(2) Membership Fee too high ___(2) Belong to other Public Facility ___(2) Belong to other Private Facility ___(2) Other, please state: __________________ 21. Which of the following do you use to get information about the City of Des Peres? [Select all that apply.]
___ (A) The City of Des Peres Newsletter ____(B) The City Website (www.desperesmo.org)
____(C) The Quarterly Activity Guide brochure ____(D) The Lodge Link (email) ____(E) The Webster‐Kirkwood Times ____(F) Neighborhood meetings ____(G) Facebook ____(H) Twitter ____(I) Notify Me ____(J) Other printed publications, materials from the City ____(K) Other online publications, materials from the City
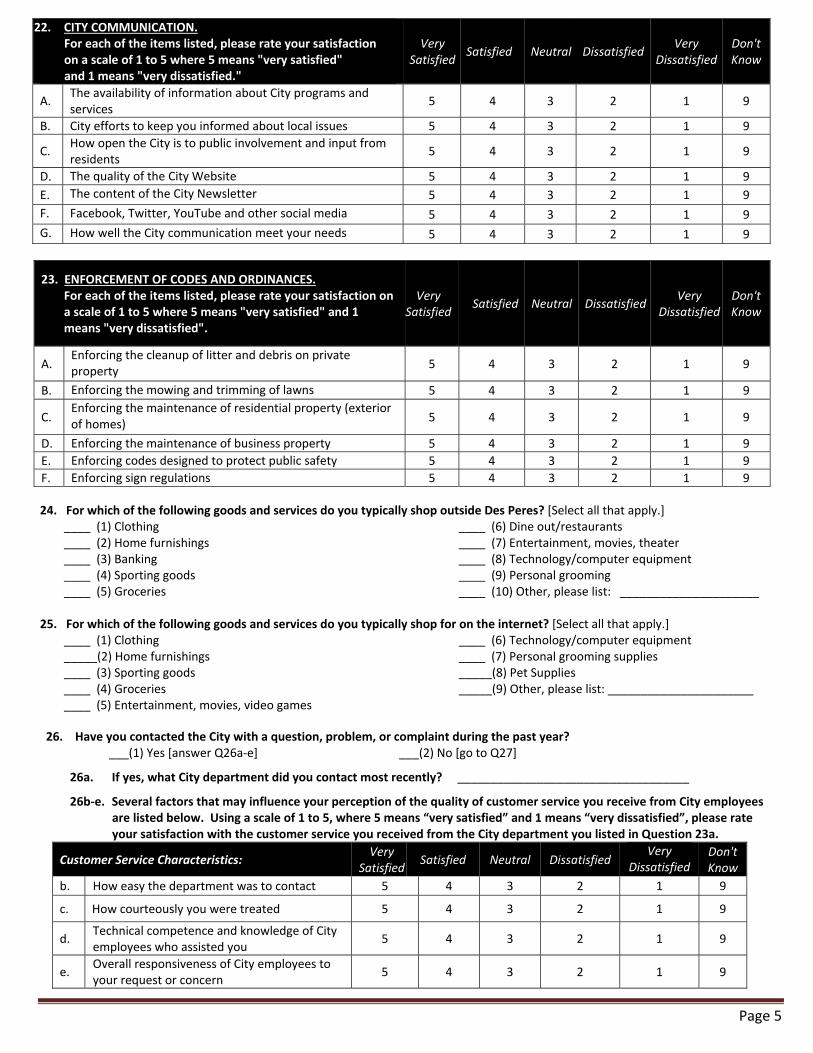
Page 5
22. CITY COMMUNICATION. For each of the items listed, please rate your satisfaction on a scale of 1 to 5 where 5 means "very satisfied" and 1 means "very dissatisfied."
Very Satisfied
Satisfied Neutral Dissatisfied Very
DissatisfiedDon't Know
A. The availability of information about City programs and services
5 4 3 2 1 9
B. City efforts to keep you informed about local issues 5 4 3 2 1 9
C. How open the City is to public involvement and input from residents
5 4 3 2 1 9
D. The quality of the City Website 5 4 3 2 1 9
E. The content of the City Newsletter 5 4 3 2 1 9
F. Facebook, Twitter, YouTube and other social media 5 4 3 2 1 9
G. How well the City communication meet your needs 5 4 3 2 1 9
23. ENFORCEMENT OF CODES AND ORDINANCES. For each of the items listed, please rate your satisfaction on a scale of 1 to 5 where 5 means "very satisfied" and 1 means "very dissatisfied".
Very Satisfied
Satisfied Neutral Dissatisfied Very
DissatisfiedDon't Know
A. Enforcing the cleanup of litter and debris on private property
5 4 3 2 1 9
B. Enforcing the mowing and trimming of lawns 5 4 3 2 1 9
C. Enforcing the maintenance of residential property (exterior of homes)
5 4 3 2 1 9
D. Enforcing the maintenance of business property 5 4 3 2 1 9
E. Enforcing codes designed to protect public safety 5 4 3 2 1 9
F. Enforcing sign regulations 5 4 3 2 1 9 24. For which of the following goods and services do you typically shop outside Des Peres? [Select all that apply.]
____ (1) Clothing ____ (2) Home furnishings ____ (3) Banking ____ (4) Sporting goods ____ (5) Groceries
____ (6) Dine out/restaurants ____ (7) Entertainment, movies, theater ____ (8) Technology/computer equipment ____ (9) Personal grooming ____ (10) Other, please list: _____________________
25. For which of the following goods and services do you typically shop for on the internet? [Select all that apply.]
____ (1) Clothing _____(2) Home furnishings
____ (3) Sporting goods ____ (4) Groceries ____ (5) Entertainment, movies, video games
____ (6) Technology/computer equipment ____ (7) Personal grooming supplies _____(8) Pet Supplies _____(9) Other, please list: ______________________
26. Have you contacted the City with a question, problem, or complaint during the past year?
___(1) Yes [answer Q26a‐e] ___(2) No [go to Q27]
26a. If yes, what City department did you contact most recently? ___________________________________
26b‐e. Several factors that may influence your perception of the quality of customer service you receive from City employees are listed below. Using a scale of 1 to 5, where 5 means “very satisfied” and 1 means “very dissatisfied”, please rate your satisfaction with the customer service you received from the City department you listed in Question 23a.
Customer Service Characteristics: Very
SatisfiedSatisfied Neutral Dissatisfied
VeryDissatisfied
Don't Know
b. How easy the department was to contact 5 4 3 2 1 9
c. How courteously you were treated 5 4 3 2 1 9
d. Technical competence and knowledge of City employees who assisted you
5 4 3 2 1 9
e. Overall responsiveness of City employees to your request or concern
5 4 3 2 1 9
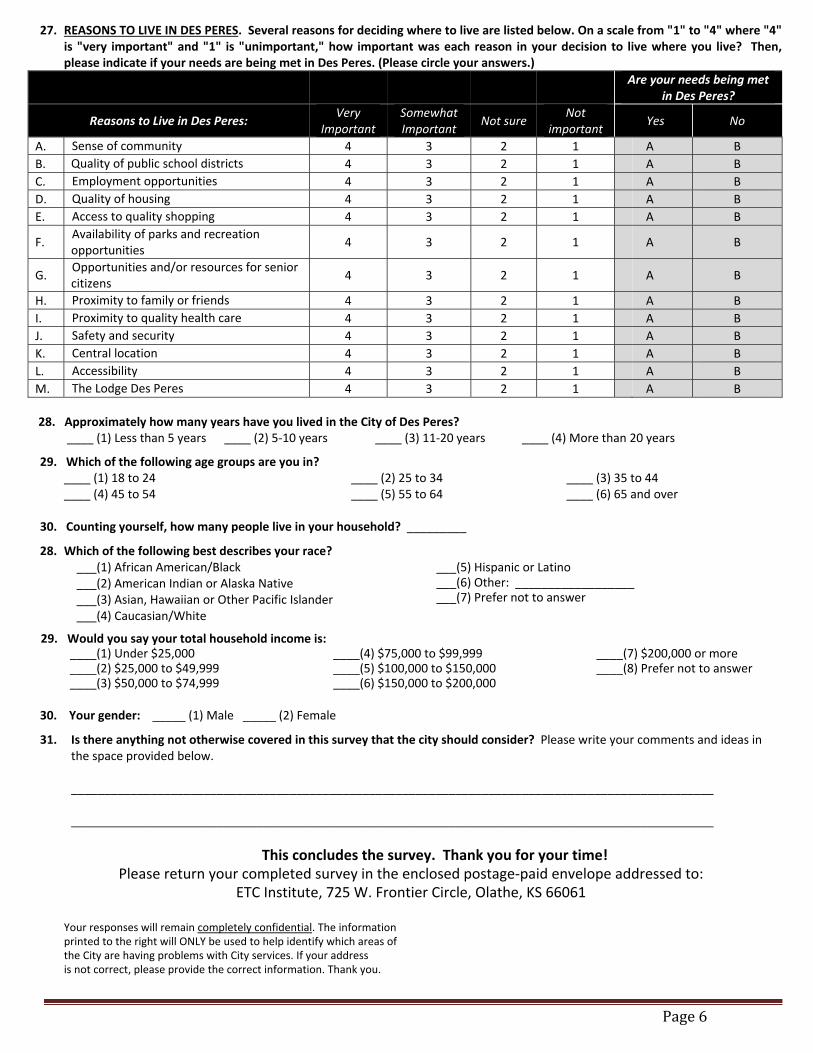
Page6
27. REASONS TO LIVE IN DES PERES. Several reasons for deciding where to live are listed below. On a scale from "1" to "4" where "4" is "very important" and "1" is "unimportant," how important was each reason in your decision to live where you live? Then, please indicate if your needs are being met in Des Peres. (Please circle your answers.)
Are your needs being met
in Des Peres?
Reasons to Live in Des Peres: Very
Important Somewhat Important
Not sure Not
important Yes No
A. Sense of community 4 3 2 1 A B
B. Quality of public school districts 4 3 2 1 A B
C. Employment opportunities 4 3 2 1 A B
D. Quality of housing 4 3 2 1 A B
E. Access to quality shopping 4 3 2 1 A B
F. Availability of parks and recreation opportunities
4 3 2 1 A B
G. Opportunities and/or resources for senior citizens
4 3 2 1 A B
H. Proximity to family or friends 4 3 2 1 A B
I. Proximity to quality health care 4 3 2 1 A B
J. Safety and security 4 3 2 1 A B
K. Central location 4 3 2 1 A B
L. Accessibility 4 3 2 1 A B
M. The Lodge Des Peres 4 3 2 1 A B
28. Approximately how many years have you lived in the City of Des Peres?
____ (1) Less than 5 years ____ (2) 5‐10 years ____ (3) 11‐20 years ____ (4) More than 20 years
29. Which of the following age groups are you in? ____ (1) 18 to 24 ____ (4) 45 to 54
____ (2) 25 to 34 ____ (5) 55 to 64
____ (3) 35 to 44 ____ (6) 65 and over
30. Counting yourself, how many people live in your household? _________
28. Which of the following best describes your race?___(1) African American/Black ___(2) American Indian or Alaska Native ___(3) Asian, Hawaiian or Other Pacific Islander ___(4) Caucasian/White
___(5) Hispanic or Latino ___(6) Other: __________________ ___(7) Prefer not to answer
29. Would you say your total household income is: ____(1) Under $25,000 ____(2) $25,000 to $49,999 ____(3) $50,000 to $74,999
____(4) $75,000 to $99,999 ____(5) $100,000 to $150,000 ____(6) $150,000 to $200,000
____(7) $200,000 or more ____(8) Prefer not to answer
30. Your gender: _____ (1) Male _____ (2) Female
31. Is there anything not otherwise covered in this survey that the city should consider? Please write your comments and ideas in the space provided below. _________________________________________________________________________________________________ _________________________________________________________________________________________________
This concludes the survey. Thank you for your time! Please return your completed survey in the enclosed postage‐paid envelope addressed to:
ETC Institute, 725 W. Frontier Circle, Olathe, KS 66061 Your responses will remain completely confidential. The information printed to the right will ONLY be used to help identify which areas of the City are having problems with City services. If your address is not correct, please provide the correct information. Thank you.
…he
SubETC 725 Olat
Jun
elping org
bmitted toInstitute W. Frontier Lthe, Kansas 6
ne 2014
20CA
ganization
o the City o
Lane, 66061
014omppe
ns make b
of Des Pere
4 Cimmuend
better dec
es, Missou
ity ounitdix A
cisions sin
uri by:
of Dty SA –
nce 1982
DesSurvGIS
A
s Pevey S M
Appen
eres–
Map
ndix A
s
ps
A
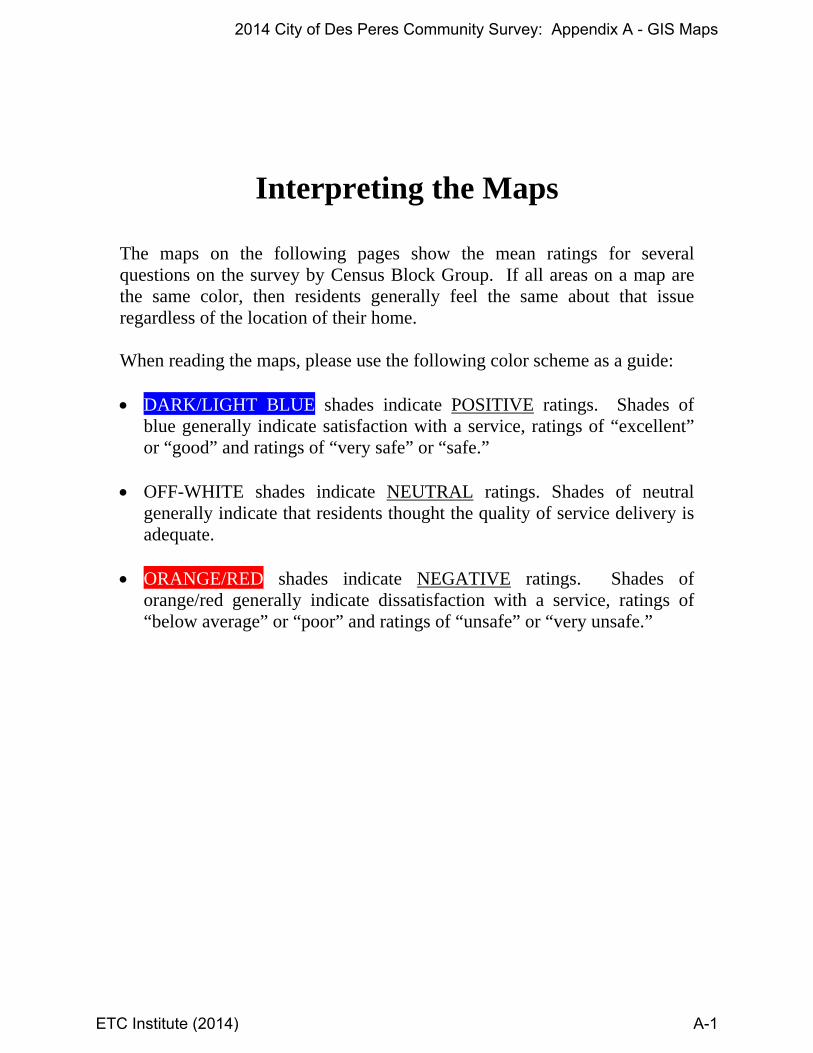
Interpreting the Maps
The maps on the following pages show the mean ratings for several questions on the survey by Census Block Group. If all areas on a map are the same color, then residents generally feel the same about that issue regardless of the location of their home. When reading the maps, please use the following color scheme as a guide: DARK/LIGHT BLUE shades indicate POSITIVE ratings. Shades of
blue generally indicate satisfaction with a service, ratings of “excellent” or “good” and ratings of “very safe” or “safe.”
OFF-WHITE shades indicate NEUTRAL ratings. Shades of neutral
generally indicate that residents thought the quality of service delivery is adequate.
ORANGE/RED shades indicate NEGATIVE ratings. Shades of
orange/red generally indicate dissatisfaction with a service, ratings of “below average” or “poor” and ratings of “unsafe” or “very unsafe.”
2014 City of Des Peres Community Survey: Appendix A - GIS Maps
ETC Institute (2014) A-1
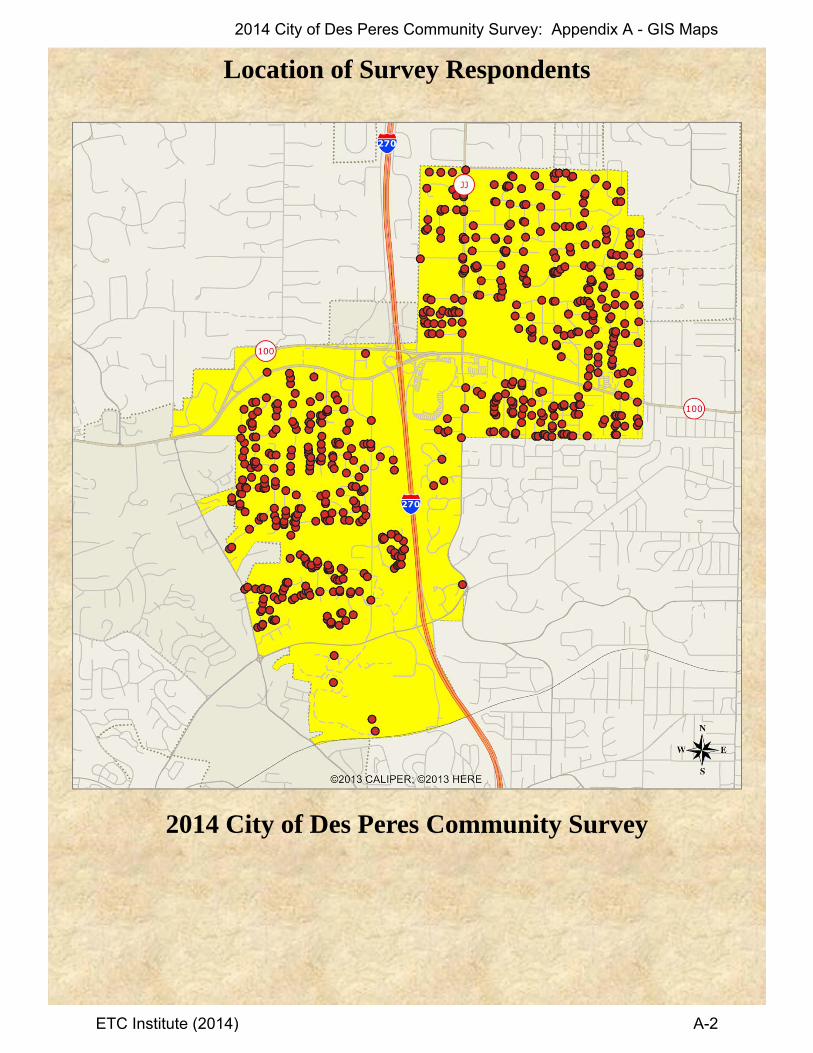
Location of Survey Respondents
2014 City of Des Peres Community Survey
2014 City of Des Peres Community Survey: Appendix A - GIS Maps
ETC Institute (2014) A-2

Q1a Satisfaction with overall quality of public safety services (police, fire and ambulance)
2014 City of Des Peres Community Survey
Shading reflects the mean rating for all respondents by CBG (merged as needed)
LEGENDMean rating on a 5‐point scale, where:
1.0‐1.8 Very Dissatisfied
1.8‐2.6 Dissatisfied
2.6‐3.4 Neutral
3.4‐4.2 Satisfied
4.2‐5.0 Very Satisfied
Other (no responses)
2014 City of Des Peres Community Survey: Appendix A - GIS Maps
ETC Institute (2014) A-3

Q1b Satisfaction with overall quality of City parks
2014 City of Des Peres Community Survey
Shading reflects the mean rating for all respondents by CBG (merged as needed)
LEGENDMean rating on a 5‐point scale, where:
1.0‐1.8 Very Dissatisfied
1.8‐2.6 Dissatisfied
2.6‐3.4 Neutral
3.4‐4.2 Satisfied
4.2‐5.0 Very Satisfied
Other (no responses)
2014 City of Des Peres Community Survey: Appendix A - GIS Maps
ETC Institute (2014) A-4

Q1c Satisfaction with overall quality of Recreation Facilities and Programs
2014 City of Des Peres Community Survey
Shading reflects the mean rating for all respondents by CBG (merged as needed)
LEGENDMean rating on a 5‐point scale, where:
1.0‐1.8 Very Dissatisfied
1.8‐2.6 Dissatisfied
2.6‐3.4 Neutral
3.4‐4.2 Satisfied
4.2‐5.0 Very Satisfied
Other (no responses)
2014 City of Des Peres Community Survey: Appendix A - GIS Maps
ETC Institute (2014) A-5
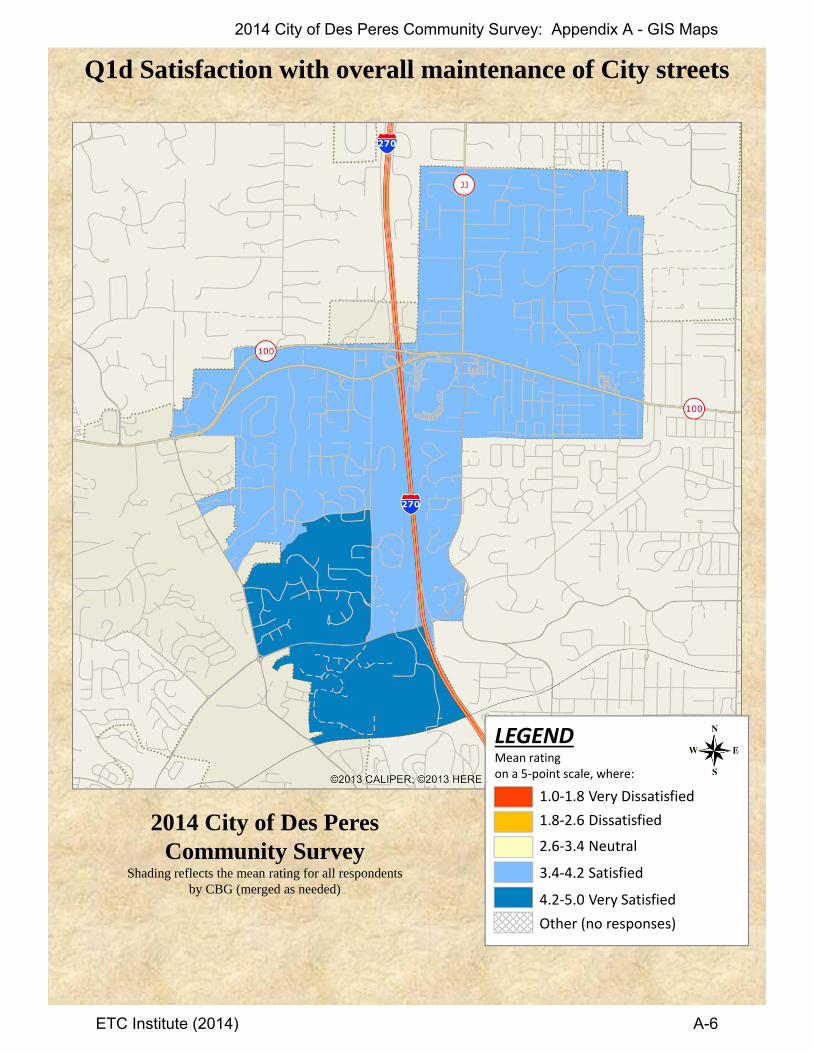
Q1d Satisfaction with overall maintenance of City streets
2014 City of Des Peres Community Survey
Shading reflects the mean rating for all respondents by CBG (merged as needed)
LEGENDMean rating on a 5‐point scale, where:
1.0‐1.8 Very Dissatisfied
1.8‐2.6 Dissatisfied
2.6‐3.4 Neutral
3.4‐4.2 Satisfied
4.2‐5.0 Very Satisfied
Other (no responses)
2014 City of Des Peres Community Survey: Appendix A - GIS Maps
ETC Institute (2014) A-6
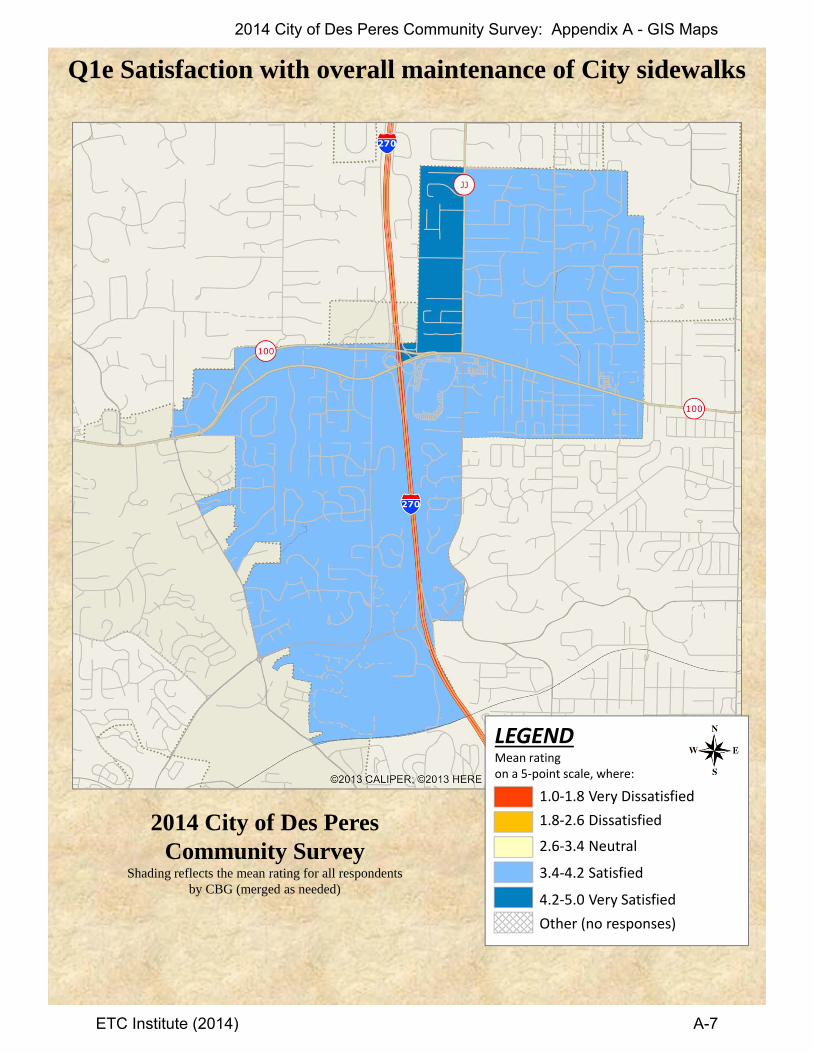
Q1e Satisfaction with overall maintenance of City sidewalks
2014 City of Des Peres Community Survey
Shading reflects the mean rating for all respondents by CBG (merged as needed)
LEGENDMean rating on a 5‐point scale, where:
1.0‐1.8 Very Dissatisfied
1.8‐2.6 Dissatisfied
2.6‐3.4 Neutral
3.4‐4.2 Satisfied
4.2‐5.0 Very Satisfied
Other (no responses)
2014 City of Des Peres Community Survey: Appendix A - GIS Maps
ETC Institute (2014) A-7
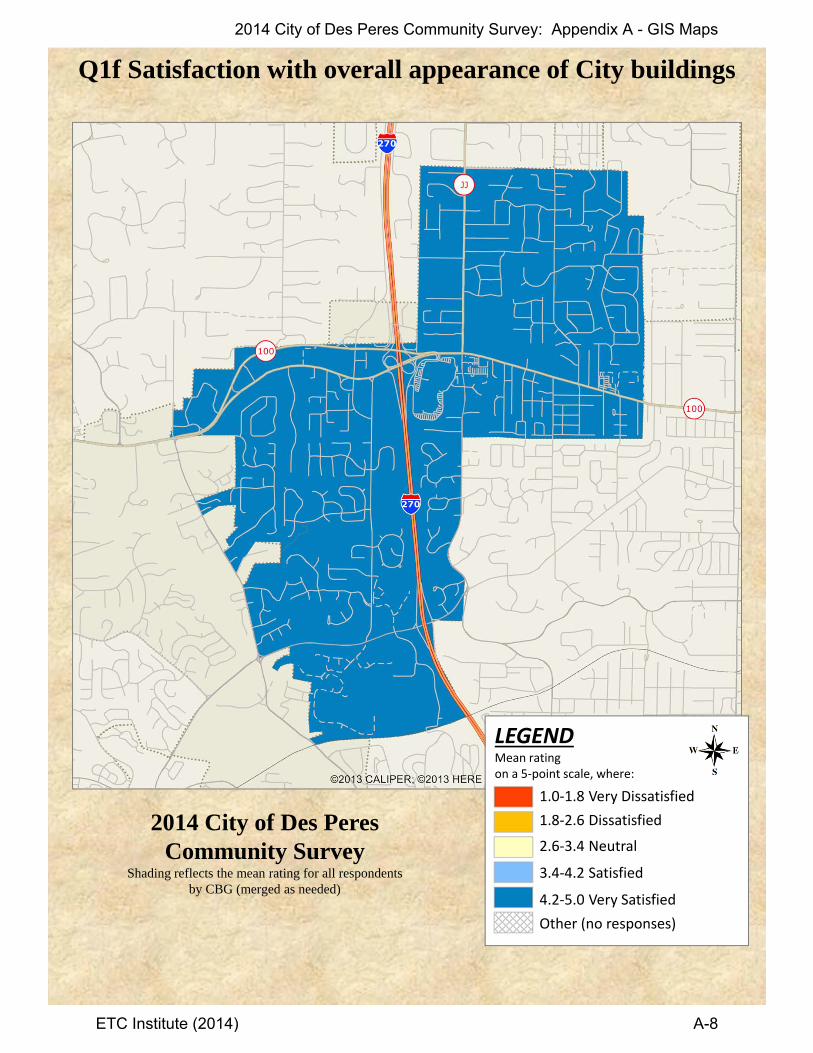
Q1f Satisfaction with overall appearance of City buildings
2014 City of Des Peres Community Survey
Shading reflects the mean rating for all respondents by CBG (merged as needed)
LEGENDMean rating on a 5‐point scale, where:
1.0‐1.8 Very Dissatisfied
1.8‐2.6 Dissatisfied
2.6‐3.4 Neutral
3.4‐4.2 Satisfied
4.2‐5.0 Very Satisfied
Other (no responses)
2014 City of Des Peres Community Survey: Appendix A - GIS Maps
ETC Institute (2014) A-8
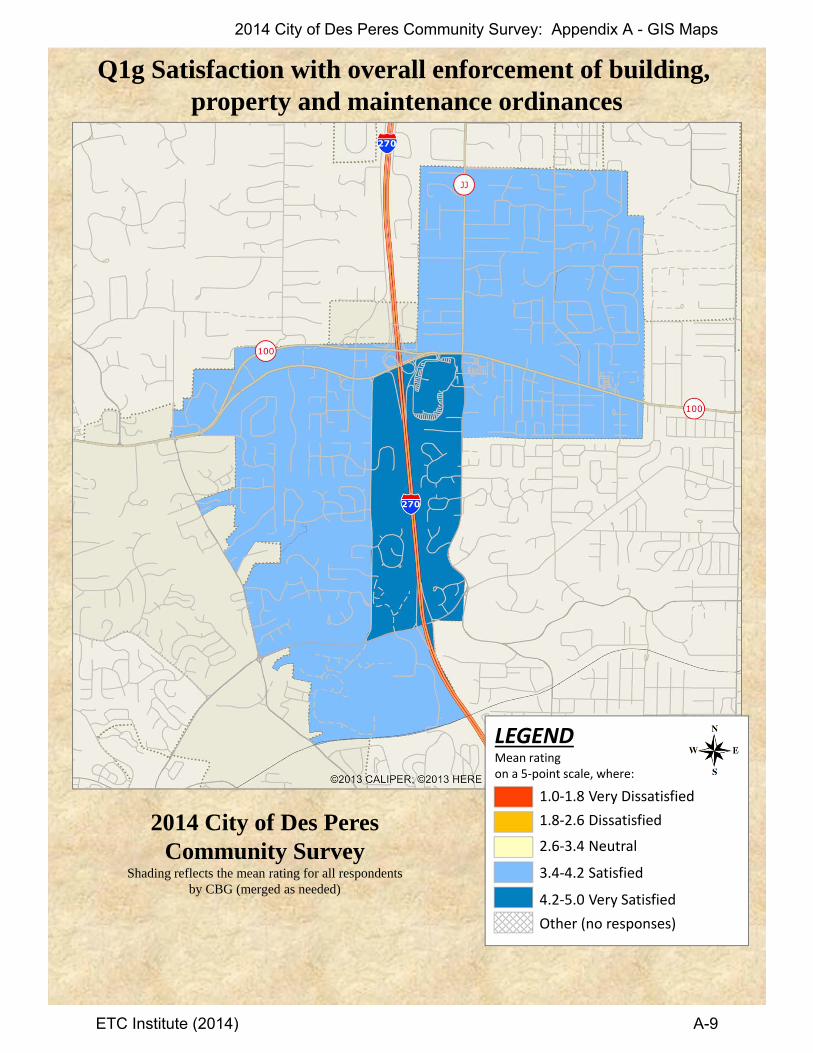
Q1g Satisfaction with overall enforcement of building, property and maintenance ordinances
2014 City of Des Peres Community Survey
Shading reflects the mean rating for all respondents by CBG (merged as needed)
LEGENDMean rating on a 5‐point scale, where:
1.0‐1.8 Very Dissatisfied
1.8‐2.6 Dissatisfied
2.6‐3.4 Neutral
3.4‐4.2 Satisfied
4.2‐5.0 Very Satisfied
Other (no responses)
2014 City of Des Peres Community Survey: Appendix A - GIS Maps
ETC Institute (2014) A-9
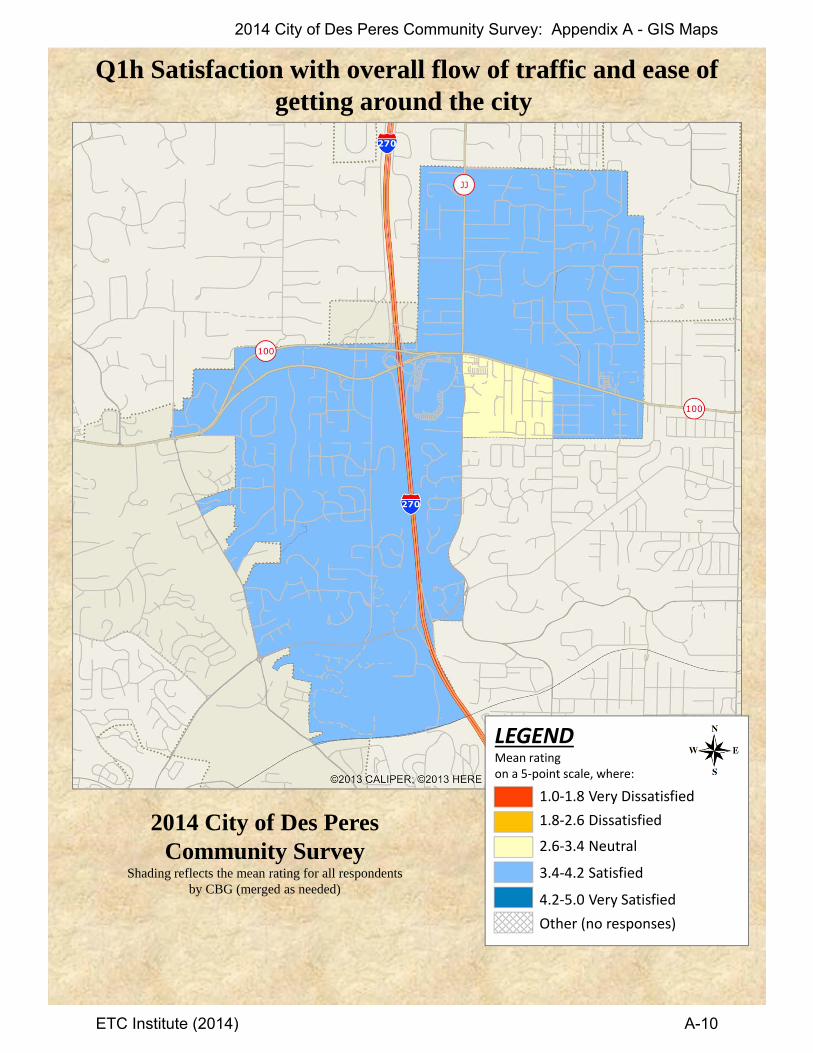
Q1h Satisfaction with overall flow of traffic and ease ofgetting around the city
2014 City of Des Peres Community Survey
Shading reflects the mean rating for all respondents by CBG (merged as needed)
LEGENDMean rating on a 5‐point scale, where:
1.0‐1.8 Very Dissatisfied
1.8‐2.6 Dissatisfied
2.6‐3.4 Neutral
3.4‐4.2 Satisfied
4.2‐5.0 Very Satisfied
Other (no responses)
2014 City of Des Peres Community Survey: Appendix A - GIS Maps
ETC Institute (2014) A-10

Q1i Satisfaction with overall quality of customer service from City employees
2014 City of Des Peres Community Survey
Shading reflects the mean rating for all respondents by CBG (merged as needed)
LEGENDMean rating on a 5‐point scale, where:
1.0‐1.8 Very Dissatisfied
1.8‐2.6 Dissatisfied
2.6‐3.4 Neutral
3.4‐4.2 Satisfied
4.2‐5.0 Very Satisfied
Other (no responses)
2014 City of Des Peres Community Survey: Appendix A - GIS Maps
ETC Institute (2014) A-11
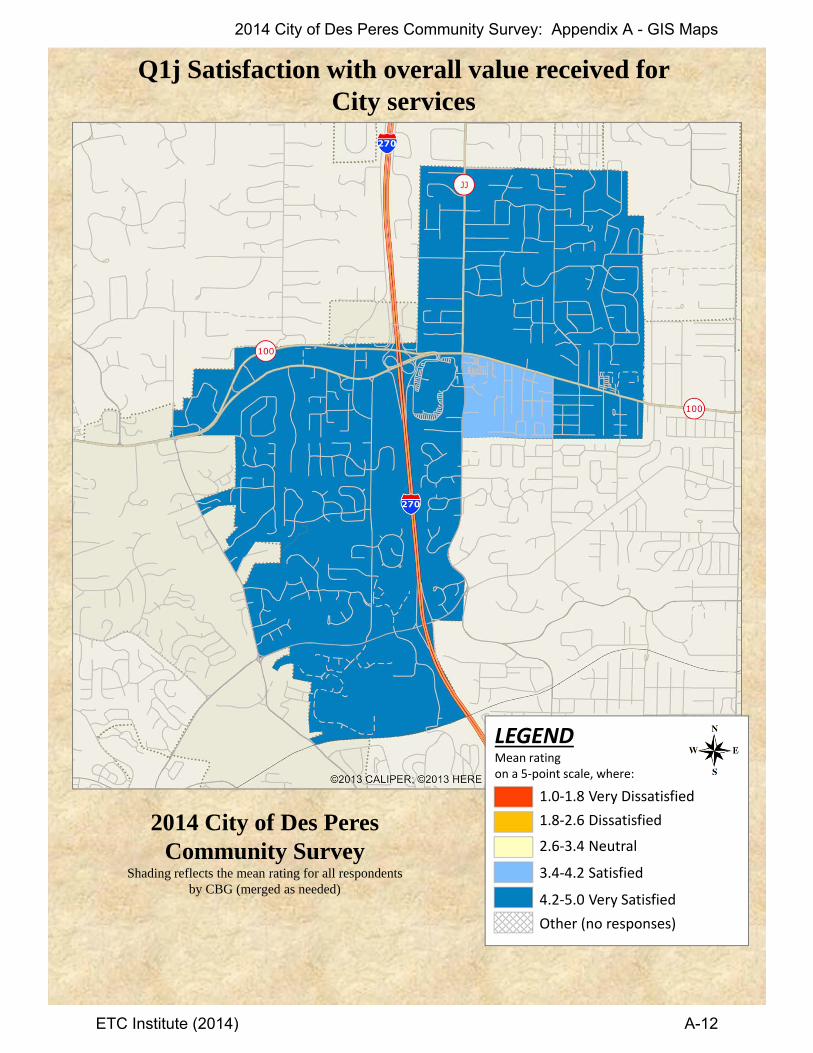
Q1j Satisfaction with overall value received for City services
2014 City of Des Peres Community Survey
Shading reflects the mean rating for all respondents by CBG (merged as needed)
LEGENDMean rating on a 5‐point scale, where:
1.0‐1.8 Very Dissatisfied
1.8‐2.6 Dissatisfied
2.6‐3.4 Neutral
3.4‐4.2 Satisfied
4.2‐5.0 Very Satisfied
Other (no responses)
2014 City of Des Peres Community Survey: Appendix A - GIS Maps
ETC Institute (2014) A-12

Q1k Satisfaction with overall effectiveness of City communication with the public
2014 City of Des Peres Community Survey
Shading reflects the mean rating for all respondents by CBG (merged as needed)
LEGENDMean rating on a 5‐point scale, where:
1.0‐1.8 Very Dissatisfied
1.8‐2.6 Dissatisfied
2.6‐3.4 Neutral
3.4‐4.2 Satisfied
4.2‐5.0 Very Satisfied
Other (no responses)
2014 City of Des Peres Community Survey: Appendix A - GIS Maps
ETC Institute (2014) A-13
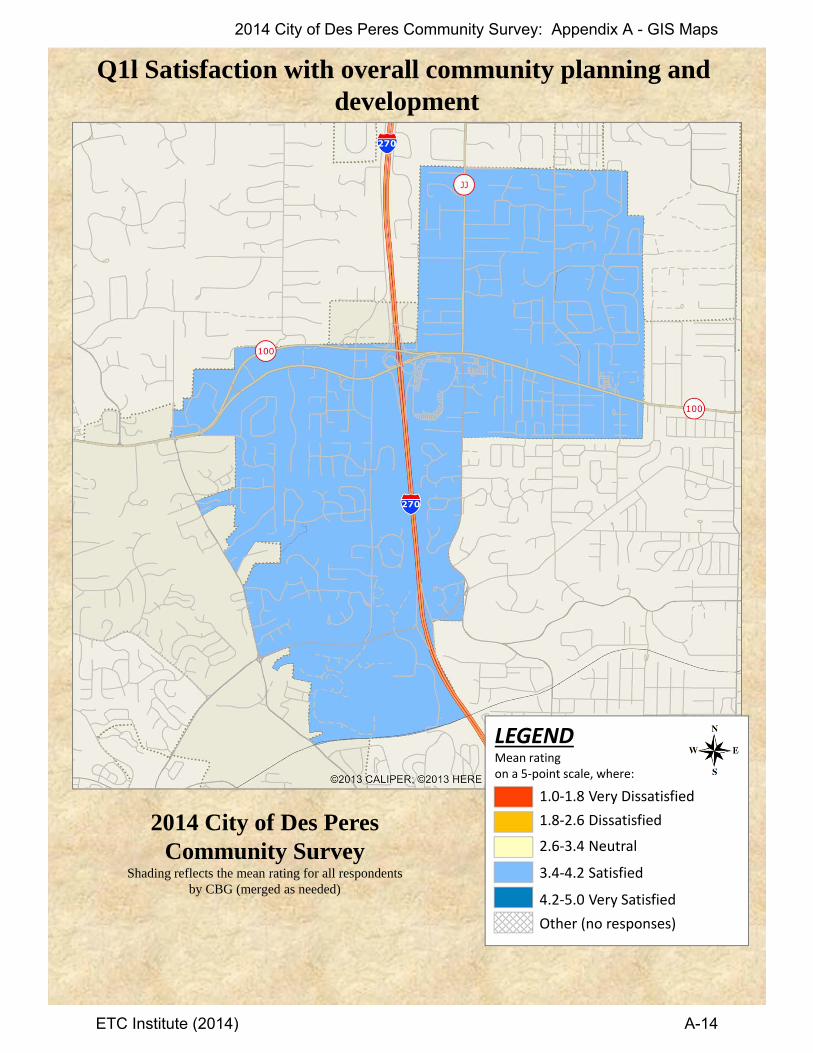
Q1l Satisfaction with overall community planning and development
2014 City of Des Peres Community Survey
Shading reflects the mean rating for all respondents by CBG (merged as needed)
LEGENDMean rating on a 5‐point scale, where:
1.0‐1.8 Very Dissatisfied
1.8‐2.6 Dissatisfied
2.6‐3.4 Neutral
3.4‐4.2 Satisfied
4.2‐5.0 Very Satisfied
Other (no responses)
2014 City of Des Peres Community Survey: Appendix A - GIS Maps
ETC Institute (2014) A-14
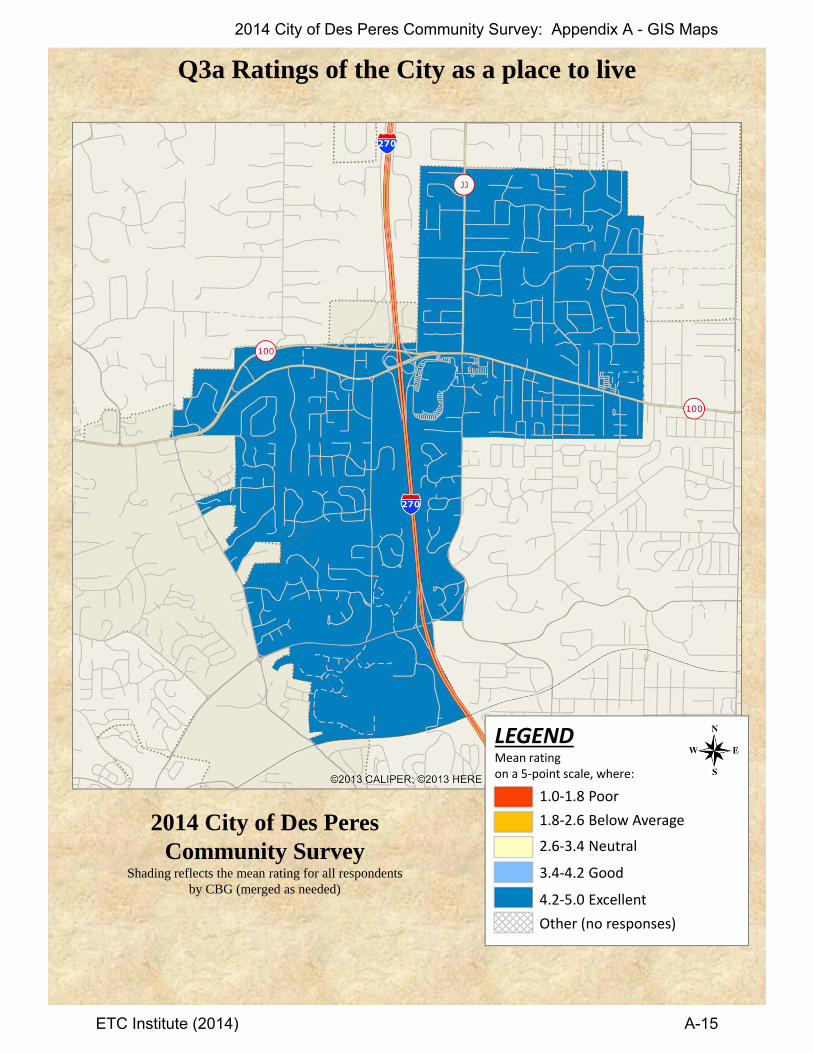
Q3a Ratings of the City as a place to live
2014 City of Des Peres Community Survey
Shading reflects the mean rating for all respondents by CBG (merged as needed)
LEGENDMean rating on a 5‐point scale, where:
1.0‐1.8 Poor
1.8‐2.6 Below Average
2.6‐3.4 Neutral
3.4‐4.2 Good
4.2‐5.0 Excellent
Other (no responses)
2014 City of Des Peres Community Survey: Appendix A - GIS Maps
ETC Institute (2014) A-15
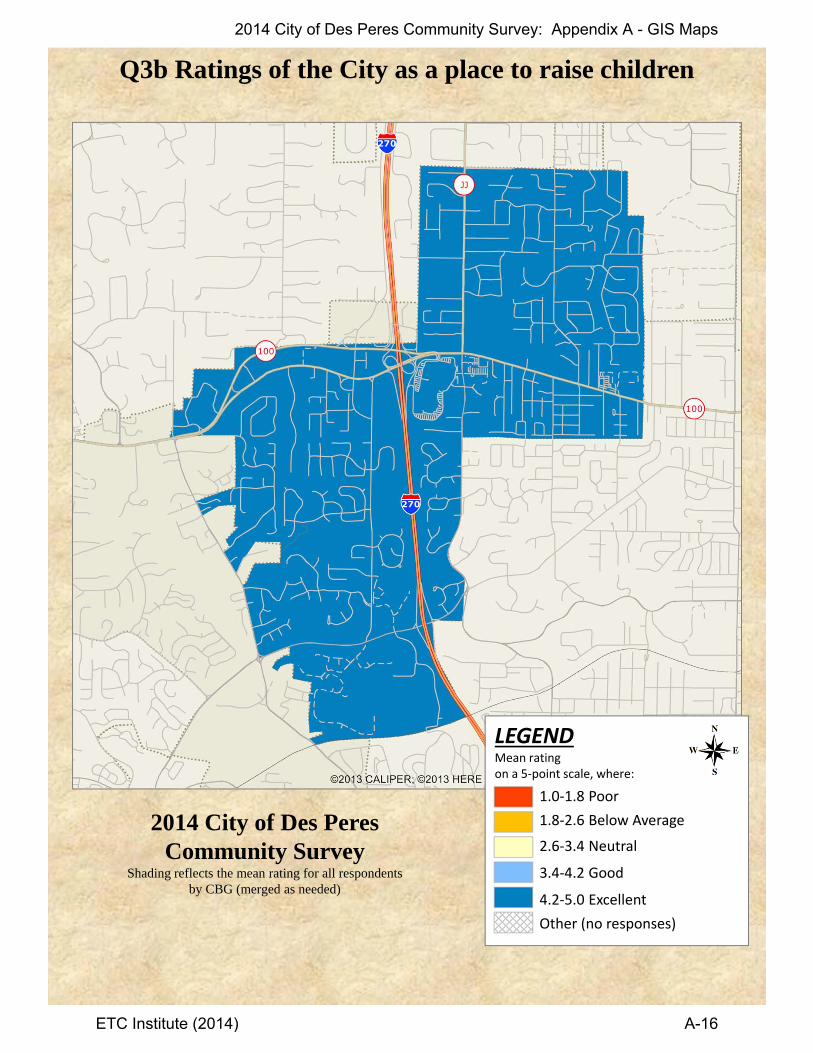
Q3b Ratings of the City as a place to raise children
2014 City of Des Peres Community Survey
Shading reflects the mean rating for all respondents by CBG (merged as needed)
LEGENDMean rating on a 5‐point scale, where:
1.0‐1.8 Poor
1.8‐2.6 Below Average
2.6‐3.4 Neutral
3.4‐4.2 Good
4.2‐5.0 Excellent
Other (no responses)
2014 City of Des Peres Community Survey: Appendix A - GIS Maps
ETC Institute (2014) A-16

Q3c Ratings of the City as a place to work
2014 City of Des Peres Community Survey
Shading reflects the mean rating for all respondents by CBG (merged as needed)
LEGENDMean rating on a 5‐point scale, where:
1.0‐1.8 Poor
1.8‐2.6 Below Average
2.6‐3.4 Neutral
3.4‐4.2 Good
4.2‐5.0 Excellent
Other (no responses)
2014 City of Des Peres Community Survey: Appendix A - GIS Maps
ETC Institute (2014) A-17
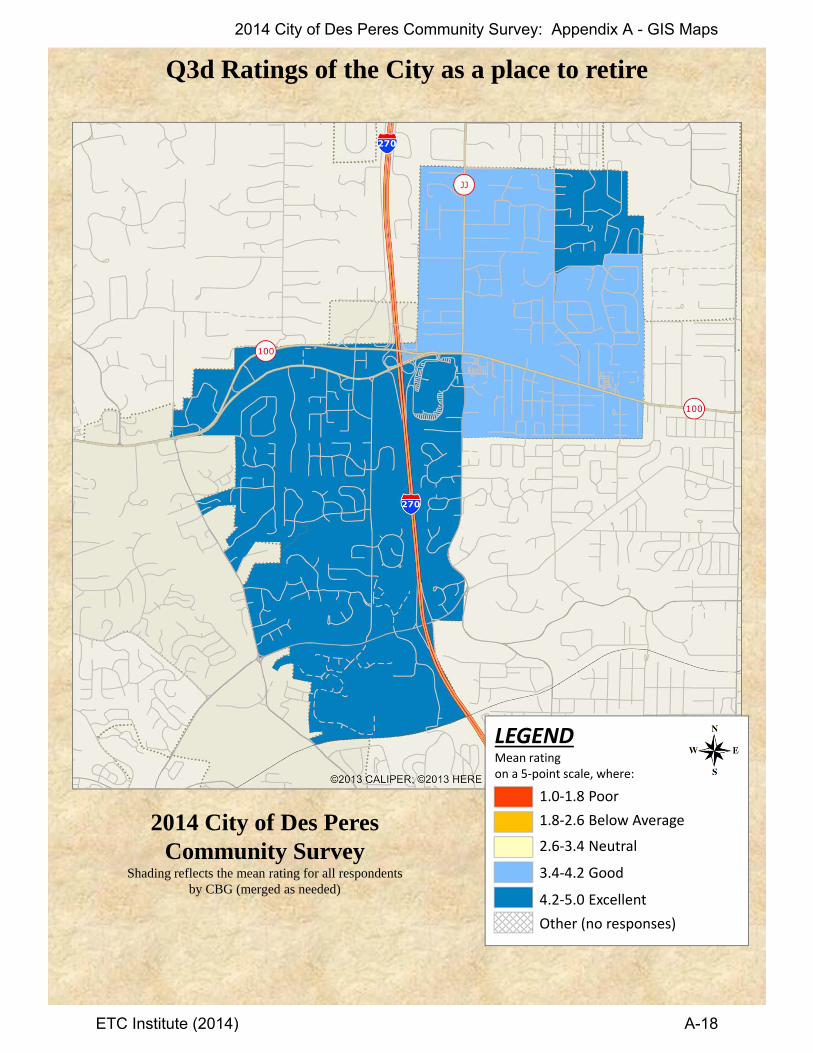
Q3d Ratings of the City as a place to retire
2014 City of Des Peres Community Survey
Shading reflects the mean rating for all respondents by CBG (merged as needed)
LEGENDMean rating on a 5‐point scale, where:
1.0‐1.8 Poor
1.8‐2.6 Below Average
2.6‐3.4 Neutral
3.4‐4.2 Good
4.2‐5.0 Excellent
Other (no responses)
2014 City of Des Peres Community Survey: Appendix A - GIS Maps
ETC Institute (2014) A-18

Q3e Ratings of the City as a place to shop for goods and services
2014 City of Des Peres Community Survey
Shading reflects the mean rating for all respondents by CBG (merged as needed)
LEGENDMean rating on a 5‐point scale, where:
1.0‐1.8 Poor
1.8‐2.6 Below Average
2.6‐3.4 Neutral
3.4‐4.2 Good
4.2‐5.0 Excellent
Other (no responses)
2014 City of Des Peres Community Survey: Appendix A - GIS Maps
ETC Institute (2014) A-19
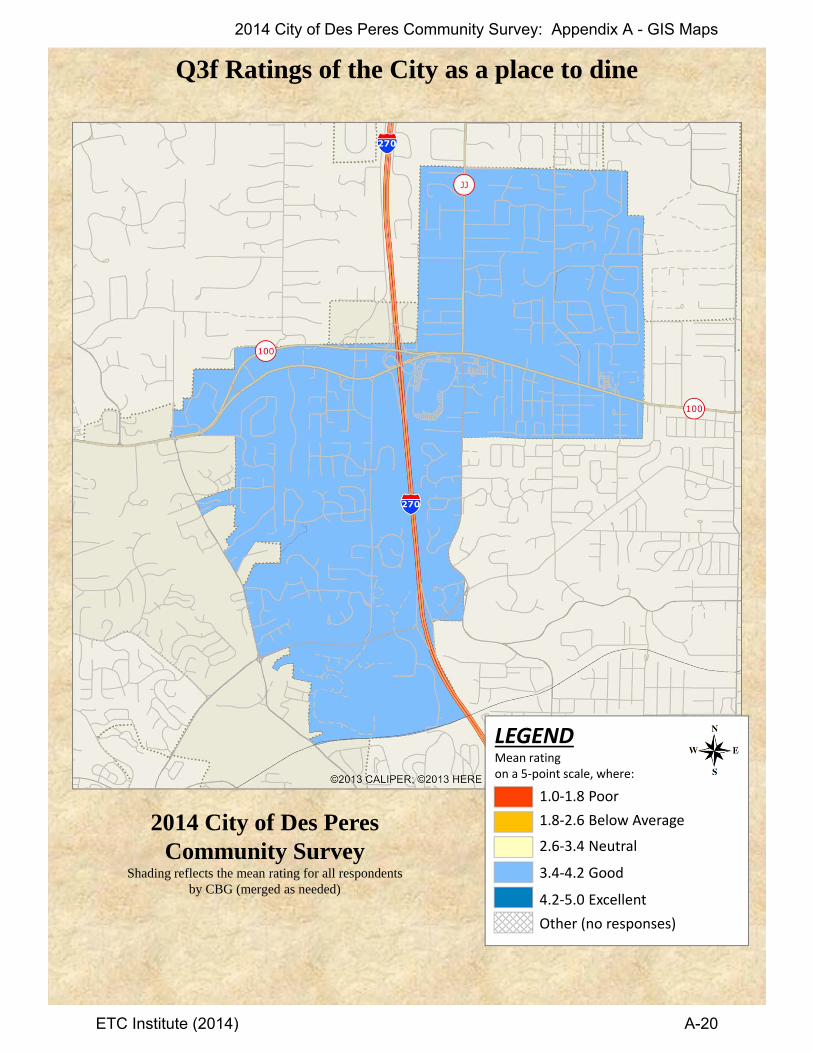
Q3f Ratings of the City as a place to dine
2014 City of Des Peres Community Survey
Shading reflects the mean rating for all respondents by CBG (merged as needed)
LEGENDMean rating on a 5‐point scale, where:
1.0‐1.8 Poor
1.8‐2.6 Below Average
2.6‐3.4 Neutral
3.4‐4.2 Good
4.2‐5.0 Excellent
Other (no responses)
2014 City of Des Peres Community Survey: Appendix A - GIS Maps
ETC Institute (2014) A-20

Q3g Ratings of the overall quality of life in the City
2014 City of Des Peres Community Survey
Shading reflects the mean rating for all respondents by CBG (merged as needed)
LEGENDMean rating on a 5‐point scale, where:
1.0‐1.8 Poor
1.8‐2.6 Below Average
2.6‐3.4 Neutral
3.4‐4.2 Good
4.2‐5.0 Excellent
Other (no responses)
2014 City of Des Peres Community Survey: Appendix A - GIS Maps
ETC Institute (2014) A-21

Q3h Ratings of the overall feeling of safety in the City
2014 City of Des Peres Community Survey
Shading reflects the mean rating for all respondents by CBG (merged as needed)
LEGENDMean rating on a 5‐point scale, where:
1.0‐1.8 Poor
1.8‐2.6 Below Average
2.6‐3.4 Neutral
3.4‐4.2 Good
4.2‐5.0 Excellent
Other (no responses)
2014 City of Des Peres Community Survey: Appendix A - GIS Maps
ETC Institute (2014) A-22
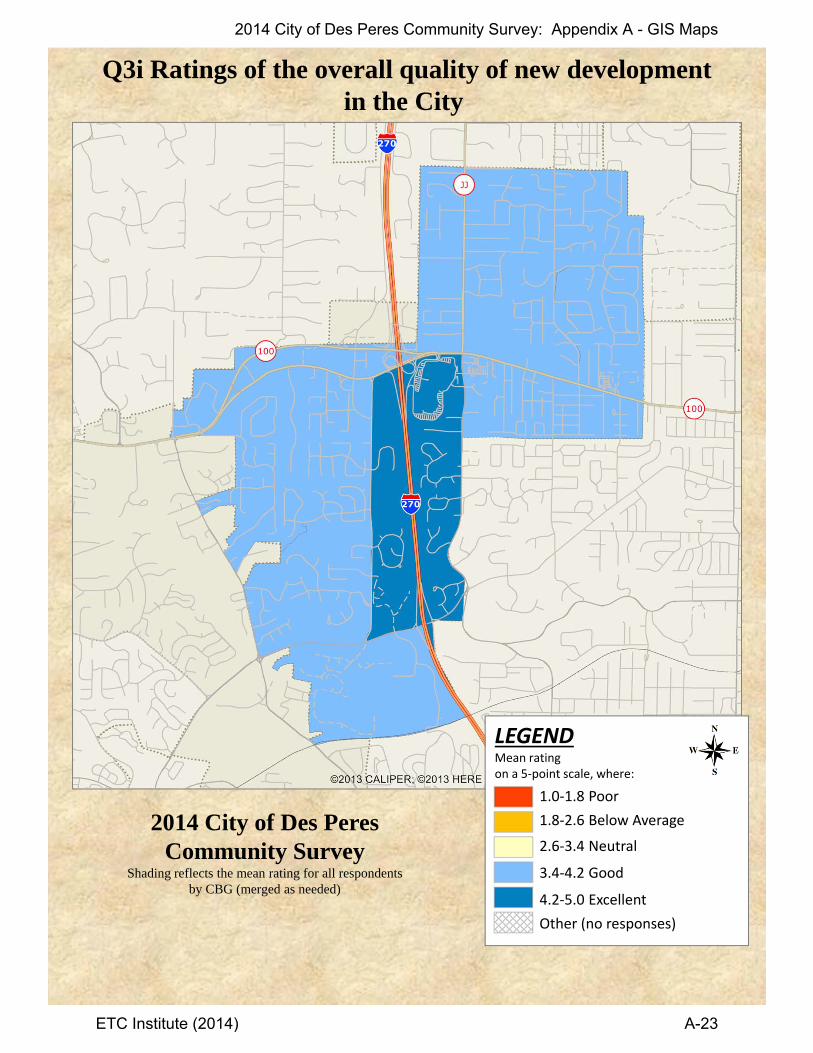
Q3i Ratings of the overall quality of new developmentin the City
2014 City of Des Peres Community Survey
Shading reflects the mean rating for all respondents by CBG (merged as needed)
LEGENDMean rating on a 5‐point scale, where:
1.0‐1.8 Poor
1.8‐2.6 Below Average
2.6‐3.4 Neutral
3.4‐4.2 Good
4.2‐5.0 Excellent
Other (no responses)
2014 City of Des Peres Community Survey: Appendix A - GIS Maps
ETC Institute (2014) A-23
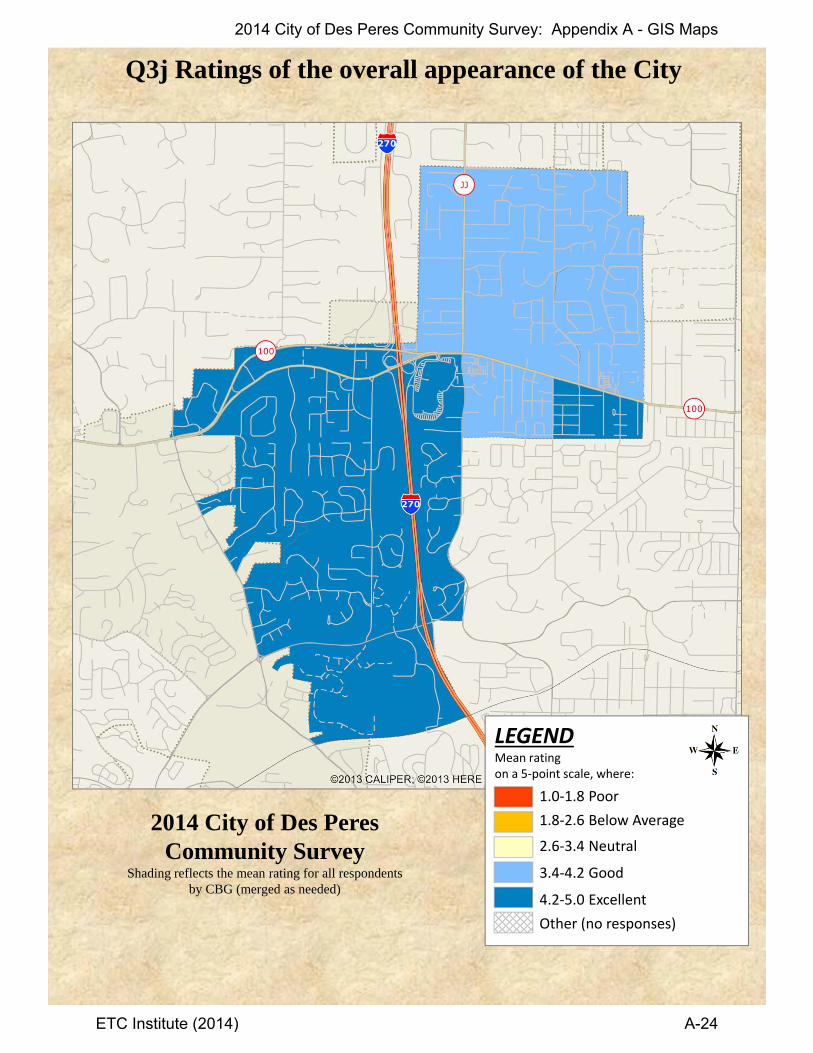
Q3j Ratings of the overall appearance of the City
2014 City of Des Peres Community Survey
Shading reflects the mean rating for all respondents by CBG (merged as needed)
LEGENDMean rating on a 5‐point scale, where:
1.0‐1.8 Poor
1.8‐2.6 Below Average
2.6‐3.4 Neutral
3.4‐4.2 Good
4.2‐5.0 Excellent
Other (no responses)
2014 City of Des Peres Community Survey: Appendix A - GIS Maps
ETC Institute (2014) A-24

Q8a Satisfaction with overall performance of the Des PeresPolice Department
2014 City of Des Peres Community Survey
Shading reflects the mean rating for all respondents by CBG (merged as needed)
LEGENDMean rating on a 5‐point scale, where:
1.0‐1.8 Very Dissatisfied
1.8‐2.6 Dissatisfied
2.6‐3.4 Neutral
3.4‐4.2 Satisfied
4.2‐5.0 Very Satisfied
Other (no responses)
2014 City of Des Peres Community Survey: Appendix A - GIS Maps
ETC Institute (2014) A-25

Q8b Satisfaction with overall quality of local police protection
2014 City of Des Peres Community Survey
Shading reflects the mean rating for all respondents by CBG (merged as needed)
LEGENDMean rating on a 5‐point scale, where:
1.0‐1.8 Very Dissatisfied
1.8‐2.6 Dissatisfied
2.6‐3.4 Neutral
3.4‐4.2 Satisfied
4.2‐5.0 Very Satisfied
Other (no responses)
2014 City of Des Peres Community Survey: Appendix A - GIS Maps
ETC Institute (2014) A-26
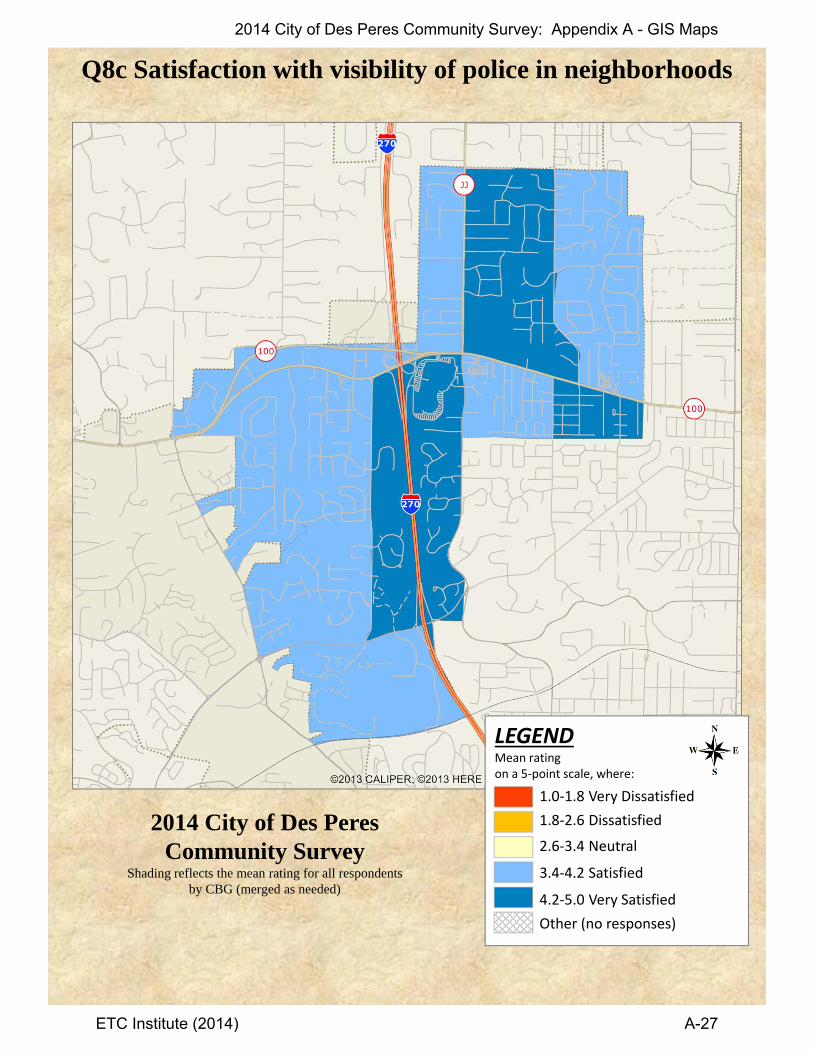
Q8c Satisfaction with visibility of police in neighborhoods
2014 City of Des Peres Community Survey
Shading reflects the mean rating for all respondents by CBG (merged as needed)
LEGENDMean rating on a 5‐point scale, where:
1.0‐1.8 Very Dissatisfied
1.8‐2.6 Dissatisfied
2.6‐3.4 Neutral
3.4‐4.2 Satisfied
4.2‐5.0 Very Satisfied
Other (no responses)
2014 City of Des Peres Community Survey: Appendix A - GIS Maps
ETC Institute (2014) A-27
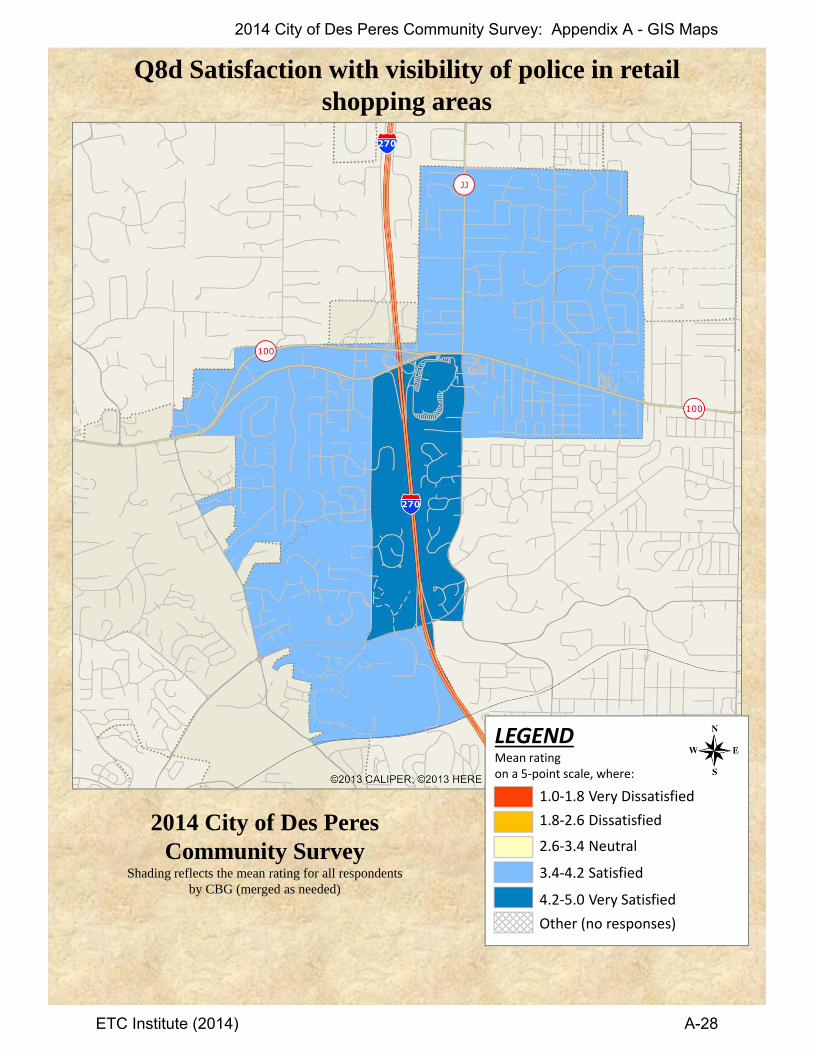
Q8d Satisfaction with visibility of police in retailshopping areas
2014 City of Des Peres Community Survey
Shading reflects the mean rating for all respondents by CBG (merged as needed)
LEGENDMean rating on a 5‐point scale, where:
1.0‐1.8 Very Dissatisfied
1.8‐2.6 Dissatisfied
2.6‐3.4 Neutral
3.4‐4.2 Satisfied
4.2‐5.0 Very Satisfied
Other (no responses)
2014 City of Des Peres Community Survey: Appendix A - GIS Maps
ETC Institute (2014) A-28
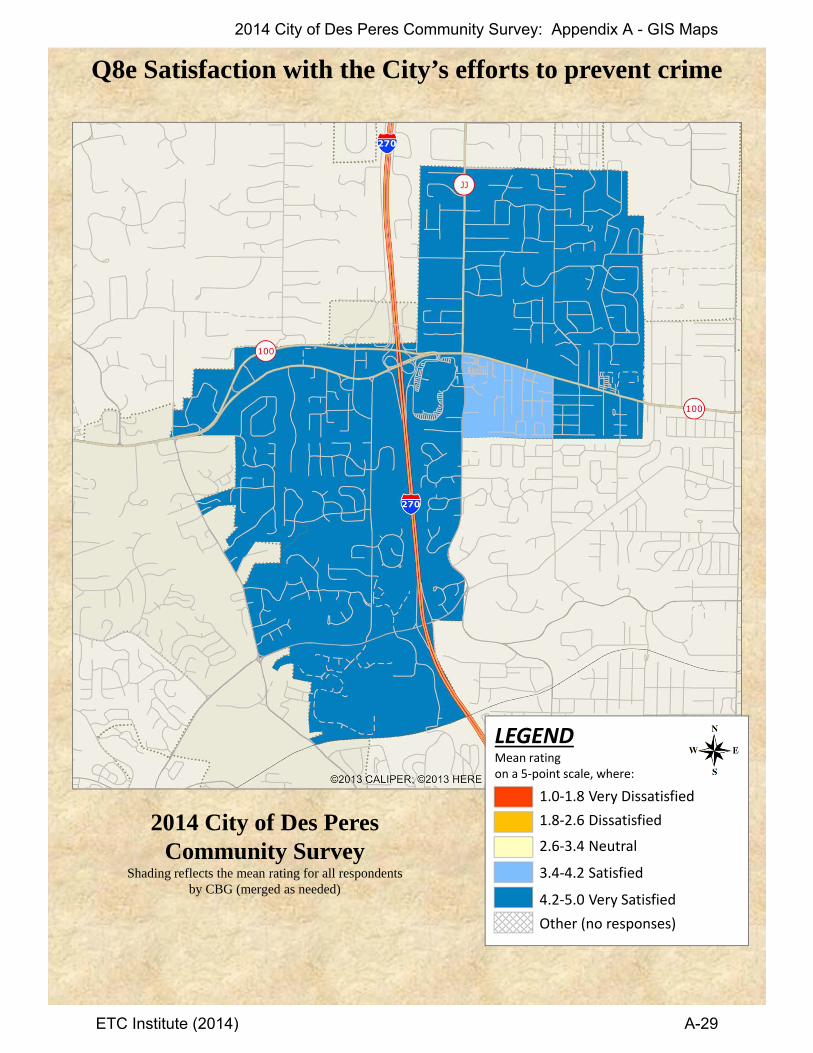
Q8e Satisfaction with the City’s efforts to prevent crime
2014 City of Des Peres Community Survey
Shading reflects the mean rating for all respondents by CBG (merged as needed)
LEGENDMean rating on a 5‐point scale, where:
1.0‐1.8 Very Dissatisfied
1.8‐2.6 Dissatisfied
2.6‐3.4 Neutral
3.4‐4.2 Satisfied
4.2‐5.0 Very Satisfied
Other (no responses)
2014 City of Des Peres Community Survey: Appendix A - GIS Maps
ETC Institute (2014) A-29
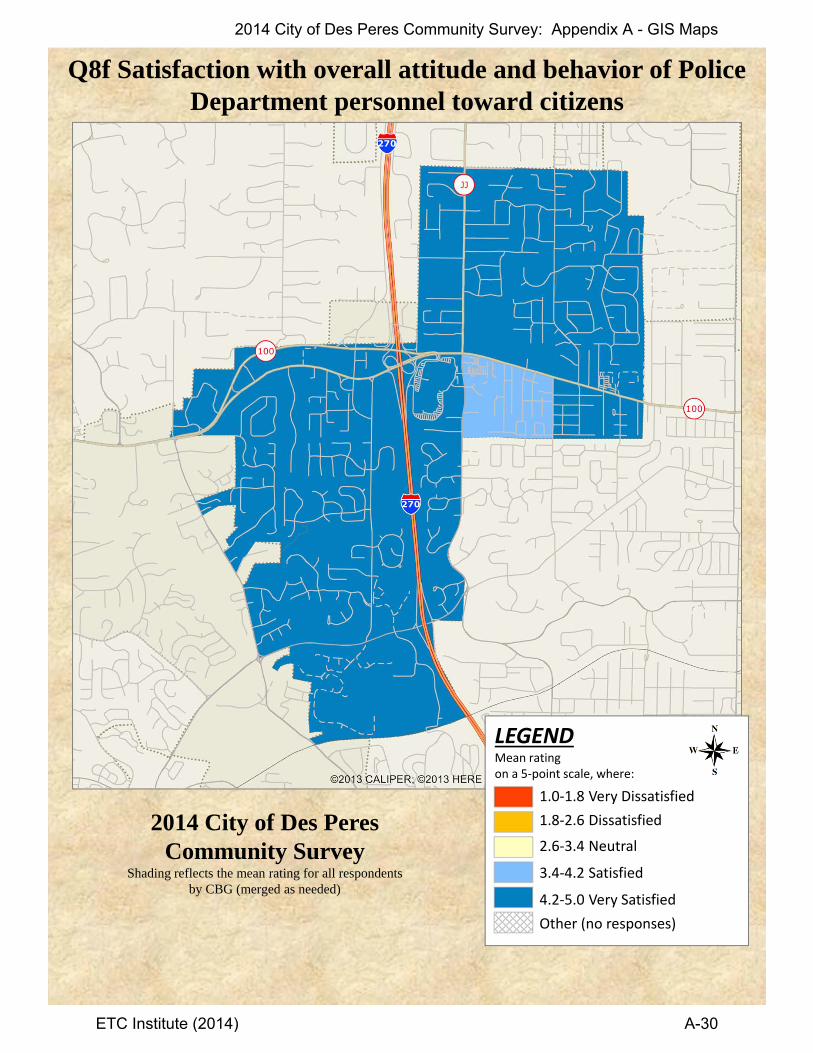
Q8f Satisfaction with overall attitude and behavior of PoliceDepartment personnel toward citizens
2014 City of Des Peres Community Survey
Shading reflects the mean rating for all respondents by CBG (merged as needed)
LEGENDMean rating on a 5‐point scale, where:
1.0‐1.8 Very Dissatisfied
1.8‐2.6 Dissatisfied
2.6‐3.4 Neutral
3.4‐4.2 Satisfied
4.2‐5.0 Very Satisfied
Other (no responses)
2014 City of Des Peres Community Survey: Appendix A - GIS Maps
ETC Institute (2014) A-30
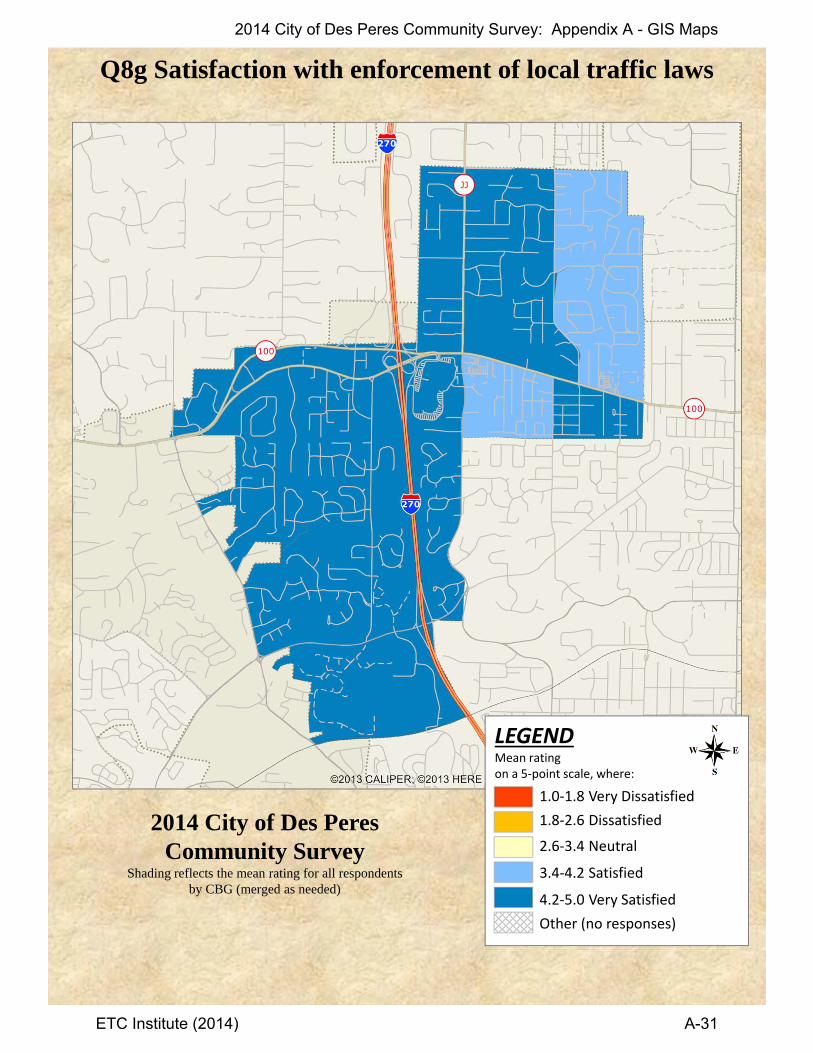
Q8g Satisfaction with enforcement of local traffic laws
2014 City of Des Peres Community Survey
Shading reflects the mean rating for all respondents by CBG (merged as needed)
LEGENDMean rating on a 5‐point scale, where:
1.0‐1.8 Very Dissatisfied
1.8‐2.6 Dissatisfied
2.6‐3.4 Neutral
3.4‐4.2 Satisfied
4.2‐5.0 Very Satisfied
Other (no responses)
2014 City of Des Peres Community Survey: Appendix A - GIS Maps
ETC Institute (2014) A-31

Q8h Satisfaction with overall quality of Des Peres Fire Department
2014 City of Des Peres Community Survey
Shading reflects the mean rating for all respondents by CBG (merged as needed)
LEGENDMean rating on a 5‐point scale, where:
1.0‐1.8 Very Dissatisfied
1.8‐2.6 Dissatisfied
2.6‐3.4 Neutral
3.4‐4.2 Satisfied
4.2‐5.0 Very Satisfied
Other (no responses)
2014 City of Des Peres Community Survey: Appendix A - GIS Maps
ETC Institute (2014) A-32

Q8i Satisfaction with overall quality of Des Peres EMS
2014 City of Des Peres Community Survey
Shading reflects the mean rating for all respondents by CBG (merged as needed)
LEGENDMean rating on a 5‐point scale, where:
1.0‐1.8 Very Dissatisfied
1.8‐2.6 Dissatisfied
2.6‐3.4 Neutral
3.4‐4.2 Satisfied
4.2‐5.0 Very Satisfied
Other (no responses)
2014 City of Des Peres Community Survey: Appendix A - GIS Maps
ETC Institute (2014) A-33
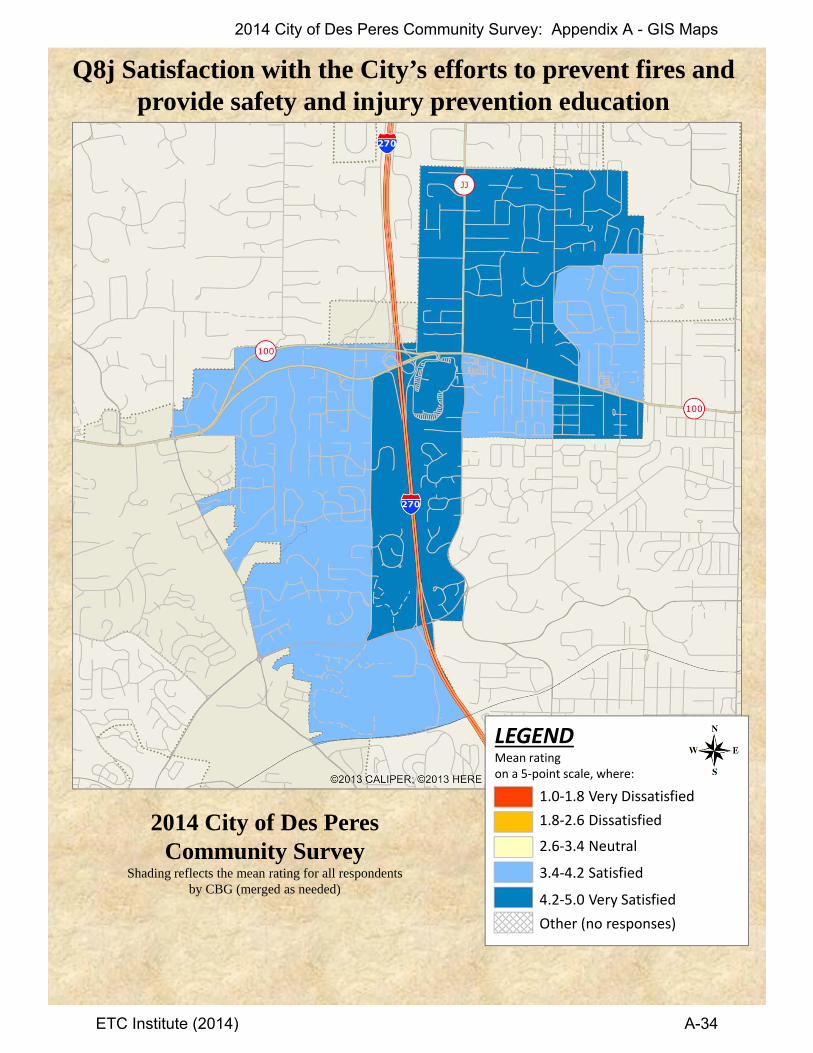
Q8j Satisfaction with the City’s efforts to prevent fires and provide safety and injury prevention education
2014 City of Des Peres Community Survey
Shading reflects the mean rating for all respondents by CBG (merged as needed)
LEGENDMean rating on a 5‐point scale, where:
1.0‐1.8 Very Dissatisfied
1.8‐2.6 Dissatisfied
2.6‐3.4 Neutral
3.4‐4.2 Satisfied
4.2‐5.0 Very Satisfied
Other (no responses)
2014 City of Des Peres Community Survey: Appendix A - GIS Maps
ETC Institute (2014) A-34

Q8k Satisfaction with how quickly the Fire Department responds to emergencies
2014 City of Des Peres Community Survey
Shading reflects the mean rating for all respondents by CBG (merged as needed)
LEGENDMean rating on a 5‐point scale, where:
1.0‐1.8 Very Dissatisfied
1.8‐2.6 Dissatisfied
2.6‐3.4 Neutral
3.4‐4.2 Satisfied
4.2‐5.0 Very Satisfied
Other (no responses)
2014 City of Des Peres Community Survey: Appendix A - GIS Maps
ETC Institute (2014) A-35
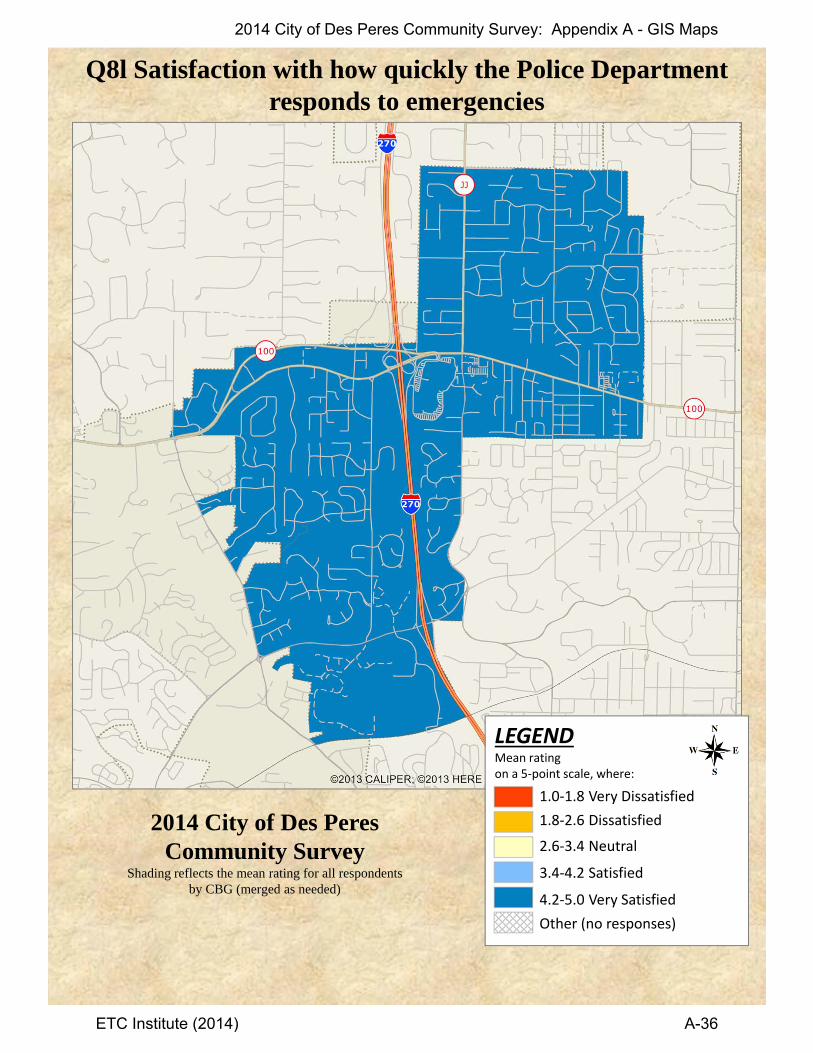
Q8l Satisfaction with how quickly the Police Departmentresponds to emergencies
2014 City of Des Peres Community Survey
Shading reflects the mean rating for all respondents by CBG (merged as needed)
LEGENDMean rating on a 5‐point scale, where:
1.0‐1.8 Very Dissatisfied
1.8‐2.6 Dissatisfied
2.6‐3.4 Neutral
3.4‐4.2 Satisfied
4.2‐5.0 Very Satisfied
Other (no responses)
2014 City of Des Peres Community Survey: Appendix A - GIS Maps
ETC Institute (2014) A-36

Q10a Feeling of safety walking alone in the neighborhoodin general
2014 City of Des Peres Community Survey
Shading reflects the mean rating for all respondents by CBG (merged as needed)
LEGENDMean rating on a 4‐point scale, where:
1.0‐1.75 Very Unsafe
1.75‐2.5 Somewhat Unsafe
2.5‐3.25 Somewhat Safe
3.25‐4.0 Very Safe
Other (no responses)
2014 City of Des Peres Community Survey: Appendix A - GIS Maps
ETC Institute (2014) A-37
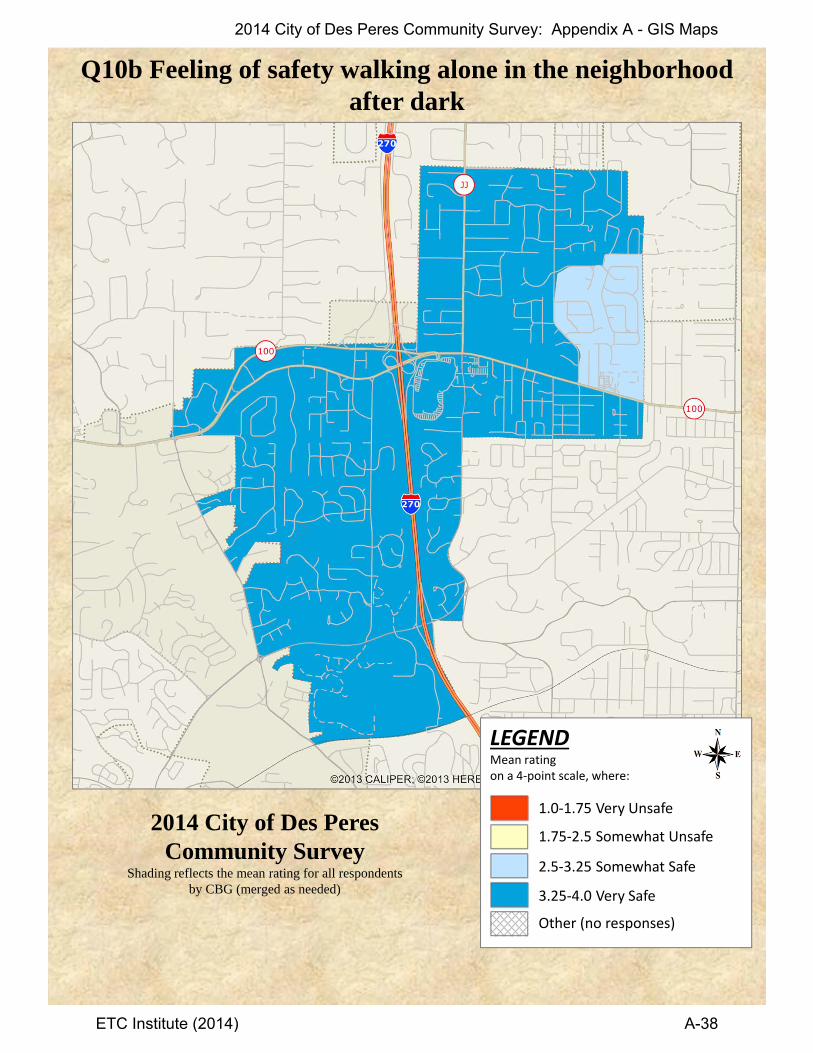
Q10b Feeling of safety walking alone in the neighborhoodafter dark
2014 City of Des Peres Community Survey
Shading reflects the mean rating for all respondents by CBG (merged as needed)
LEGENDMean rating on a 4‐point scale, where:
1.0‐1.75 Very Unsafe
1.75‐2.5 Somewhat Unsafe
2.5‐3.25 Somewhat Safe
3.25‐4.0 Very Safe
Other (no responses)
2014 City of Des Peres Community Survey: Appendix A - GIS Maps
ETC Institute (2014) A-38

Q10c Feeling of safety walking alone in the neighborhoodduring the day
2014 City of Des Peres Community Survey
Shading reflects the mean rating for all respondents by CBG (merged as needed)
LEGENDMean rating on a 4‐point scale, where:
1.0‐1.75 Very Unsafe
1.75‐2.5 Somewhat Unsafe
2.5‐3.25 Somewhat Safe
3.25‐4.0 Very Safe
Other (no responses)
2014 City of Des Peres Community Survey: Appendix A - GIS Maps
ETC Institute (2014) A-39
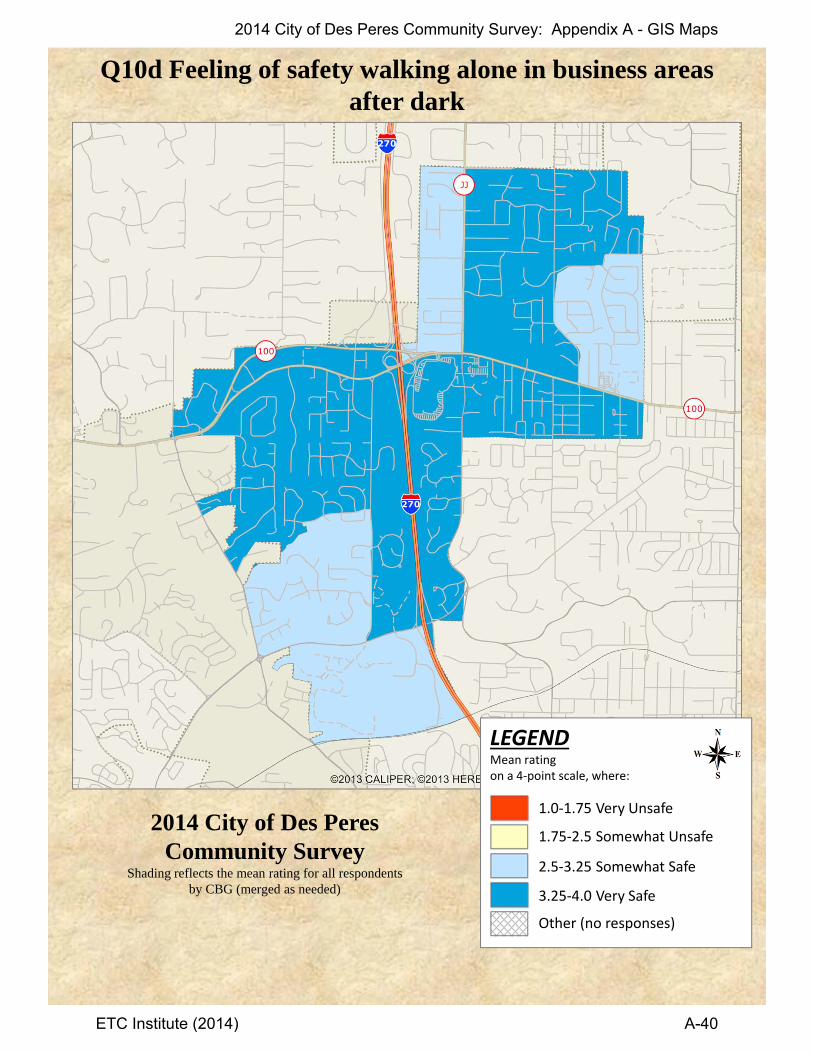
Q10d Feeling of safety walking alone in business areasafter dark
2014 City of Des Peres Community Survey
Shading reflects the mean rating for all respondents by CBG (merged as needed)
LEGENDMean rating on a 4‐point scale, where:
1.0‐1.75 Very Unsafe
1.75‐2.5 Somewhat Unsafe
2.5‐3.25 Somewhat Safe
3.25‐4.0 Very Safe
Other (no responses)
2014 City of Des Peres Community Survey: Appendix A - GIS Maps
ETC Institute (2014) A-40

Q10e Feeling of safety walking in business areas during the day
2014 City of Des Peres Community Survey
Shading reflects the mean rating for all respondents by CBG (merged as needed)
LEGENDMean rating on a 4‐point scale, where:
1.0‐1.75 Very Unsafe
1.75‐2.5 Somewhat Unsafe
2.5‐3.25 Somewhat Safe
3.25‐4.0 Very Safe
Other (no responses)
2014 City of Des Peres Community Survey: Appendix A - GIS Maps
ETC Institute (2014) A-41

Q10f Overall feeling of safety in Des Peres
2014 City of Des Peres Community Survey
Shading reflects the mean rating for all respondents by CBG (merged as needed)
LEGENDMean rating on a 4‐point scale, where:
1.0‐1.75 Very Unsafe
1.75‐2.5 Somewhat Unsafe
2.5‐3.25 Somewhat Safe
3.25‐4.0 Very Safe
Other (no responses)
2014 City of Des Peres Community Survey: Appendix A - GIS Maps
ETC Institute (2014) A-42
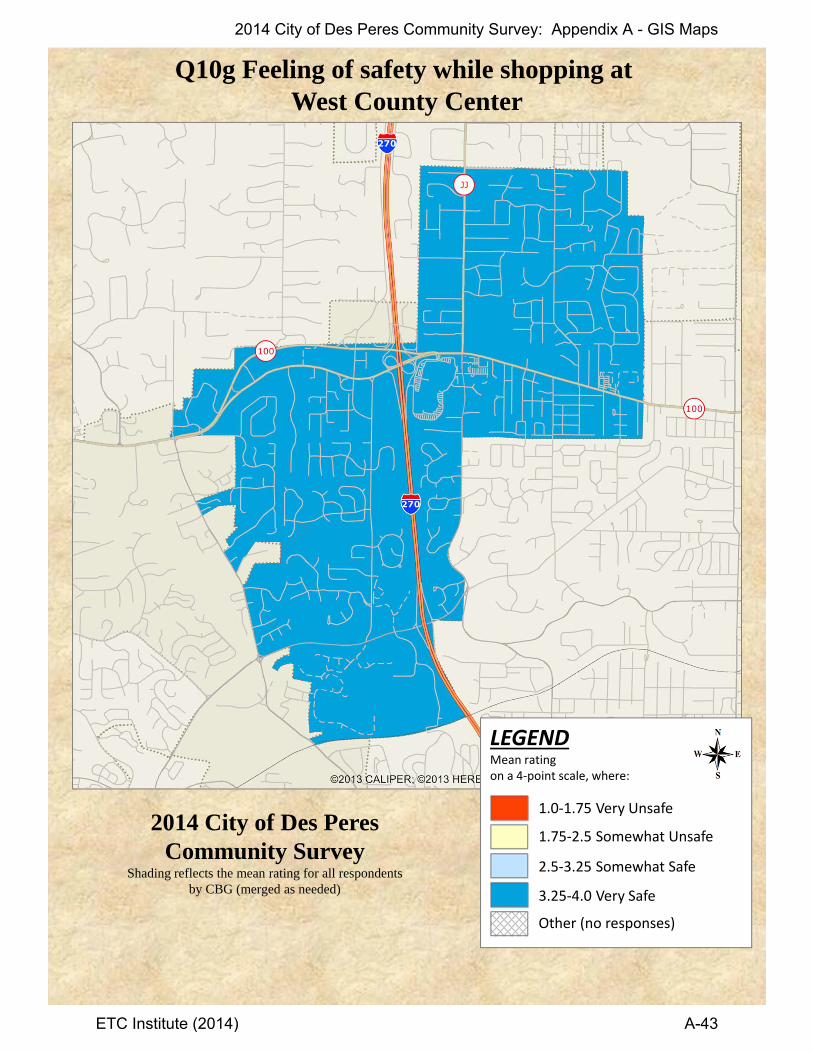
Q10g Feeling of safety while shopping at West County Center
2014 City of Des Peres Community Survey
Shading reflects the mean rating for all respondents by CBG (merged as needed)
LEGENDMean rating on a 4‐point scale, where:
1.0‐1.75 Very Unsafe
1.75‐2.5 Somewhat Unsafe
2.5‐3.25 Somewhat Safe
3.25‐4.0 Very Safe
Other (no responses)
2014 City of Des Peres Community Survey: Appendix A - GIS Maps
ETC Institute (2014) A-43

Q13a Satisfaction with maintenance of major City streets
2014 City of Des Peres Community Survey
Shading reflects the mean rating for all respondents by CBG (merged as needed)
LEGENDMean rating on a 5‐point scale, where:
1.0‐1.8 Very Dissatisfied
1.8‐2.6 Dissatisfied
2.6‐3.4 Neutral
3.4‐4.2 Satisfied
4.2‐5.0 Very Satisfied
Other (no responses)
2014 City of Des Peres Community Survey: Appendix A - GIS Maps
ETC Institute (2014) A-44
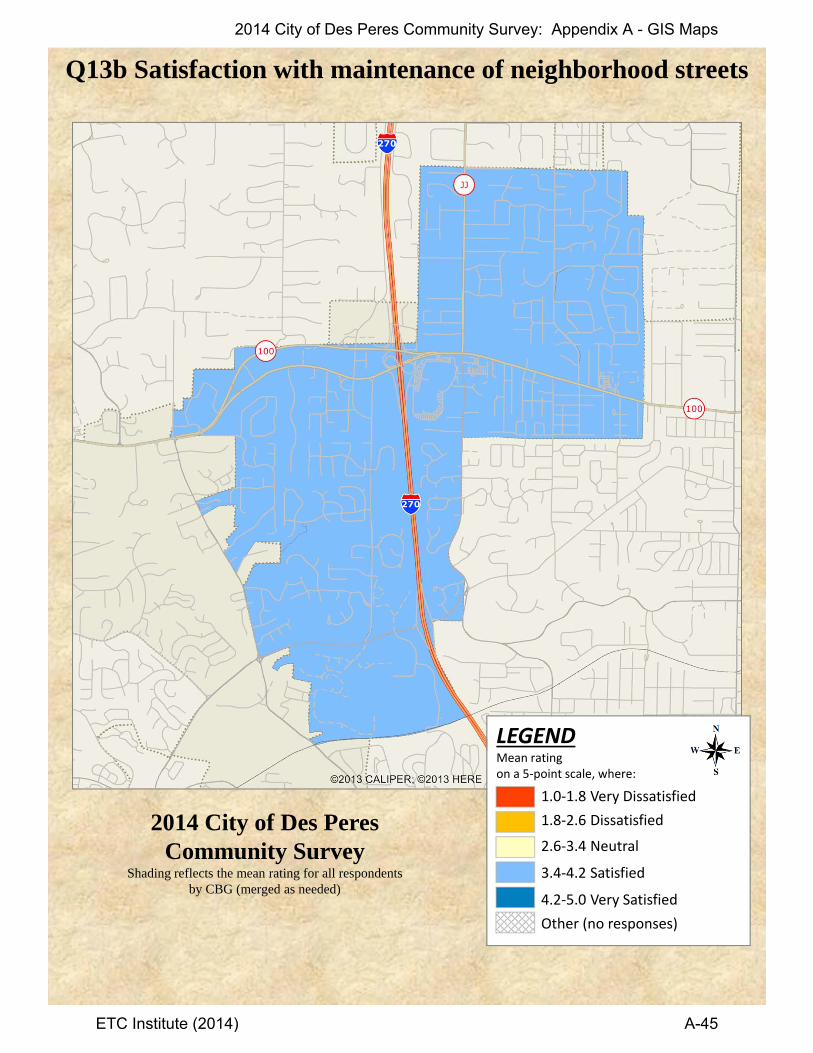
Q13b Satisfaction with maintenance of neighborhood streets
2014 City of Des Peres Community Survey
Shading reflects the mean rating for all respondents by CBG (merged as needed)
LEGENDMean rating on a 5‐point scale, where:
1.0‐1.8 Very Dissatisfied
1.8‐2.6 Dissatisfied
2.6‐3.4 Neutral
3.4‐4.2 Satisfied
4.2‐5.0 Very Satisfied
Other (no responses)
2014 City of Des Peres Community Survey: Appendix A - GIS Maps
ETC Institute (2014) A-45
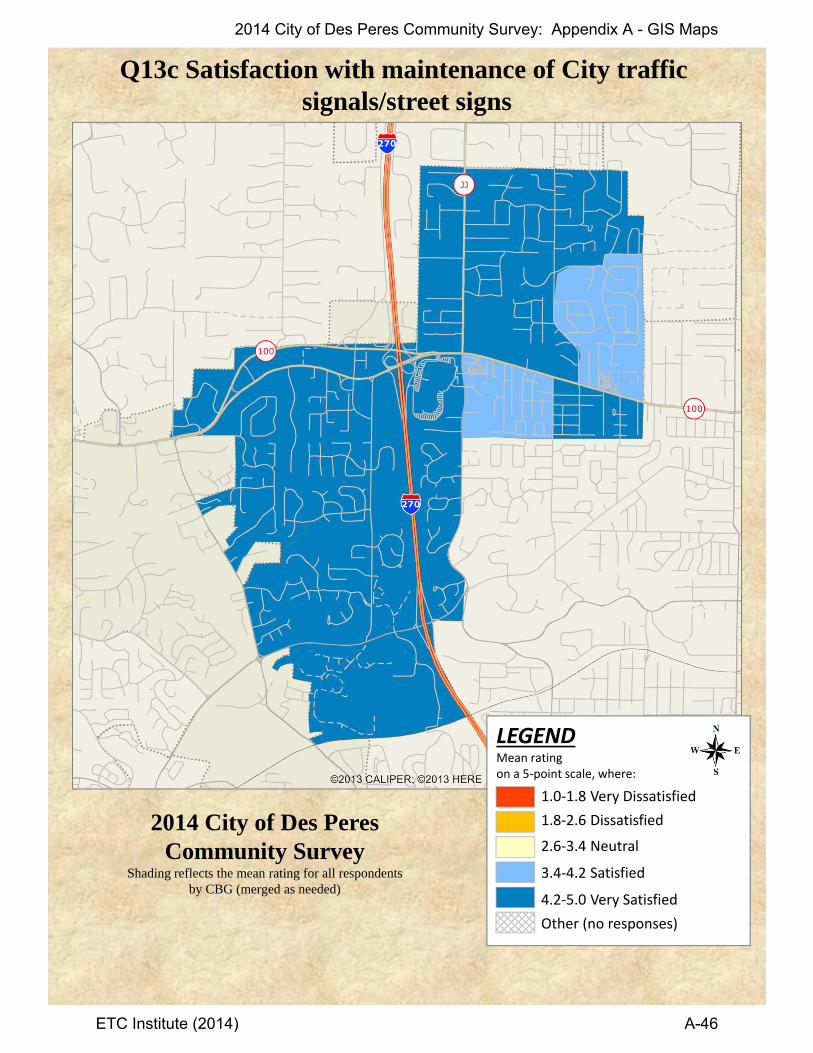
Q13c Satisfaction with maintenance of City traffic signals/street signs
2014 City of Des Peres Community Survey
Shading reflects the mean rating for all respondents by CBG (merged as needed)
LEGENDMean rating on a 5‐point scale, where:
1.0‐1.8 Very Dissatisfied
1.8‐2.6 Dissatisfied
2.6‐3.4 Neutral
3.4‐4.2 Satisfied
4.2‐5.0 Very Satisfied
Other (no responses)
2014 City of Des Peres Community Survey: Appendix A - GIS Maps
ETC Institute (2014) A-46

Q13d Satisfaction with maintenance of City buildings
2014 City of Des Peres Community Survey
Shading reflects the mean rating for all respondents by CBG (merged as needed)
LEGENDMean rating on a 5‐point scale, where:
1.0‐1.8 Very Dissatisfied
1.8‐2.6 Dissatisfied
2.6‐3.4 Neutral
3.4‐4.2 Satisfied
4.2‐5.0 Very Satisfied
Other (no responses)
2014 City of Des Peres Community Survey: Appendix A - GIS Maps
ETC Institute (2014) A-47
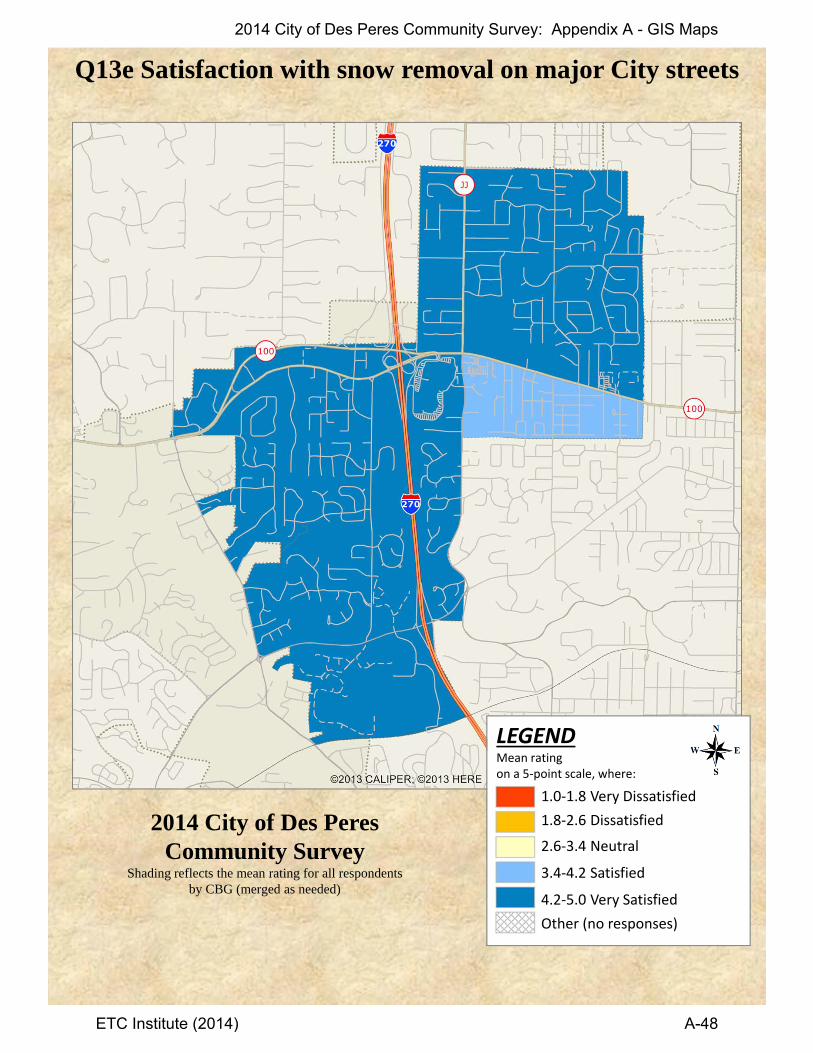
Q13e Satisfaction with snow removal on major City streets
2014 City of Des Peres Community Survey
Shading reflects the mean rating for all respondents by CBG (merged as needed)
LEGENDMean rating on a 5‐point scale, where:
1.0‐1.8 Very Dissatisfied
1.8‐2.6 Dissatisfied
2.6‐3.4 Neutral
3.4‐4.2 Satisfied
4.2‐5.0 Very Satisfied
Other (no responses)
2014 City of Des Peres Community Survey: Appendix A - GIS Maps
ETC Institute (2014) A-48

Q13f Satisfaction with snow removal on neighborhood streets
2014 City of Des Peres Community Survey
Shading reflects the mean rating for all respondents by CBG (merged as needed)
LEGENDMean rating on a 5‐point scale, where:
1.0‐1.8 Very Dissatisfied
1.8‐2.6 Dissatisfied
2.6‐3.4 Neutral
3.4‐4.2 Satisfied
4.2‐5.0 Very Satisfied
Other (no responses)
2014 City of Des Peres Community Survey: Appendix A - GIS Maps
ETC Institute (2014) A-49
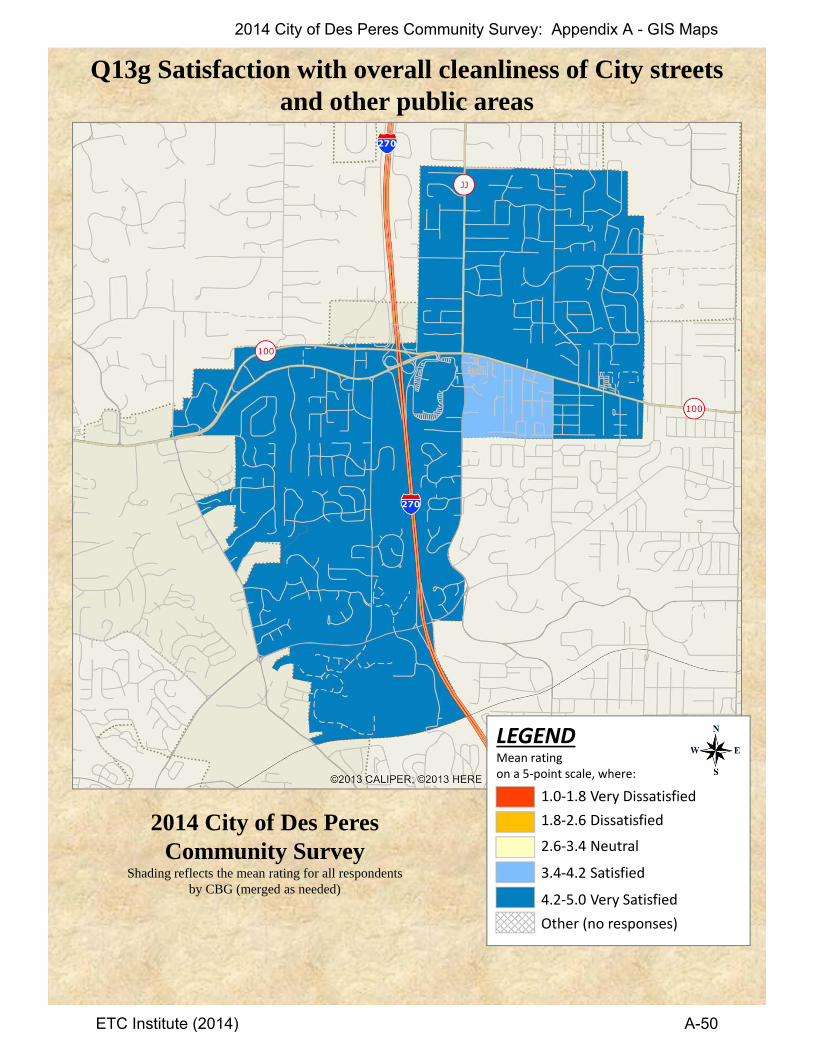
Q13g Satisfaction with overall cleanliness of City streetsand other public areas
2014 City of Des Peres Community Survey
Shading reflects the mean rating for all respondents by CBG (merged as needed)
LEGENDMean rating on a 5‐point scale, where:
1.0‐1.8 Very Dissatisfied
1.8‐2.6 Dissatisfied
2.6‐3.4 Neutral
3.4‐4.2 Satisfied
4.2‐5.0 Very Satisfied
Other (no responses)
2014 City of Des Peres Community Survey: Appendix A - GIS Maps
ETC Institute (2014) A-50
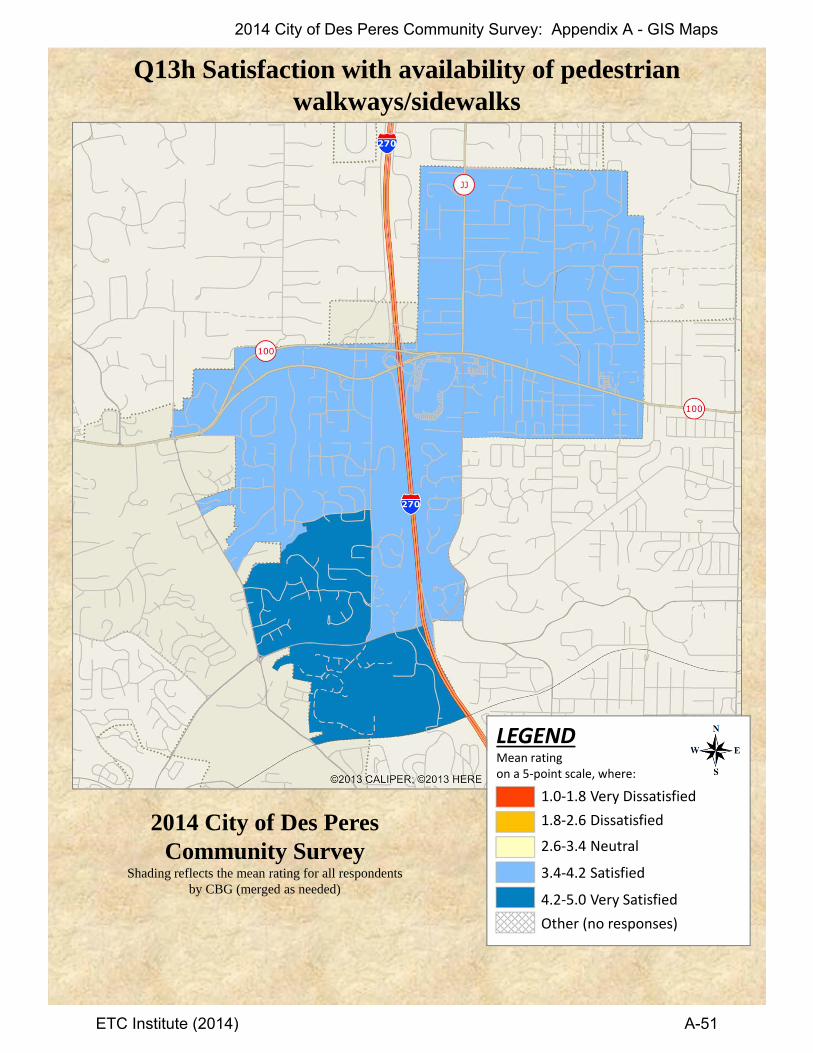
Q13h Satisfaction with availability of pedestrianwalkways/sidewalks
2014 City of Des Peres Community Survey
Shading reflects the mean rating for all respondents by CBG (merged as needed)
LEGENDMean rating on a 5‐point scale, where:
1.0‐1.8 Very Dissatisfied
1.8‐2.6 Dissatisfied
2.6‐3.4 Neutral
3.4‐4.2 Satisfied
4.2‐5.0 Very Satisfied
Other (no responses)
2014 City of Des Peres Community Survey: Appendix A - GIS Maps
ETC Institute (2014) A-51

Q13i Satisfaction with condition of City sidewalks
2014 City of Des Peres Community Survey
Shading reflects the mean rating for all respondents by CBG (merged as needed)
LEGENDMean rating on a 5‐point scale, where:
1.0‐1.8 Very Dissatisfied
1.8‐2.6 Dissatisfied
2.6‐3.4 Neutral
3.4‐4.2 Satisfied
4.2‐5.0 Very Satisfied
Other (no responses)
2014 City of Des Peres Community Survey: Appendix A - GIS Maps
ETC Institute (2014) A-52
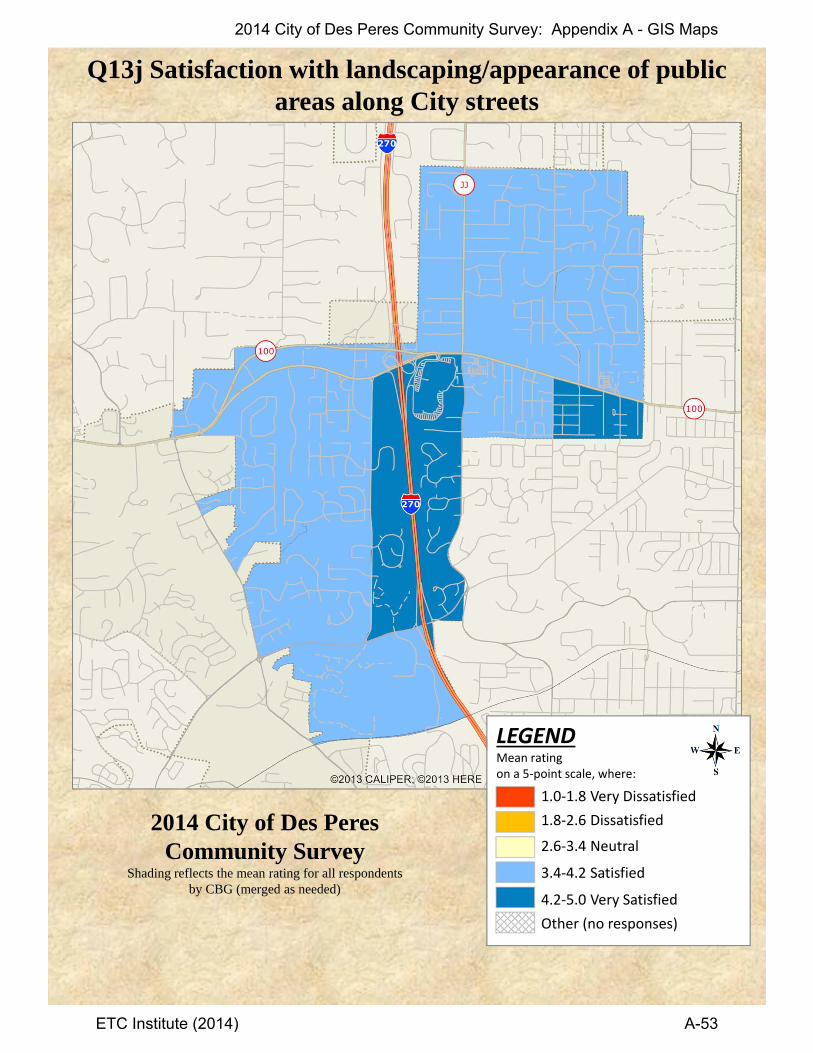
Q13j Satisfaction with landscaping/appearance of publicareas along City streets
2014 City of Des Peres Community Survey
Shading reflects the mean rating for all respondents by CBG (merged as needed)
LEGENDMean rating on a 5‐point scale, where:
1.0‐1.8 Very Dissatisfied
1.8‐2.6 Dissatisfied
2.6‐3.4 Neutral
3.4‐4.2 Satisfied
4.2‐5.0 Very Satisfied
Other (no responses)
2014 City of Des Peres Community Survey: Appendix A - GIS Maps
ETC Institute (2014) A-53
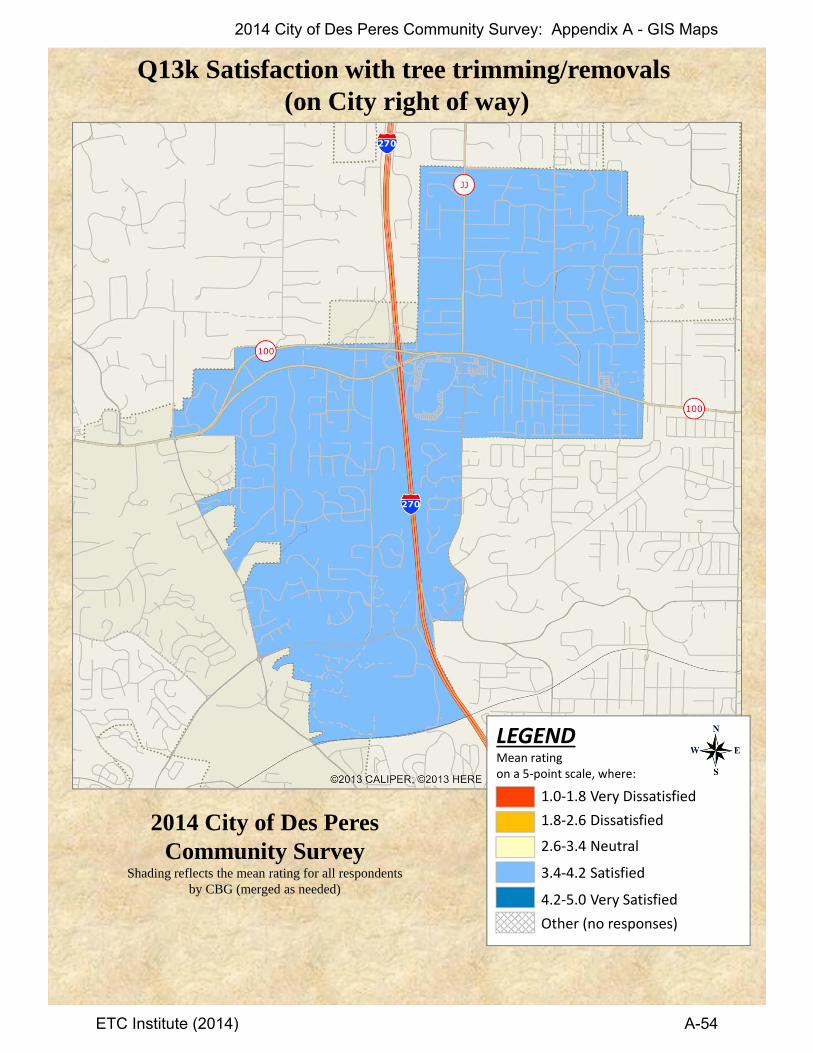
Q13k Satisfaction with tree trimming/removals (on City right of way)
2014 City of Des Peres Community Survey
Shading reflects the mean rating for all respondents by CBG (merged as needed)
LEGENDMean rating on a 5‐point scale, where:
1.0‐1.8 Very Dissatisfied
1.8‐2.6 Dissatisfied
2.6‐3.4 Neutral
3.4‐4.2 Satisfied
4.2‐5.0 Very Satisfied
Other (no responses)
2014 City of Des Peres Community Survey: Appendix A - GIS Maps
ETC Institute (2014) A-54

Q16a Satisfaction with maintenance of City parks
2014 City of Des Peres Community Survey
Shading reflects the mean rating for all respondents by CBG (merged as needed)
LEGENDMean rating on a 5‐point scale, where:
1.0‐1.8 Very Dissatisfied
1.8‐2.6 Dissatisfied
2.6‐3.4 Neutral
3.4‐4.2 Satisfied
4.2‐5.0 Very Satisfied
Other (no responses)
2014 City of Des Peres Community Survey: Appendix A - GIS Maps
ETC Institute (2014) A-55

Q16b Satisfaction with the number of parks
2014 City of Des Peres Community Survey
Shading reflects the mean rating for all respondents by CBG (merged as needed)
LEGENDMean rating on a 5‐point scale, where:
1.0‐1.8 Very Dissatisfied
1.8‐2.6 Dissatisfied
2.6‐3.4 Neutral
3.4‐4.2 Satisfied
4.2‐5.0 Very Satisfied
Other (no responses)
2014 City of Des Peres Community Survey: Appendix A - GIS Maps
ETC Institute (2014) A-56
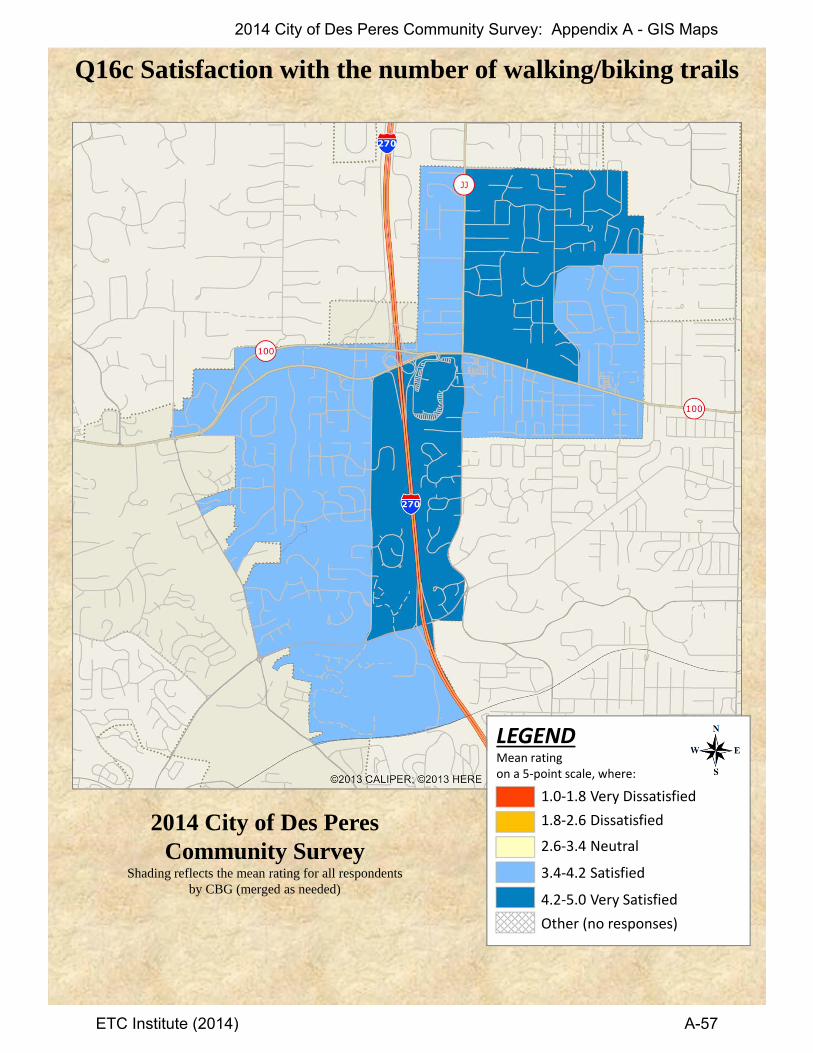
Q16c Satisfaction with the number of walking/biking trails
2014 City of Des Peres Community Survey
Shading reflects the mean rating for all respondents by CBG (merged as needed)
LEGENDMean rating on a 5‐point scale, where:
1.0‐1.8 Very Dissatisfied
1.8‐2.6 Dissatisfied
2.6‐3.4 Neutral
3.4‐4.2 Satisfied
4.2‐5.0 Very Satisfied
Other (no responses)
2014 City of Des Peres Community Survey: Appendix A - GIS Maps
ETC Institute (2014) A-57
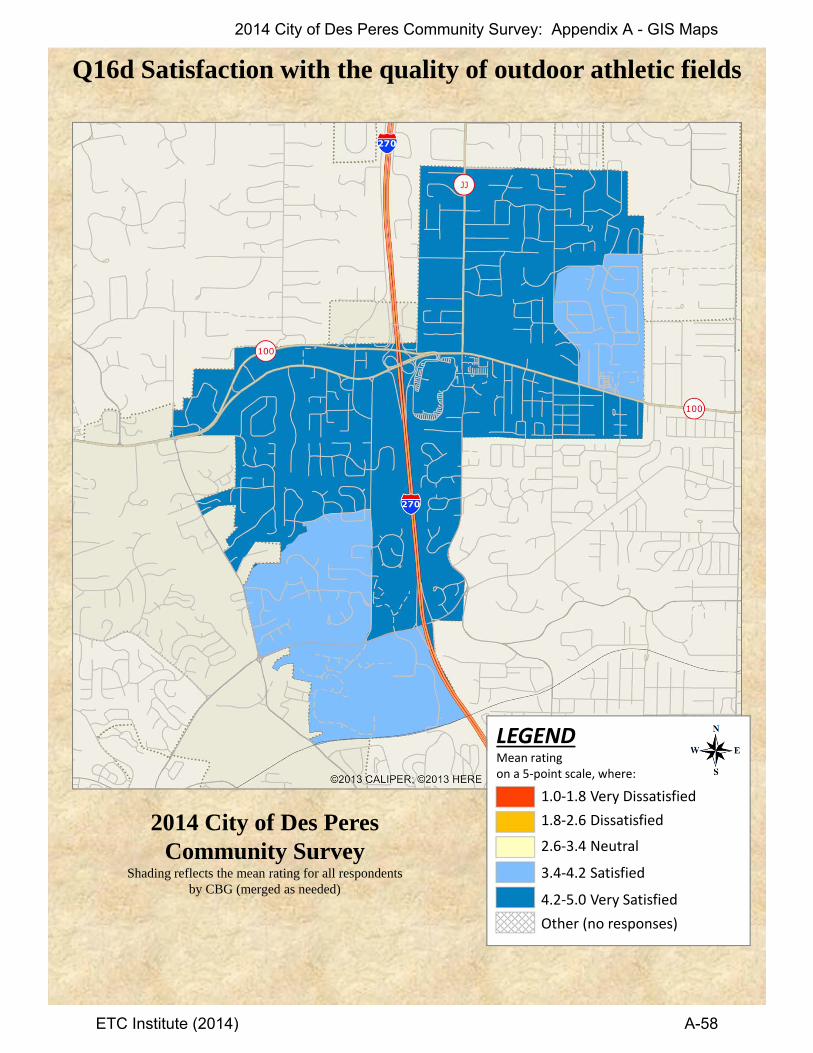
Q16d Satisfaction with the quality of outdoor athletic fields
2014 City of Des Peres Community Survey
Shading reflects the mean rating for all respondents by CBG (merged as needed)
LEGENDMean rating on a 5‐point scale, where:
1.0‐1.8 Very Dissatisfied
1.8‐2.6 Dissatisfied
2.6‐3.4 Neutral
3.4‐4.2 Satisfied
4.2‐5.0 Very Satisfied
Other (no responses)
2014 City of Des Peres Community Survey: Appendix A - GIS Maps
ETC Institute (2014) A-58

Q16e Satisfaction with the number of outdoor athletic fields
2014 City of Des Peres Community Survey
Shading reflects the mean rating for all respondents by CBG (merged as needed)
LEGENDMean rating on a 5‐point scale, where:
1.0‐1.8 Very Dissatisfied
1.8‐2.6 Dissatisfied
2.6‐3.4 Neutral
3.4‐4.2 Satisfied
4.2‐5.0 Very Satisfied
Other (no responses)
2014 City of Des Peres Community Survey: Appendix A - GIS Maps
ETC Institute (2014) A-59

Q16f Satisfaction with the number of playgrounds
2014 City of Des Peres Community Survey
Shading reflects the mean rating for all respondents by CBG (merged as needed)
LEGENDMean rating on a 5‐point scale, where:
1.0‐1.8 Very Dissatisfied
1.8‐2.6 Dissatisfied
2.6‐3.4 Neutral
3.4‐4.2 Satisfied
4.2‐5.0 Very Satisfied
Other (no responses)
2014 City of Des Peres Community Survey: Appendix A - GIS Maps
ETC Institute (2014) A-60

Q16g Satisfaction with the quality of playgrounds
2014 City of Des Peres Community Survey
Shading reflects the mean rating for all respondents by CBG (merged as needed)
LEGENDMean rating on a 5‐point scale, where:
1.0‐1.8 Very Dissatisfied
1.8‐2.6 Dissatisfied
2.6‐3.4 Neutral
3.4‐4.2 Satisfied
4.2‐5.0 Very Satisfied
Other (no responses)
2014 City of Des Peres Community Survey: Appendix A - GIS Maps
ETC Institute (2014) A-61

Q16h Satisfaction with the availability of information aboutCity parks and recreation programs
2014 City of Des Peres Community Survey
Shading reflects the mean rating for all respondents by CBG (merged as needed)
LEGENDMean rating on a 5‐point scale, where:
1.0‐1.8 Very Dissatisfied
1.8‐2.6 Dissatisfied
2.6‐3.4 Neutral
3.4‐4.2 Satisfied
4.2‐5.0 Very Satisfied
Other (no responses)
2014 City of Des Peres Community Survey: Appendix A - GIS Maps
ETC Institute (2014) A-62

Q16i Satisfaction with City recreation opportunities
2014 City of Des Peres Community Survey
Shading reflects the mean rating for all respondents by CBG (merged as needed)
LEGENDMean rating on a 5‐point scale, where:
1.0‐1.8 Very Dissatisfied
1.8‐2.6 Dissatisfied
2.6‐3.4 Neutral
3.4‐4.2 Satisfied
4.2‐5.0 Very Satisfied
Other (no responses)
2014 City of Des Peres Community Survey: Appendix A - GIS Maps
ETC Institute (2014) A-63
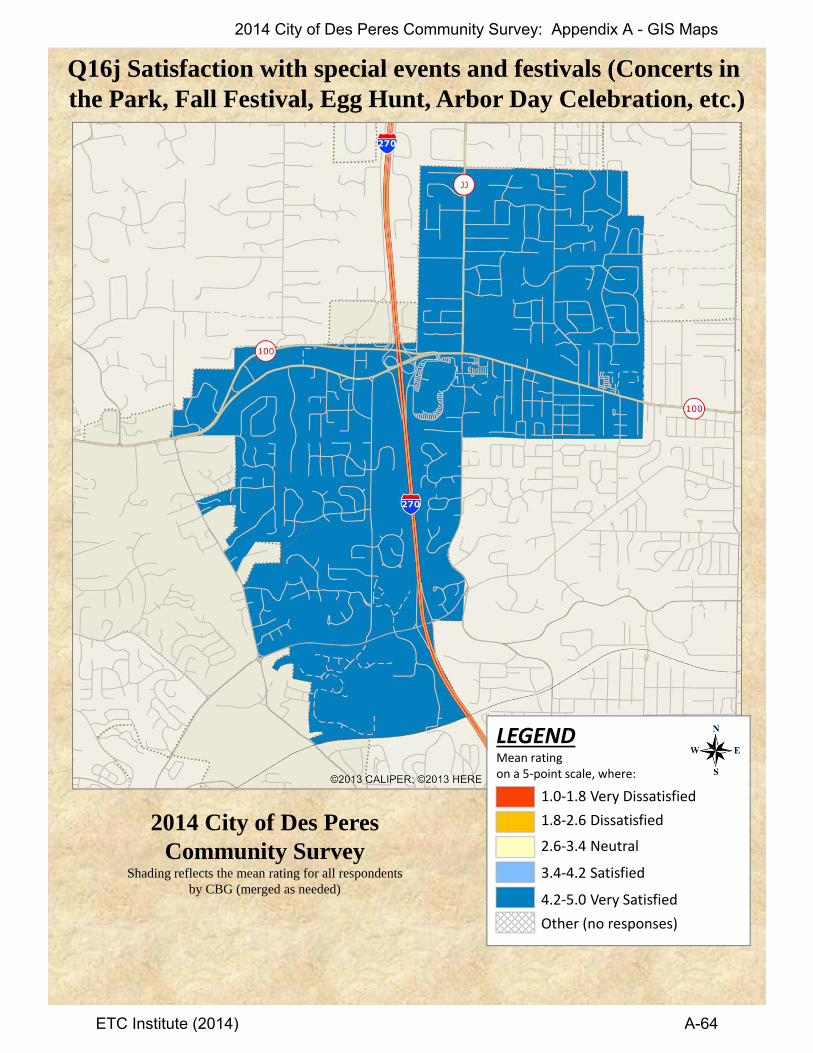
Q16j Satisfaction with special events and festivals (Concerts in the Park, Fall Festival, Egg Hunt, Arbor Day Celebration, etc.)
2014 City of Des Peres Community Survey
Shading reflects the mean rating for all respondents by CBG (merged as needed)
LEGENDMean rating on a 5‐point scale, where:
1.0‐1.8 Very Dissatisfied
1.8‐2.6 Dissatisfied
2.6‐3.4 Neutral
3.4‐4.2 Satisfied
4.2‐5.0 Very Satisfied
Other (no responses)
2014 City of Des Peres Community Survey: Appendix A - GIS Maps
ETC Institute (2014) A-64
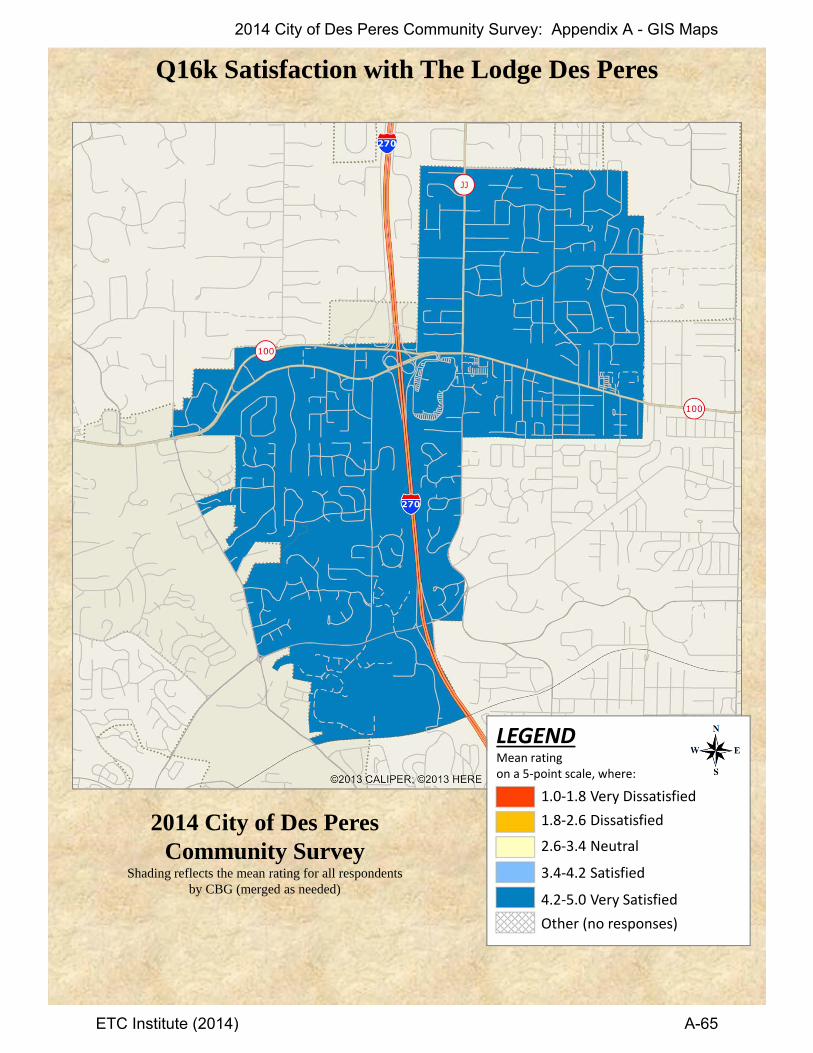
Q16k Satisfaction with The Lodge Des Peres
2014 City of Des Peres Community Survey
Shading reflects the mean rating for all respondents by CBG (merged as needed)
LEGENDMean rating on a 5‐point scale, where:
1.0‐1.8 Very Dissatisfied
1.8‐2.6 Dissatisfied
2.6‐3.4 Neutral
3.4‐4.2 Satisfied
4.2‐5.0 Very Satisfied
Other (no responses)
2014 City of Des Peres Community Survey: Appendix A - GIS Maps
ETC Institute (2014) A-65
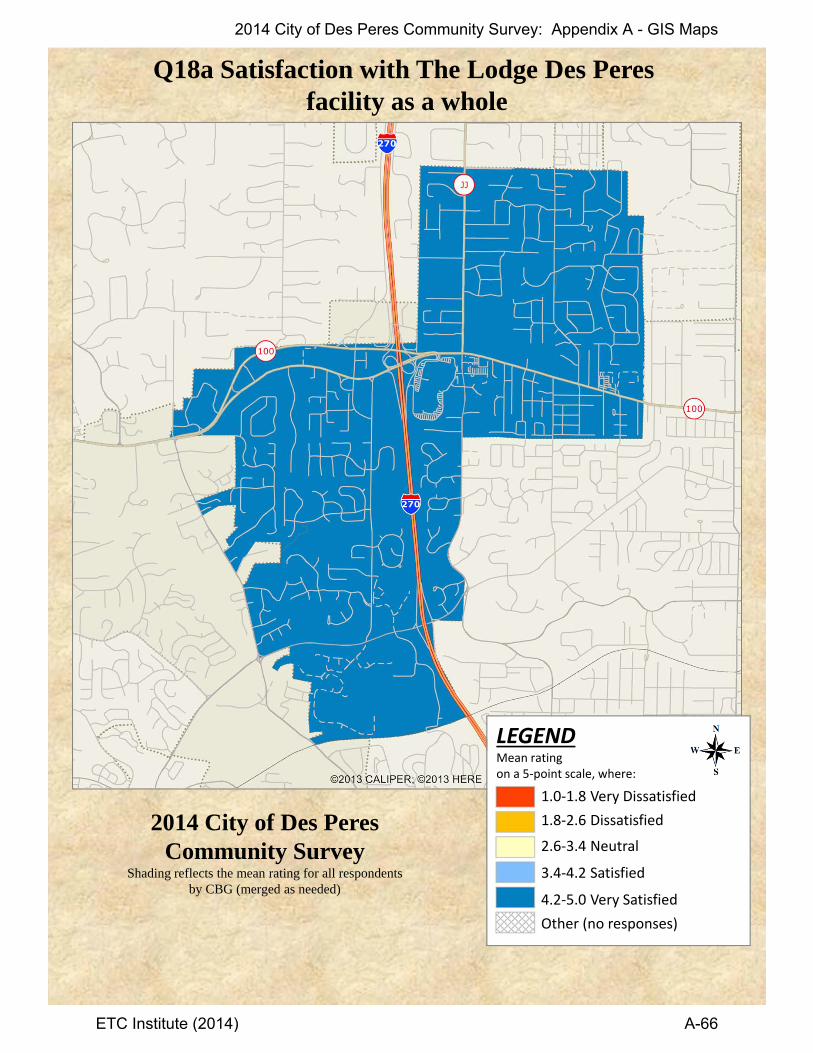
Q18a Satisfaction with The Lodge Des Peres facility as a whole
2014 City of Des Peres Community Survey
Shading reflects the mean rating for all respondents by CBG (merged as needed)
LEGENDMean rating on a 5‐point scale, where:
1.0‐1.8 Very Dissatisfied
1.8‐2.6 Dissatisfied
2.6‐3.4 Neutral
3.4‐4.2 Satisfied
4.2‐5.0 Very Satisfied
Other (no responses)
2014 City of Des Peres Community Survey: Appendix A - GIS Maps
ETC Institute (2014) A-66
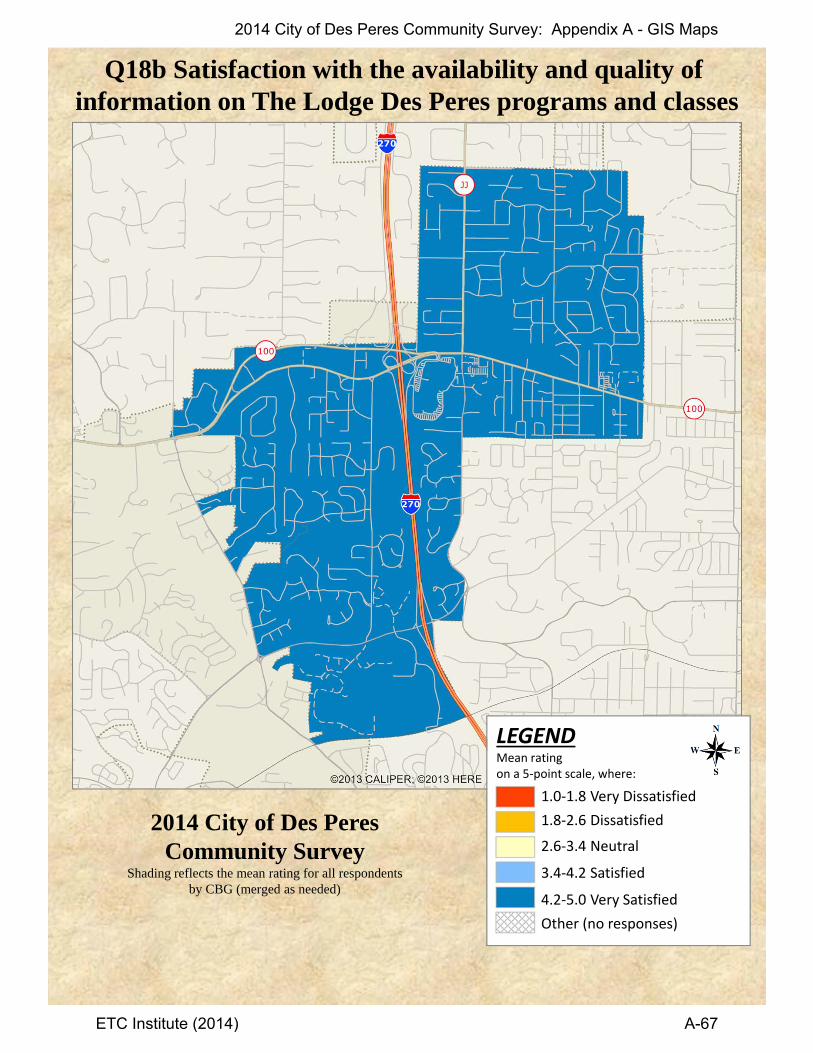
Q18b Satisfaction with the availability and quality of information on The Lodge Des Peres programs and classes
2014 City of Des Peres Community Survey
Shading reflects the mean rating for all respondents by CBG (merged as needed)
LEGENDMean rating on a 5‐point scale, where:
1.0‐1.8 Very Dissatisfied
1.8‐2.6 Dissatisfied
2.6‐3.4 Neutral
3.4‐4.2 Satisfied
4.2‐5.0 Very Satisfied
Other (no responses)
2014 City of Des Peres Community Survey: Appendix A - GIS Maps
ETC Institute (2014) A-67
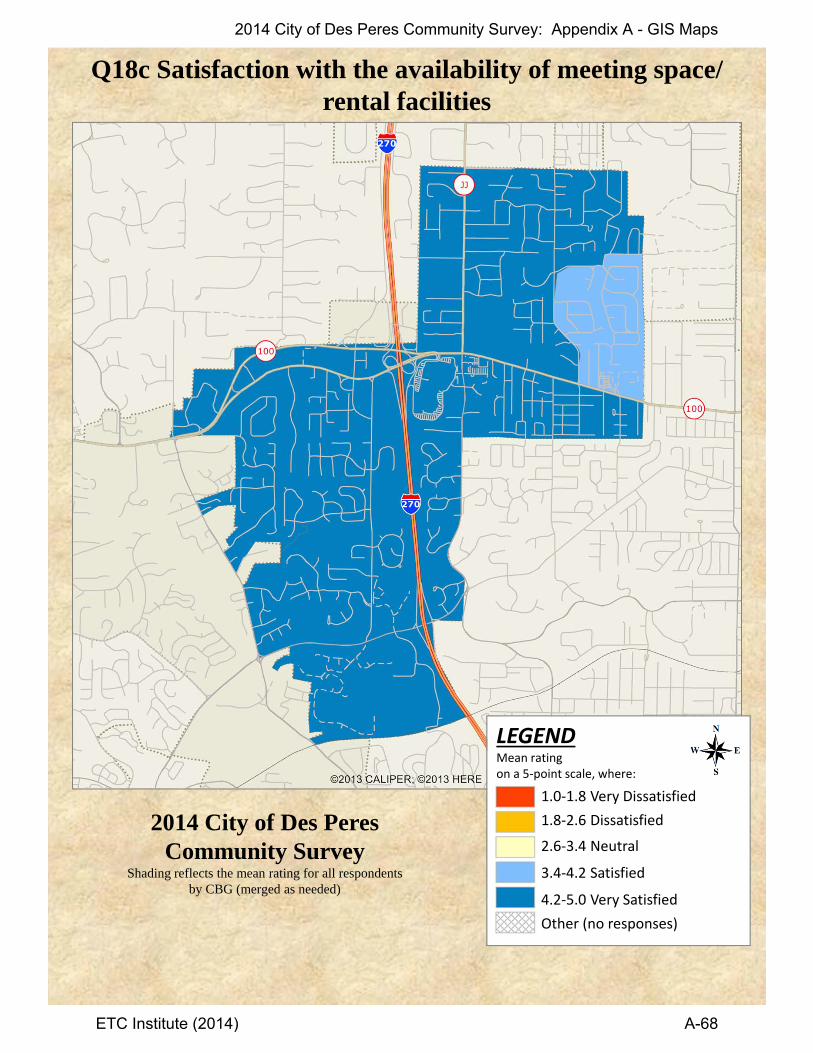
Q18c Satisfaction with the availability of meeting space/rental facilities
2014 City of Des Peres Community Survey
Shading reflects the mean rating for all respondents by CBG (merged as needed)
LEGENDMean rating on a 5‐point scale, where:
1.0‐1.8 Very Dissatisfied
1.8‐2.6 Dissatisfied
2.6‐3.4 Neutral
3.4‐4.2 Satisfied
4.2‐5.0 Very Satisfied
Other (no responses)
2014 City of Des Peres Community Survey: Appendix A - GIS Maps
ETC Institute (2014) A-68

Q18d Satisfaction with the quality of meeting space/rental facilities
2014 City of Des Peres Community Survey
Shading reflects the mean rating for all respondents by CBG (merged as needed)
LEGENDMean rating on a 5‐point scale, where:
1.0‐1.8 Very Dissatisfied
1.8‐2.6 Dissatisfied
2.6‐3.4 Neutral
3.4‐4.2 Satisfied
4.2‐5.0 Very Satisfied
Other (no responses)
2014 City of Des Peres Community Survey: Appendix A - GIS Maps
ETC Institute (2014) A-69

Q18e Satisfaction with the fitness center
2014 City of Des Peres Community Survey
Shading reflects the mean rating for all respondents by CBG (merged as needed)
LEGENDMean rating on a 5‐point scale, where:
1.0‐1.8 Very Dissatisfied
1.8‐2.6 Dissatisfied
2.6‐3.4 Neutral
3.4‐4.2 Satisfied
4.2‐5.0 Very Satisfied
Other (no responses)
2014 City of Des Peres Community Survey: Appendix A - GIS Maps
ETC Institute (2014) A-70

Q18f Satisfaction with indoor aquatic facilities
2014 City of Des Peres Community Survey
Shading reflects the mean rating for all respondents by CBG (merged as needed)
LEGENDMean rating on a 5‐point scale, where:
1.0‐1.8 Very Dissatisfied
1.8‐2.6 Dissatisfied
2.6‐3.4 Neutral
3.4‐4.2 Satisfied
4.2‐5.0 Very Satisfied
Other (no responses)
2014 City of Des Peres Community Survey: Appendix A - GIS Maps
ETC Institute (2014) A-71

Q18g Satisfaction with outdoor aquatic facilities
2014 City of Des Peres Community Survey
Shading reflects the mean rating for all respondents by CBG (merged as needed)
LEGENDMean rating on a 5‐point scale, where:
1.0‐1.8 Very Dissatisfied
1.8‐2.6 Dissatisfied
2.6‐3.4 Neutral
3.4‐4.2 Satisfied
4.2‐5.0 Very Satisfied
Other (no responses)
2014 City of Des Peres Community Survey: Appendix A - GIS Maps
ETC Institute (2014) A-72
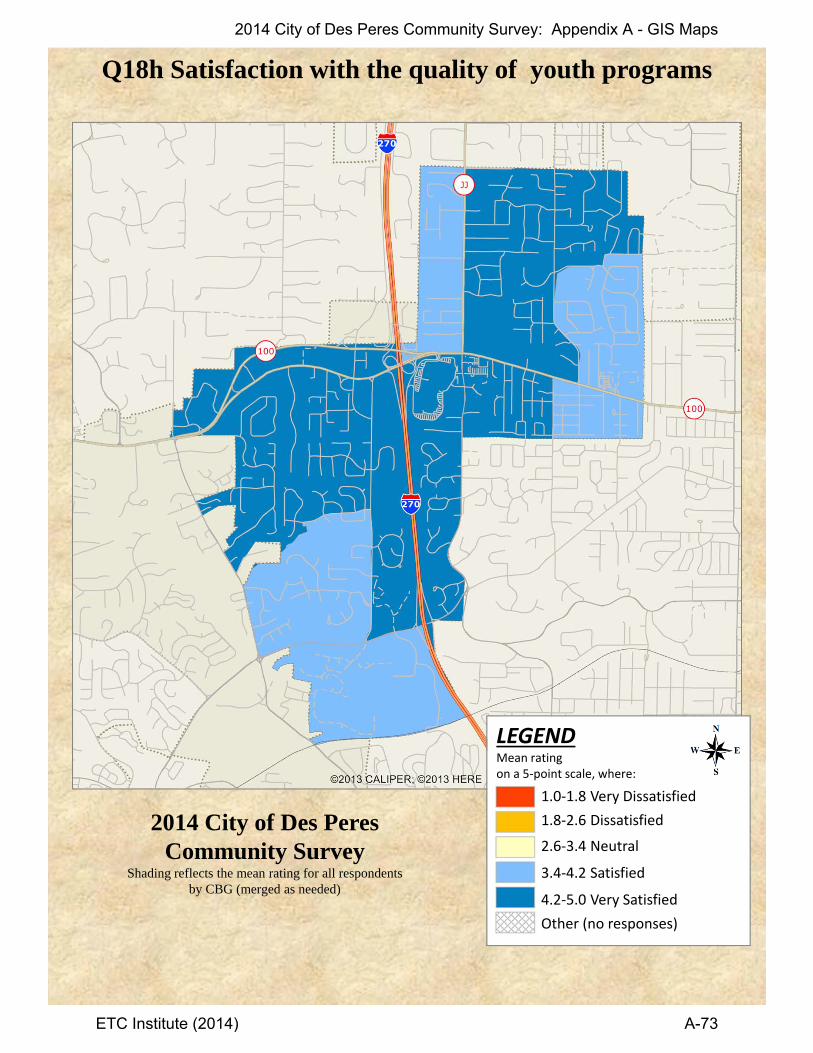
Q18h Satisfaction with the quality of youth programs
2014 City of Des Peres Community Survey
Shading reflects the mean rating for all respondents by CBG (merged as needed)
LEGENDMean rating on a 5‐point scale, where:
1.0‐1.8 Very Dissatisfied
1.8‐2.6 Dissatisfied
2.6‐3.4 Neutral
3.4‐4.2 Satisfied
4.2‐5.0 Very Satisfied
Other (no responses)
2014 City of Des Peres Community Survey: Appendix A - GIS Maps
ETC Institute (2014) A-73
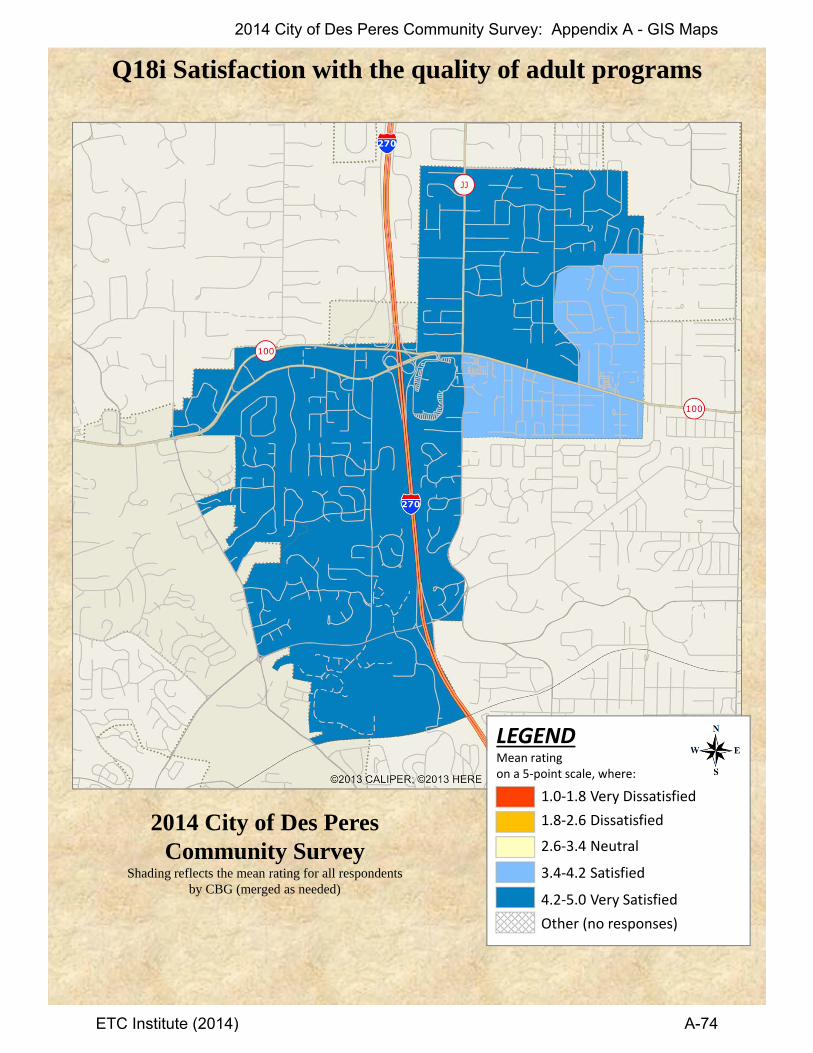
Q18i Satisfaction with the quality of adult programs
2014 City of Des Peres Community Survey
Shading reflects the mean rating for all respondents by CBG (merged as needed)
LEGENDMean rating on a 5‐point scale, where:
1.0‐1.8 Very Dissatisfied
1.8‐2.6 Dissatisfied
2.6‐3.4 Neutral
3.4‐4.2 Satisfied
4.2‐5.0 Very Satisfied
Other (no responses)
2014 City of Des Peres Community Survey: Appendix A - GIS Maps
ETC Institute (2014) A-74
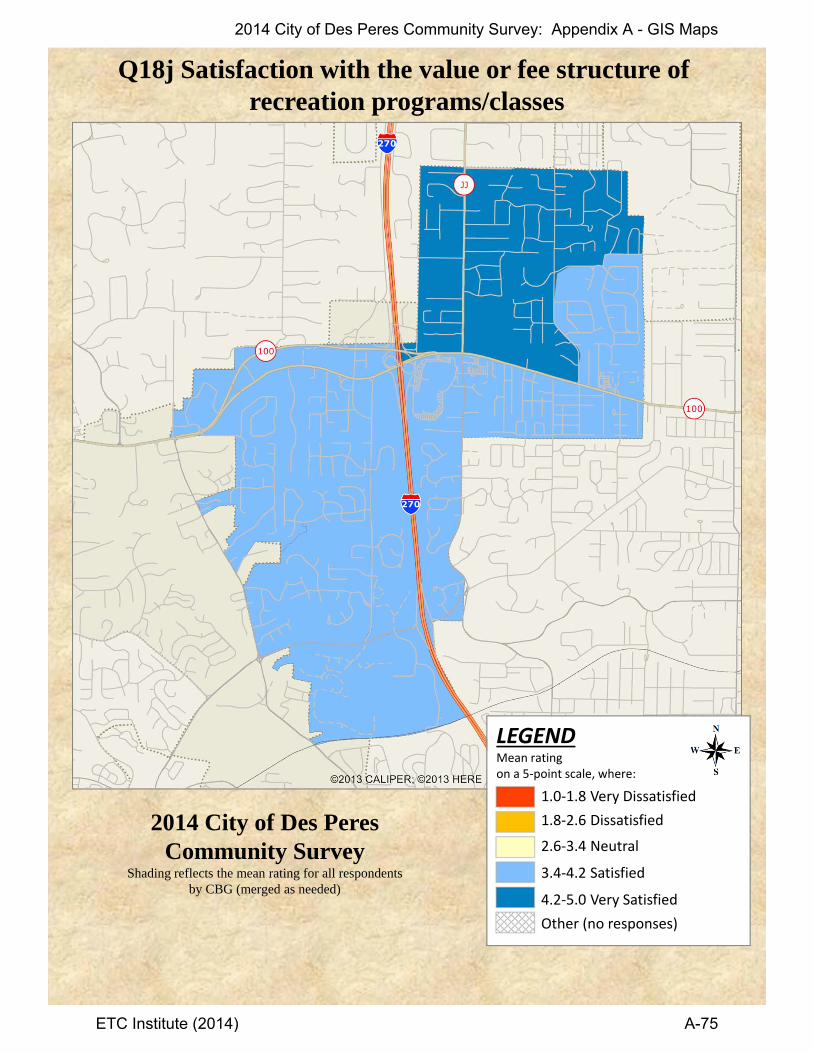
Q18j Satisfaction with the value or fee structure of recreation programs/classes
2014 City of Des Peres Community Survey
Shading reflects the mean rating for all respondents by CBG (merged as needed)
LEGENDMean rating on a 5‐point scale, where:
1.0‐1.8 Very Dissatisfied
1.8‐2.6 Dissatisfied
2.6‐3.4 Neutral
3.4‐4.2 Satisfied
4.2‐5.0 Very Satisfied
Other (no responses)
2014 City of Des Peres Community Survey: Appendix A - GIS Maps
ETC Institute (2014) A-75

Q18k Satisfaction with the cleanliness of The Lodge
2014 City of Des Peres Community Survey
Shading reflects the mean rating for all respondents by CBG (merged as needed)
LEGENDMean rating on a 5‐point scale, where:
1.0‐1.8 Very Dissatisfied
1.8‐2.6 Dissatisfied
2.6‐3.4 Neutral
3.4‐4.2 Satisfied
4.2‐5.0 Very Satisfied
Other (no responses)
2014 City of Des Peres Community Survey: Appendix A - GIS Maps
ETC Institute (2014) A-76

Q18l Satisfaction with customer service provided by The Lodge Des Peres Staff
2014 City of Des Peres Community Survey
Shading reflects the mean rating for all respondents by CBG (merged as needed)
LEGENDMean rating on a 5‐point scale, where:
1.0‐1.8 Very Dissatisfied
1.8‐2.6 Dissatisfied
2.6‐3.4 Neutral
3.4‐4.2 Satisfied
4.2‐5.0 Very Satisfied
Other (no responses)
2014 City of Des Peres Community Survey: Appendix A - GIS Maps
ETC Institute (2014) A-77

Q22a Satisfaction with the availability of information aboutCity programs and services
2014 City of Des Peres Community Survey
Shading reflects the mean rating for all respondents by CBG (merged as needed)
LEGENDMean rating on a 5‐point scale, where:
1.0‐1.8 Very Dissatisfied
1.8‐2.6 Dissatisfied
2.6‐3.4 Neutral
3.4‐4.2 Satisfied
4.2‐5.0 Very Satisfied
Other (no responses)
2014 City of Des Peres Community Survey: Appendix A - GIS Maps
ETC Institute (2014) A-78

Q22b Satisfaction with City efforts to keep residents Informed about local issues
2014 City of Des Peres Community Survey
Shading reflects the mean rating for all respondents by CBG (merged as needed)
LEGENDMean rating on a 5‐point scale, where:
1.0‐1.8 Very Dissatisfied
1.8‐2.6 Dissatisfied
2.6‐3.4 Neutral
3.4‐4.2 Satisfied
4.2‐5.0 Very Satisfied
Other (no responses)
2014 City of Des Peres Community Survey: Appendix A - GIS Maps
ETC Institute (2014) A-79

Q22c Satisfaction with how open the City is to publicinvolvement and input from residents
2014 City of Des Peres Community Survey
Shading reflects the mean rating for all respondents by CBG (merged as needed)
LEGENDMean rating on a 5‐point scale, where:
1.0‐1.8 Very Dissatisfied
1.8‐2.6 Dissatisfied
2.6‐3.4 Neutral
3.4‐4.2 Satisfied
4.2‐5.0 Very Satisfied
Other (no responses)
2014 City of Des Peres Community Survey: Appendix A - GIS Maps
ETC Institute (2014) A-80
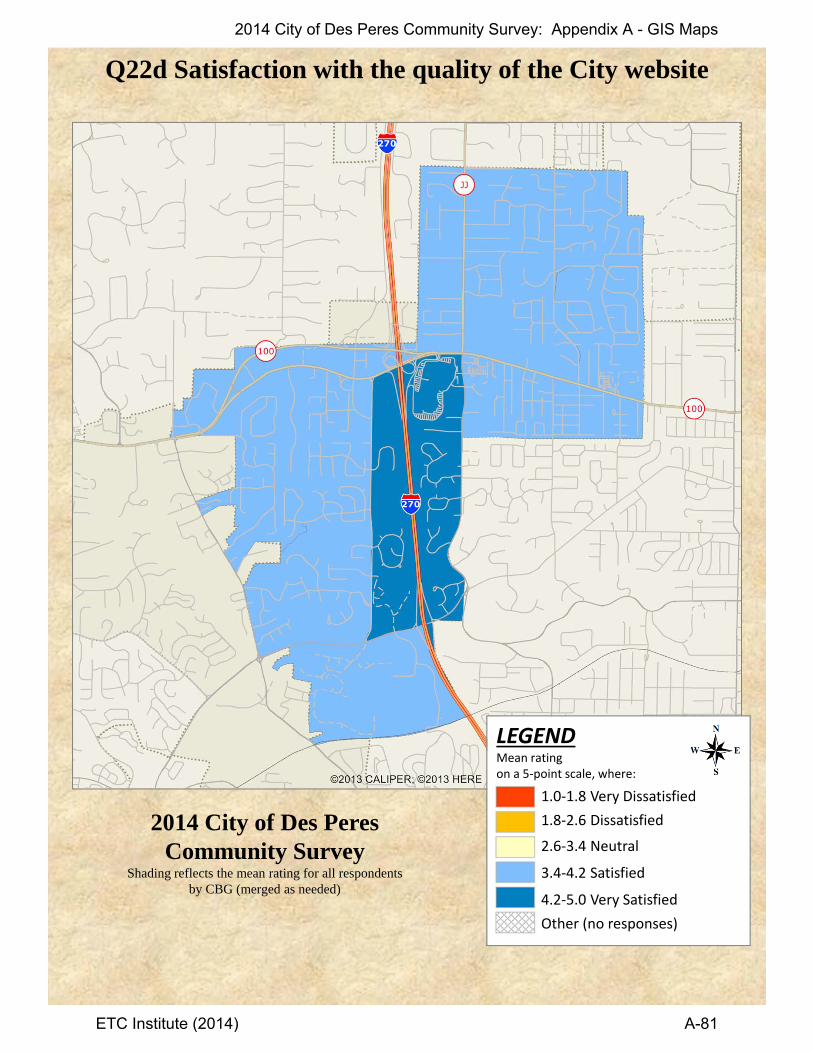
Q22d Satisfaction with the quality of the City website
2014 City of Des Peres Community Survey
Shading reflects the mean rating for all respondents by CBG (merged as needed)
LEGENDMean rating on a 5‐point scale, where:
1.0‐1.8 Very Dissatisfied
1.8‐2.6 Dissatisfied
2.6‐3.4 Neutral
3.4‐4.2 Satisfied
4.2‐5.0 Very Satisfied
Other (no responses)
2014 City of Des Peres Community Survey: Appendix A - GIS Maps
ETC Institute (2014) A-81
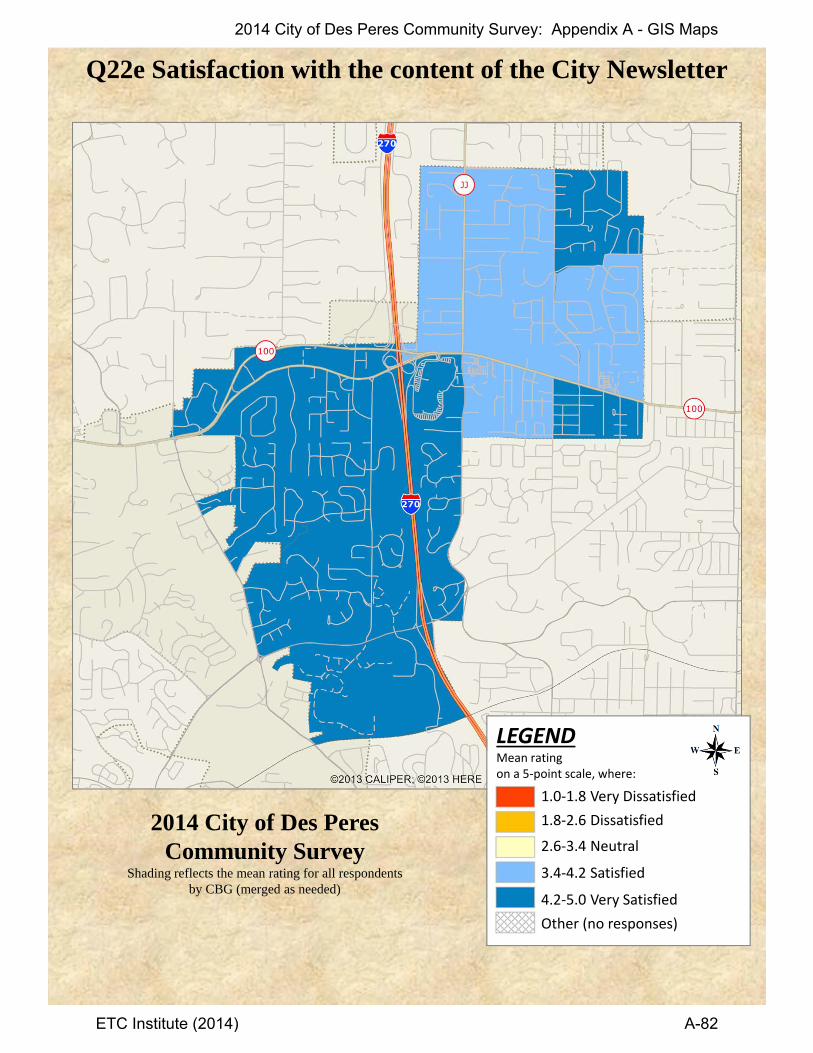
Q22e Satisfaction with the content of the City Newsletter
2014 City of Des Peres Community Survey
Shading reflects the mean rating for all respondents by CBG (merged as needed)
LEGENDMean rating on a 5‐point scale, where:
1.0‐1.8 Very Dissatisfied
1.8‐2.6 Dissatisfied
2.6‐3.4 Neutral
3.4‐4.2 Satisfied
4.2‐5.0 Very Satisfied
Other (no responses)
2014 City of Des Peres Community Survey: Appendix A - GIS Maps
ETC Institute (2014) A-82
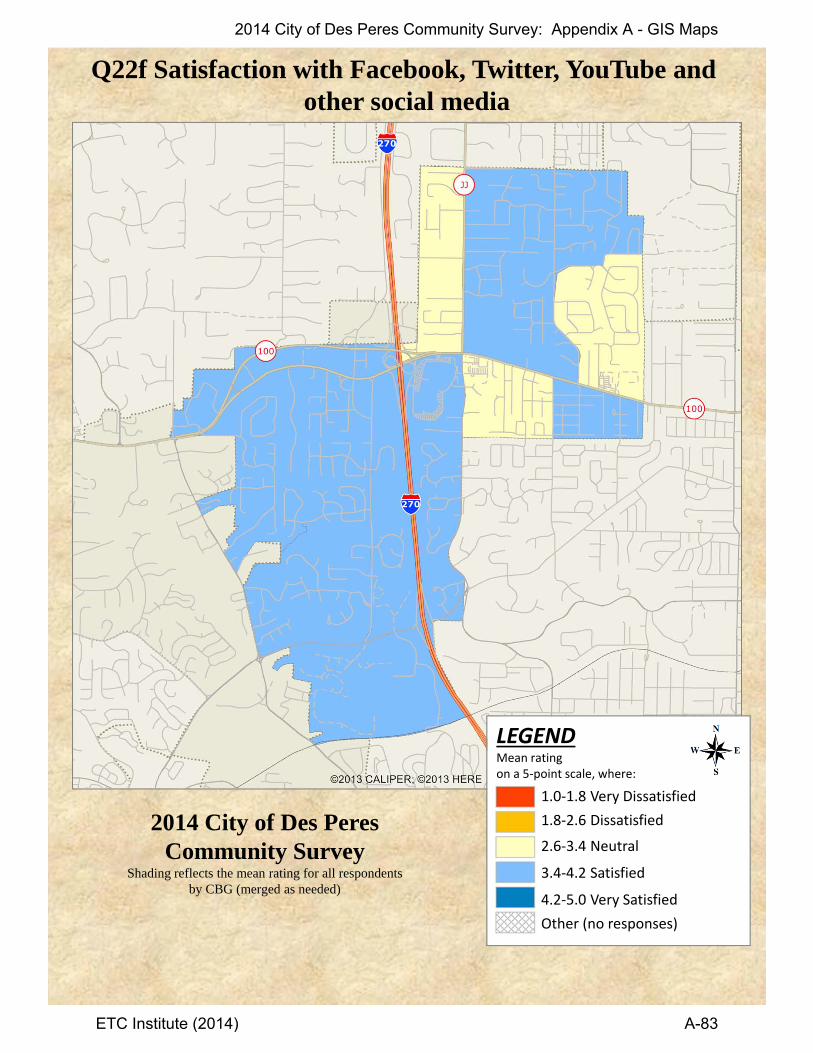
Q22f Satisfaction with Facebook, Twitter, YouTube and other social media
2014 City of Des Peres Community Survey
Shading reflects the mean rating for all respondents by CBG (merged as needed)
LEGENDMean rating on a 5‐point scale, where:
1.0‐1.8 Very Dissatisfied
1.8‐2.6 Dissatisfied
2.6‐3.4 Neutral
3.4‐4.2 Satisfied
4.2‐5.0 Very Satisfied
Other (no responses)
2014 City of Des Peres Community Survey: Appendix A - GIS Maps
ETC Institute (2014) A-83

Q22g Satisfaction with how well City communicationmeets the needs of residents
2014 City of Des Peres Community Survey
Shading reflects the mean rating for all respondents by CBG (merged as needed)
LEGENDMean rating on a 5‐point scale, where:
1.0‐1.8 Very Dissatisfied
1.8‐2.6 Dissatisfied
2.6‐3.4 Neutral
3.4‐4.2 Satisfied
4.2‐5.0 Very Satisfied
Other (no responses)
2014 City of Des Peres Community Survey: Appendix A - GIS Maps
ETC Institute (2014) A-84
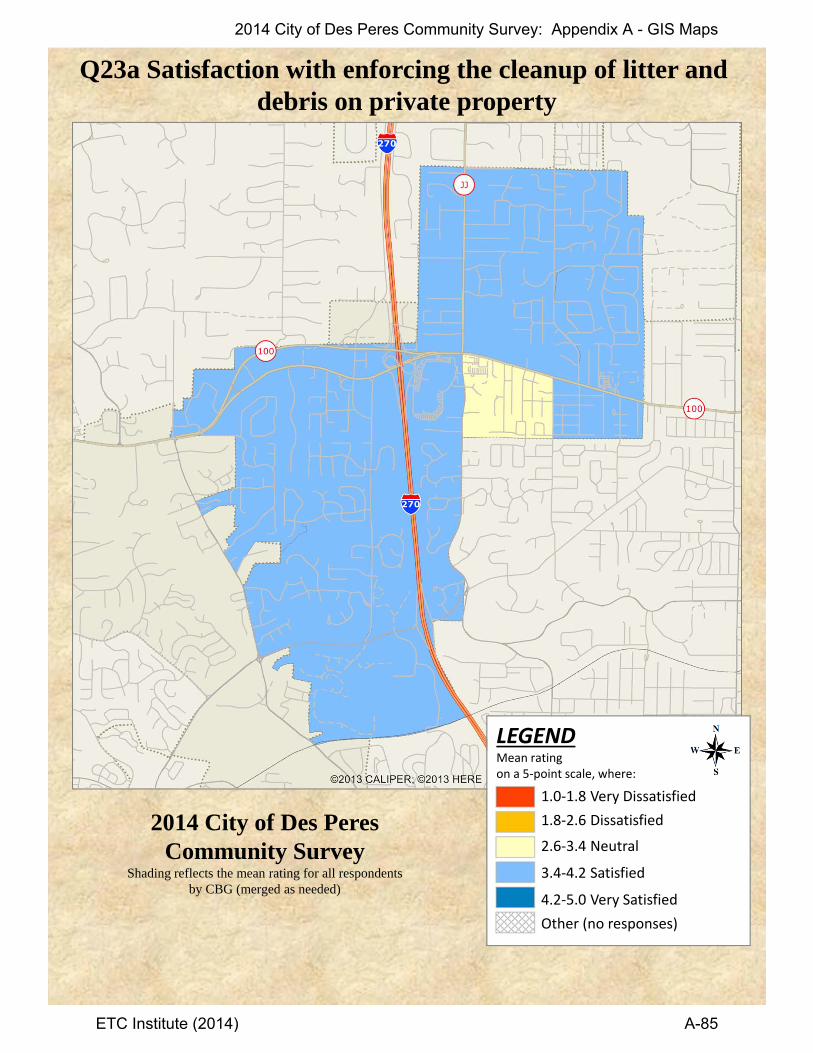
Q23a Satisfaction with enforcing the cleanup of litter and debris on private property
2014 City of Des Peres Community Survey
Shading reflects the mean rating for all respondents by CBG (merged as needed)
LEGENDMean rating on a 5‐point scale, where:
1.0‐1.8 Very Dissatisfied
1.8‐2.6 Dissatisfied
2.6‐3.4 Neutral
3.4‐4.2 Satisfied
4.2‐5.0 Very Satisfied
Other (no responses)
2014 City of Des Peres Community Survey: Appendix A - GIS Maps
ETC Institute (2014) A-85
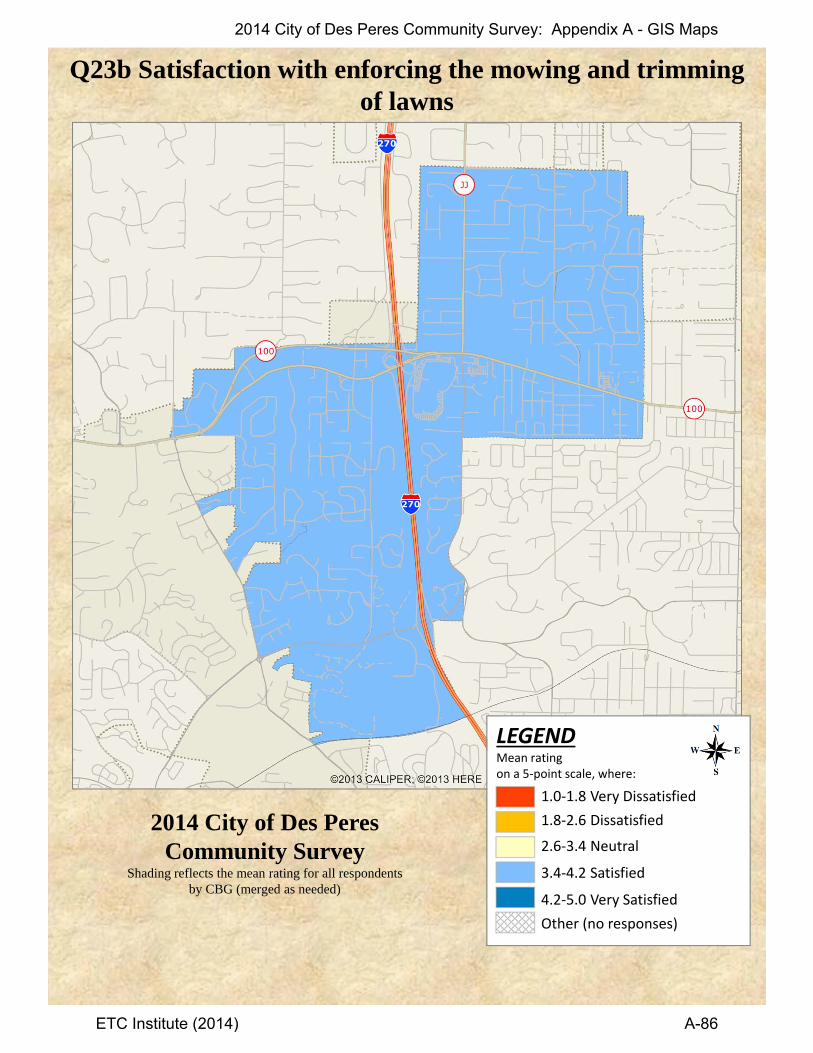
Q23b Satisfaction with enforcing the mowing and trimmingof lawns
2014 City of Des Peres Community Survey
Shading reflects the mean rating for all respondents by CBG (merged as needed)
LEGENDMean rating on a 5‐point scale, where:
1.0‐1.8 Very Dissatisfied
1.8‐2.6 Dissatisfied
2.6‐3.4 Neutral
3.4‐4.2 Satisfied
4.2‐5.0 Very Satisfied
Other (no responses)
2014 City of Des Peres Community Survey: Appendix A - GIS Maps
ETC Institute (2014) A-86
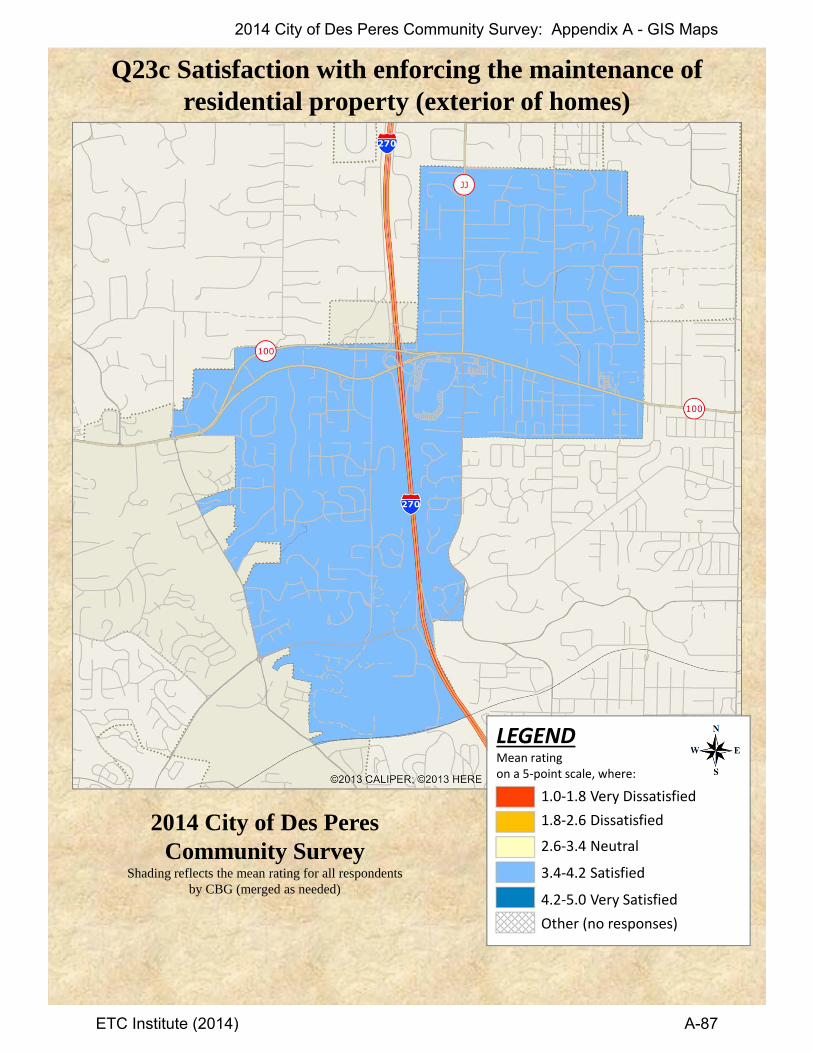
Q23c Satisfaction with enforcing the maintenance ofresidential property (exterior of homes)
2014 City of Des Peres Community Survey
Shading reflects the mean rating for all respondents by CBG (merged as needed)
LEGENDMean rating on a 5‐point scale, where:
1.0‐1.8 Very Dissatisfied
1.8‐2.6 Dissatisfied
2.6‐3.4 Neutral
3.4‐4.2 Satisfied
4.2‐5.0 Very Satisfied
Other (no responses)
2014 City of Des Peres Community Survey: Appendix A - GIS Maps
ETC Institute (2014) A-87

Q23d Satisfaction with enforcing the maintenance of business property
2014 City of Des Peres Community Survey
Shading reflects the mean rating for all respondents by CBG (merged as needed)
LEGENDMean rating on a 5‐point scale, where:
1.0‐1.8 Very Dissatisfied
1.8‐2.6 Dissatisfied
2.6‐3.4 Neutral
3.4‐4.2 Satisfied
4.2‐5.0 Very Satisfied
Other (no responses)
2014 City of Des Peres Community Survey: Appendix A - GIS Maps
ETC Institute (2014) A-88
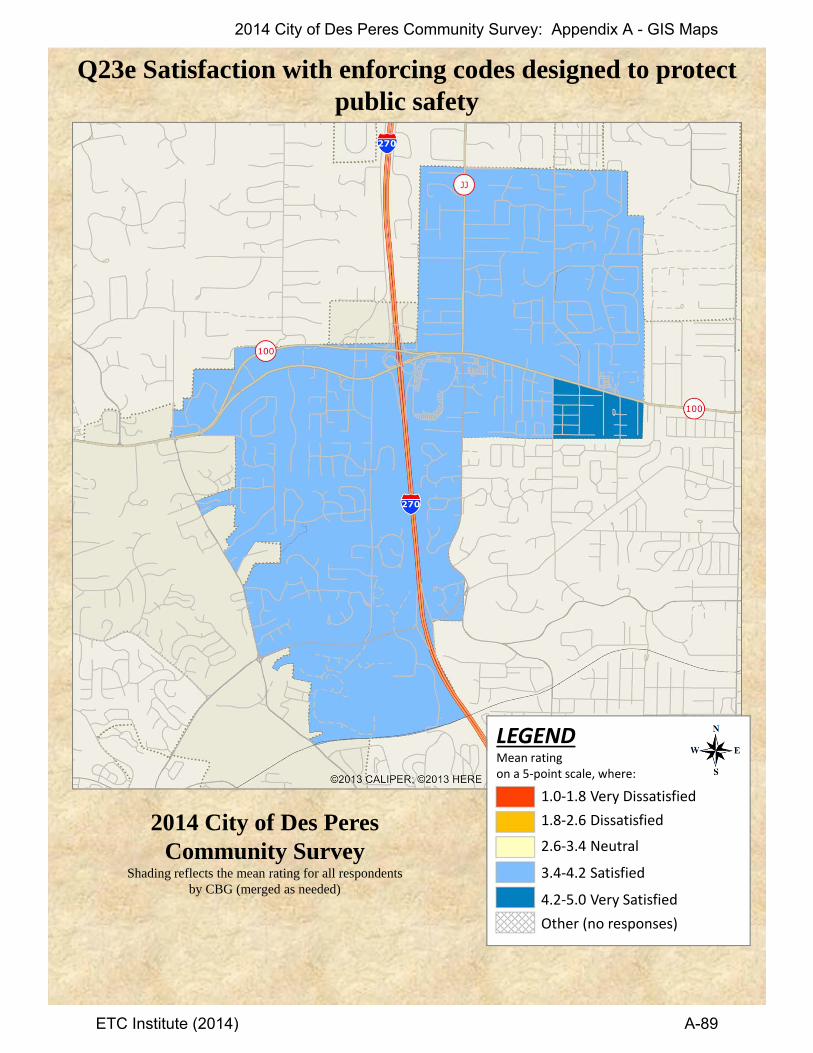
Q23e Satisfaction with enforcing codes designed to protectpublic safety
2014 City of Des Peres Community Survey
Shading reflects the mean rating for all respondents by CBG (merged as needed)
LEGENDMean rating on a 5‐point scale, where:
1.0‐1.8 Very Dissatisfied
1.8‐2.6 Dissatisfied
2.6‐3.4 Neutral
3.4‐4.2 Satisfied
4.2‐5.0 Very Satisfied
Other (no responses)
2014 City of Des Peres Community Survey: Appendix A - GIS Maps
ETC Institute (2014) A-89

Q23f Satisfaction with enforcing sign regulations
2014 City of Des Peres Community Survey
Shading reflects the mean rating for all respondents by CBG (merged as needed)
LEGENDMean rating on a 5‐point scale, where:
1.0‐1.8 Very Dissatisfied
1.8‐2.6 Dissatisfied
2.6‐3.4 Neutral
3.4‐4.2 Satisfied
4.2‐5.0 Very Satisfied
Other (no responses)
2014 City of Des Peres Community Survey: Appendix A - GIS Maps
ETC Institute (2014) A-90

Q26b Satisfaction with how easy the departmentwas to contact
2014 City of Des Peres Community Survey
Shading reflects the mean rating for all respondents by CBG (merged as needed)
LEGENDMean rating on a 5‐point scale, where:
1.0‐1.8 Very Dissatisfied
1.8‐2.6 Dissatisfied
2.6‐3.4 Neutral
3.4‐4.2 Satisfied
4.2‐5.0 Very Satisfied
Other (no responses)
2014 City of Des Peres Community Survey: Appendix A - GIS Maps
ETC Institute (2014) A-91
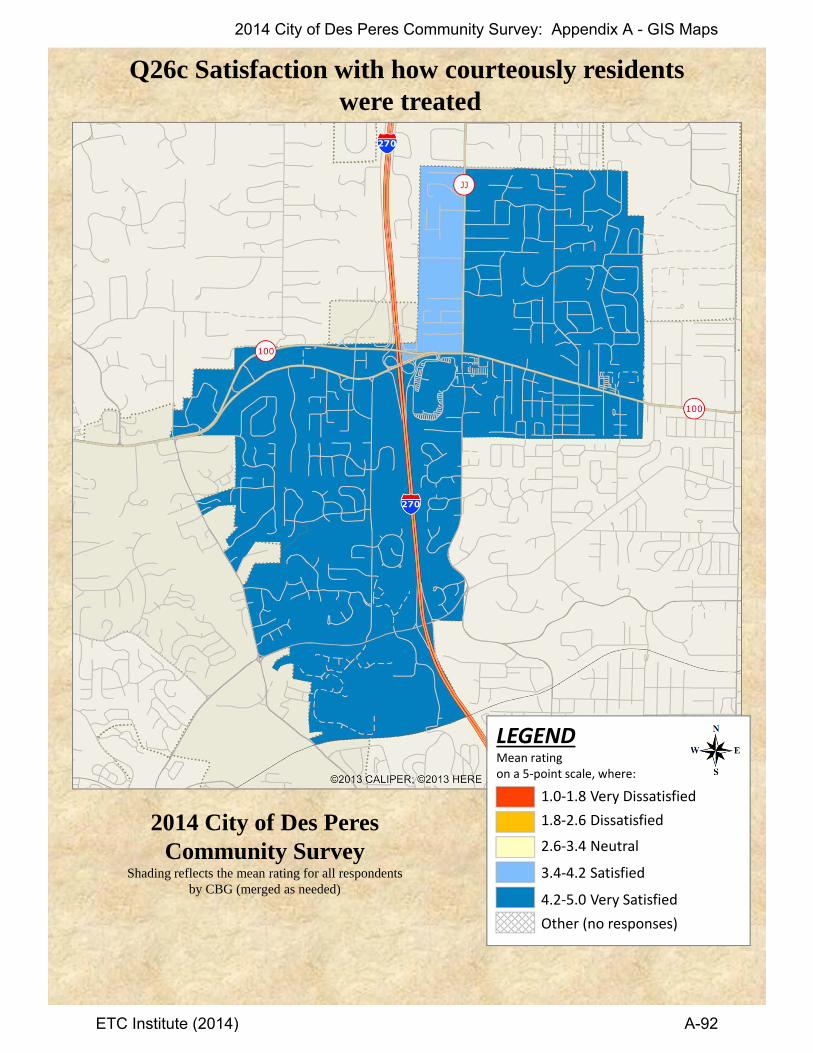
Q26c Satisfaction with how courteously residentswere treated
2014 City of Des Peres Community Survey
Shading reflects the mean rating for all respondents by CBG (merged as needed)
LEGENDMean rating on a 5‐point scale, where:
1.0‐1.8 Very Dissatisfied
1.8‐2.6 Dissatisfied
2.6‐3.4 Neutral
3.4‐4.2 Satisfied
4.2‐5.0 Very Satisfied
Other (no responses)
2014 City of Des Peres Community Survey: Appendix A - GIS Maps
ETC Institute (2014) A-92
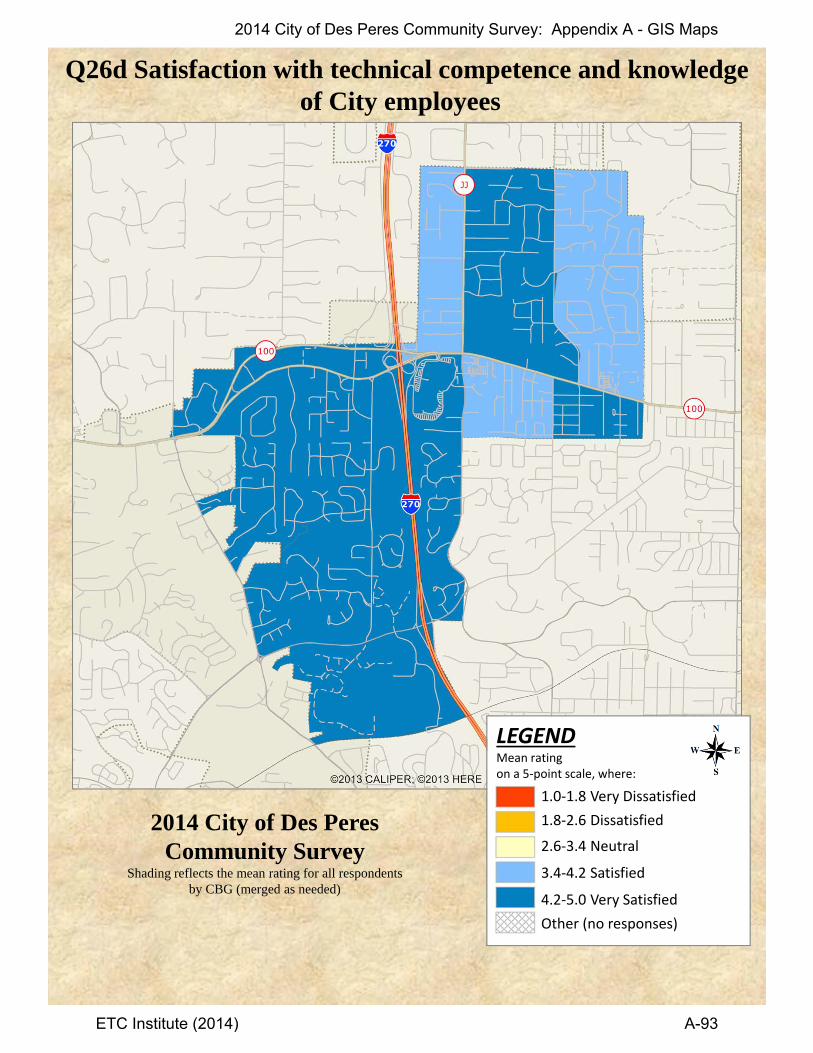
Q26d Satisfaction with technical competence and knowledgeof City employees
2014 City of Des Peres Community Survey
Shading reflects the mean rating for all respondents by CBG (merged as needed)
LEGENDMean rating on a 5‐point scale, where:
1.0‐1.8 Very Dissatisfied
1.8‐2.6 Dissatisfied
2.6‐3.4 Neutral
3.4‐4.2 Satisfied
4.2‐5.0 Very Satisfied
Other (no responses)
2014 City of Des Peres Community Survey: Appendix A - GIS Maps
ETC Institute (2014) A-93
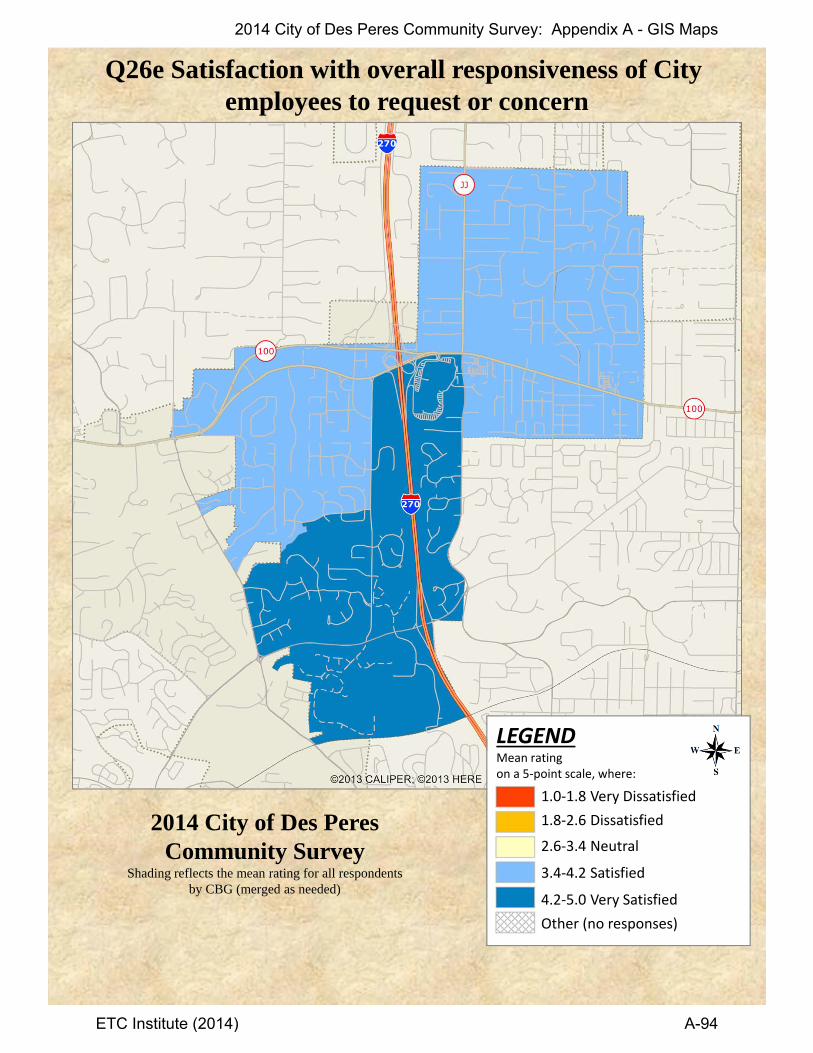
Q26e Satisfaction with overall responsiveness of City employees to request or concern
2014 City of Des Peres Community Survey
Shading reflects the mean rating for all respondents by CBG (merged as needed)
LEGENDMean rating on a 5‐point scale, where:
1.0‐1.8 Very Dissatisfied
1.8‐2.6 Dissatisfied
2.6‐3.4 Neutral
3.4‐4.2 Satisfied
4.2‐5.0 Very Satisfied
Other (no responses)
2014 City of Des Peres Community Survey: Appendix A - GIS Maps
ETC Institute (2014) A-94

Q27a Importance of sense of community
2014 City of Des Peres Community Survey
Shading reflects the mean rating for all respondents by CBG (merged as needed)
LEGENDMean rating on a 4‐point scale, where:
1.0‐1.75 Not Important
1.75‐2.5 Not Sure
2.5‐3.25 Somewhat Important
3.25‐4.0 Very Important
Other (no responses)
2014 City of Des Peres Community Survey: Appendix A - GIS Maps
ETC Institute (2014) A-95

Q27b Importance of the quality of public school districts
2014 City of Des Peres Community Survey
Shading reflects the mean rating for all respondents by CBG (merged as needed)
LEGENDMean rating on a 4‐point scale, where:
1.0‐1.75 Not Important
1.75‐2.5 Not Sure
2.5‐3.25 Somewhat Important
3.25‐4.0 Very Important
Other (no responses)
2014 City of Des Peres Community Survey: Appendix A - GIS Maps
ETC Institute (2014) A-96
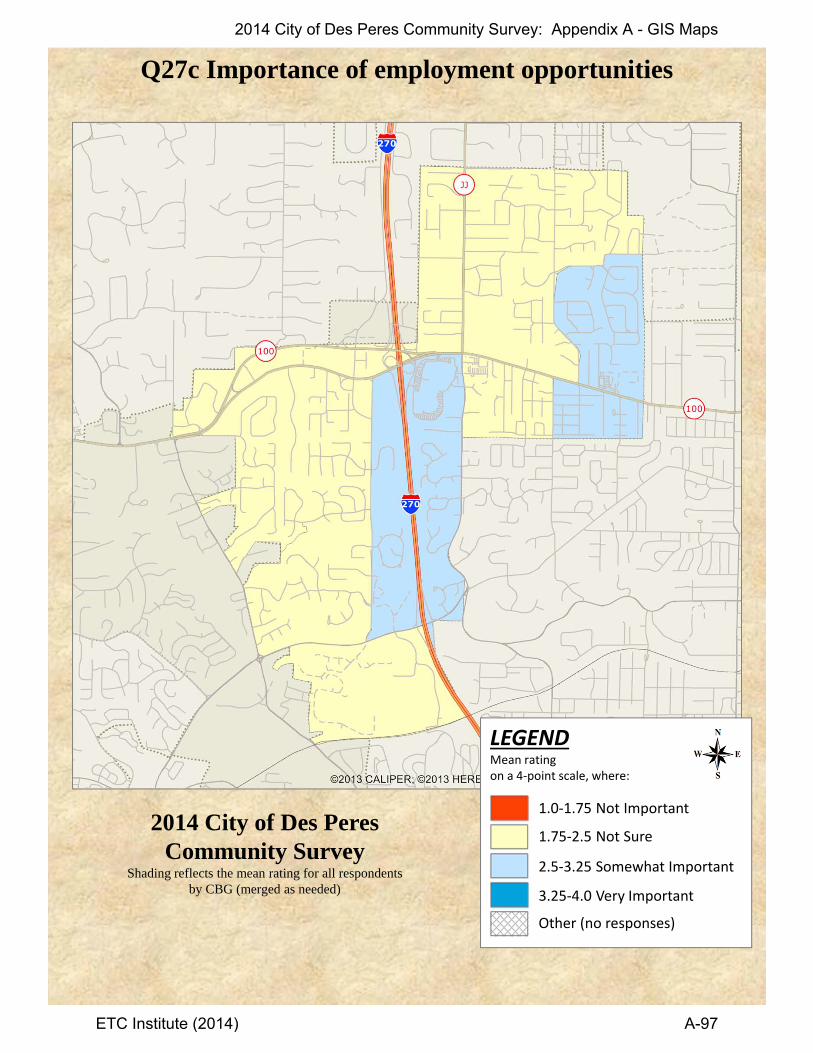
Q27c Importance of employment opportunities
2014 City of Des Peres Community Survey
Shading reflects the mean rating for all respondents by CBG (merged as needed)
LEGENDMean rating on a 4‐point scale, where:
1.0‐1.75 Not Important
1.75‐2.5 Not Sure
2.5‐3.25 Somewhat Important
3.25‐4.0 Very Important
Other (no responses)
2014 City of Des Peres Community Survey: Appendix A - GIS Maps
ETC Institute (2014) A-97

Q27d Importance of the quality of housing
2014 City of Des Peres Community Survey
Shading reflects the mean rating for all respondents by CBG (merged as needed)
LEGENDMean rating on a 4‐point scale, where:
1.0‐1.75 Not Important
1.75‐2.5 Not Sure
2.5‐3.25 Somewhat Important
3.25‐4.0 Very Important
Other (no responses)
2014 City of Des Peres Community Survey: Appendix A - GIS Maps
ETC Institute (2014) A-98
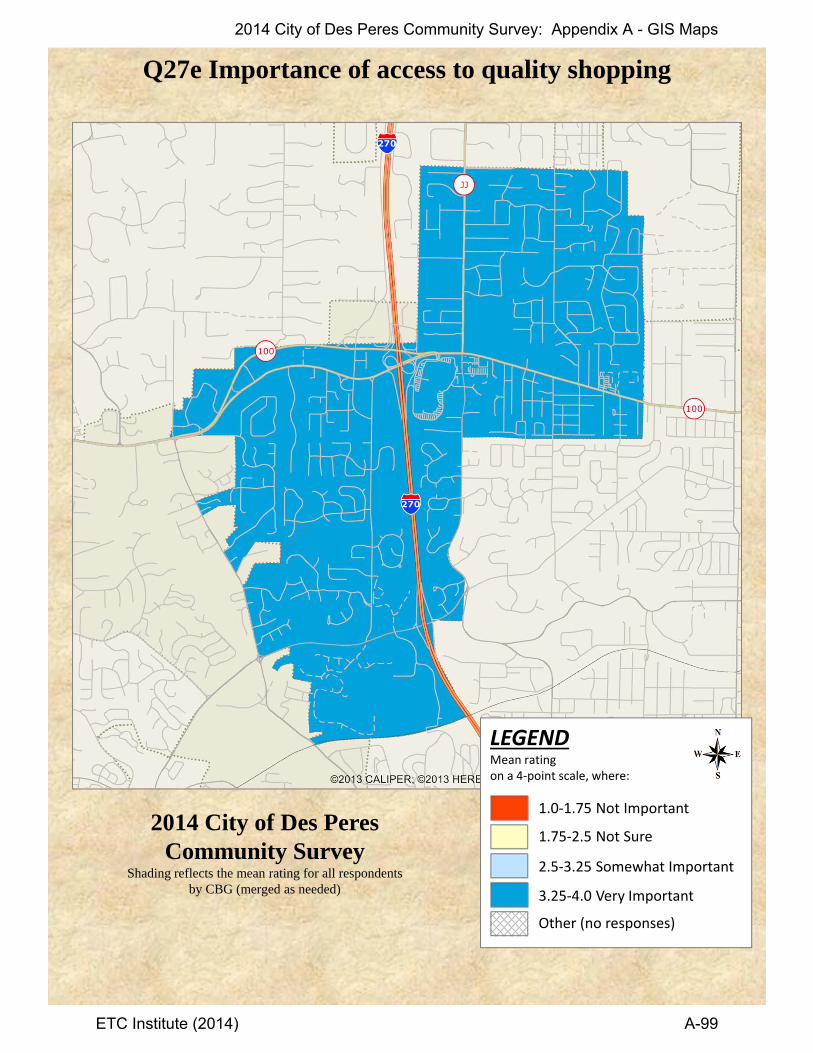
Q27e Importance of access to quality shopping
2014 City of Des Peres Community Survey
Shading reflects the mean rating for all respondents by CBG (merged as needed)
LEGENDMean rating on a 4‐point scale, where:
1.0‐1.75 Not Important
1.75‐2.5 Not Sure
2.5‐3.25 Somewhat Important
3.25‐4.0 Very Important
Other (no responses)
2014 City of Des Peres Community Survey: Appendix A - GIS Maps
ETC Institute (2014) A-99
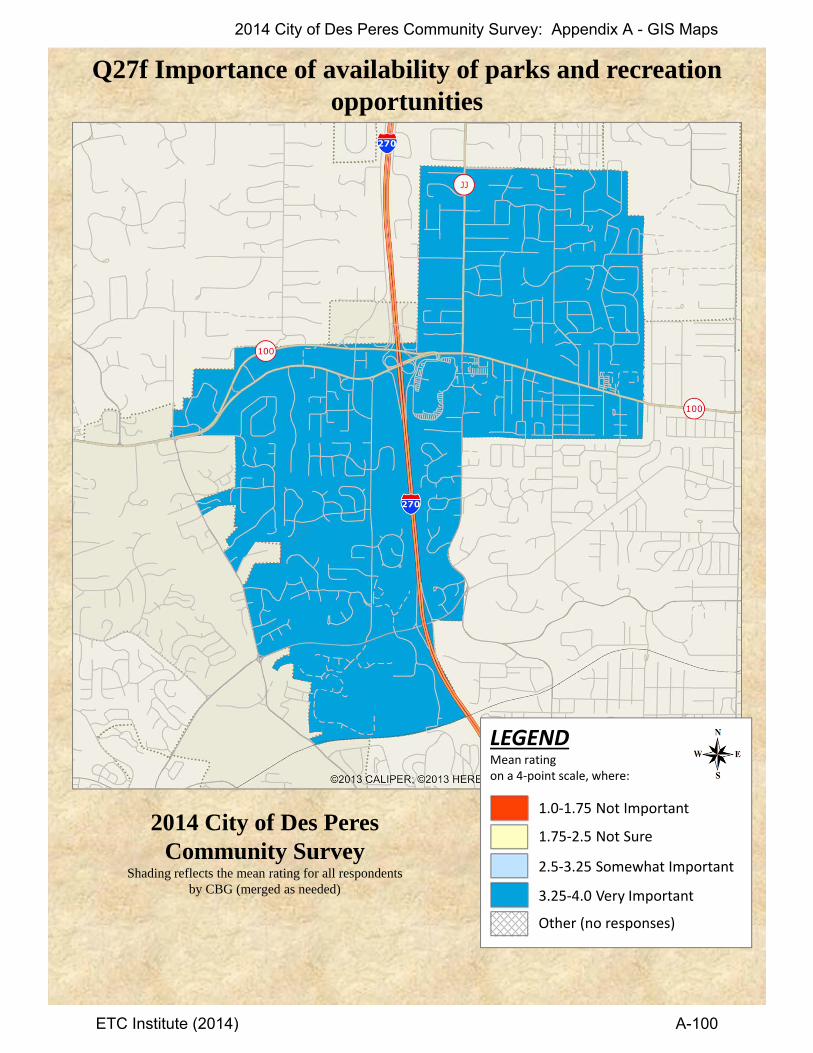
Q27f Importance of availability of parks and recreationopportunities
2014 City of Des Peres Community Survey
Shading reflects the mean rating for all respondents by CBG (merged as needed)
LEGENDMean rating on a 4‐point scale, where:
1.0‐1.75 Not Important
1.75‐2.5 Not Sure
2.5‐3.25 Somewhat Important
3.25‐4.0 Very Important
Other (no responses)
2014 City of Des Peres Community Survey: Appendix A - GIS Maps
ETC Institute (2014) A-100
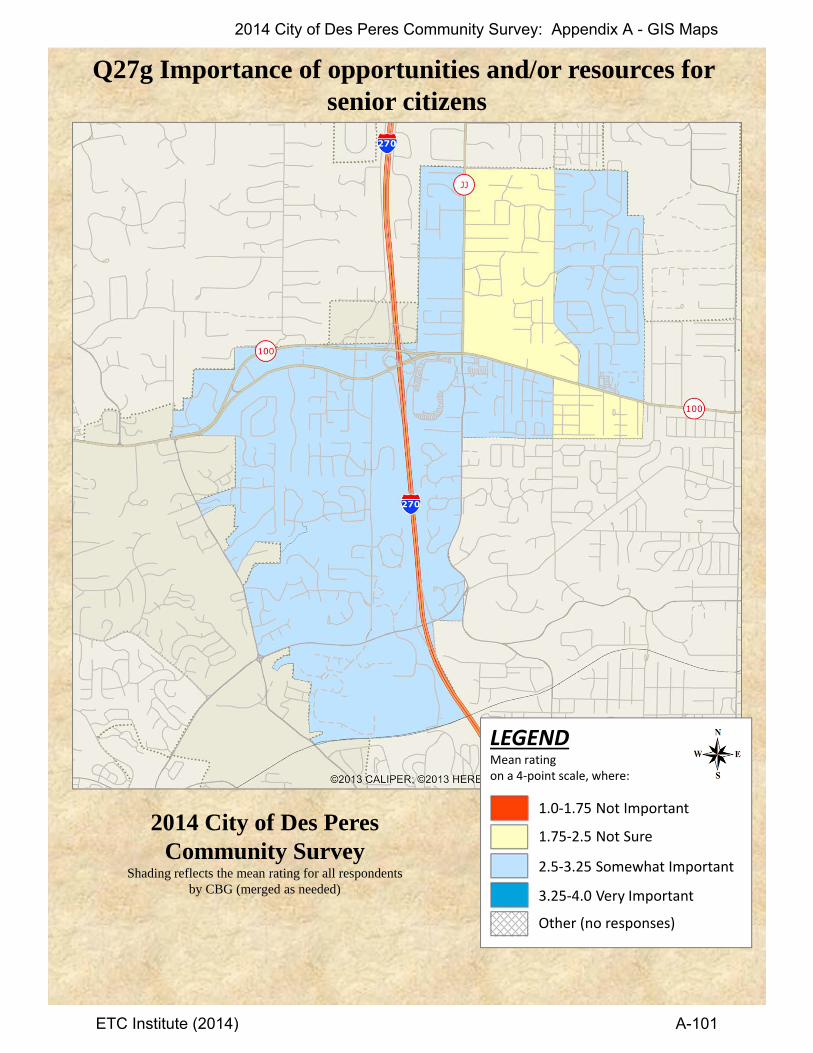
Q27g Importance of opportunities and/or resources for senior citizens
2014 City of Des Peres Community Survey
Shading reflects the mean rating for all respondents by CBG (merged as needed)
LEGENDMean rating on a 4‐point scale, where:
1.0‐1.75 Not Important
1.75‐2.5 Not Sure
2.5‐3.25 Somewhat Important
3.25‐4.0 Very Important
Other (no responses)
2014 City of Des Peres Community Survey: Appendix A - GIS Maps
ETC Institute (2014) A-101
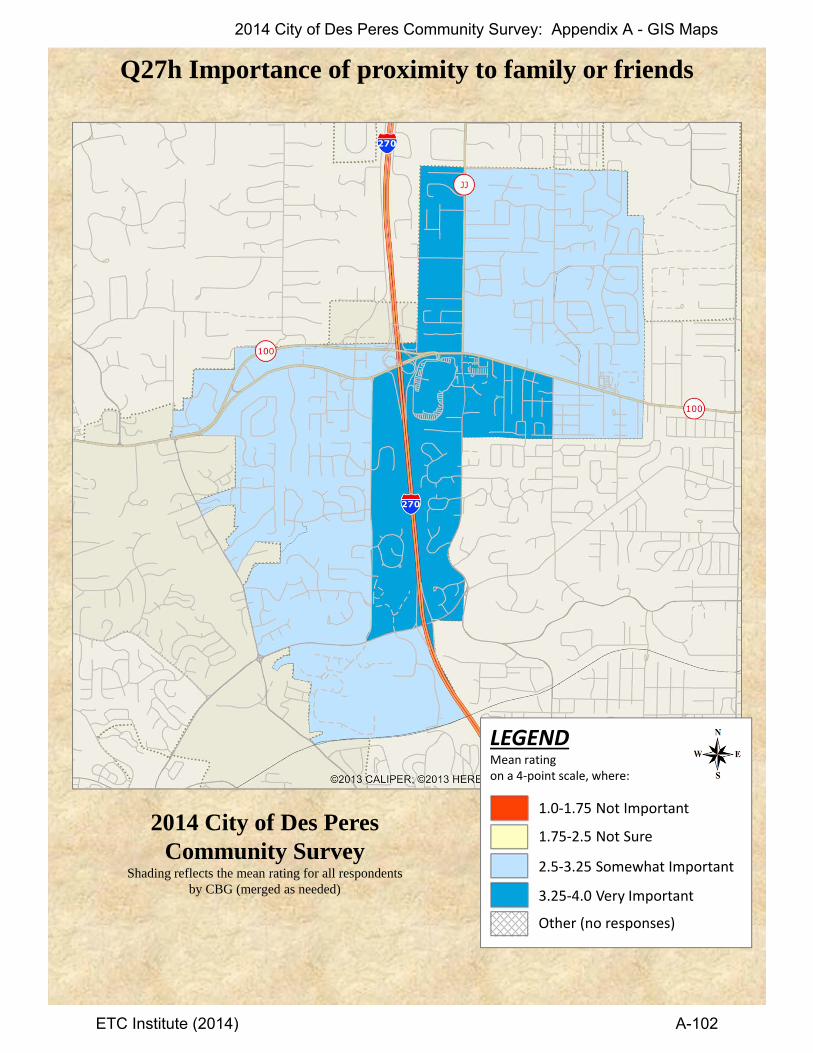
Q27h Importance of proximity to family or friends
2014 City of Des Peres Community Survey
Shading reflects the mean rating for all respondents by CBG (merged as needed)
LEGENDMean rating on a 4‐point scale, where:
1.0‐1.75 Not Important
1.75‐2.5 Not Sure
2.5‐3.25 Somewhat Important
3.25‐4.0 Very Important
Other (no responses)
2014 City of Des Peres Community Survey: Appendix A - GIS Maps
ETC Institute (2014) A-102
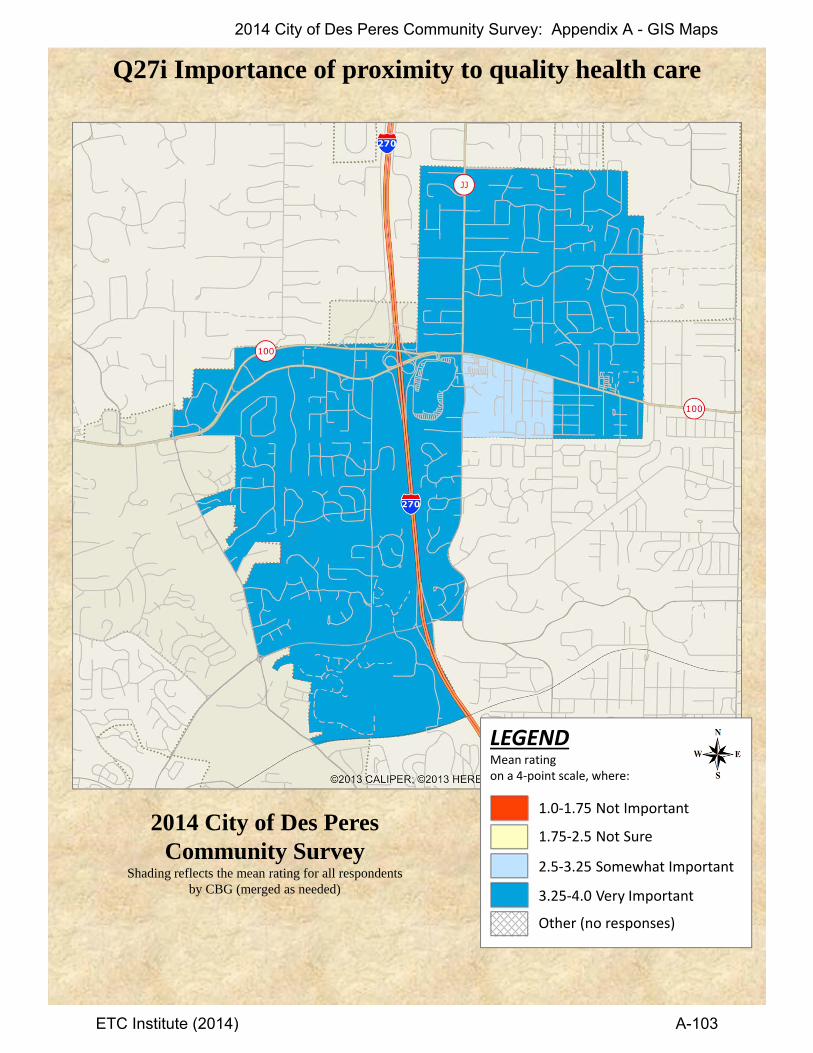
Q27i Importance of proximity to quality health care
2014 City of Des Peres Community Survey
Shading reflects the mean rating for all respondents by CBG (merged as needed)
LEGENDMean rating on a 4‐point scale, where:
1.0‐1.75 Not Important
1.75‐2.5 Not Sure
2.5‐3.25 Somewhat Important
3.25‐4.0 Very Important
Other (no responses)
2014 City of Des Peres Community Survey: Appendix A - GIS Maps
ETC Institute (2014) A-103

Q27j Importance of safety and security
2014 City of Des Peres Community Survey
Shading reflects the mean rating for all respondents by CBG (merged as needed)
LEGENDMean rating on a 4‐point scale, where:
1.0‐1.75 Not Important
1.75‐2.5 Not Sure
2.5‐3.25 Somewhat Important
3.25‐4.0 Very Important
Other (no responses)
2014 City of Des Peres Community Survey: Appendix A - GIS Maps
ETC Institute (2014) A-104

Q27k Importance of central location
2014 City of Des Peres Community Survey
Shading reflects the mean rating for all respondents by CBG (merged as needed)
LEGENDMean rating on a 4‐point scale, where:
1.0‐1.75 Not Important
1.75‐2.5 Not Sure
2.5‐3.25 Somewhat Important
3.25‐4.0 Very Important
Other (no responses)
2014 City of Des Peres Community Survey: Appendix A - GIS Maps
ETC Institute (2014) A-105

Q27l Importance of accessibility
2014 City of Des Peres Community Survey
Shading reflects the mean rating for all respondents by CBG (merged as needed)
LEGENDMean rating on a 4‐point scale, where:
1.0‐1.75 Not Important
1.75‐2.5 Not Sure
2.5‐3.25 Somewhat Important
3.25‐4.0 Very Important
Other (no responses)
2014 City of Des Peres Community Survey: Appendix A - GIS Maps
ETC Institute (2014) A-106
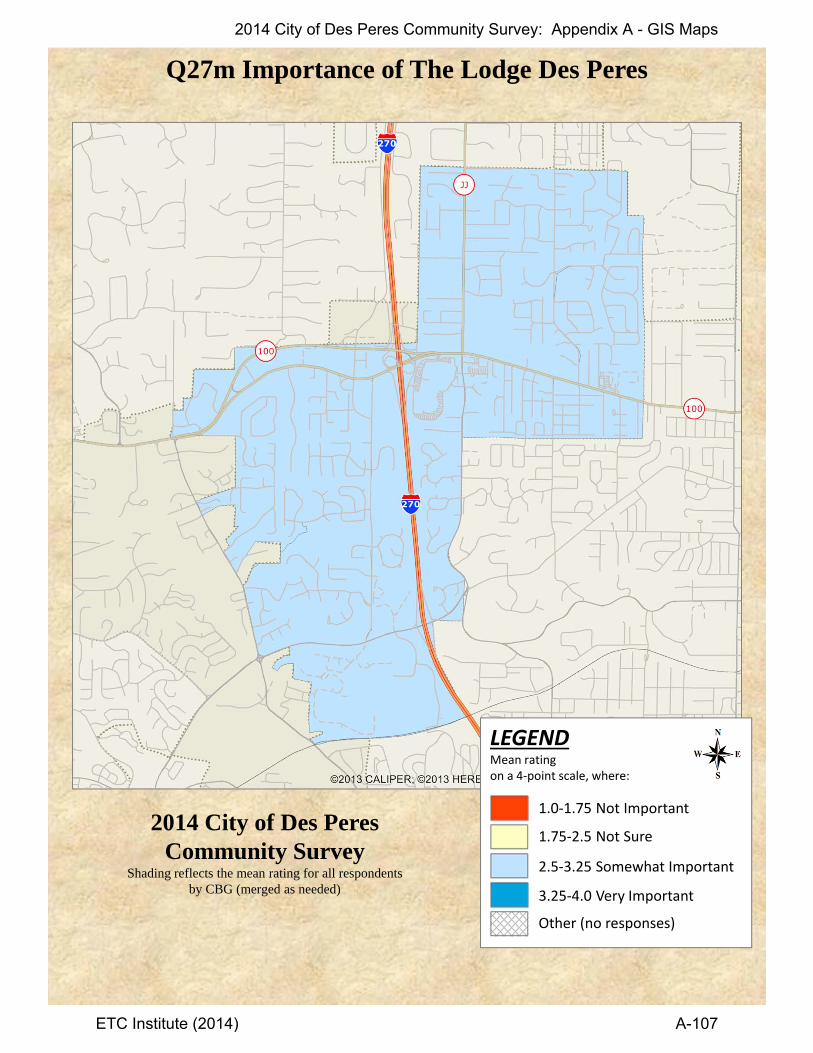
Q27m Importance of The Lodge Des Peres
2014 City of Des Peres Community Survey
Shading reflects the mean rating for all respondents by CBG (merged as needed)
LEGENDMean rating on a 4‐point scale, where:
1.0‐1.75 Not Important
1.75‐2.5 Not Sure
2.5‐3.25 Somewhat Important
3.25‐4.0 Very Important
Other (no responses)
2014 City of Des Peres Community Survey: Appendix A - GIS Maps
ETC Institute (2014) A-107