Embed Size (px)
Citation preview
© 2012, MIX and CGAP. All rights reserved.
A MIX and CGAP Presentation
2011 Eastern Europe and Central Asia Regional Snapshot
© 2012, MIX and CGAP. All rights reserved.
2
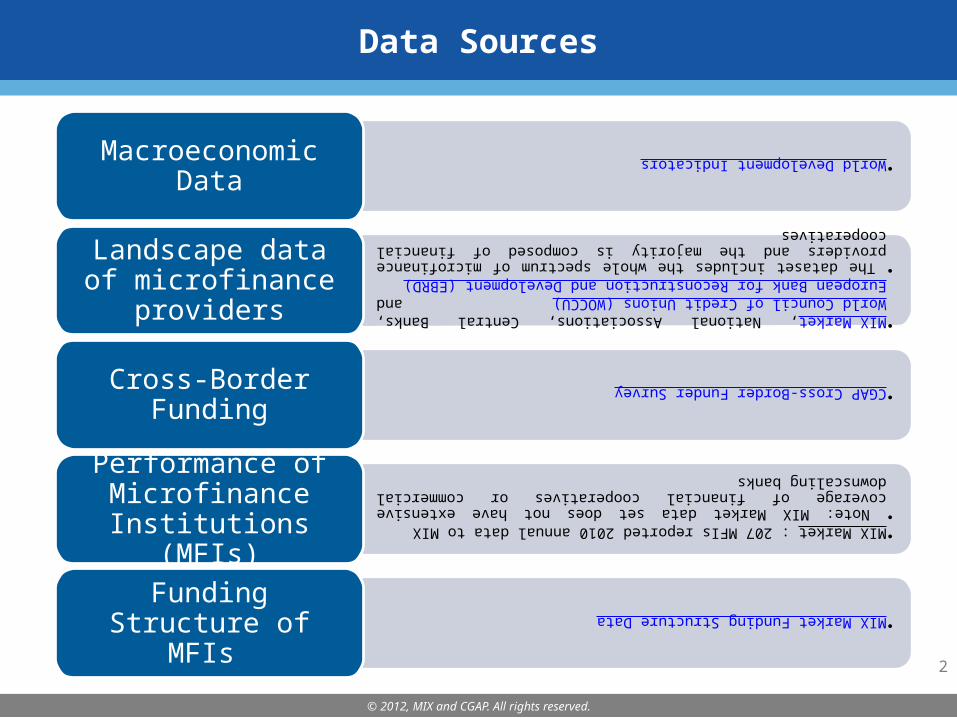
Data Sources
•World Development Indicators
Macroeconomic Data
•MIX Market, National Associations, Central Banks, World Council of Credit Unions (WOCCU) and European Bank for Reconstruction and Development (EBRD)
• The dataset includes the whole spectrum of microfinance providers and the majority is composed of financial cooperatives
Landscape data of microfinance
providers•CGAP Cross-Border Funder Survey
Cross-Border Funding
•MIX Market : 207 MFIs reported 2010 annual data to MIX
• Note: MIX Market data set does not have extensive coverage of financial cooperatives or commercial downscaling banks
Performance of Microfinance
Institutions (MFIs)
•MIX Market Funding Structure Data
Funding Structure of MFIs
© 2012, MIX and CGAP. All rights reserved.
3
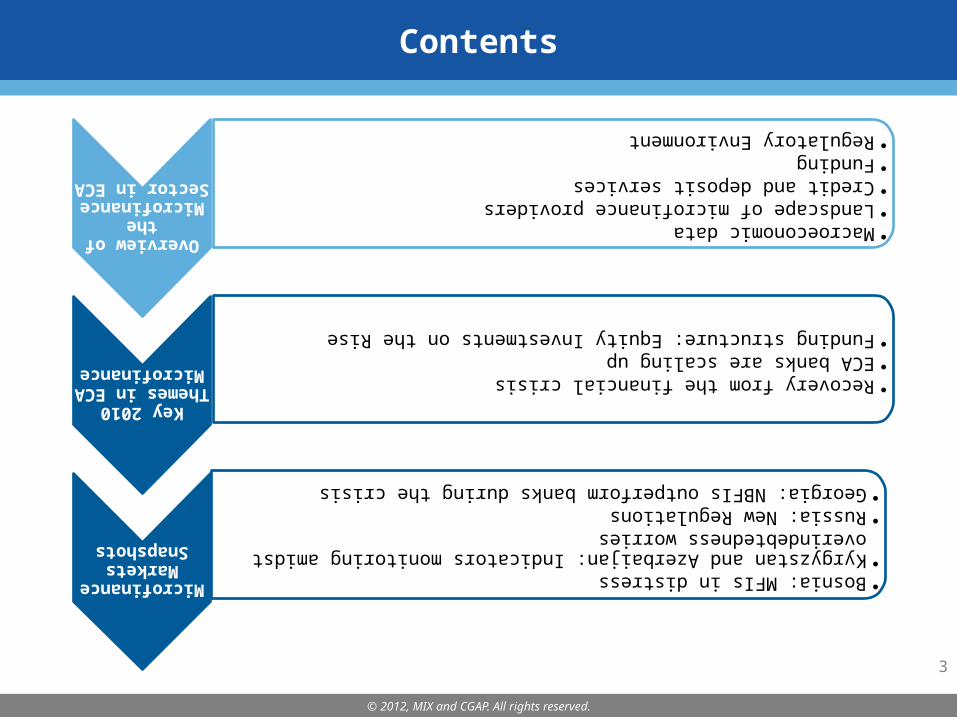
Contents
Overview of
the Microfinan
ce Sector in ECA
•Macroeconomic data
•Landscape of microfinance providers
•Credit and deposit services
•Funding•Regulatory
Environment
Key 2010 Themes in ECA
Microfinan
ce
•Recovery from the financial crisis
•ECA banks are scaling up
•Funding structure: Equity Investments on the Rise
Microfinan
ce Markets
Snapshots
•Bosnia: MFIs in distress
•Kyrgyzstan and Azerbaijan: Indicators monitoring amidst overindebtedness worries
•Russia: New Regulations
•Georgia: NBFIs outperform banks during the crisis
© 2012, MIX and CGAP. All rights reserved.
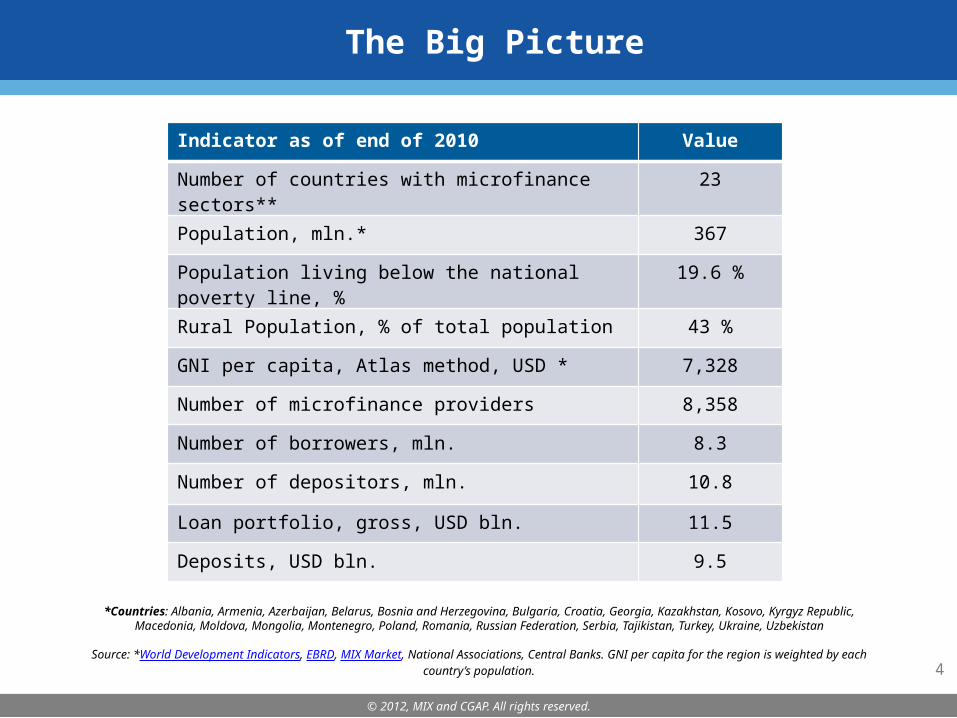
The Big Picture
*Countries: Albania, Armenia, Azerbaijan, Belarus, Bosnia and Herzegovina, Bulgaria, Croatia, Georgia, Kazakhstan, Kosovo, Kyrgyz Republic, Macedonia, Moldova, Mongolia, Montenegro, Poland, Romania, Russian Federation, Serbia, Tajikistan, Turkey,
Ukraine, Uzbekistan
Source: *World Development Indicators, EBRD, MIX Market, National Associations, Central Banks. GNI per capita for the region is weighted by each country’s population.
Indicator as of end of 2010 Value
Number of countries with microfinance sectors**
23
Population, mln.* 367
Population living below the national poverty line, %
19.6 %
Rural Population, % of total population 43 %
GNI per capita, Atlas method, USD * 7,328
Number of microfinance providers 8,358
Number of borrowers, mln. 8.3
Number of depositors, mln. 10.8
Loan portfolio, gross, USD bln. 11.5
Deposits, USD bln. 9.5
4
© 2012, MIX and CGAP. All rights reserved.
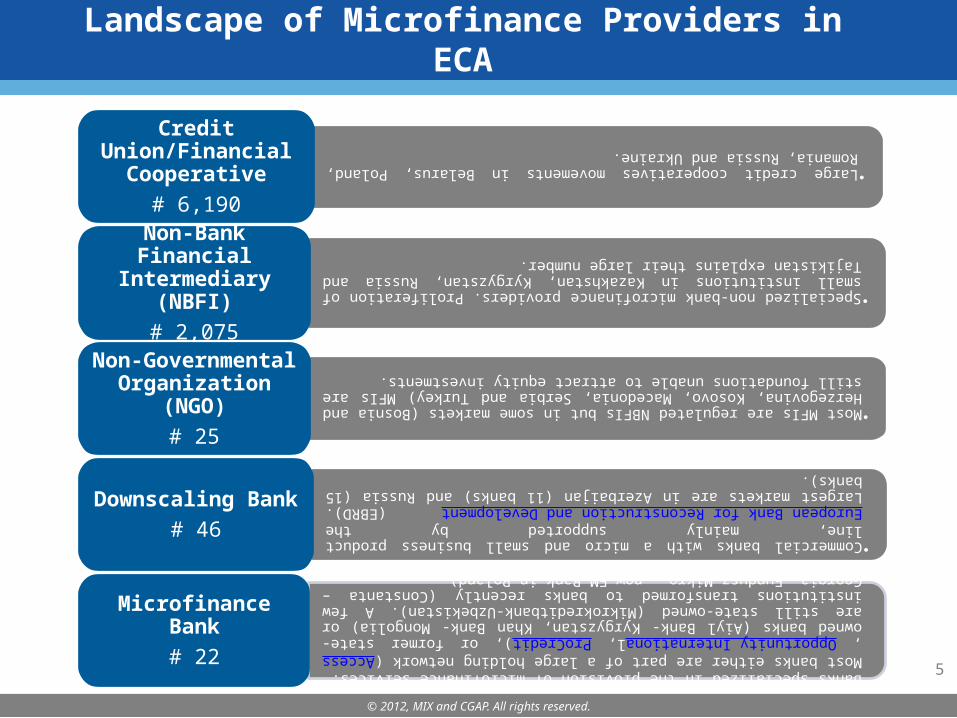
Landscape of Microfinance Providers in ECA
•Large credit cooperatives movements in Belarus, Poland, Romania, Russia and Ukraine.
Credit Union/Financial
Cooperative# 6,190
•Specialized non-bank microfinance providers. Proliferation of small institutions in Kazakhstan, Kyrgyzstan, Russia and Tajikistan explains their large number.
Non-Bank Financial
Intermediary (NBFI)# 2,075
•Most MFIs are regulated NBFIs but in some markets (Bosnia and Herzegovina, Kosovo, Macedonia, Serbia and Turkey) MFIs are still foundations unable to attract equity investments.
Non-Governmental Organization
(NGO)# 25
•Commercial banks with a micro and small business product line, mainly supported by the European Bank for Reconstruction and Development (EBRD). Largest markets are in Azerbaijan (11 banks) and Russia (15 banks).
Downscaling Bank# 46
•Banks specialized in the provision of microfinance services. Most banks either are part of a large holding network (Access, Opportunity International, ProCredit), or former state-owned banks (Aiyl Bank- Kyrgyzstan, Khan Bank- Mongolia) or are still state-owned (Mikrokreditbank-Uzbekistan). A few institutions transformed to banks recently (Constanta – Georgia, Fundusz Mikro – now FM Bank in Poland).
Microfinance Bank# 22
5
© 2012, MIX and CGAP. All rights reserved.
Microcredit Services
Source: EBRD, MIX Market, National Associations, Central Banks. To view the graph data click here. To download the full landscape data click here.
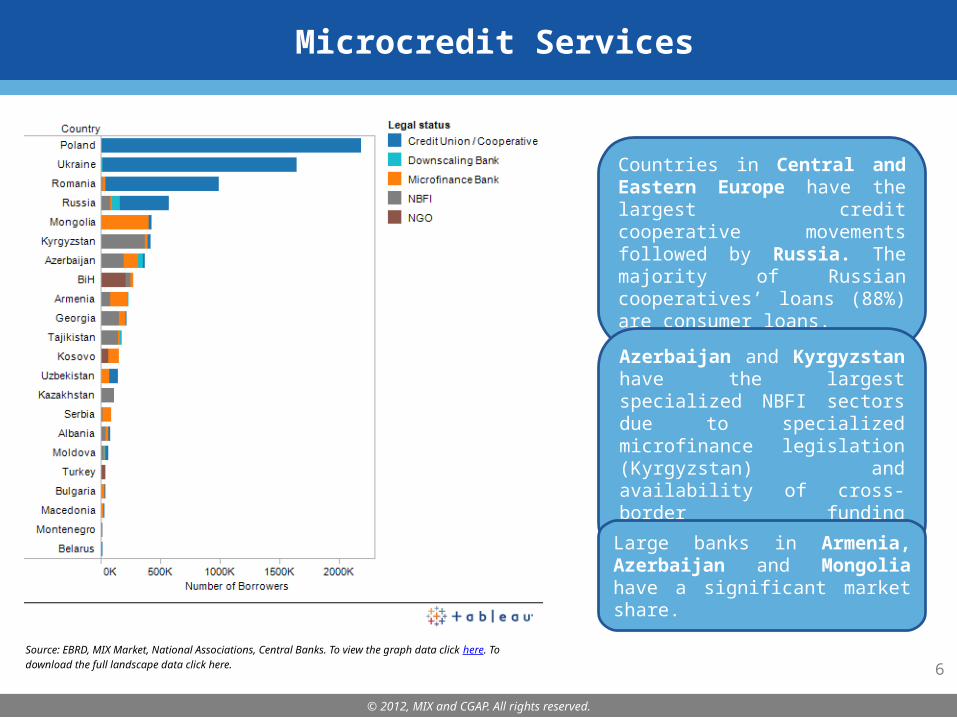
Countries in Central and Eastern Europe have the largest credit cooperative movements followed by Russia. The majority of Russian cooperatives’ loans (88%) are consumer loans.
Azerbaijan and Kyrgyzstan have the largest specialized NBFI sectors due to specialized microfinance legislation (Kyrgyzstan) and availability of cross-border funding (Azerbaijan).
Large banks in Armenia, Azerbaijan and Mongolia have a significant market share.
6
© 2012, MIX and CGAP. All rights reserved.
Deposit Services
Source: EBRD, MIX Market, National Associations, Central Banks. To view the graph data click here. To download the full landscape data click here.
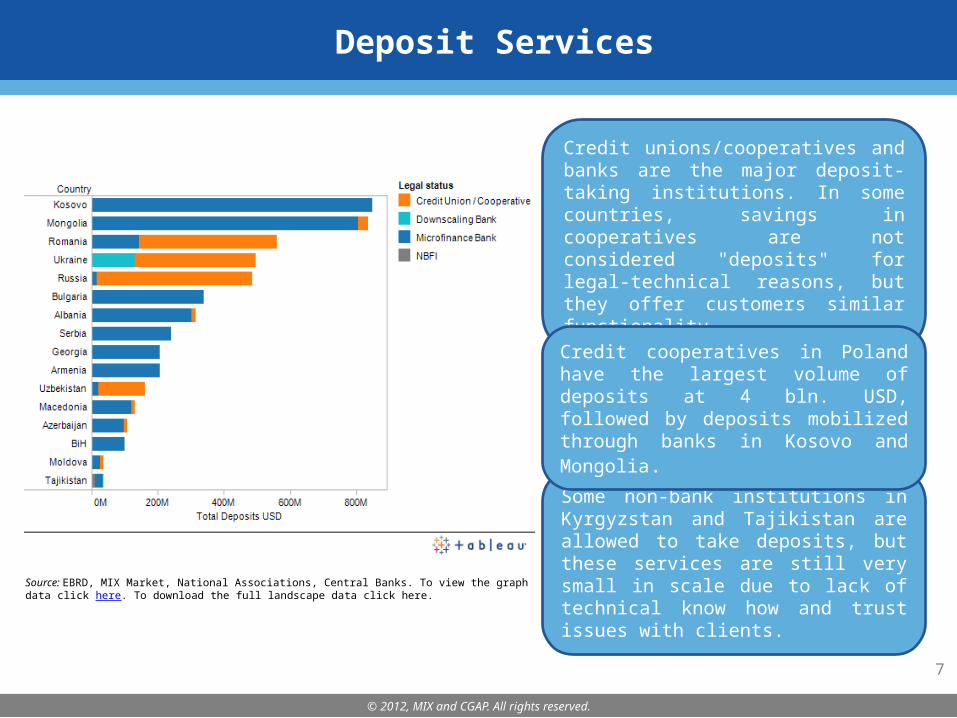
Credit unions/cooperatives and banks are the major deposit-taking institutions. In some countries, savings in cooperatives are not considered "deposits" for legal-technical reasons, but they offer customers similar functionality.
Some non-bank institutions in Kyrgyzstan and Tajikistan are allowed to take deposits, but these services are still very small in scale due to lack of technical know how and trust issues with clients.
Credit cooperatives in Poland have the largest volume of deposits at 4 bln. USD, followed by deposits mobilized through banks in Kosovo and Mongolia.
7
© 2012, MIX and CGAP. All rights reserved.
ECA Microfinance in a Global Context
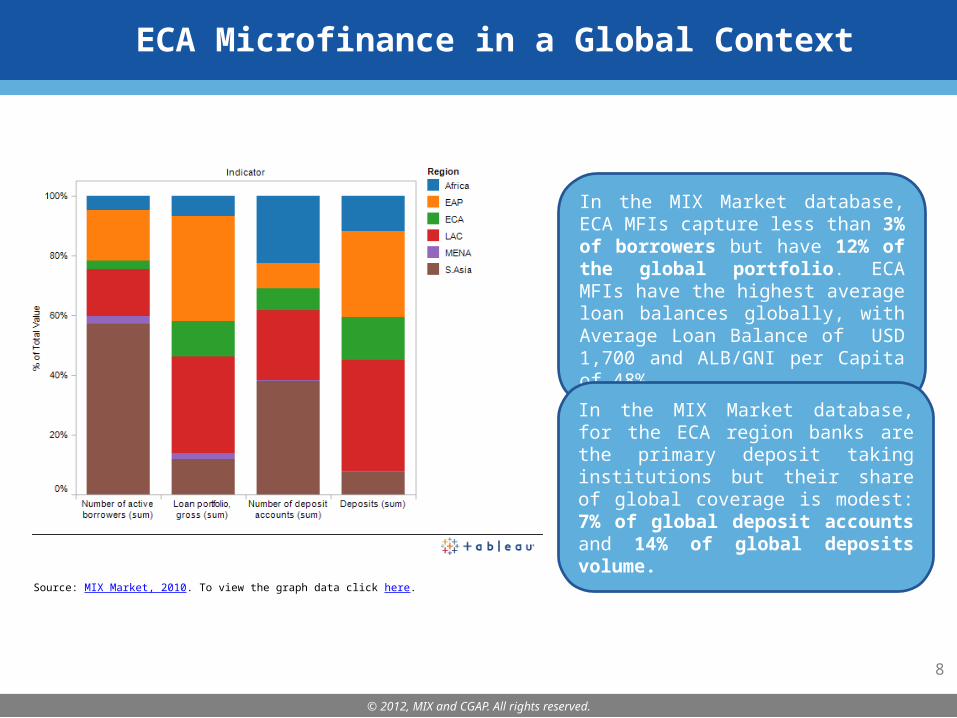
In the MIX Market database, ECA MFIs capture less than 3% of borrowers but have 12% of the global portfolio. ECA MFIs have the highest average loan balances globally, with Average Loan Balance of USD 1,700 and ALB/GNI per Capita of 48%.
In the MIX Market database, for the ECA region banks are the primary deposit taking institutions but their share of global coverage is modest: 7% of global deposit accounts and 14% of global deposits volume.
Source: MIX Market, 2010. To view the graph data click here.
8
© 2012, MIX and CGAP. All rights reserved.
ECA Microfinance Clients: Regional Comparison
Source: MIX Market, 2010. View data on women borrowers in Cross-Market Analysis.
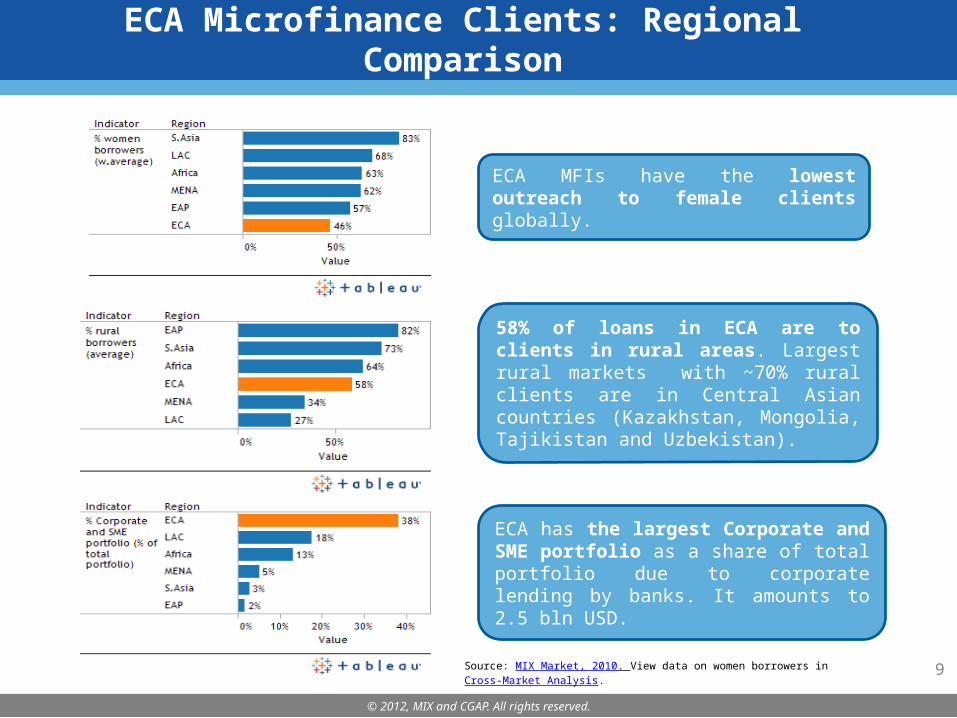
ECA MFIs have the lowest outreach to female clients globally.
58% of loans in ECA are to clients in rural areas. Largest rural markets with ~70% rural clients are in Central Asian countries (Kazakhstan, Mongolia, Tajikistan and Uzbekistan).
ECA has the largest Corporate and SME portfolio as a share of total portfolio due to corporate lending by banks. It amounts to 2.5 bln USD.
9

© 2012, MIX and CGAP. All rights reserved.
Funding Flows to ECA: Commitments of Cross-Border
Donors and Investors
Annual growth rates
Cross-border commitments to microfinance – US$ billion
1.3 1.5 1.7 1.7
Sub-Saharan Africa (SSA)
Dec07 Dec08 Dec09 Dec10
+10%+14% +2%
2.8
3.3 3.1
3.5
South Asia (SA)
Dec07 Dec08 Dec09 Dec10
+17%-6%
+12%
.6 .6 .6 .6
Dec07 Dec08 Dec09 Dec10
-12% -3% +5%
Middle East & North Africa (MENA)
1.4
1.9 2.0 2.3
Latin America & Caribbean (LAC)
Dec07 Dec08 Dec09 Dec10Dec07 Dec08 Dec09 Dec10
+34%+8%
+12%
2.2
2.9
3.3 3.1
Eastern Europe & Central Asia (ECA)
Dec07 Dec08 Dec09 Dec10
+31%
+15%-6%
.7 .8 .9 1.3
East Asia & the Pacific (EAP)
Dec07 Dec08 Dec09 Dec10
+10% +10%
+49%.8
1.3
2.2 2.3
Multi-Region
Dec07 Dec08 Dec09 Dec10
+59%
+65% +5%
Data for the 20 funders in our sample
ECA received the second largest amount of commitments after South Asia. Commitments to ECA decreased for the first time in the last four years in dollar
terms.Source: 2011 CGAP Cross-Border Funder Survey. 10
© 2012, MIX and CGAP. All rights reserved.
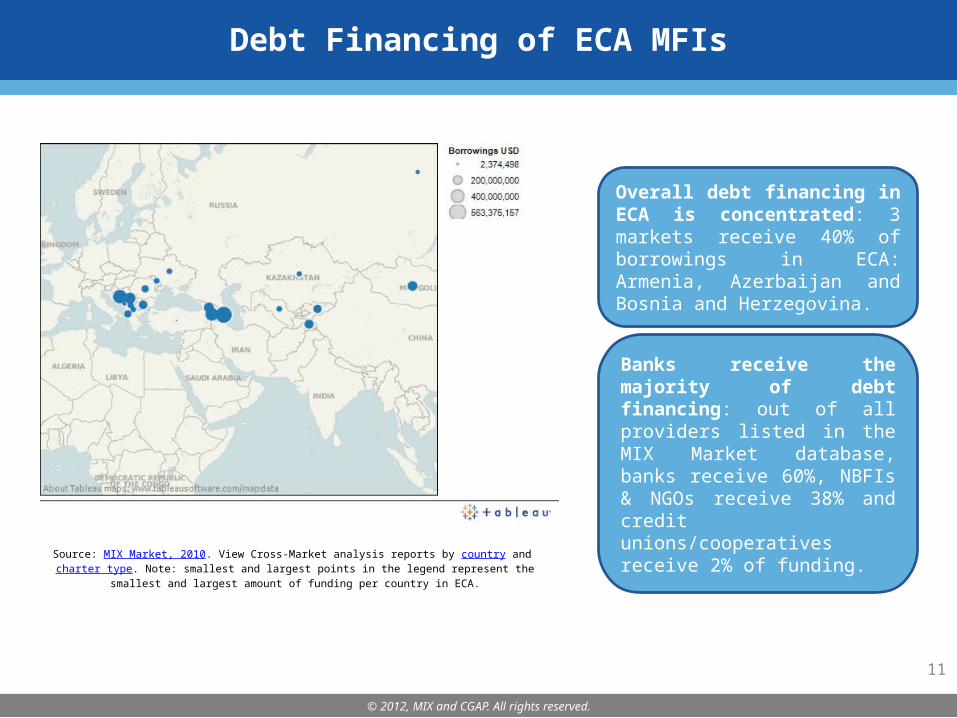
Debt Financing of ECA MFIs
Overall debt financing in ECA is concentrated: 3 markets receive 40% of borrowings in ECA: Armenia, Azerbaijan and Bosnia and Herzegovina.
Banks receive the majority of debt financing: out of all providers listed in the MIX Market database, banks receive 60%, NBFIs & NGOs receive 38% and credit unions/cooperatives receive 2% of funding.
Source: MIX Market, 2010. View Cross-Market analysis reports by country and charter type. Note: smallest and largest points in the legend represent the smallest and largest amount of funding
per country in ECA.
11
© 2012, MIX and CGAP. All rights reserved.
12
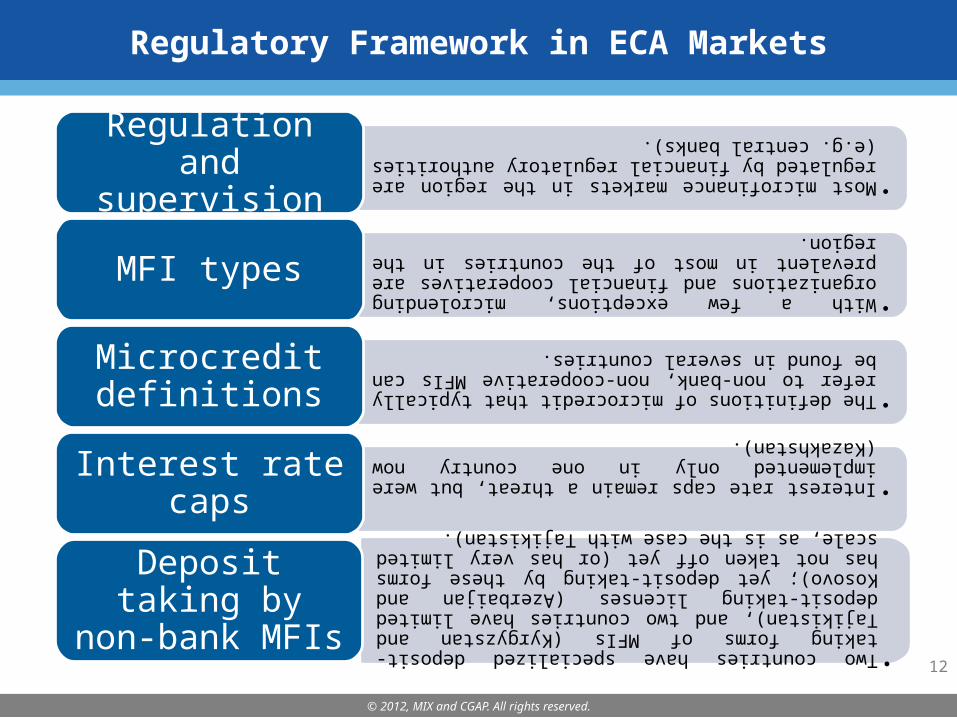
Regulatory Framework in ECA Markets
•Most microfinance markets in the region are regulated by financial regulatory authorities (e.g. central banks).
Regulation and supervision
•With a few exceptions, microlending organizations and financial cooperatives are prevalent in most of the countries in the region.
MFI types
•The definitions of microcredit that typically refer to non-bank, non-cooperative MFIs can be found in several countries.
Microcredit definitions
•Interest rate caps remain a threat, but were implemented only in one country now (Kazakhstan).
Interest rate caps
•Two countries have specialized deposit-taking forms of MFIs (Kyrgyzstan and Tajikistan), and two countries have limited deposit-taking licenses (Azerbaijan and Kosovo); yet deposit-taking by these forms has not taken off yet (or has very limited scale, as is the case with Tajikistan).
Deposit taking by non-bank
MFIs
© 2012, MIX and CGAP. All rights reserved.
13
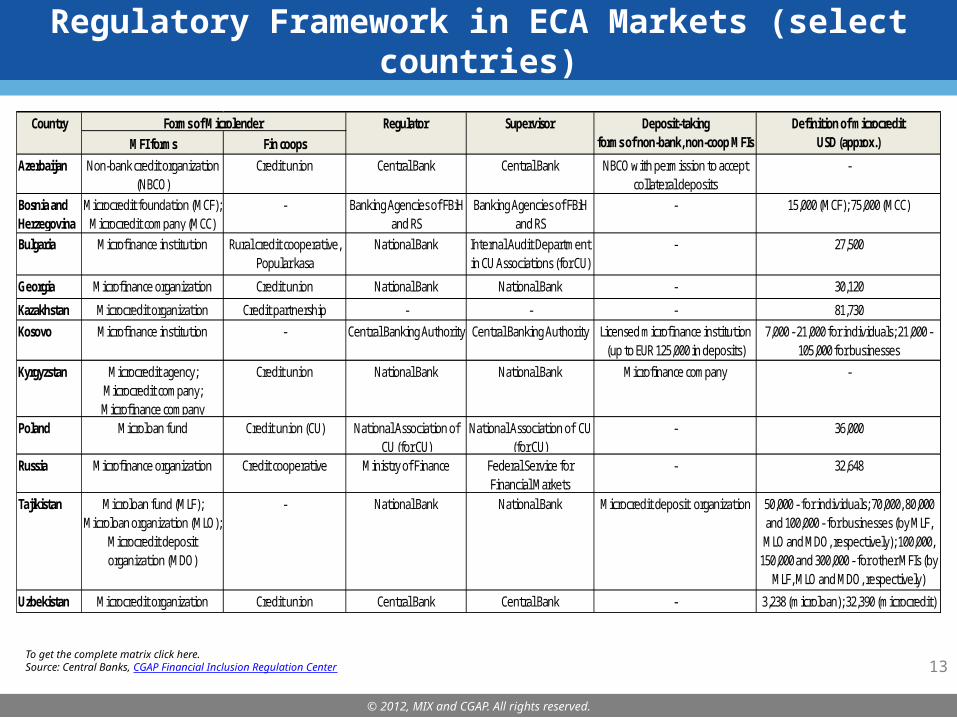
Regulatory Framework in ECA Markets (select countries)
To get the complete matrix click here. Source: Central Banks, CGAP Financial Inclusion Regulation Center
Country Regulator Supervisor Deposit-takingMFI forms Fin coops forms of non-bank, non-coop MFIs USD (approx.)
Azerbaijan Non-bank credit organization (NBCO)
Credit union Central Bank Central Bank NBCO with permission to accept collateral deposits
-
Bosnia and Herzegovina
Microcredit foundation (MCF); Microcredit company (MCC)
- Banking Agencies of FBiH and RS
Banking Agencies of FBiH and RS
- 15,000 (MCF); 75,000 (MCC)
Bulgaria Microfinance institution Rural credit cooperative, Popular kasa
National Bank Internal Audit Department in CU Associations (for CU)
- 27,500
Georgia Microfinance organization Credit union National Bank National Bank - 30,120
Kazakhstan Microcredit organization Credit partnership - - - 81,730
Kosovo Microfinance institution - Central Banking Authority Central Banking Authority Licensed microfinance institution (up to EUR 125,000 in deposits)
7,000 - 21,000 for individuals; 21,000 - 105,000 for businesses
Kyrgyzstan Microcredit agency; Microcredit company; Microfinance company
Credit union National Bank National Bank Microfinance company -
Poland Microloan fund Credit union (CU) National Association of CU (for CU)
National Association of CU (for CU)
- 36,000
Russia Microfinance organization Credit cooperative Ministry of Finance Federal Service for Financial Markets
- 32,648
Tajikistan Microloan fund (MLF); Microloan organization (MLO);
Microcredit deposit organization (MDO)
- National Bank National Bank Microcredit deposit organization 50,000 - for individuals; 70,000, 80,000 and 100,000 - for businesses (by MLF, MLO and MDO, respectively); 100,000,
150,000 and 300,000 - for other MFIs (by MLF, MLO and MDO, respectively)
Uzbekistan Microcredit organization Credit union Central Bank Central Bank - 3,238 (microloan); 32,390 (microcredit)
Forms of Microlender Definition of microcredit
© 2012, MIX and CGAP. All rights reserved.
14
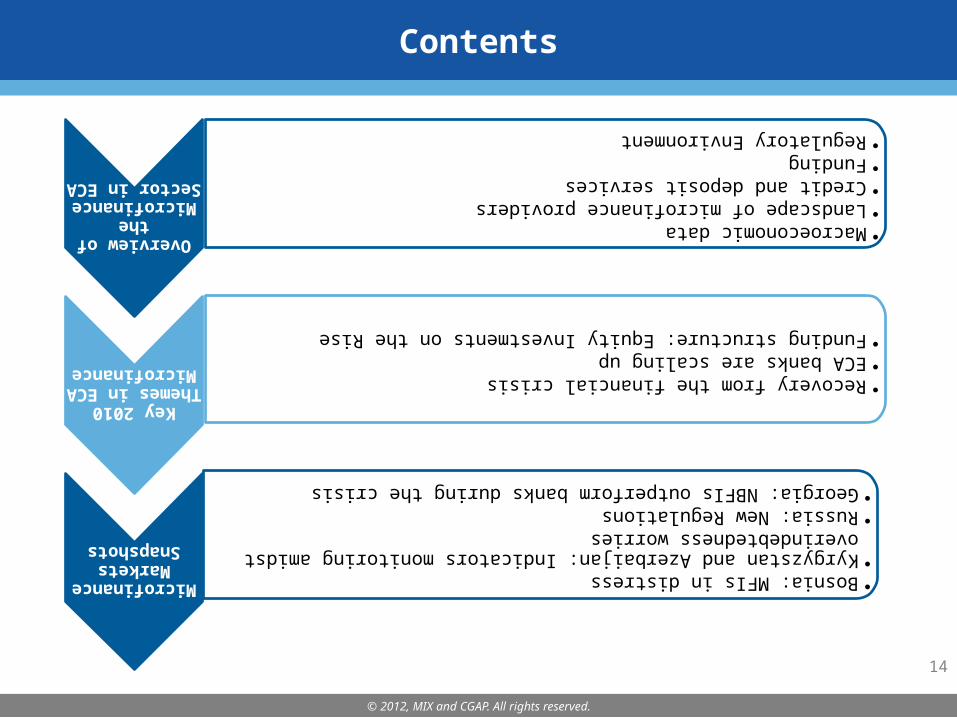
Contents
Overview of
the Microfinan
ce Sector in ECA
•Macroeconomic data
•Landscape of microfinance providers
•Credit and deposit services
•Funding•Regulatory
Environment
Key 2010 Themes in ECA
Microfinan
ce
•Recovery from the financial crisis
•ECA banks are scaling up
•Funding structure: Equity Investments on the Rise
Microfinan
ce Markets
Snapshots
•Bosnia: MFIs in distress
•Kyrgyzstan and Azerbaijan: Indicators monitoring amidst overindebtedness worries
•Russia: New Regulations
•Georgia: NBFIs outperform banks during the crisis
© 2012, MIX and CGAP. All rights reserved.
15
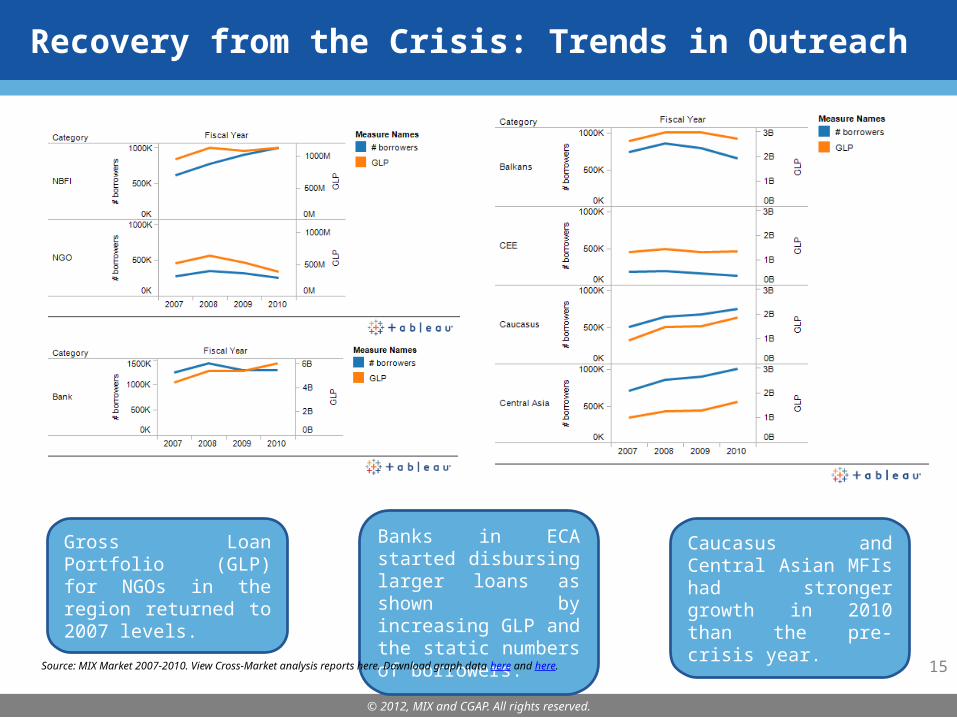
Recovery from the Crisis: Trends in Outreach
Gross Loan Portfolio (GLP) for NGOs in the region returned to 2007 levels.
Banks in ECA started disbursing larger loans as shown by increasing GLP and the static numbers of borrowers.
Source: MIX Market 2007-2010. View Cross-Market analysis reports here. Download graph data here and here.
Caucasus and Central Asian MFIs had stronger growth in 2010 than the pre-crisis year.

© 2012, MIX and CGAP. All rights reserved.
16
Recovery from the Crisis: Profitability
View Cross-Market analysis report.Source: MIX Market, 2010. View Cross-Market analysis report.
With the exceptions of Bosnian NGOs, overall ECA MFI improved slightly their profitability indicators in 2010. But on country specific level, over half of the markets in the region are still unprofitable on adjusted basis.
To see MIX adjustment policy, click here.
© 2012, MIX and CGAP. All rights reserved.
17
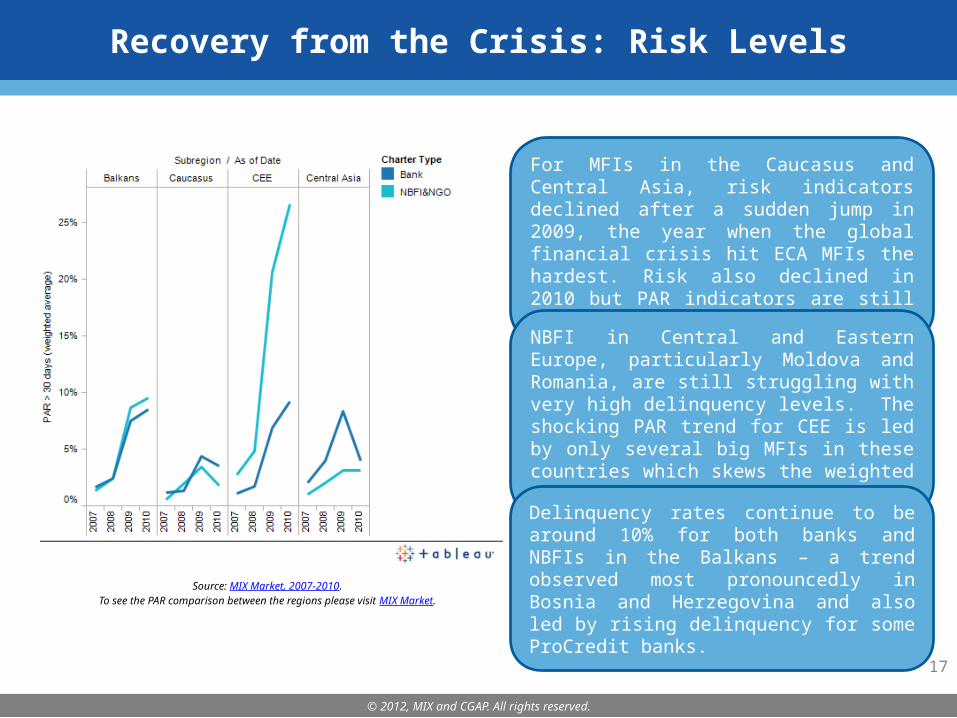
Recovery from the Crisis: Risk Levels
Source: MIX Market, 2007-2010.To see the PAR comparison between the regions please visit MIX Market.
For MFIs in the Caucasus and Central Asia, risk indicators declined after a sudden jump in 2009, the year when the global financial crisis hit ECA MFIs the hardest. Risk also declined in 2010 but PAR indicators are still far from pre-crisis levels.
NBFI in Central and Eastern Europe, particularly Moldova and Romania, are still struggling with very high delinquency levels. The shocking PAR trend for CEE is led by only several big MFIs in these countries which skews the weighted average figures.
Delinquency rates continue to be around 10% for both banks and NBFIs in the Balkans – a trend observed most pronouncedly in Bosnia and Herzegovina and also led by rising delinquency for some ProCredit banks.
© 2012, MIX and CGAP. All rights reserved.
18
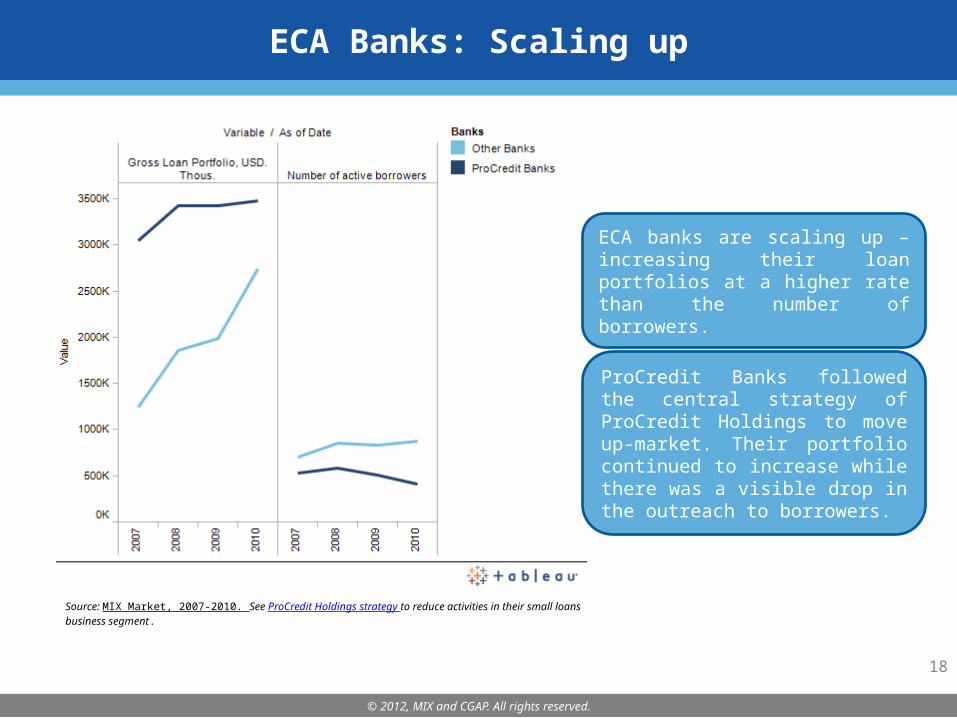
ECA Banks: Scaling up
Source: MIX Market, 2007-2010. See ProCredit Holdings strategy to reduce activities in their small loans business segment.
ECA banks are scaling up – increasing their loan portfolios at a higher rate than the number of borrowers.
ProCredit Banks followed the central strategy of ProCredit Holdings to move up-market. Their portfolio continued to increase while there was a visible drop in the outreach to borrowers.
© 2012, MIX and CGAP. All rights reserved.
19
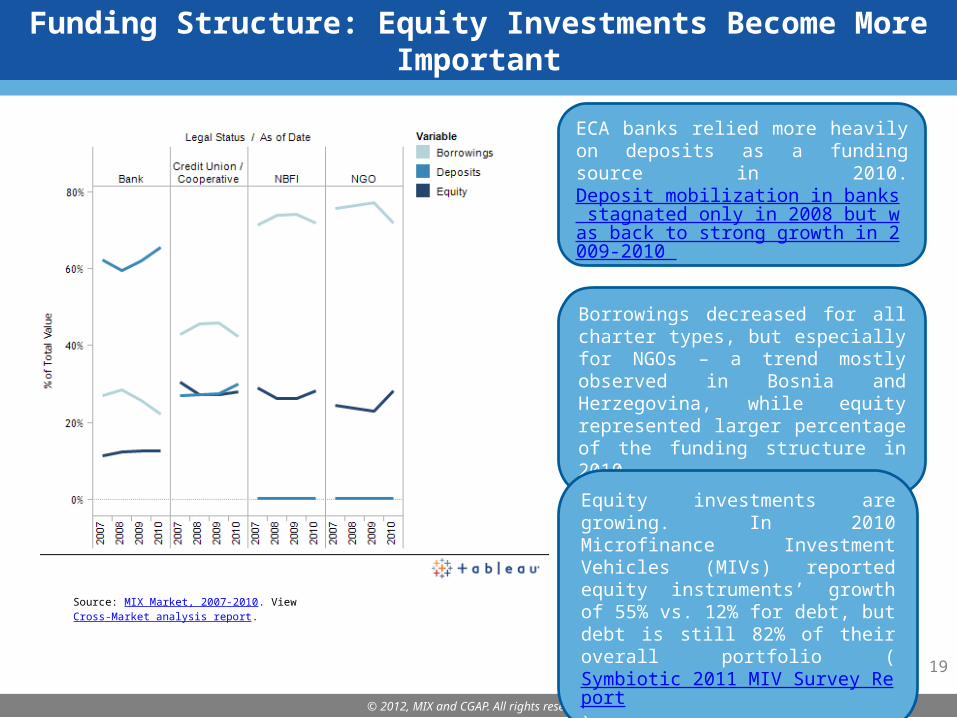
Funding Structure: Equity Investments Become More Important
Source: MIX Market, 2007-2010. View Cross-Market analysis report.
ECA banks relied more heavily on deposits as a funding source in 2010. Deposit mobilization in banks stagnated only in 2008 but was back to strong growth in 2009-2010 after depositor confidence was restored.
Borrowings decreased for all charter types, but especially for NGOs – a trend mostly observed in Bosnia and Herzegovina, while equity represented larger percentage of the funding structure in 2010.
Equity investments are growing. In 2010 Microfinance Investment Vehicles (MIVs) reported equity instruments’ growth of 55% vs. 12% for debt, but debt is still 82% of their overall portfolio (Symbiotic 2011 MIV Survey Report).

© 2012, MIX and CGAP. All rights reserved.
20
Debt Funding in the Aftermath of the Crisis
Source: MIX Funding Structure Database, 2008-2010. To create similar reports click on Funding Structure Reports. Note: the information is based on funding structure data provided in all three years from 94 ECA MFIs.
Government funding is only on the rise for banks in Armenia, Tajikistan and Uzbekistan. Debt financing from other funders stagnated.
Funding from MIVs decreased due to high drops in Bosnia and Herzegovina , Serbia and Ukraine but had solid growth in Azerbaijan and Kyrgyzstan.
Funding from local financial institutions continued to shrink in 2010 although the large negative trend in Bosnia and Herzegovina seen in 2009 stopped and some MFIs raised money from local banks in 2010. In Kyrgyzstan MFIs also had greater access to funding from local banks in 2010.
© 2012, MIX and CGAP. All rights reserved.
21
Contents
Overview of
the Microfinan
ce Sector in ECA
•Macroeconomic data
•Landscape of microfinance providers
•Credit and deposit services
•Funding•Regulatory
Environment
Key 2010 Themes in ECA
Microfinan
ce
•Recovery from the financial crisis
•ECA banks are scaling up
•Funding structure: Equity Investments on the Rise
Microfinan
ce Markets
Snapshots
•Bosnia: MFIs in distress
•Kyrgyzstan and Azerbaijan: Indicators monitoring amidst overindebtedness worries
•Russia: New Regulations
•Georgia: NBFIs outperform banks during the crisis
© 2012, MIX and CGAP. All rights reserved.
22
Bosnia: MFIs in Distress
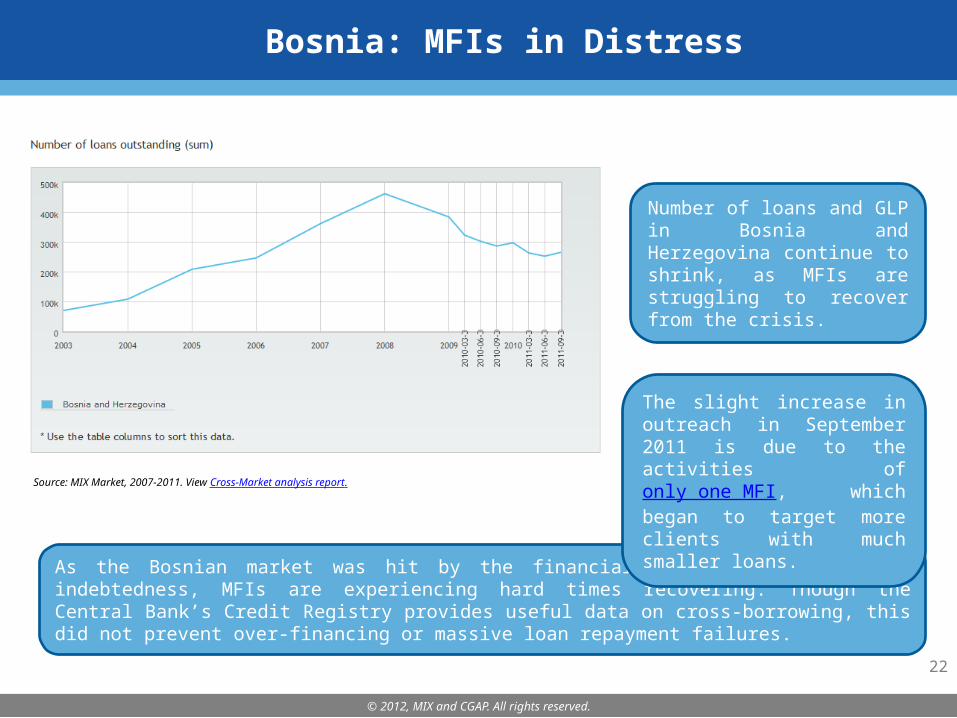
Number of loans and GLP in Bosnia and Herzegovina continue to shrink, as MFIs are struggling to recover from the crisis.
Source: MIX Market, 2007-2011. View Cross-Market analysis report.
As the Bosnian market was hit by the financial crisis and high over-indebtedness, MFIs are experiencing hard times recovering. Though the Central Bank’s Credit Registry provides useful data on cross-borrowing, this did not prevent over-financing or massive loan repayment failures.
The slight increase in outreach in September 2011 is due to the activities of only one MFI, which began to target more clients with much smaller loans.
© 2012, MIX and CGAP. All rights reserved.
23
Bosnia: MFIs in Distress
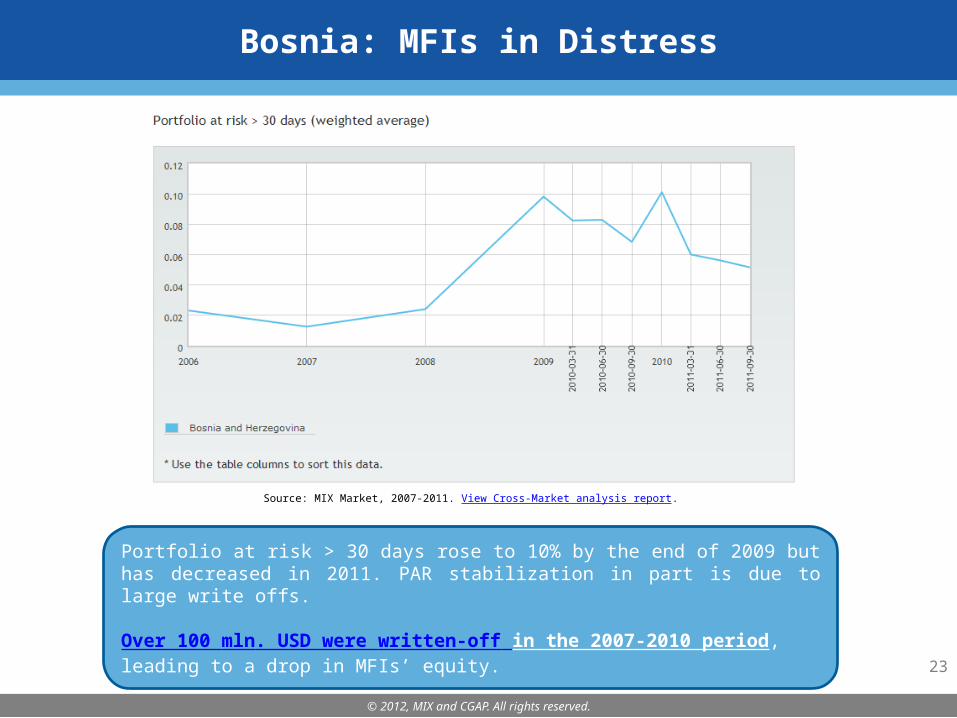
Source: MIX Market, 2007-2011. View Cross-Market analysis report.
Portfolio at risk > 30 days rose to 10% by the end of 2009 but has decreased in 2011. PAR stabilization in part is due to large write offs.
Over 100 mln. USD were written-off in the 2007-2010 period, leading to a drop in MFIs’ equity.
© 2012, MIX and CGAP. All rights reserved.
24
Kyrgyzstan: Indicators Monitoring amidst Over-indebtedness Worries
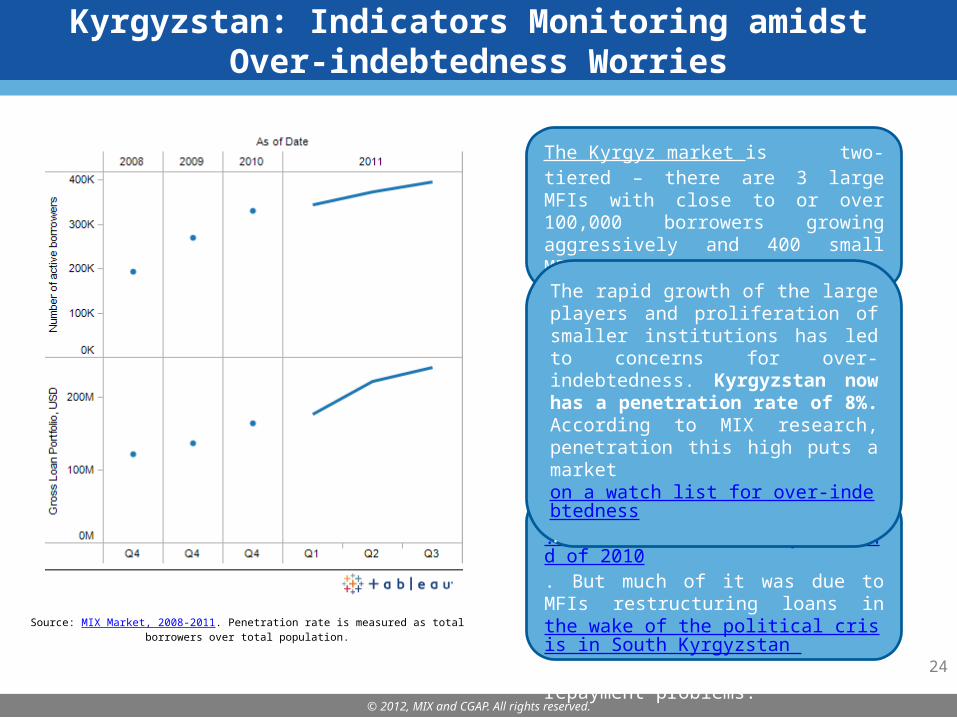
PAR > 30 days increased from 1.3% in 2009 to 3.30% by the end of 2010. But much of it was due to MFIs restructuring loans in the wake of the political crisis in South Kyrgyzstan and not to widespread repayment problems.
Source: MIX Market, 2008-2011. Penetration rate is measured as total borrowers over total population.
The Kyrgyz market is two-tiered – there are 3 large MFIs with close to or over 100,000 borrowers growing aggressively and 400 small MFIs.
The rapid growth of the large players and proliferation of smaller institutions has led to concerns for over-indebtedness. Kyrgyzstan now has a penetration rate of 8%. According to MIX research, penetration this high puts a market on a watch list for over-indebtedness.
© 2012, MIX and CGAP. All rights reserved.
25
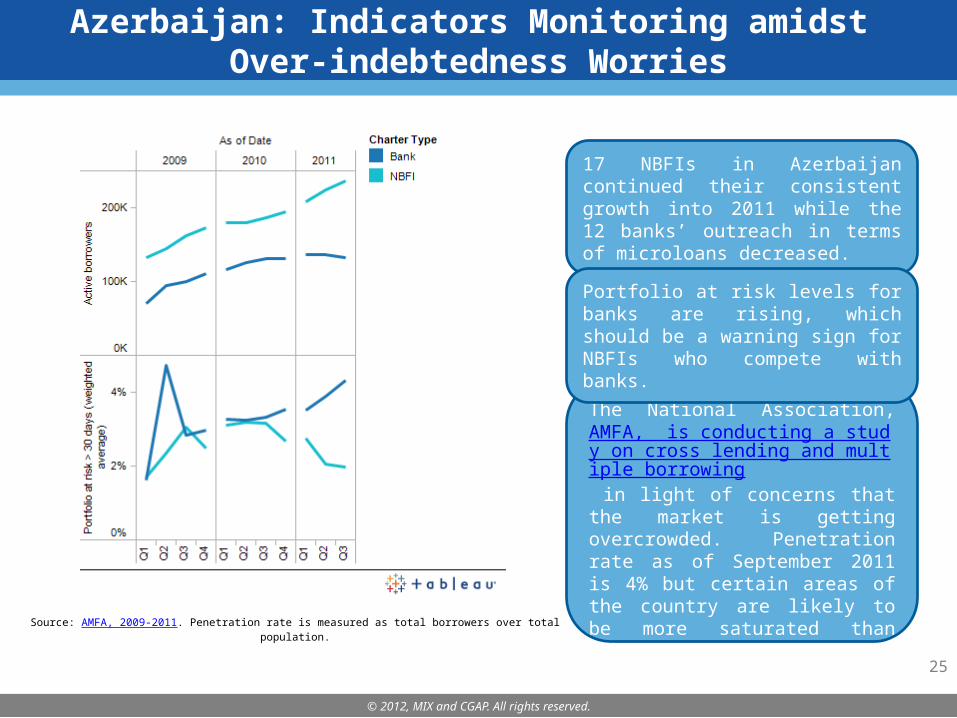
Azerbaijan: Indicators Monitoring amidst Over-indebtedness Worries
The National Association, AMFA, is conducting a study on cross lending and multiple borrowing in light of concerns that the market is getting overcrowded. Penetration rate as of September 2011 is 4% but certain areas of the country are likely to be more saturated than others.Source: AMFA, 2009-2011. Penetration rate is measured as total borrowers over total population.
17 NBFIs in Azerbaijan continued their consistent growth into 2011 while the 12 banks’ outreach in terms of microloans decreased.
Portfolio at risk levels for banks are rising, which should be a warning sign for NBFIs who compete with banks.
© 2012, MIX and CGAP. All rights reserved.
26
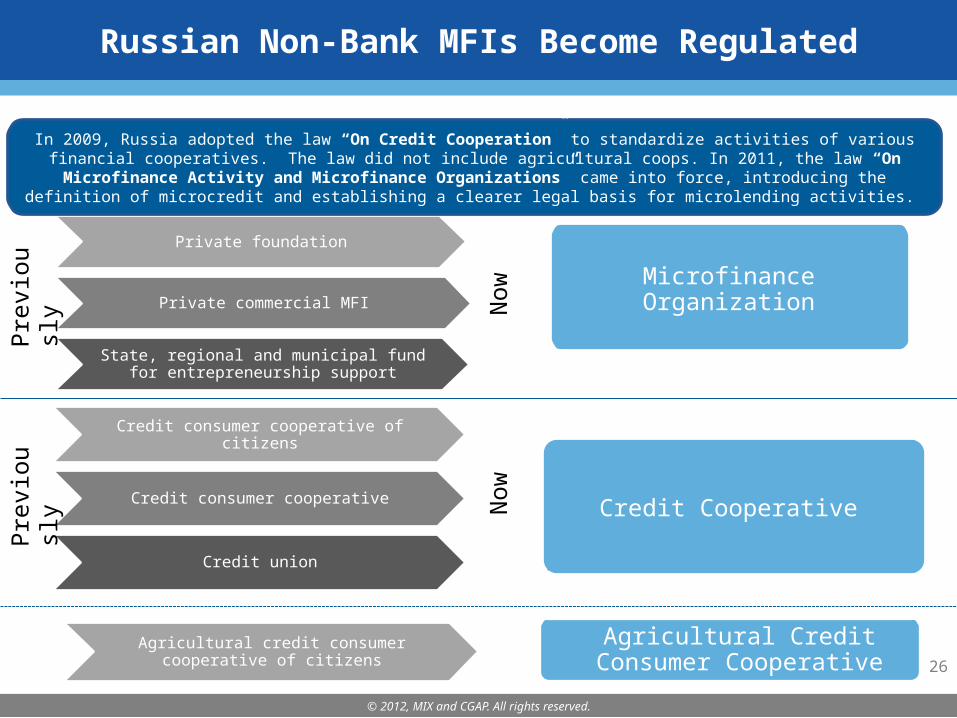
Russian Non-Bank MFIs Become Regulated
Private foundation
Private commercial MFI
State, regional and municipal fund for entrepreneurship support
Credit consumer cooperative of citizens
Credit consumer cooperative
Credit union
Agricultural credit consumer cooperative of citizens
In 2009, Russia adopted the law “On Credit Cooperation” to standardize activities of various financial cooperatives. The law did not include agricultural coops. In 2011, the law “On Microfinance Activity and Microfinance Organizations” came into force, introducing the definition of microcredit and establishing a
clearer legal basis for microlending activities.
Microfinance Organization
Credit Cooperative
Agricultural Credit Consumer Cooperative
Pre
vio
us
lyPre
vio
us
ly
Now
Now
© 2012, MIX and CGAP. All rights reserved.
27
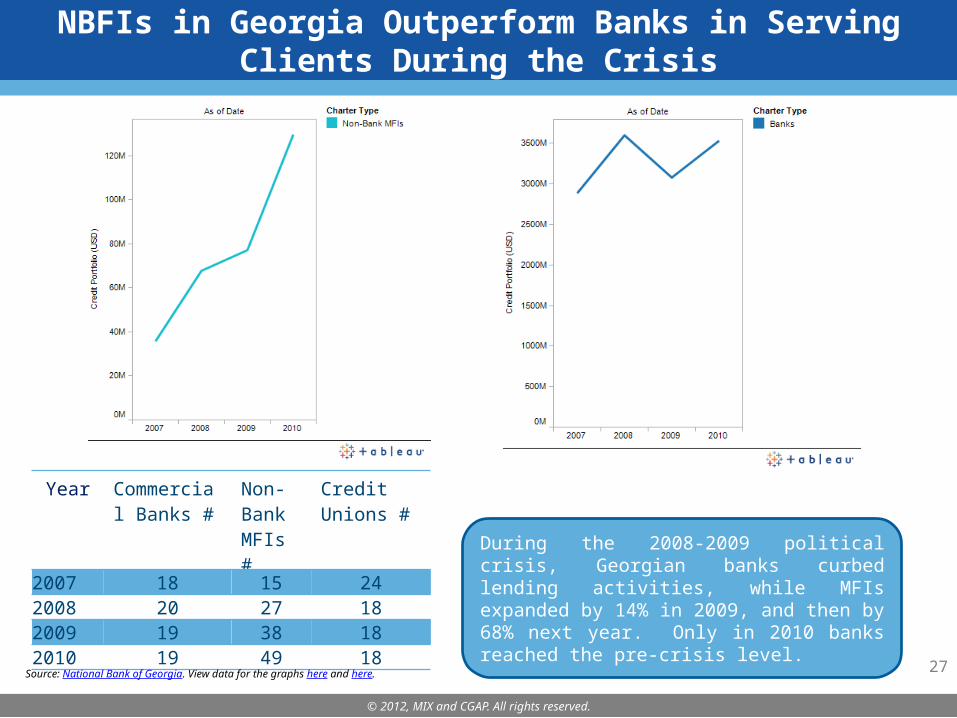
NBFIs in Georgia Outperform Banks in Serving Clients During the Crisis
During the 2008-2009 political crisis, Georgian banks curbed lending activities, while MFIs expanded by 14% in 2009, and then by 68% next year. Only in 2010 banks reached the pre-crisis level.
Year Commercial Banks #
Non-Bank MFIs #
Credit Unions #
2007 18 15 242008 20 27 182009 19 38 182010 19 49 18
Source: National Bank of Georgia. View data for the graphs here and here.
© 2012, MIX and CGAP. All rights reserved.
28
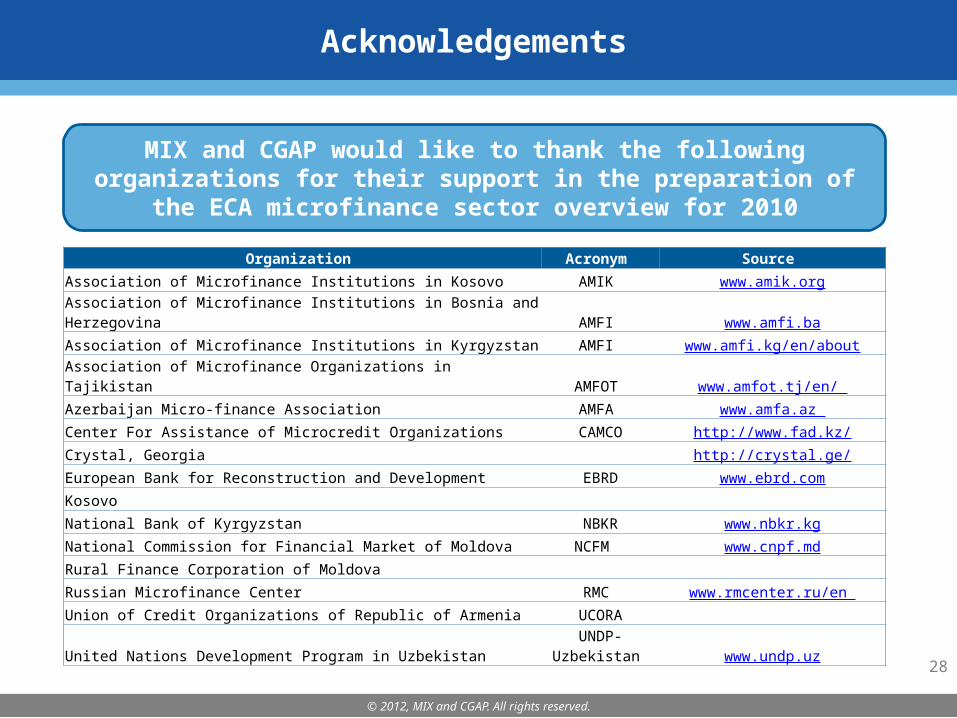
Acknowledgements
Organization Acronym Source
Association of Microfinance Institutions in Kosovo AMIK www.amik.orgAssociation of Microfinance Institutions in Bosnia and Herzegovina AMFI www.amfi.ba
Association of Microfinance Institutions in Kyrgyzstan AMFI www.amfi.kg/en/about
Association of Microfinance Organizations in Tajikistan AMFOT www.amfot.tj/en/
Azerbaijan Micro-finance Association AMFA www.amfa.az
Center For Assistance of Microcredit Organizations CAMCO http://www.fad.kz/
Crystal, Georgia http://crystal.ge/
European Bank for Reconstruction and Development EBRD www.ebrd.com
Kosovo
National Bank of Kyrgyzstan NBKR www.nbkr.kg
National Commission for Financial Market of Moldova NCFM www.cnpf.md
Rural Finance Corporation of Moldova
Russian Microfinance Center RMC www.rmcenter.ru/en
Union of Credit Organizations of Republic of Armenia UCORA
United Nations Development Program in Uzbekistan UNDP-
Uzbekistan www.undp.uz
MIX and CGAP would like to thank the following organizations for their support in the preparation of the
ECA microfinance sector overview for 2010
© 2012, MIX and CGAP. All rights reserved.
29
About MIX
MIX is the premier source for objective, qualified and relevant microfinance performance data and analysis. Committed to strengthening financial inclusion and the microfinance sector by promoting transparency, MIX provides performance information on microfinance institutions (MFIs), funders, networks and service providers dedicated to serving the financial sector needs for low-income clients. MIX fulfills its mission through a variety of platforms. On MIX Market (www.mixmarket.org), we provide instant access to financial and social performance information covering approximately 2,000 MFIs around the world. Our publications, MicroBanking Bulletin and MIX Microfinance World, feature thorough and timely analysis based on qualified data and research.
About CGAP
CGAP is an independent policy and research center dedicated to advancing financial access for the world’s poor. It is supported by over 30 development agencies and private foundations who share a common mission to alleviate poverty. Housed at the World Bank, CGAP provides market intelligence, promotes standards, develops innovative solutions and offers advisory services to governments, microfinance providers, donors, and investors. For more information, visit http://www.cgap.org.
About MIX and CGAP