Embed Size (px)
Citation preview
Enel SpAInvestor Relations
1Q2012 Results
May 10, 2012

Enel SpAInvestor Relations
AgendaAgenda
• 1Q2012 results
• Annexes
1

Enel SpAInvestor Relations1Q2012 results
1Q12 electricity demand vs. Plan assumptions1Q12 electricity demand vs. Plan assumptions
+1 2%
Electricity demand 2011-2016 CAGR
Italy-1.9%
Electricity demand 1Q2012
1Q12 actual +1.2%
+1.5%
Italy
Spain1
1.9%
-1.0%
+0.4%
0 8%
Italy
Spain1
1Q12 actual
FY12 budget
1Q12 actual
FY12 b d t
+1.3%Russia+2.8%
-0.8%
+1.0%Russia
FY12 budget
1Q12 actual
FY12 budget
+1.8%Slovakia-0.8%+1.6%
Slovakia1Q12 actual
FY12 budget
+5.1%Latam2,3+5.9%+4.4%
Latam2,31Q12 actual
FY12 budget
2
1. Peninsular2. Brazil, Chile (CIS), Colombia, Peru, Argentina3. Average demand growth weighted by production
Budget Growth marketsMature markets

Enel SpAInvestor Relations1Q2012 results
Financial highlights: consolidatedFinancial highlights: consolidated
1Q11 1Q12 %€mn
Revenues
EBITDA
19,536
4,399
+8.5
-2.2
21,193
4,302
EBIT
Group net income
3,036
1,201
-4.4
-1.4
2,902
1,184(1)Group net ordinary income
Net debt
1,182
44,629
-15.2
+2.2(2),(3)
1,003
45,617 (3)
(1)
3
1. Excluding capital gains, losses and one-off items2. As of December 31, 20113. Excluding net debt of assets held for sale
Enel SpAInvestor Relations
From EBIT to Net Income
1Q2012 results
From EBIT to Net Income
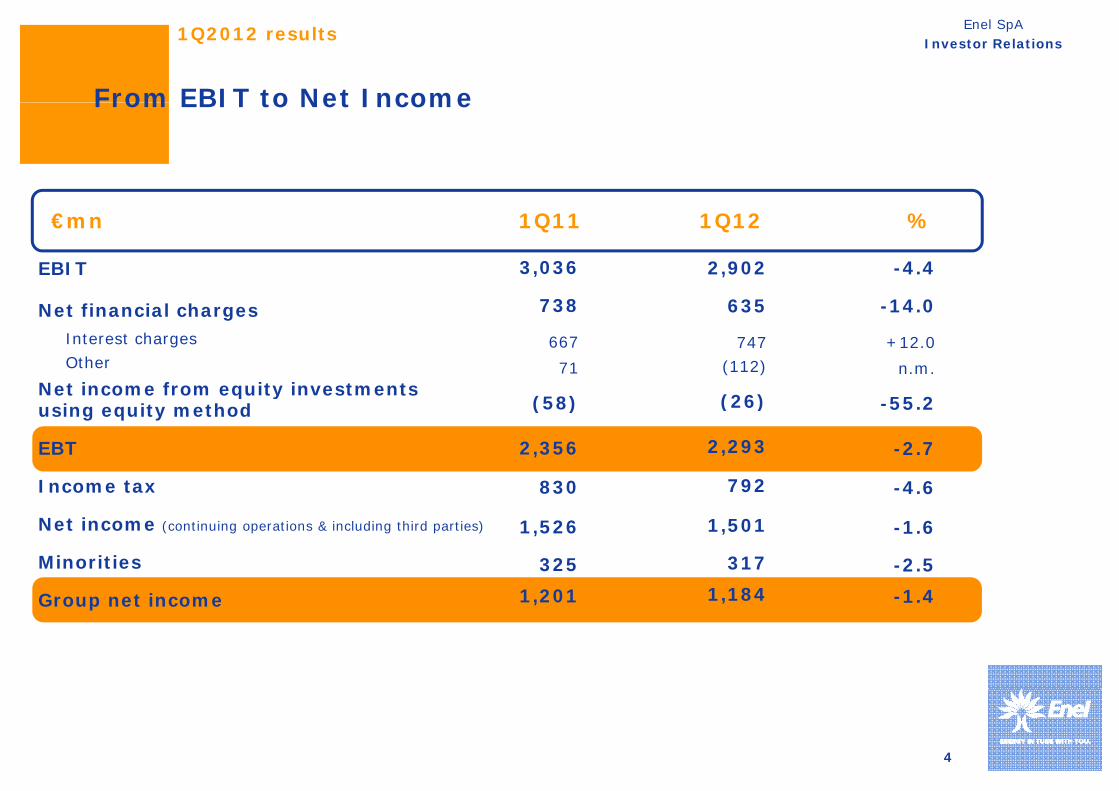
EBIT
1Q11 1Q12 %€mn
3,036 2,902 -4.4
Net financial chargesInterest chargesOther
Net income from equity investments
738
66771
( 8)
635
747(112)
(26)
-14.0
+12.0n.m.
et co e o equ ty est e tsusing equity method
EBT
Income tax
(58)
2,356
830
(26)
2,293
792
-55.2
-2.7
-4.6
Net income (continuing operations & including third parties)
Minorities
830
1,526
3251 201
1,501
3171 184
4.6
-1.6
-2.51 4Group net income 1,201 1,184 -1.4
4

Enel SpAInvestor Relations
Focus on forward electricity sales
1Q2012 results
Focus on forward electricity sales
Level of total production hedged (%)
Italy Spain100 100 100 100
~ 30-35
~ 65-70 ~ 55
~ 45(1)
~ 10
~ 90(1)
20132012 2013(2)2012
Latam Slovakia100 100 100 100
60 65
~ 35-40
~75-80
~ 20-25
100 100 100 100
~ 60
2013
~ 60-65 75 80
2012 20132012Unhedged
~ 40
5
Hedged
1. Including roll-over2. Not including domestic coal output
Enel SpAInvestor Relations
Group EBITDA evolution (€mn)
1Q2012 results
-2.2%
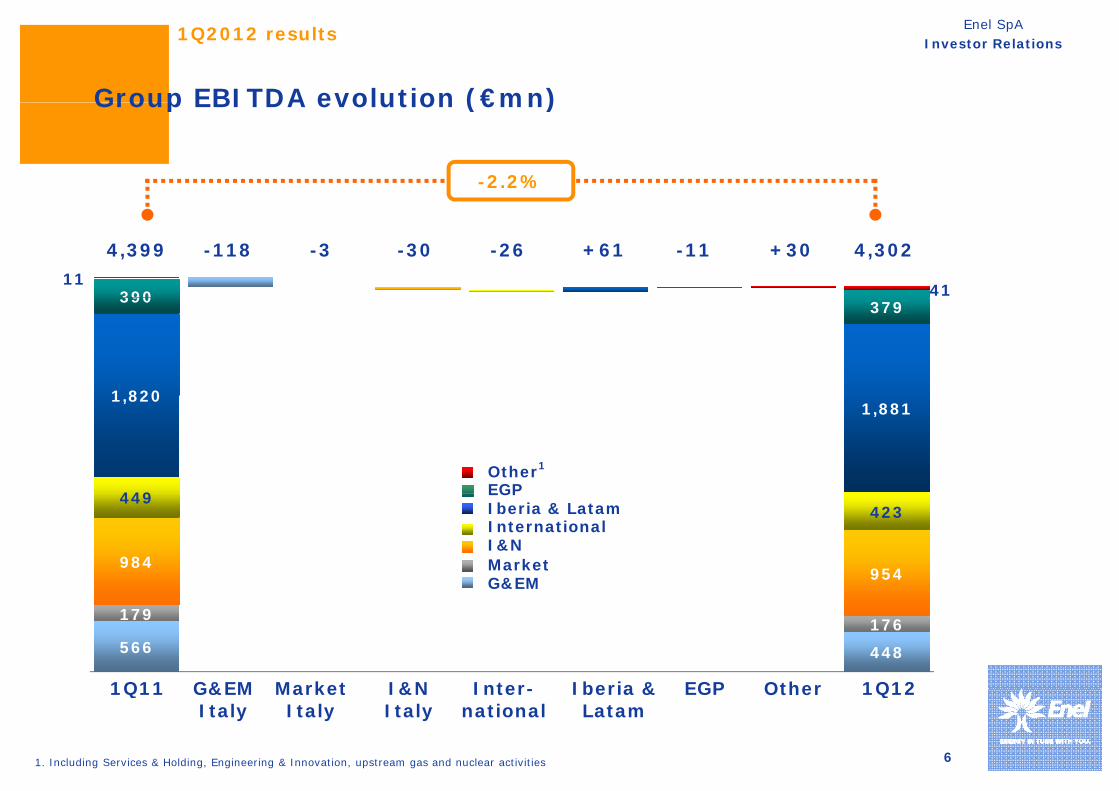
Group EBITDA evolution (€mn)
39011
41
4,399 -118 4,302-3 -30 -26 +61 -11 +30
1 820
390 379
449
1,8201,881
Other1
EGP
984954
449423
MarketI&N
G&EM
Iberia & LatamInternational
EGP
566 448
179 176
1Q11 G&EM Market I&N Iberia & 1Q12Inter- EGP Other
61. Including Services & Holding, Engineering & Innovation, upstream gas and nuclear activities
1Q11 G&EMItaly
MarketItaly
I&NItaly
Iberia &Latam
1Q12Inter-national
EGP Other

Enel SpAInvestor Relations
EBITDA evolution: G&EM Italy (€mn)
1Q2012 results
EBITDA evolution: G&EM Italy (€mn)
-20.8%
-81566 81+43 -80
566
448
1Q11 Generation margin
1Q12Tradingmargin
Other
7

Enel SpAInvestor Relations1Q2012 results
EBITDA evolution: Market Italy (€mn)EBITDA evolution: Market Italy (€mn)
2179 5 176
-1.7%
+2179 -5 176
1Q11 Regulated 1Q12Free1Q11 Regulatedmarket
1Q12Freemarket
8

Enel SpAInvestor Relations
EBITDA evolution: Infrastructure & Networks Italy (€mn)
1Q2012 results
EBITDA evolution: Infrastructure & Networks Italy (€mn)
-3.0%
+6984 -2 954-34
1Q11 Connection fees
1Q12Energy margin
Other
9
Enel SpAInvestor Relations
EBITDA evolution: International (€mn)
1Q2012 results
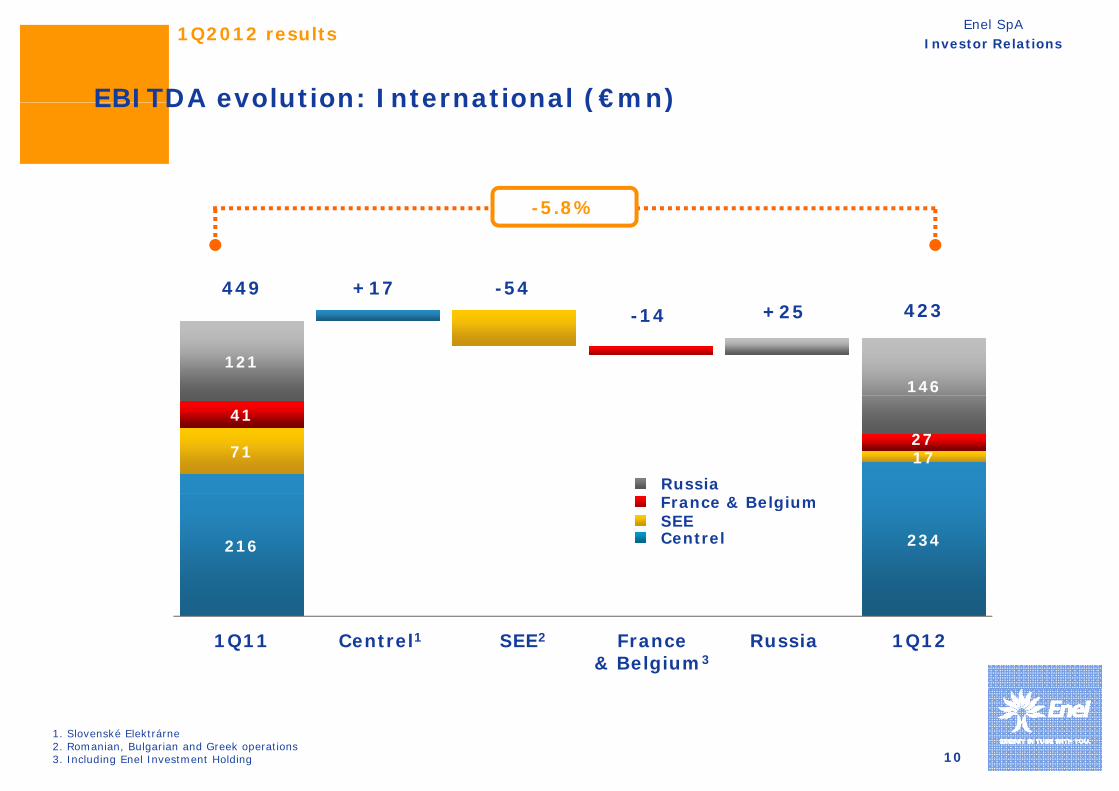
EBITDA evolution: International (€mn)
449 -54+17
-5.8%
121146
-14 423+25
71 17
4127
Russia
216 234SEEFrance & Belgium
Centrel
1Q11 1Q12RussiaSEE2Centrel1 France& Belgium3
10
1. Slovenské Elektrárne2. Romanian, Bulgarian and Greek operations3. Including Enel Investment Holding

Enel SpAInvestor Relations
Focus on Russia: SeverEnergia
1Q2012 results
Production (bcm) – Enel’s stake
CAGR: ~ +200%
4.7
0.3West Siberia
2012 2016Moscow
Noviy Urengoy
West Siberia
SeverEnergia to become the second independent
11
g pRussian gas producer

Enel SpAInvestor Relations
EBITDA evolution1: Endesa - Iberia2 (€mn)
1Q2012 results
EBITDA evolution : Endesa Iberia (€mn)
-2.3%
1,1071,133 -5 -47 +26
1Q11 Liberalized business
Regulated business
1Q12Other
121. Enel’s GAAP figures2. Including Ireland and Marocco

Enel SpAInvestor Relations
EBITDA evolution1: Endesa - Latam (€mn)
1Q2012 results
EBITDA evolution : Endesa Latam (€mn)
+12.7%
774687 -83 +82
+67 +21
1Q11 Generation Distribution 1Q12Other Forexeffect
131. Enel’s GAAP figures

Enel SpAInvestor Relations
EBITDA evolution: Enel Green Power (€mn)
1Q2012 results
EBITDA evolution: Enel Green Power (€mn)
+8.0%
4024
37
390 -39-4351
+13 379+17
+22
137 114 131
North AmericaEnel.si
213 213 209Italy and EuropeIberia and Latin AmericaNorth America
1Q11 Italy and Europe
1Q12North America
Other Iberia and Latin America
Enel.si1Q11adjusted
14

Enel SpAInvestor Relations
Net debt evolution (€mn)
1Q2012 results
Net debt evolution (€mn)
+988(1)
December 31,2011
CapexCash-flowfrom operations
Net financialcharges2
Extra-ordinary
March 31,2012
+988
Dividends3
activities
+1(4) +1(4)
-44,629 -45,617
+1,019 -1 336 747 78 154,0 9 -1,336 -747 -78 +154
151. Net debt change calculated on continuing operations2. Net financial charges due to interest expenses
3. Dividends paid to minorities4. Net financial debt of assets held for sale

Enel SpAInvestor Relations
AgendaAgenda
• 1Q2012 results
• Annexes
16
Enel SpAInvestor Relations1Q2012 results - Operational annexes
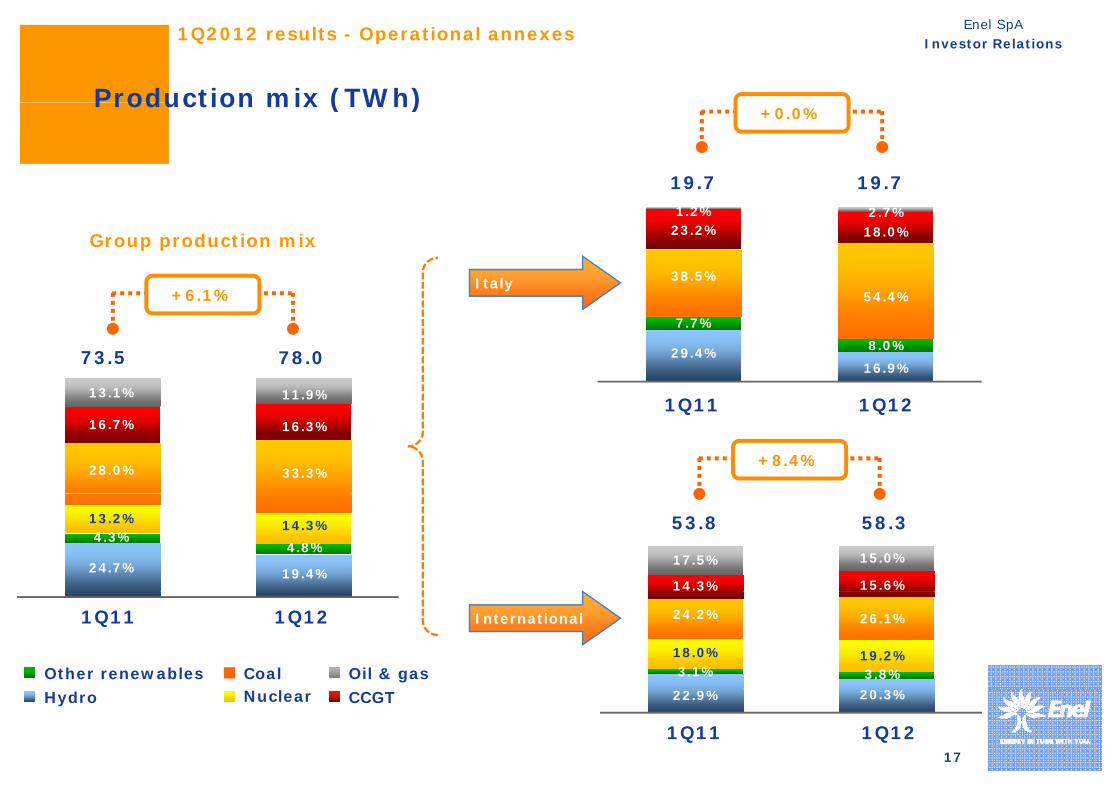
Production mix (TWh)
19.719.7
+0.0%Production mix (TWh)
Group production mix
+6.1%Italy
1.2%23.2%
38.5%
2.7%18.0%
54 4%
78.073.5
+6.1%
29.4%
7.7%
13.1% 11 9%
54.4%
16.9%8.0%
+8.4%
1Q11 1Q1213.1%
16.7%
28.0%
11.9%
16.3%
33.3%
58.353.8
17.5%
14.3%
13.2%4.3%
24.7%
14.3%4.8%
19.4%15.0%
15.6%
Oil & gasCoalOther renewables
1Q11 1Q12 24.2%
3.1%18.0%
26.1%
3.8%19.2%
International
17
CCGTNuclearHydro
1Q11 1Q12
22.9% 20.3%

Enel SpAInvestor Relations1Q2012 results - Operational annexes
1Q12 Group total net installed capacity1: breakdown by source
OtherMW Hydro Nuclear Coal Oil & gas CCGT TOTAL
and location
ren.
1,46313,648 - 6,746
ST/OCGT
12,022Italy 5,916 39,795
1,7724,729 3,535 5,533 4,757(3)Iberia 4,682(2) 25,008
-
5,4017
654(4)
2,329
19
1,816
-
849 400
-
Centrel
SEE
-
- 673654( )
801
19
9,675 - 488 2,052
SEE
Americas 4,304
673
17,320
-- - 3,623 4,575Russia 809 9,007
18
4,69730,400 5,351 17,239 23,806TOTAL 15,711
1. Including Group renewable capacity2. Including 123 MW of installed capacity in Morocco
97,204
3. Including 1,013 MW of installed capacity in Ireland4. Including 166 MW other renewable capacity in France

Enel SpAInvestor Relations1Q2012 results - Operational annexes
1Q2012 Group total net production1: breakdown by source and
GWh Hydro Nuclear Coal Oil & gas CCGT TOTAL
location
OtherST/OCGT
Italy
ren.
1,5763,327 - 10,717 5313,543 19,694
Iberia 1,0641,019 7,276 8,741 2,416(3)2,120(2) 22,636
Centrel
SEE -
5,6118
343(4)
1,150
18
3,897
-
556 -
-
-
- 361SEE
Americas
343( )
801
18
9,628 - 540 9545,669
361
17,592
Russia -- - 5,382 5,3791,343 12,104
19
TOTAL
1. Including Group renewable production2. Including 226 GWh of net production in Morocco
3. Including 7 GWh of net production in Ireland4. Including 91 GWh of net production in France
3,79215,142 11,173 25,936 9,28012,675 77,998

Enel SpAInvestor Relations1Q2012 results - Operational annexes
1Q2012 renewables net installed capacity: breakdown by source
GeothermalMW Wind Other TOTALHydro
and location
GeothermalMW Wind Other TOTALHydro
7221,531 1,272 82Italy & Europe 3,607
-786 1,675 120Iberia & Latam 2,581
60547313 48
Latam
North 1 01360547313 48America 1,013
2,630 769 3,552 250TOTAL 7,201
20
Enel SpAInvestor Relations1Q2012 results - Operational annexes
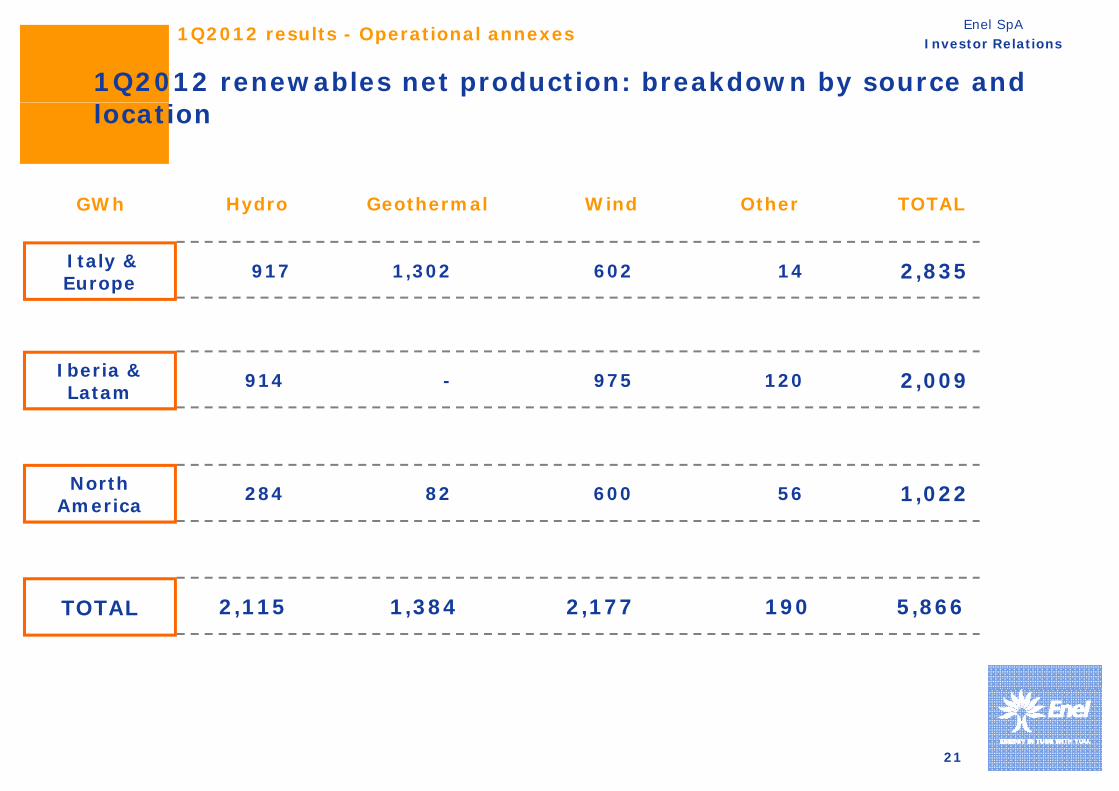
1Q2012 renewables net production: breakdown by source and
H d o Wind Othe TOTALGeothe malGWh
location
Hydro Wind Other TOTALGeothermalGWh
Italy & Europe 1,302917 602 14 2,835
Iberia & Latam -914 975 120 2,009Latam
North 60082284 56 1 022America 60082284 56 1,022
TOTAL 2,115 1,384 2,177 190 5,866
21
Enel SpAInvestor Relations1Q2012 results - Financial annexes
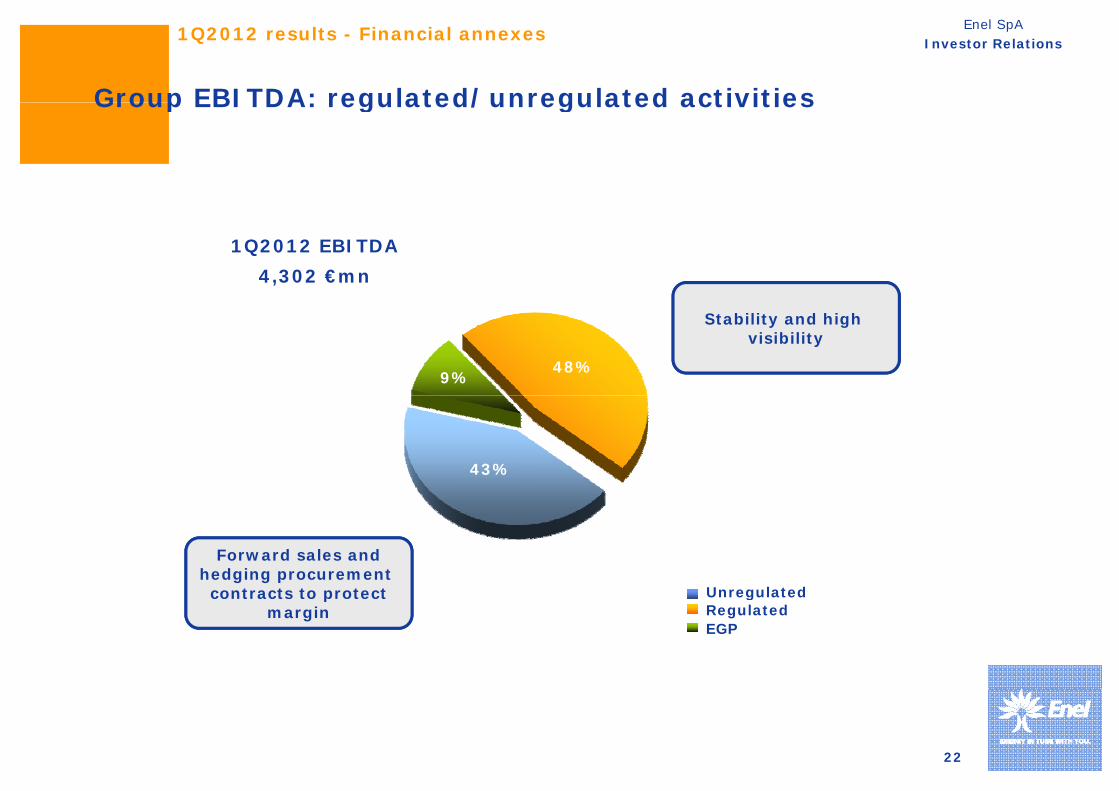
Group EBITDA: regulated/unregulated activitiesGroup EBITDA: regulated/unregulated activities
1Q2012 EBITDA4,302 €mn
48%9%
Stability and high visibility
43%
Unregulated
Forward sales andhedging procurement contracts to protect Unregulated
RegulatedEGP
contracts to protectmargin
22

Enel SpAInvestor Relations1Q2012 results - Financial annexes
EBITDA evolution - Other1 (€mn)EBITDA evolution Other (€mn)
+31
+18
+13 41
10
+18
1Q11 Services 1Q12Other
231. Including Services & Holding, Engineering & Innovation, upstream gas and nuclear activities
Enel SpAInvestor Relations1Q2012 results - Financial annexes
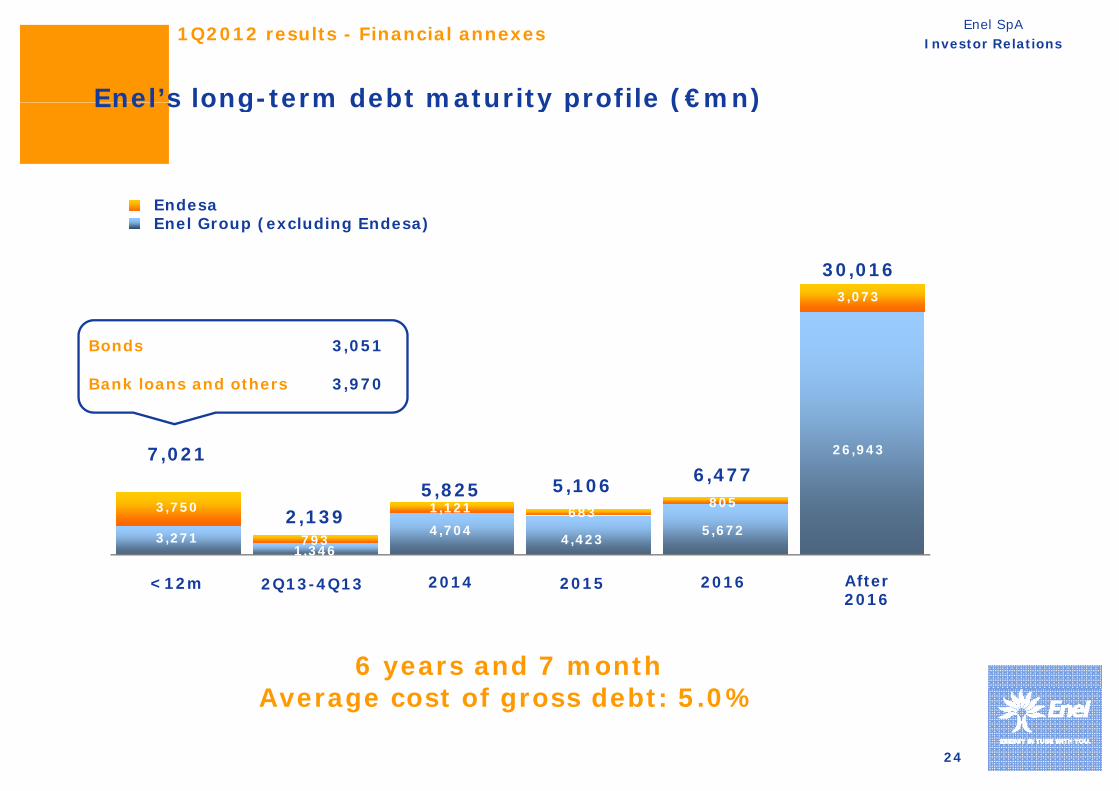
Enel’s long-term debt maturity profile (€mn)
E d
Enel s long term debt maturity profile (€mn)
EndesaEnel Group (excluding Endesa)
30,0163 073
Bonds
Bank loans and others
3,051
3,970
3,073
7,021
5,825 5,106 6,47726,943
<12m 2Q13-4Q13 2015 2016 After
2,1395,825 ,
2014
3,271
3,750
7931,346
1,1214,704
683
4,423
805
5,672
Q Q2016
6 years and 7 monthA t f d bt 5 0%
24
Average cost of gross debt: 5.0%

Enel SpAInvestor Relations1Q2012 results - Financial annexes
Enel Group liquidity analysis (€mn)Enel Group liquidity analysis (€mn)
Committed credit lines
Amount AvailableOutstanding
23,995 5,516 18,439(1)
Cash and cash equivalents
Total
Uncommitted lines
-
23,955
1 724
(8,994)
(3,478)
120
8,994
27,443
1,604Commercial paper
Total liquidity
1,724
9,300
34,979
120
7,060
3,702
1,604
2,239
31,276
25
1. Of which 15€bn with maturity after 2014

Enel SpAInvestor Relations1Q2012 results - Financial annexes
Debt structure1Debt structure
• Average debt maturity: 6 years and 7 months
• Average cost of gross debt2: 5.0%
• (Fixed+hedged)/Total gross long-term debt: 82%
• (Fixed+hedged)/Total net debt: 97%• (Fixed+hedged)/Total net debt: 97%
• Rating: Standard&Poor’s = BBB+/A-2 Stable Outlook
Moody’s = A3/P-2 Negative outlook
Fitch = A-/F2 Negative outlook
December 31,2011 %€mn March 31,
2012
45,127
14,471
45,127
14,471
Long-term
Short-term3
Long-term
Short-term3
46,056
15,058
46,056
15,058
+2.1
+4.1
+2.1
+4.1
(14,969)
44,629
(14,969)
44,629
Cash4
Net debt
Cash4
Net debt
(15,497)
45,617
(15,497)
45,617
+3.5
+2.2
+3.5
+2.2
26
1. As of March 31st, 20122. Average cost of net debt equal to 6.5%3. Including current maturities of long-term debt4. Including factoring and other current receivables
Enel SpAInvestor Relations1Q2012 results - Financial annexes
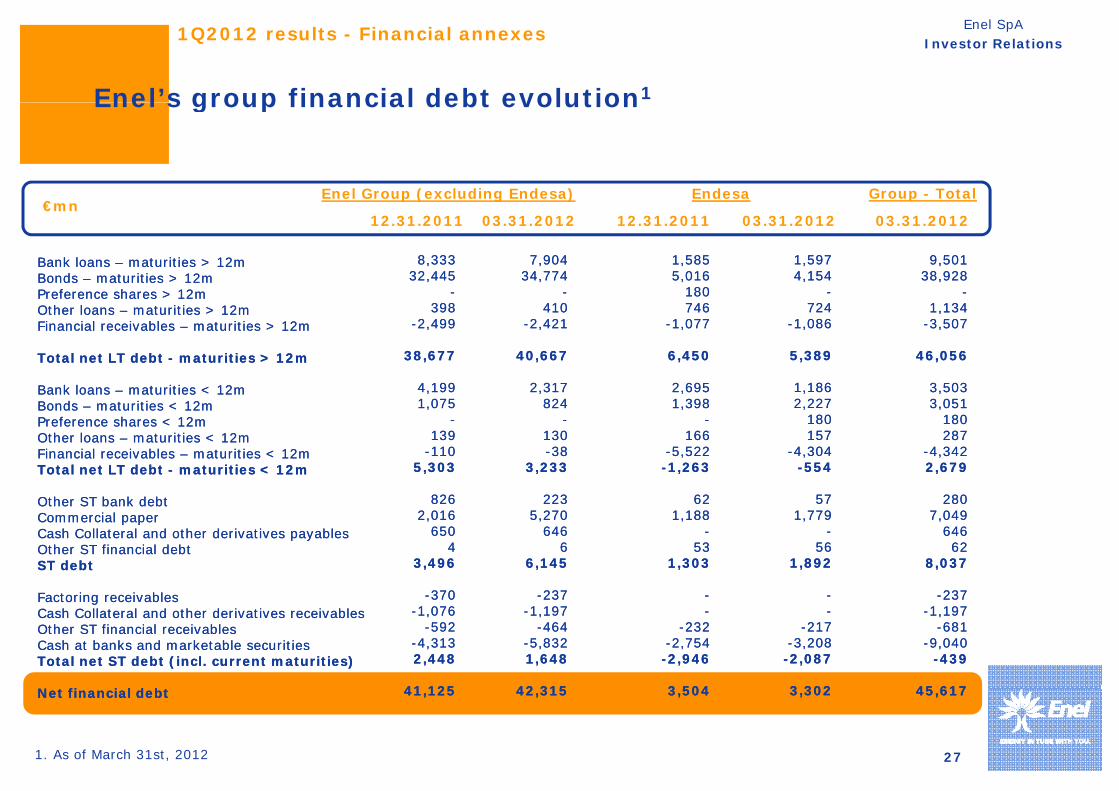
Enel’s group financial debt evolution1
Enel Group (excluding Endesa) Group - TotalEndesa
Enel s group financial debt evolution
€mn
Bank loans – maturities > 12mBonds – maturities > 12mPreference shares > 12m
Bank loans – maturities > 12mBonds – maturities > 12mPreference shares > 12m
p ( g )
12.31.2011 03.31.2012 12.31.2011 03.31.2012
p
03.31.2012
8,333 32,445
-
8,333 32,445
-
7,904 34,774
-
7,904 34,774
-
1,585 5,016
180
1,585 5,016
180
1,597 4,154
-
1,597 4,154
-
9,501 38,928
-
9,501 38,928
-Preference shares > 12mOther loans – maturities > 12mFinancial receivables – maturities > 12m
Total net LT debt - maturities > 12m
Bank loans – maturities < 12m
Preference shares > 12mOther loans – maturities > 12mFinancial receivables – maturities > 12m
Total net LT debt - maturities > 12m
Bank loans – maturities < 12m
398 -2,499
38,677
4,199
398 -2,499
38,677
4,199
410 -2,421
40,667
2,317
410 -2,421
40,667
2,317
746 -1,077
6,450
2,695
746 -1,077
6,450
2,695
724 -1,086
5,389
1,186
724 -1,086
5,389
1,186
1,134 -3,507
46,056
3,503
1,134 -3,507
46,056
3,503 Bonds – maturities < 12mPreference shares < 12mOther loans – maturities < 12mFinancial receivables – maturities < 12mTotal net LT debt - maturities < 12m
Bonds – maturities < 12mPreference shares < 12mOther loans – maturities < 12mFinancial receivables – maturities < 12mTotal net LT debt - maturities < 12m
1,075 -
139 -110
5,303
1,075 -
139 -110
5,303
824 -
130 -38
3,233
824 -
130 -38
3,233
1,398 -
166 -5,522 -1,263
1,398 -
166 -5,522 -1,263
2,227 180 157
-4,304 -554
2,227 180 157
-4,304 -554
3,051 180 287
-4,342 2,679
3,051 180 287
-4,342 2,679
Other ST bank debtCommercial paperCash Collateral and other derivatives payables Other ST financial debtST debt
Other ST bank debtCommercial paperCash Collateral and other derivatives payables Other ST financial debtST debt
826 2,016
650 4
3,496
370
826 2,016
650 4
3,496
370
223 5,270
646 6
6,145
237
223 5,270
646 6
6,145
237
62 1,188
-53
1,303
62 1,188
-53
1,303
57 1,779
-56
1,892
57 1,779
-56
1,892
280 7,049
646 62
8,037
237
280 7,049
646 62
8,037
237 Factoring receivablesCash Collateral and other derivatives receivablesOther ST financial receivablesCash at banks and marketable securitiesTotal net ST debt (incl. current maturities)
N t fi i l d bt
Factoring receivablesCash Collateral and other derivatives receivablesOther ST financial receivablesCash at banks and marketable securitiesTotal net ST debt (incl. current maturities)
N t fi i l d bt
-370 -1,076
-592 -4,313 2,448
41 125
-370 -1,076
-592 -4,313 2,448
41 125
-237 -1,197
-464 -5,832 1,648
42 315
-237 -1,197
-464 -5,832 1,648
42 315
--
-232 -2,754 -2,946
3 504
--
-232 -2,754 -2,946
3 504
--
-217 -3,208 -2,087
3 302
--
-217 -3,208 -2,087
3 302
-237 -1,197
-681 -9,040
-439
45 617
-237 -1,197
-681 -9,040
-439
45 617
27
Net financial debtNet financial debt
1. As of March 31st, 2012
41,12541,125 42,31542,315 3,5043,504 3,3023,302 45,61745,617
Enel SpAInvestor Relations1Q2012 results - Financial annexes
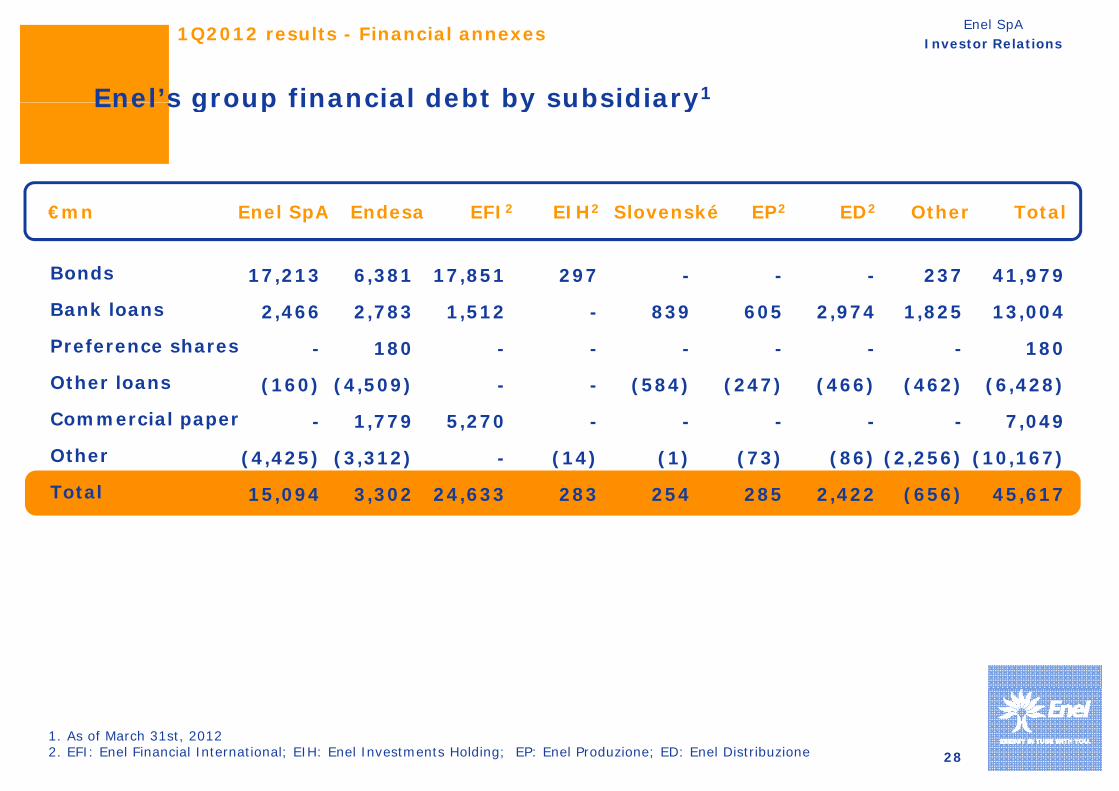
Enel’s group financial debt by subsidiary1Enel s group financial debt by subsidiary
Enel SpA Slovenské€mn EFI2 Other TotalEndesa EIH2 EP2 ED2
Bonds 17,213 41,979237---2976,381 17,851
Bank loans
Preference shares
Other loans
2,466
-
(160)
13,004
180
(6,428)
1,825
-
(462)
2,974
-
(466)
605
-
(247)
839
-
(584)
-
-
-
2,783
180
(4,509)
1,512
-
-
Commercial paper
Other
Total
-
(4,425)
15 094
7,049
(10,167)
45 617
-
(2,256)
(656)
-
(86)
2 422
-
(73)
285
-
(1)
254
-
(14)
283
1,779
(3,312)
3 302
5,270
-
24 633Total 15,094 45,617(656)2,4222852542833,302 24,633
281. As of March 31st, 20122. EFI: Enel Financial International; EIH: Enel Investments Holding; EP: Enel Produzione; ED: Enel Distribuzione
Enel SpAInvestor Relations1Q2012 results - Financial annexes
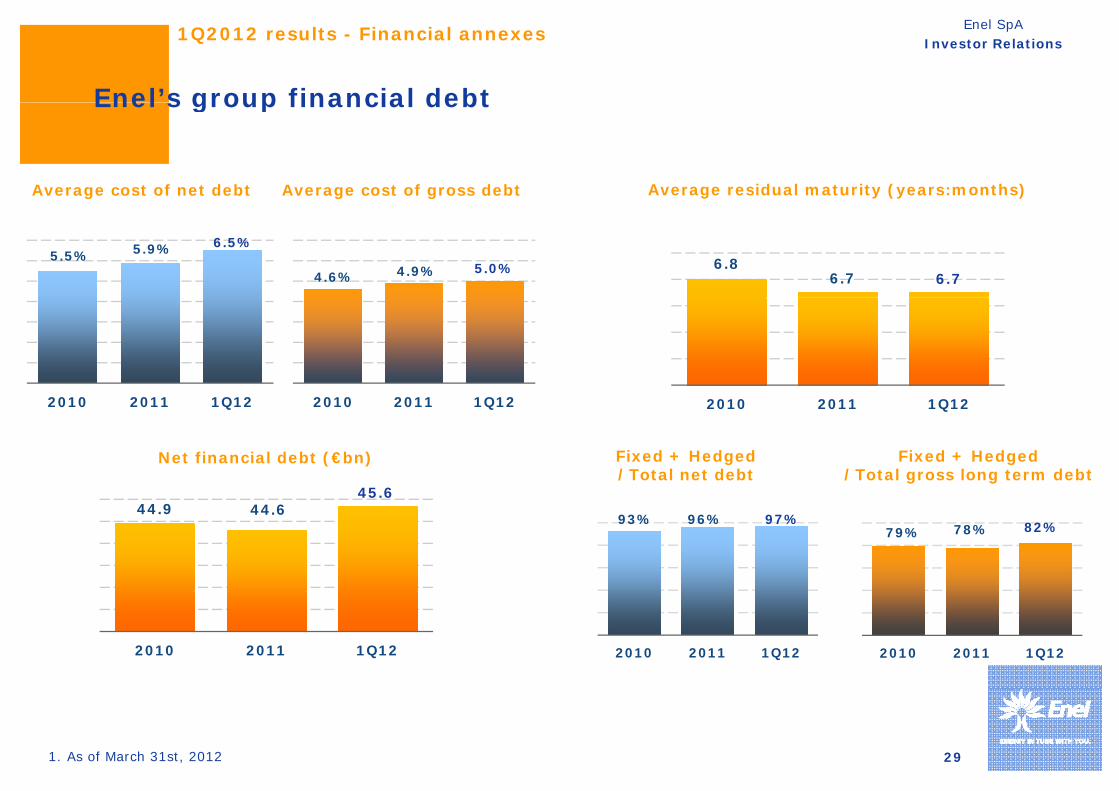
Enel’s group financial debt
Average residual maturity (years:months)
Enel s group financial debt
Average cost of net debt Average cost of gross debt
4.6% 4.9% 5.0%5.5% 5.9% 6.5%
6.86.7 6.7
Net financial debt (€bn)
2010 2011 1Q122010 2011 1Q12
Fixed + Hedged/Total net debt
Fixed + Hedged/Total gross long term debt
45 6
2010 2011 1Q12
93% 96% 97%79% 78% 82%
44.9 44.645.6
2010 2011 1Q12 2010 2011 1Q122010 2011 1Q12
291. As of March 31st, 2012
Enel SpAInvestor Relations1Q2012 results - Financial annexes
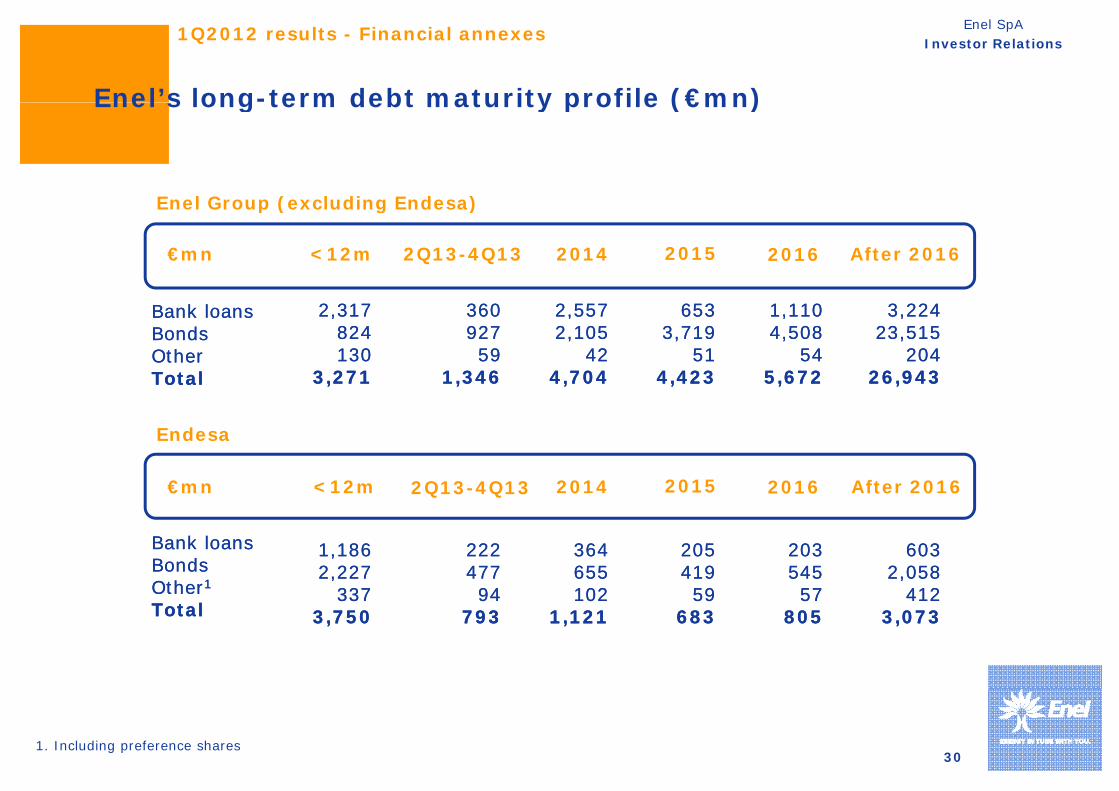
Enel’s long-term debt maturity profile (€mn)
Enel Group (excluding Endesa)
Enel s long term debt maturity profile (€mn)
€mn <12m
Enel Group (excluding Endesa)
2Q13-4Q13 2014 After 20162015 2016
Bank loansBondsOtherTotal
Bank loansBondsOtherTotal
36092759
1,346
36092759
1,346
2,317824130
3,271
2,317824130
3,271
2,5572,105
424,704
2,5572,105
424,704
6533,719
514,423
6533,719
514,423
3,22423,515
20426,943
3,22423,515
20426,943
1,1104,508
545,672
1,1104,508
545,672
€mn <12m
Endesa
2014 After 20162015 20162Q13-4Q13€
Bank loansBondsOther1
Bank loansBondsOther1
0 te 0 62016
22247794
22247794
1,1862,227
337
1,1862,227
337
364655102
364655102
20541959
20541959
6032,058
412
6032,058
412
20354557
20354557
2Q13 4Q13
OtherTotalOtherTotal
94793
94793
3373,750
3373,750
1021,121
1021,121
59683
59683
4123,073
4123,073
57805
57805
301. Including preference shares
Enel SpAInvestor Relations1Q2012 results - Financial annexes
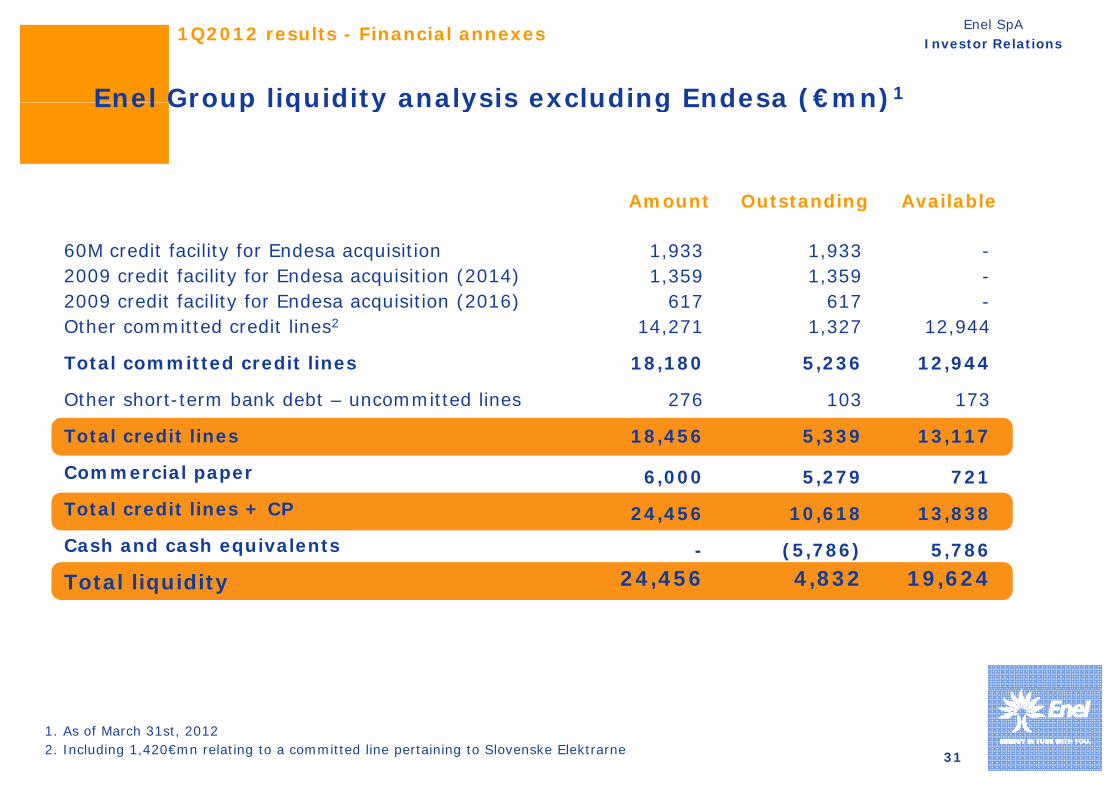
Enel Group liquidity analysis excluding Endesa (€mn)1
Amount AvailableOutstanding
Enel Group liquidity analysis excluding Endesa (€mn)
60M credit facility for Endesa acquisition2009 credit facility for Endesa acquisition (2014)2009 credit facility for Endesa acquisition (2016)
Amount AvailableOutstanding
1,9331,359
617
1,9331,359
617
--
2009 credit facility for Endesa acquisition (2016)Other committed credit lines2
Total committed credit lines
Othe sho t te m bank debt ncommitted lines
61714,271
18,180
276
617 1,327
5,236
103
-12,944
12,944
173Other short-term bank debt – uncommitted lines
Total credit lines
Commercial paper
276
18,456
6,000
103
5,339
5,279
173
13,117
721Total credit lines + CP
Cash and cash equivalents
Total liquidity
24,456
-24,456
10,618
(5,786)4,832
13,838
5,78619,624q y
31
1. As of March 31st, 20122. Including 1,420€mn relating to a committed line pertaining to Slovenske Elektrarne

Enel SpAInvestor Relations1Q2012 results - Financial annexes
Endesa liquidity analysis (€mn)1Endesa liquidity analysis (€mn)
Total committed credit lines
Amount AvailableOutstanding
5,775 280 5,495
Other short-term bank debt – uncommitted lines
Total credit lines
Commercial paper issued by the Endesa Group
,
1,448
7,223
3 300
17
297
1 781
,
1,431
6,926
1 518Commercial paper issued by the Endesa Group
Total credit lines + CP
Cash and cash equivalents
3,300
10,522
-
1,781
2,078
(3,208)
1,518
8,444
3,208
Total liquidity 1,522 (1,130) 11,652
321. As of March 31st, 2012

Enel SpAInvestor Relations1Q2012 results - Financial annexes
Capex by business area (€mn)1
+16.1%
Capex by business area (€mn)
75
+16.1%
1 132
1,314
4
51,132
275204
Other2
EGP
417356
262Iberia & Latam
MarketI&N
G&EM
International
EGP
238 309
229262
39 341 3
1Q11 1Q12
G&EM
33
1. Continuing operations, gross of connection fees2. Including Services & Holding, Engineering & Innovation, upstream gas and nuclear activities
Enel SpAInvestor Relations1Q2012 results - Financial annexes
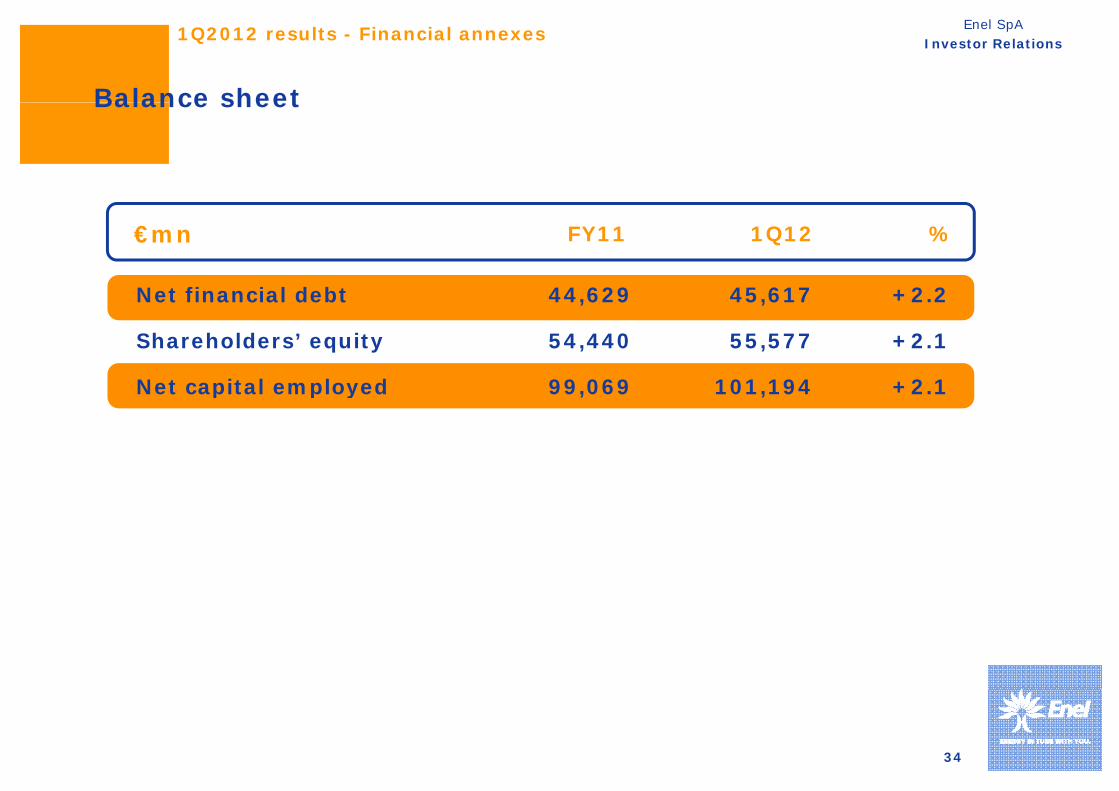
Balance sheetBalance sheet
FY11 1Q12 %€mn
44 629 45 617 +2 2Net financial debt 44,629
54,440
99,069
45,617
55,577
101,194
+2.2
+2.1
+2.1
Net financial debt
Shareholders’ equity
Net capital employed , ,p p y
34
Enel SpAInvestor Relations1Q2012 results - Financial annexes
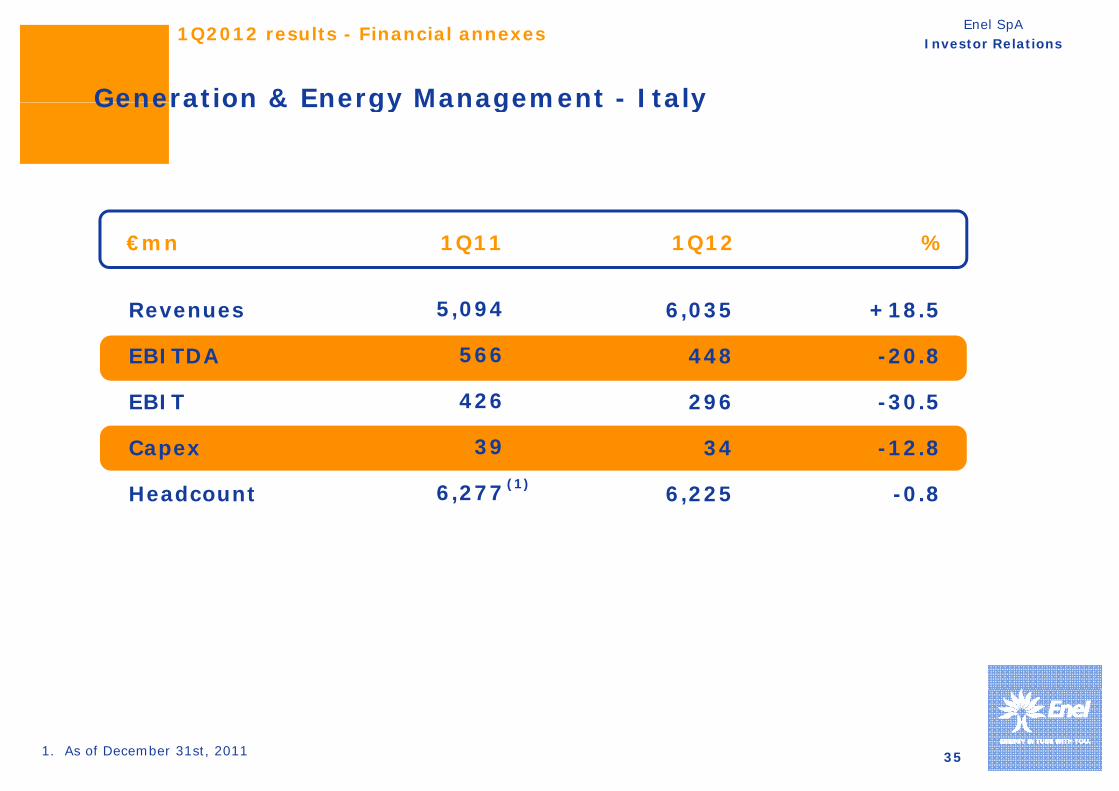
Generation & Energy Management - ItalyGeneration & Energy Management Italy
%€mn 1Q121Q11
Revenues
EBITDA
EBIT
+18.5
-20.8
30 5
6,035
448
296
5,094
566
426EBIT
Capex
Headcount
-30.5
-12.8
-0 8
296
34
6 225
426
39
6 277(1)Headcount -0.86,2256,277
351. As of December 31st, 2011
Enel SpAInvestor Relations1Q2012 results - Financial annexes
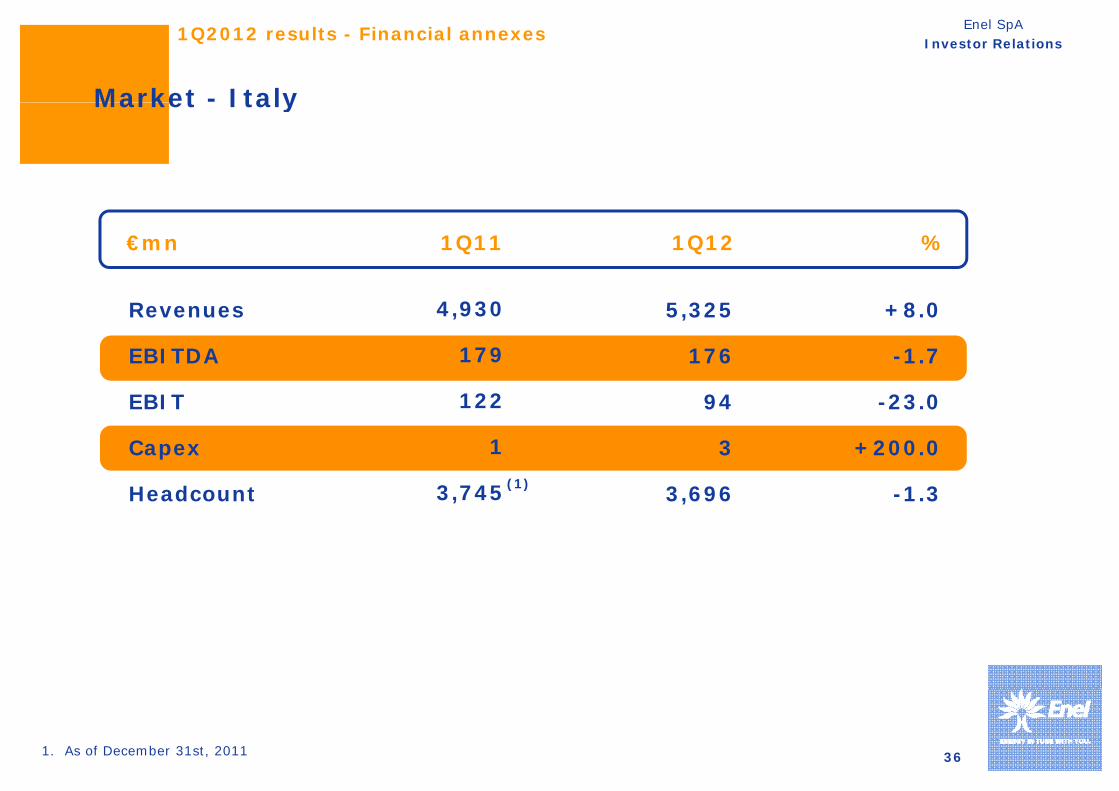
Market - ItalyMarket Italy
%€mn 1Q121Q11
Revenues
EBITDA
EBIT
+8.0
-1.7
23 0
5,325
176
94
4,930
179
122EBIT
Capex
Headcount
-23.0
+200.0
-1 3
94
3
3 696
122
1
3 745(1)Headcount -1.33,6963,745
361. As of December 31st, 2011
Enel SpAInvestor Relations1Q2012 results - Financial annexes
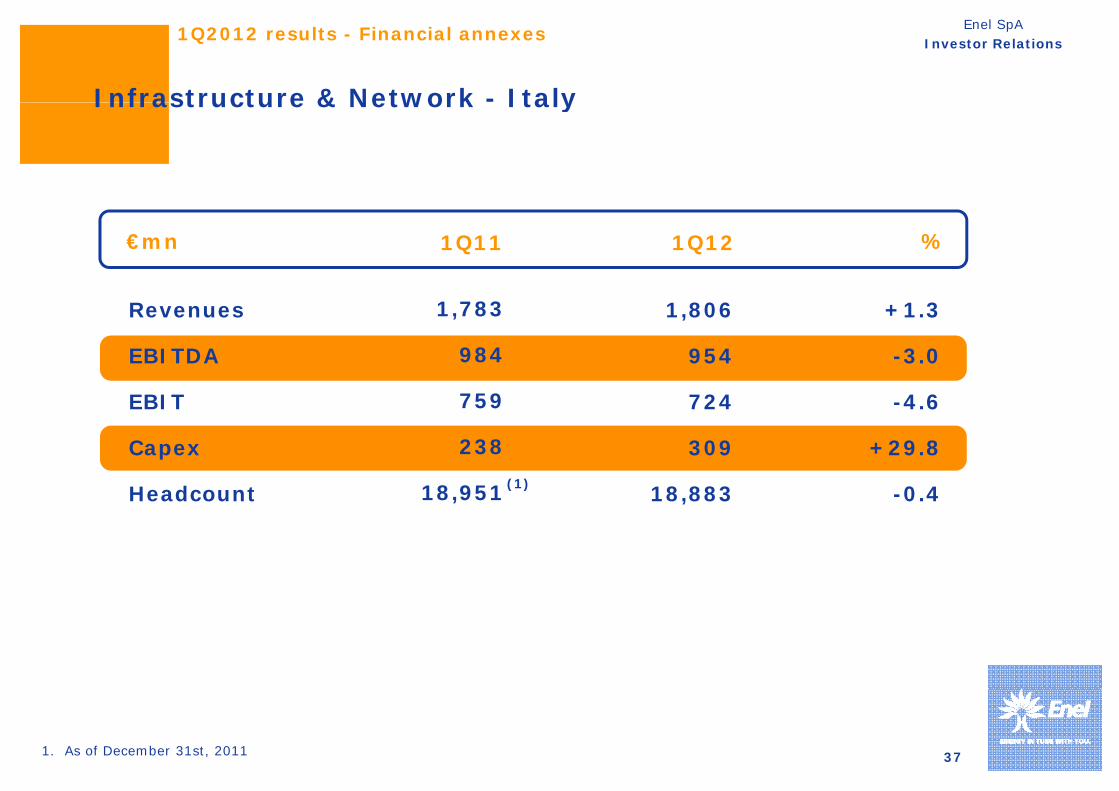
Infrastructure & Network - ItalyInfrastructure & Network Italy
%€mn 1Q121Q11
Revenues
EBITDA
EBIT
+1.3
-3.0
4 6
1,806
954
724
1,783
984
759EBIT
Capex
Headcount
-4.6
+29.8
-0 4
724
309
18 883
759
238
18 951(1)Headcount -0.418,88318,951
371. As of December 31st, 2011

Enel SpAInvestor Relations1Q2012 results - Financial annexes
InternationalInternational
%€mn 1Q121Q11
Revenues
EBITDA
EBIT
+13.6
-5.8
+13 9
2,300
423
335
2,025
449
294EBIT
Capex
Headcount
+13.9
+14.4
-0 8
335
262
13 673
294
229
13 779(1)Headcount -0.813,67313,779
381. As of December 31st, 2011

Enel SpAInvestor Relations1Q2012 results - Financial annexes
Iberia & LatamIberia & Latam
%€mn 1Q121Q11
Revenues
EBITDA
EBIT
+4.9
+3.4
+1 7
8,491
1,881
1 172
8,097
1,820
1 152EBIT
Capex
Headcount
+1.7
-14.6
+0 5
1,172
356
22 985
1,152
417
22 877(1)Headcount +0.522,98522,877
391. As of December 31st, 2011
Enel SpAInvestor Relations1Q2012 results - Financial annexes
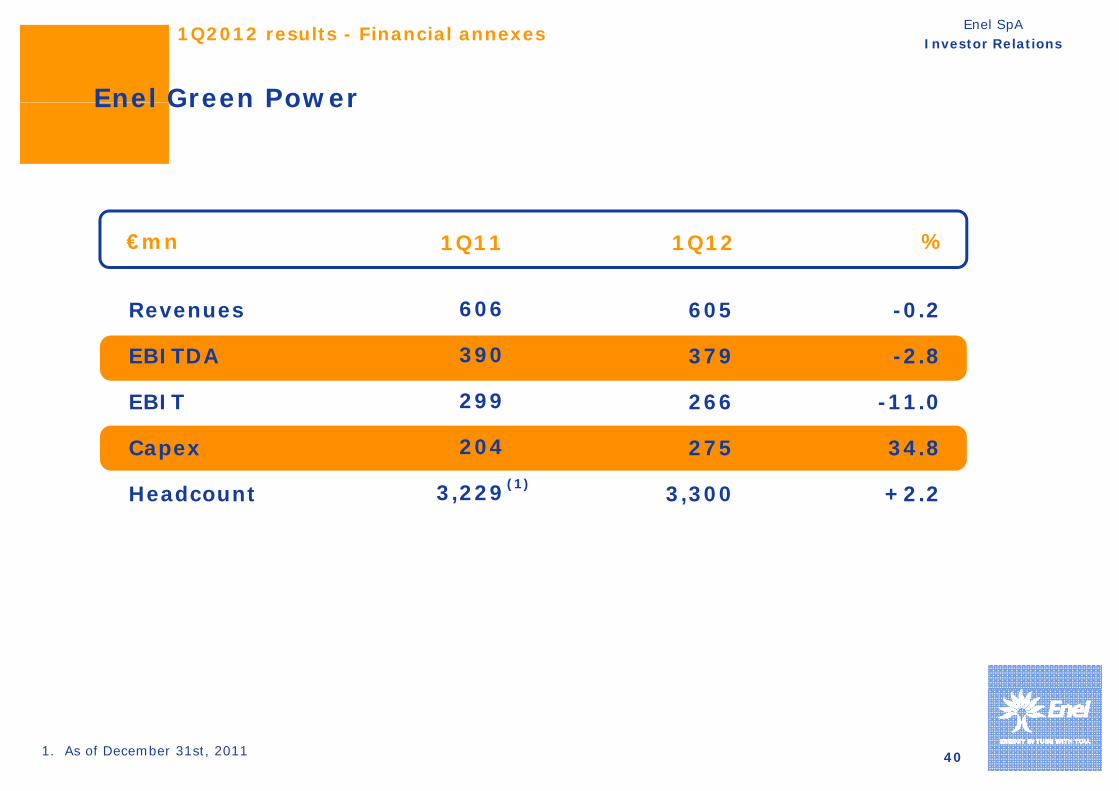
Enel Green PowerEnel Green Power
%€mn 1Q121Q11
Revenues
EBITDA
EBIT
-0.2
-2.8
11 0
605
379
266
606
390
299EBIT
Capex
Headcount
-11.0
34.8
+2 2
266
275
3 300
299
204
3 229(1)Headcount +2.23,3003,229
401. As of December 31st, 2011
Enel SpAInvestor Relations1Q2012 results - Financial annexes
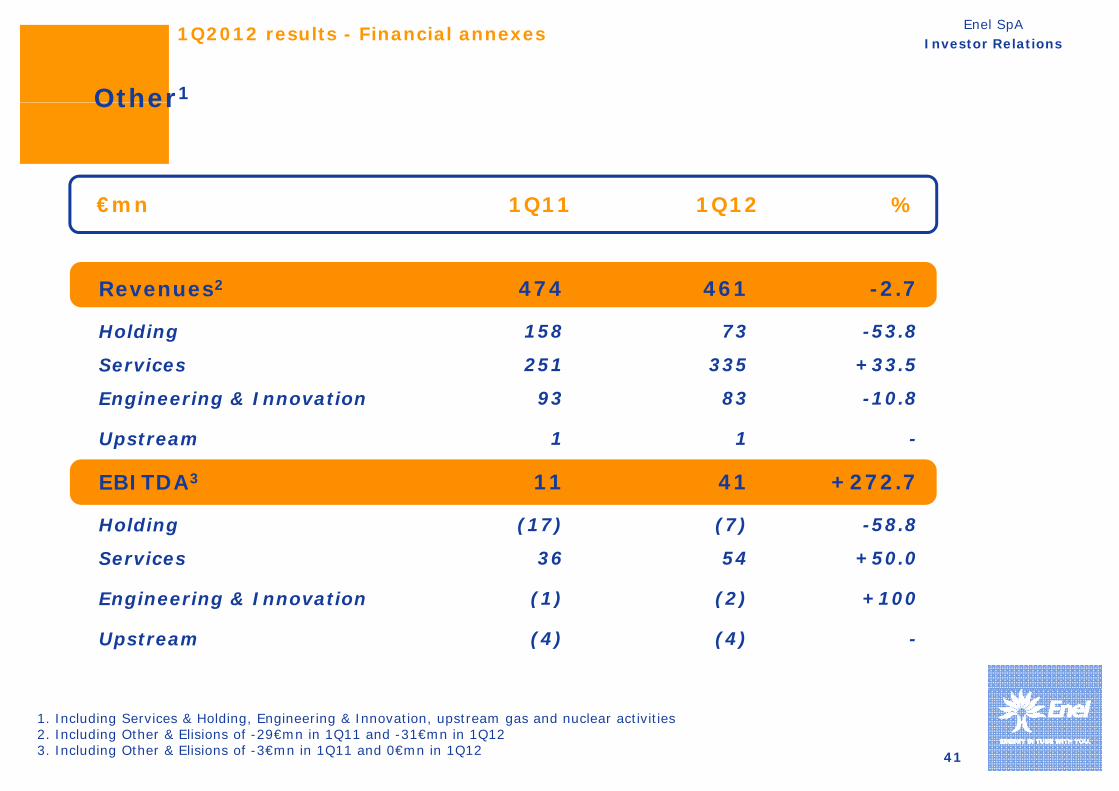
Other1
1Q12 %€mn 1Q11
Other
1Q12 %€mn
Revenues2
1Q11
474 461 -2.7
Holding
Services
Engineering & Innovation
158
251
93
73
335
83
-53.8
+33.5
10 8Engineering & Innovation
Upstream
EBITDA3
93
1
11
83
1
41
-10.8
-
+272.7
Holding
Services
i i i
(17)
36
( )
(7)
54
(2)
-58.8
+50.0
00Engineering & Innovation
Upstream
(1)
(4)
(2)
(4)
+100
-
41
1. Including Services & Holding, Engineering & Innovation, upstream gas and nuclear activities2. Including Other & Elisions of -29€mn in 1Q11 and -31€mn in 1Q123. Including Other & Elisions of -3€mn in 1Q11 and 0€mn in 1Q12

Enel SpAInvestor Relations1Q2012 results - Financial annexes
Other1 - Continued
1Q12 %€ 1Q11
Other Continued
EBIT2
H ldi
1Q12 %€mn 1Q11
(16)
(19)
15
(9)
n.m.
52 6HoldingServices & otherEngineering & InnovationUpstream
(19)12
(2)(4)
(9)32
(3)(5)
-52.6+166.7
+50.0+25.0
Capex
HoldingServices & other
4
13
75
010
+1,775
n.m.+233.3
Engineering & InnovationUpstream
Headcount
00
6,502
065
6,486
-n.m.
-0.2(3)
HoldingServices & otherEngineering & InnovationUpstream
8734,2451,327
57
8634,2571,307
59
-1.1+0.3-1.5
+3.5
42
p
1. Including Services & Holding, Engineering & Innovation, upstream gas and nuclear activities2. Including Other & Elisions of -3€mn in 1Q11 and 0€mn in 1Q123. As of December 31st, 2011

Enel SpAInvestor Relations1Q2012 results - Financial annexes
EBIT by business area (€mn)
-4.4%
EBIT by business area (€mn)
3,0362,902
Oth 1
-11.0%299 15
,
1,152
266
Iberia & Latam
Other1
International
EGP
+13 9%
+1.7%
,
1,172
294335
MarketI&N
G&EM
+13.9%
-4.6%
122
759724
335
1Q11 1Q12
-23.0%-30.5%
12294
426 296
-16
431. Including Services & Holding, Engineering & Innovation, upstream gas and nuclear activities
Enel SpAInvestor Relations
DisclaimerDisclaimer
This presentation may contain certain statements that are neither reported financial results nor other historical information (“forward-looking statements”). These forward-looking statements are based on Enel S.p.A.’scurrent expectations and projections about future events. Because these current expectations and projections about future events. Because these forward-looking statements are subject to risks and uncertainties, actual future results may differ materially from those expressed in or implied by these statements due to any number of different factors, many of which are beyond the ability of Enel S p A to control or estimate precisely including changes in the ability of Enel S.p.A. to control or estimate precisely, including changes in the regulatory environment, future market developments, fluctuations in the price and availability of fuel and other risks. You are cautioned not to place undue reliance on the forward-looking statements contained herein, which are
d l f th d t f thi t ti E l S A d t d t k made only as of the date of this presentation. Enel S.p.A. does not undertake any obligation to publicly release any revisions to any forward-looking statements to reflect events or circumstances after the date of this presentation.
P s ant to a t 154 BIS pa 2 of the Unified Financial Act of Feb a 24 Pursuant to art. 154-BIS, par. 2, of the Unified Financial Act of February 24, 1998, the executive in charge of preparing the corporate accounting documents at Enel, Luigi Ferraris, declares that the accounting information contained herein correspond to document results, books and accounting records.
44

Enel SpAInvestor Relations
Contact usContact us
Investor Relations Team (investor relations@enel com)Investor Relations Team ([email protected])
• Luca Torchia (Head of IR) +39 06 8305 3437+39 06 8305 3437
• Pedro Cañamero (Equity IR)
• Elisabetta Ghezzi (Fixed income IR)
+39 06 8305 5292
+39 06 8305 2708
+39 06 8305 5292
+39 06 8305 2708
• Matteo Cavadini (Staff) +39 06 8305 2326+39 06 8305 2326
• Marco Donati (Staff)
• Federica Dori (Staff)
+39 06 8305 9252
+39 06 8305 7975
+39 06 8305 9252
+39 06 8305 7975
Visit our website at:Visit our website at:
• Federica Todaro (Staff) +39 06 8305 9502+39 06 8305 9502
45
www.enel.com (Investor Relations)www.enel.com (Investor Relations)