Wisconsin Air Quality Trends 2013
Wisconsin Department of Natural Resources
Wisconsin Air Quality Trends
April 2013
Wisconsin Air Quality Trends 2013
Disclaimer
Although the data found using the Department's access systems have been produced and processed from sources believed to be reliable, no warranty, expressed or implied, is made regarding accuracy, adequacy, completeness, legality, reliability or usefulness of any information. This disclaimer applies to both isolated and aggregate uses of the information. The Department provides this information on an as is basis. All warranties of any kind, express or implied, including but not limited to the implied warranties of merchantability, fitness for a particular purpose, freedom from contamination by computer viruses and non-infringement of proprietary rights are disclaimed. Changes may be periodically made to the information herein; these changes may or may not be incorporated in any new version of the publication. If you have obtained information from the Department from a source other than the Department, be aware that electronic data can be altered subsequent to original distribution. Data can also quickly become out-of-date. It is recommended that careful attention be paid to the contents of any data associated with a file, and that the originator of the data or information be contacted with any questions regarding appropriate use. If you find any errors or omissions, we encourage you to report them to the Department (http://dnr.wi.gov/feedback/).
Wisconsin Department of Natural Resources Bureau of Air Management Box 7921- AM/7 Madison, WI 53707 Phone 608-266-7718 Fax 608-267-0560 The Wisconsin Department of Natural Resources provides equal opportunity in employment, programs, services and functions under an Affirmative Action Plan. If you have any questions, please write to Equal Opportunity Office, Department of Interior, Washington, DC 20240. This publication is available in alternative format (large print, Braille, audio tape, etc.) upon request. Please contact the Bureau of Air Management, phone 608-266-7718, for more information. Publication AM-517 2013

2013 Wisconsin Air Monitoring Network Plan
3
Acronyms and Abbreviations
AQI: Air Quality Index
BAM/AM: Bureau of Air Management
CAA: Clean Air Act
CASAC: Clean Air Scientific Advisory Committee
CBSA: County Based Statistical Area
EOM: Enhanced Ozone Monitoring
FEM: Federal Alternate Method
FRM: Federal Reference Method
NAAQS: National Ambient Air Quality Standards
O3: Ozone
NOx: Oxides of nitrogen
PAMS: Photochemical Assessment Monitoring Site
PM2.5: Particulate Matter 2.5 micron or smaller in size
PPB: Parts Per Billion
SLAMS: State and Local Air Monitoring Sites
US EPA: United States Environmental Protection Agency
VOC: Volatile Organic Compound
WDNR: Wisconsin Department of Natural Resources
Wisconsin Air Quality Trends 2013
4
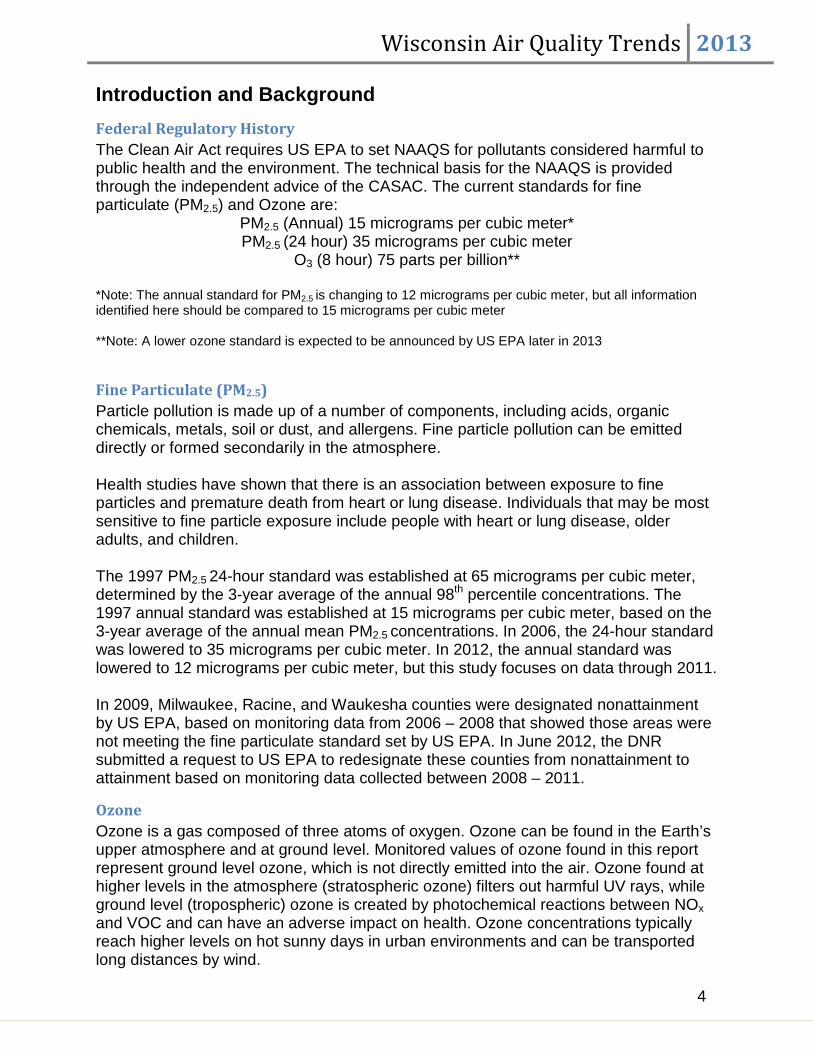
Introduction and Background Federal Regulatory History The Clean Air Act requires US EPA to set NAAQS for pollutants considered harmful to public health and the environment. The technical basis for the NAAQS is provided through the independent advice of the CASAC. The current standards for fine particulate (PM2.5) and Ozone are:
PM2.5 (Annual) 15 micrograms per cubic meter* PM2.5 (24 hour) 35 micrograms per cubic meter
O3 (8 hour) 75 parts per billion** *Note: The annual standard for PM2.5 is changing to 12 micrograms per cubic meter, but all information identified here should be compared to 15 micrograms per cubic meter **Note: A lower ozone standard is expected to be announced by US EPA later in 2013
Fine Particulate (PM2.5) Particle pollution is made up of a number of components, including acids, organic chemicals, metals, soil or dust, and allergens. Fine particle pollution can be emitted directly or formed secondarily in the atmosphere. Health studies have shown that there is an association between exposure to fine particles and premature death from heart or lung disease. Individuals that may be most sensitive to fine particle exposure include people with heart or lung disease, older adults, and children. The 1997 PM2.5 24-hour standard was established at 65 micrograms per cubic meter, determined by the 3-year average of the annual 98th percentile concentrations. The 1997 annual standard was established at 15 micrograms per cubic meter, based on the 3-year average of the annual mean PM2.5 concentrations. In 2006, the 24-hour standard was lowered to 35 micrograms per cubic meter. In 2012, the annual standard was lowered to 12 micrograms per cubic meter, but this study focuses on data through 2011. In 2009, Milwaukee, Racine, and Waukesha counties were designated nonattainment by US EPA, based on monitoring data from 2006 – 2008 that showed those areas were not meeting the fine particulate standard set by US EPA. In June 2012, the DNR submitted a request to US EPA to redesignate these counties from nonattainment to attainment based on monitoring data collected between 2008 – 2011.
Ozone Ozone is a gas composed of three atoms of oxygen. Ozone can be found in the Earth’s upper atmosphere and at ground level. Monitored values of ozone found in this report represent ground level ozone, which is not directly emitted into the air. Ozone found at higher levels in the atmosphere (stratospheric ozone) filters out harmful UV rays, while ground level (tropospheric) ozone is created by photochemical reactions between NOx and VOC and can have an adverse impact on health. Ozone concentrations typically reach higher levels on hot sunny days in urban environments and can be transported long distances by wind.

Wisconsin Air Quality Trends 2013
5
Breathing ozone has been shown to be harmful to health and can cause problems like chest pain, coughing, throat irritation, and congestion. Children are at the greatest risk from exposure to ozone because their lungs are still developing. Ozone has also been shown to affect vegetation and ecosystems. In July 1997, US EPA announced an 8-hour ozone standard of 84 ppb, replacing the 1-hour standard to protect the public against longer term exposure. In March 2008, the 8 – hour standard was lowered to 75 ppb. The 8-hour standard is met when the three year average of the annual fourth highest daily maximum 8 – hour O3 concentration measured at a monitoring site is equal to or less than 75 ppb.
Report Summary WDNR monitors for many compounds including coarse particulate matter, nitrogen oxides, sulfur dioxide, carbon monoxide, lead, and toxics. The focus for this report is fine particulate (PM2.5) and ozone because they are important health concerns, for which WDNR issues advisories. In the future, WDNR will expand on this report to display trends for other monitored compounds.
The trends in this report plotted along with the appropriate National Ambient Air Quality Standard (NAAQS) generally show that air quality has improved over the time period (2002-2011). There are counties that show trends of concern, and the WDNR is committed to improving air quality in those areas.
Annual differences in meteorological conditions can lead to variability in measured concentrations. The summer of 2012 was very hot with weather conditions that were conducive to the formation of ozone around Wisconsin. The WDNR will update trend charts within this report as data for 2012 reaches certification completion. It is important to note that annual data is important to consider, but long term trends in air quality are what help guide decisions about management of air quality issues.
The fine particulate information presented in this report is measured at WDNR Federal Reference Method monitoring sites, which operate on a daily, every third day, or every sixth day basis. WDNR also operates a network of continuously operating monitors, which are the basis for real-time health advisories.
For the 2008 8-hour ozone standard, Sheboygan County and a portion of Kenosha County (mainly east of I-94) are considered nonattainment.

Wisconsin Air Quality Trends 2013
6
Ozone Network Map
PM2.5 Continuous and Filter Based (FRM) Network Map
Wisconsin Air Quality Trends 2013
7
Air Quality by County
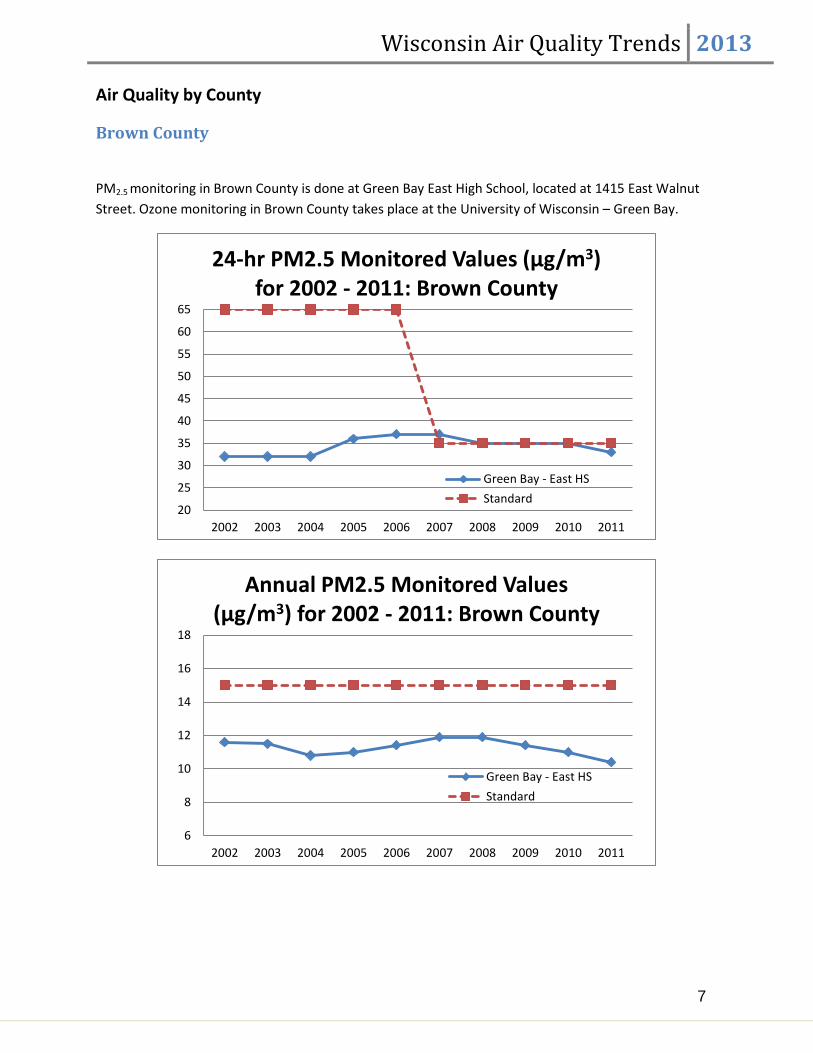
Brown County
PM2.5 monitoring in Brown County is done at Green Bay East High School, located at 1415 East Walnut Street. Ozone monitoring in Brown County takes place at the University of Wisconsin – Green Bay.
20
25
30
35
40
45
50
55
60
65
2002 2003 2004 2005 2006 2007 2008 2009 2010 2011
24-hr PM2.5 Monitored Values (µg/m3) for 2002 - 2011: Brown County
Green Bay - East HSStandard
6
8
10
12
14
16
18
2002 2003 2004 2005 2006 2007 2008 2009 2010 2011
Annual PM2.5 Monitored Values (µg/m3) for 2002 - 2011: Brown County
Green Bay - East HSStandard

Wisconsin Air Quality Trends 2013
8
Columbia County
Ozone monitoring in Columbia County is done at a rural location on Wendt Road in Columbus Township. The ozone monitor serves as the downwind ozone instrument in the Madison CBSA.
556065707580859095
100105
2002 2003 2004 2005 2006 2007 2008 2009 2010 2011
8-hr Ozone Monitored Values (ppb) for 2002 - 2011: Brown County
UW-Green BayStandard
556065707580859095
100105
2002 2003 2004 2005 2006 2007 2008 2009 2010 2011
8-hr Ozone Monitored Values (ppb) for 2002 - 2011: Columbia County
ColumbusStandard

Wisconsin Air Quality Trends 2013
9
Dane County
PM2.5 monitoring in Dane County is currently done at Madison East High School and Madison – University Avenue, but East High School PM2.5 monitoring did not begin until 2010 and therefore is not shown in this report. The Madison East site is located at 2302 North Hoard Street, next to the Madison East High School Sports Field. The University Avenue site is at 2757 University Avenue. Ozone monitoring is done at Madison East High School.
20
25
30
35
40
45
50
55
60
65
2002 2003 2004 2005 2006 2007 2008 2009 2010 2011
24-hr PM2.5 Monitored Values (µg/m3) for 2002 - 2011: Dane County
Madison-Univ. Ave.Standard
6
8
10
12
14
16
18
2002 2003 2004 2005 2006 2007 2008 2009 2010 2011
Annual PM2.5 Monitored Values (µg/m3) for 2002 - 2011: Dane County
Madison-Univ. Ave.Standard
Wisconsin Air Quality Trends 2013
10
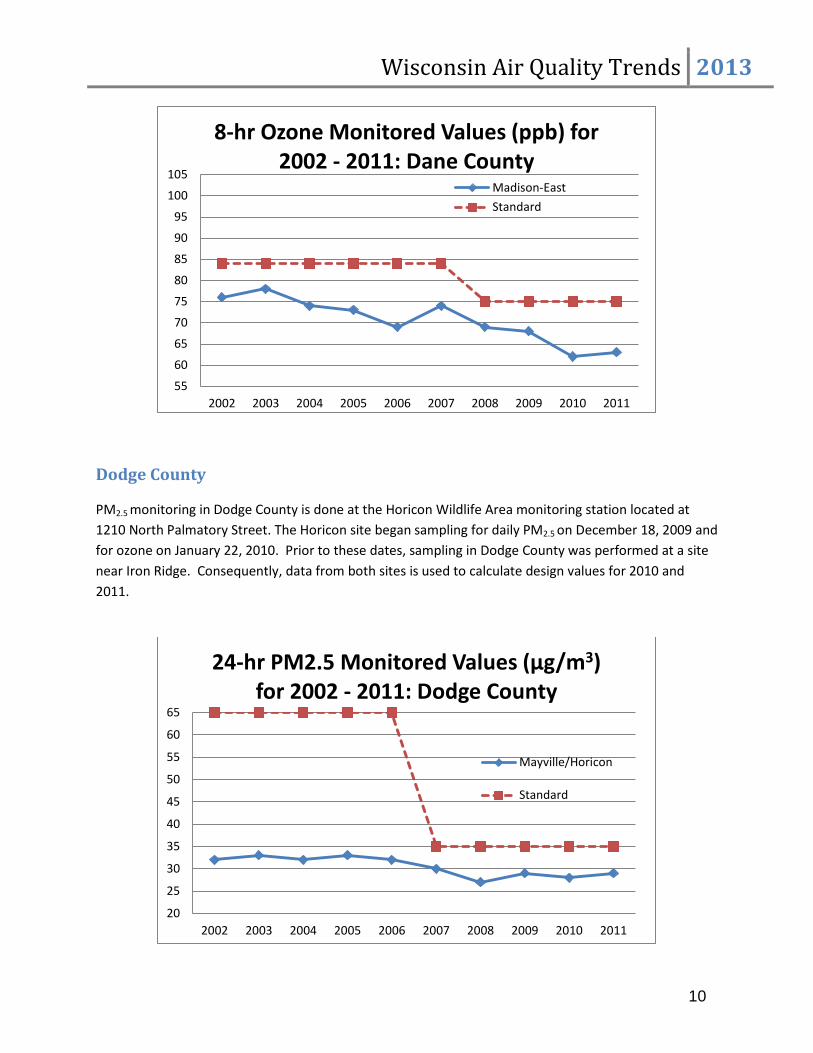
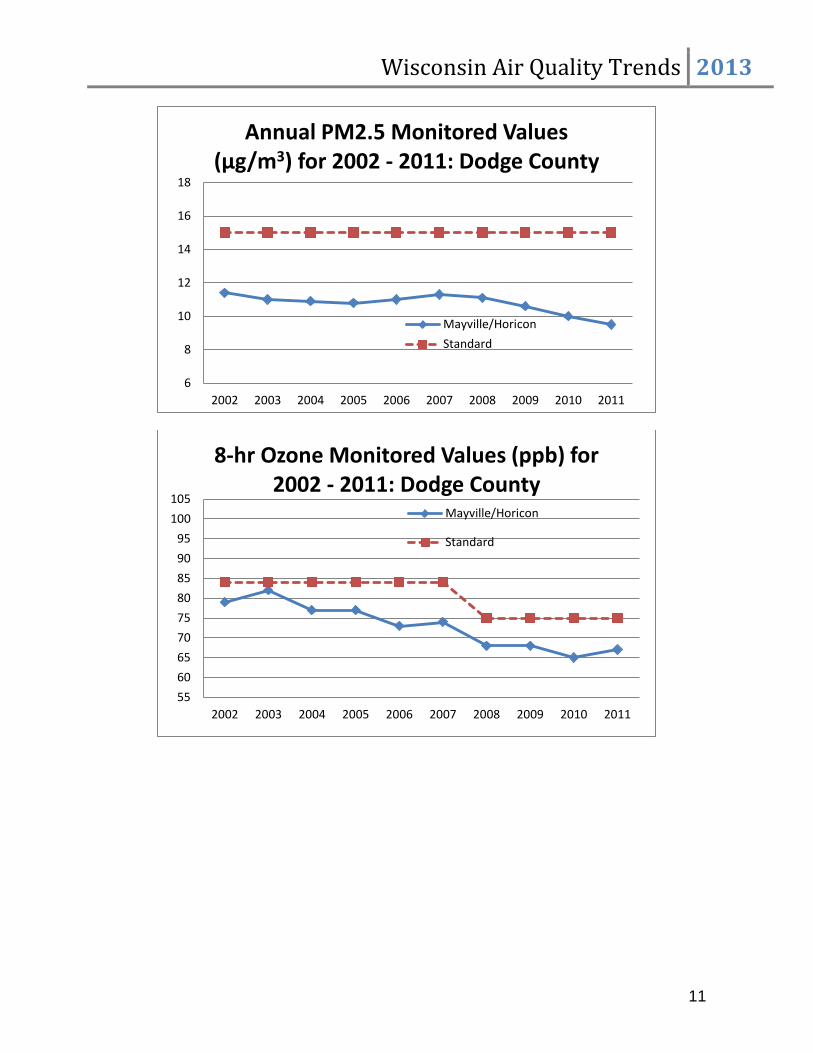
Dodge County
PM2.5 monitoring in Dodge County is done at the Horicon Wildlife Area monitoring station located at 1210 North Palmatory Street. The Horicon site began sampling for daily PM2.5 on December 18, 2009 and for ozone on January 22, 2010. Prior to these dates, sampling in Dodge County was performed at a site near Iron Ridge. Consequently, data from both sites is used to calculate design values for 2010 and 2011.
55
60
65
70
75
80
85
90
95
100
105
2002 2003 2004 2005 2006 2007 2008 2009 2010 2011
8-hr Ozone Monitored Values (ppb) for 2002 - 2011: Dane County
Madison-EastStandard
20
25
30
35
40
45
50
55
60
65
2002 2003 2004 2005 2006 2007 2008 2009 2010 2011
24-hr PM2.5 Monitored Values (µg/m3) for 2002 - 2011: Dodge County
Mayville/Horicon
Standard
Wisconsin Air Quality Trends 2013
11
6
8
10
12
14
16
18
2002 2003 2004 2005 2006 2007 2008 2009 2010 2011
Annual PM2.5 Monitored Values (µg/m3) for 2002 - 2011: Dodge County
Mayville/HoriconStandard
556065707580859095
100105
2002 2003 2004 2005 2006 2007 2008 2009 2010 2011
8-hr Ozone Monitored Values (ppb) for 2002 - 2011: Dodge County
Mayville/Horicon
Standard

Wisconsin Air Quality Trends 2013
12
Door County
Ozone monitoring in Door County is done at Newport State Park at 475 County Trunk HIghway NP in Ellison Bay. The monitor site is inside the state park.
55
60
65
70
75
80
85
90
95
100
105
2002 2003 2004 2005 2006 2007 2008 2009 2010 2011
8-hr Ozone Monitored Values (ppb) for 2002 - 2011: Door County
NewportStandard

Wisconsin Air Quality Trends 2013
13
Fond du Lac County
Ozone monitoring in Fond du Lac County is done at N3996 Kelly Road in the Town of Byron. The site is located at the edge of a farm field.
556065707580859095
100105
2002 2003 2004 2005 2006 2007 2008 2009 2010 2011
8-hr Ozone Monitored Values (ppb) for 2002 - 2011: Fond du Lac County
Fond du LacStandard
Wisconsin Air Quality Trends 2013
14
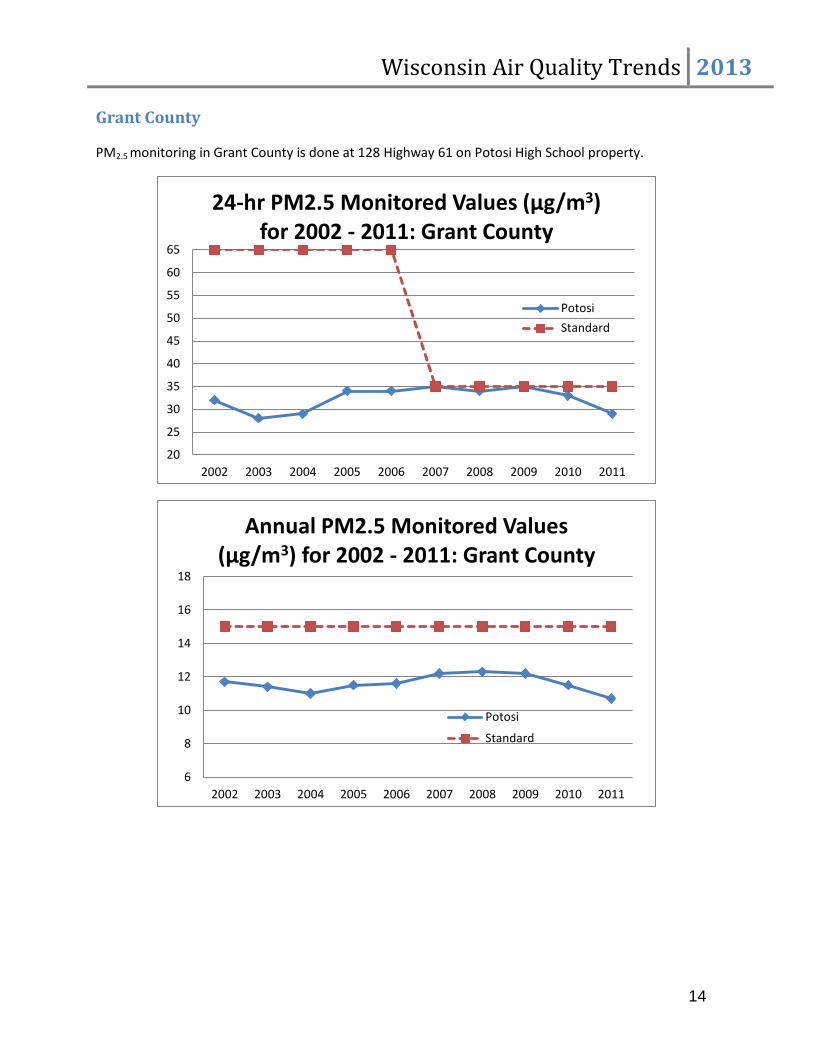
Grant County
PM2.5 monitoring in Grant County is done at 128 Highway 61 on Potosi High School property.
20
25
30
35
40
45
50
55
60
65
2002 2003 2004 2005 2006 2007 2008 2009 2010 2011
24-hr PM2.5 Monitored Values (µg/m3) for 2002 - 2011: Grant County
PotosiStandard
6
8
10
12
14
16
18
2002 2003 2004 2005 2006 2007 2008 2009 2010 2011
Annual PM2.5 Monitored Values (µg/m3) for 2002 - 2011: Grant County
Potosi
Standard

Wisconsin Air Quality Trends 2013
15
Kenosha County
PM2.5 and ozone monitoring for Kenosha County is done at 11838 First Court in the Chiwaukee Prairie, which is a rural area near the Wisconsin – Illinois border.
20
25
30
35
40
45
50
55
60
65
2002 2003 2004 2005 2006 2007 2008 2009 2010 2011
24-hr PM2.5 Monitored Values (µg/m3) for 2002 - 2011: Kenosha County
Chiwaukee
Standard
6
8
10
12
14
16
18
2002 2003 2004 2005 2006 2007 2008 2009 2010 2011
Annual PM2.5 Monitored Values (µg/m3) for 2002 - 2011: Kenosha
County
Chiwaukee
Standard

Wisconsin Air Quality Trends 2013
16
Kewaunee County
Ozone monitoring in Kewaunee County is done at Rural Route #1, Highway 42 on a bluff over Lake Michigan.
55
60
65
70
75
80
85
90
95
100
105
2002 2003 2004 2005 2006 2007 2008 2009 2010 2011
8-hr Ozone Monitored Values (ppb) for 2002 - 2011: Kenosha County
ChiwaukeeStandard
556065707580859095
100105
2002 2003 2004 2005 2006 2007 2008 2009 2010 2011
8-hr Ozone Monitored Values (ppb) for 2002 - 2011: Kewaunee County
Kewaunee
Standard
Wisconsin Air Quality Trends 2013
17
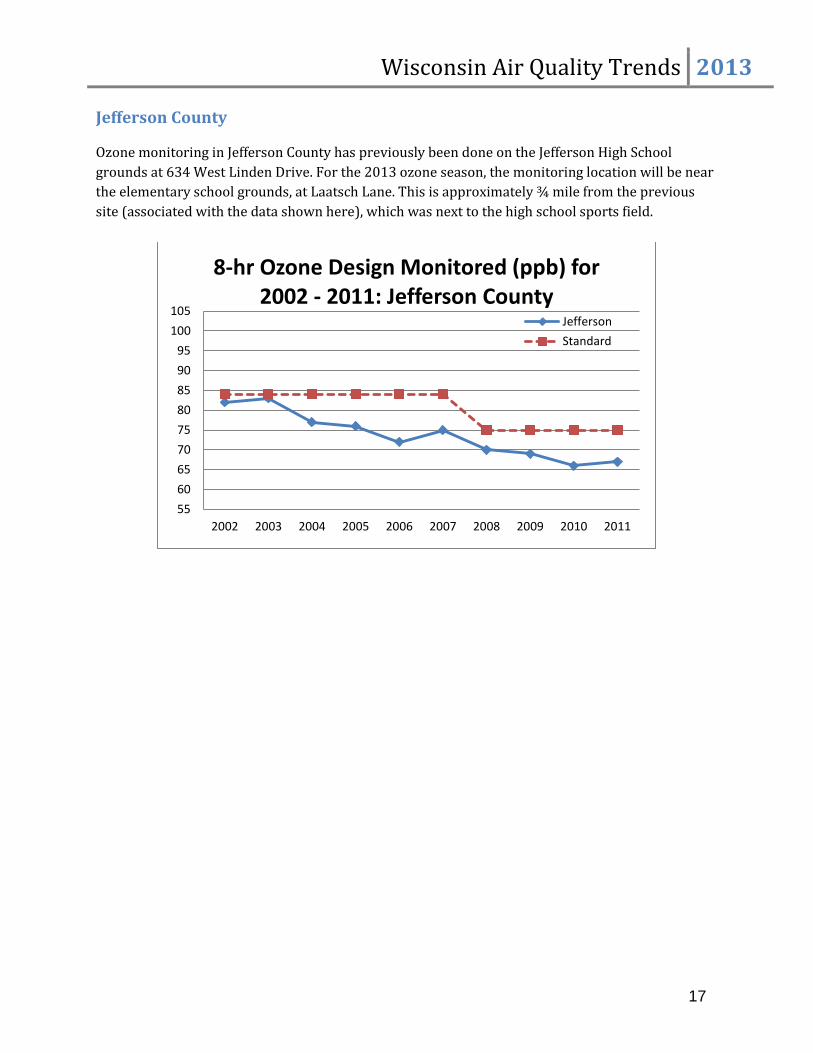
Jefferson County
Ozone monitoring in Jefferson County has previously been done on the Jefferson High School grounds at 634 West Linden Drive. For the 2013 ozone season, the monitoring location will be near the elementary school grounds, at Laatsch Lane. This is approximately ¾ mile from the previous site (associated with the data shown here), which was next to the high school sports field.
556065707580859095
100105
2002 2003 2004 2005 2006 2007 2008 2009 2010 2011
8-hr Ozone Design Monitored (ppb) for 2002 - 2011: Jefferson County
JeffersonStandard

Wisconsin Air Quality Trends 2013
18
La Crosse County
PM2.5 and ozone monitoring for La Crosse County are done at the Department of Transportation office located at 3350 Mormon Coulee Road in La Crosse.
20
25
30
35
40
45
50
55
60
65
2005 2006 2007 2008 2009 2010 2011
24-hr PM2.5 Monitored Values (µg/m3) for 2005 - 2011: La Crosse County
La Crosse
Standard
6
8
10
12
14
16
18
20
2005 2006 2007 2008 2009 2010 2011
Annual PM2.5 Monitored Values (µg/m3) for 2005 - 2011: La Crosse
County
La Crosse
Standard

Wisconsin Air Quality Trends 2013
19
Manitowoc County
Ozone monitoring for Manitowoc County is done at 2315 Goodwin Road in Two Rivers at the Woodland Dunes Nature Center and Preserve.
556065707580859095
100105
2010 2011
8-hr Ozone Monitored Values (ppb) for 2010 - 2011: La Crosse County
La CrosseStandard
556065707580859095
100105
2002 2003 2004 2005 2006 2007 2008 2009 2010 2011
8-hr Ozone Monitored Values (ppb) for 2002 - 2011: Manitowoc County
Manitowoc
Standard

Wisconsin Air Quality Trends 2013
20
Marathon County
Ozone monitoring in Marathon County is done at 1780 Bergen Road near Lake Dubay, in Bergen Township.
556065707580859095
100105
2002 2003 2004 2005 2006 2007 2008 2009 2010 2011
8-hr Ozone Monitored Values (ppb) for 2002 - 2011: Marathon County
Lake DuBayStandard
Wisconsin Air Quality Trends 2013
21
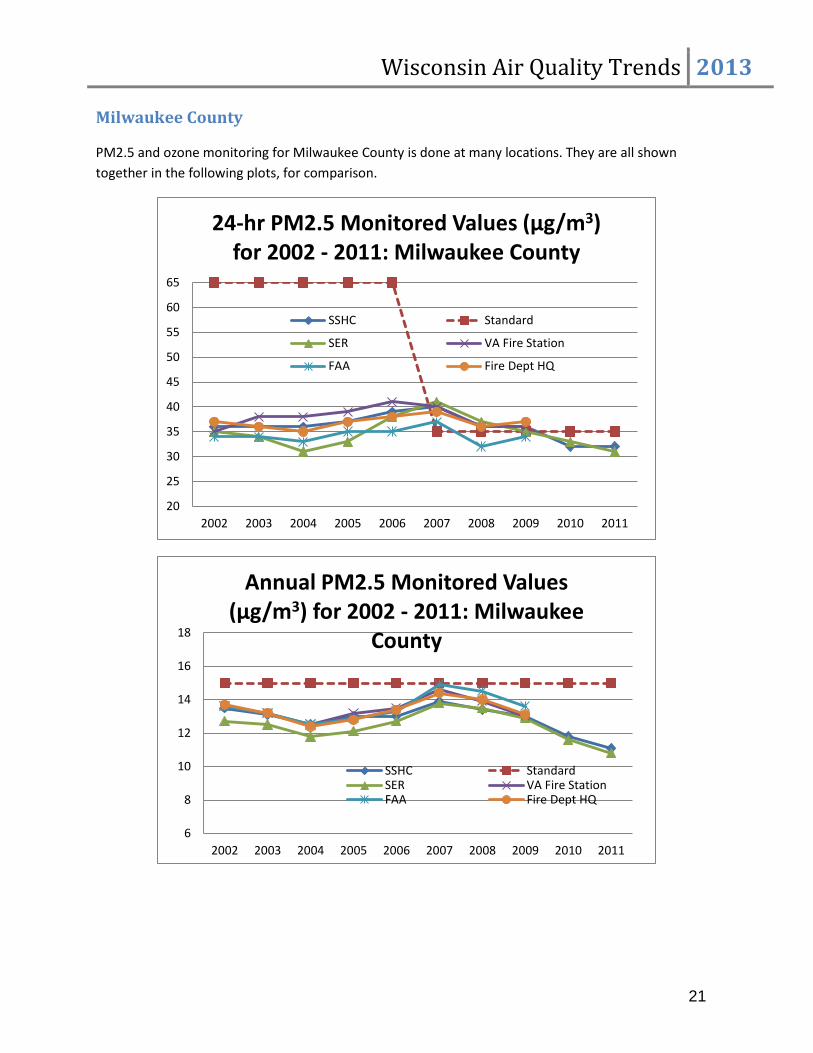
Milwaukee County
PM2.5 and ozone monitoring for Milwaukee County is done at many locations. They are all shown together in the following plots, for comparison.
20
25
30
35
40
45
50
55
60
65
2002 2003 2004 2005 2006 2007 2008 2009 2010 2011
24-hr PM2.5 Monitored Values (µg/m3) for 2002 - 2011: Milwaukee County
SSHC Standard
SER VA Fire Station
FAA Fire Dept HQ
6
8
10
12
14
16
18
2002 2003 2004 2005 2006 2007 2008 2009 2010 2011
Annual PM2.5 Monitored Values (µg/m3) for 2002 - 2011: Milwaukee
County
SSHC StandardSER VA Fire StationFAA Fire Dept HQ

Wisconsin Air Quality Trends 2013
22
556065707580859095
100105
2002 2003 2004 2005 2006 2007 2008 2009 2010 2011
8-hr Ozone Monitored Values (ppb) for 2002 - 2011: Milwaukee County
SSHCStandardSERUWM
Wisconsin Air Quality Trends 2013
23
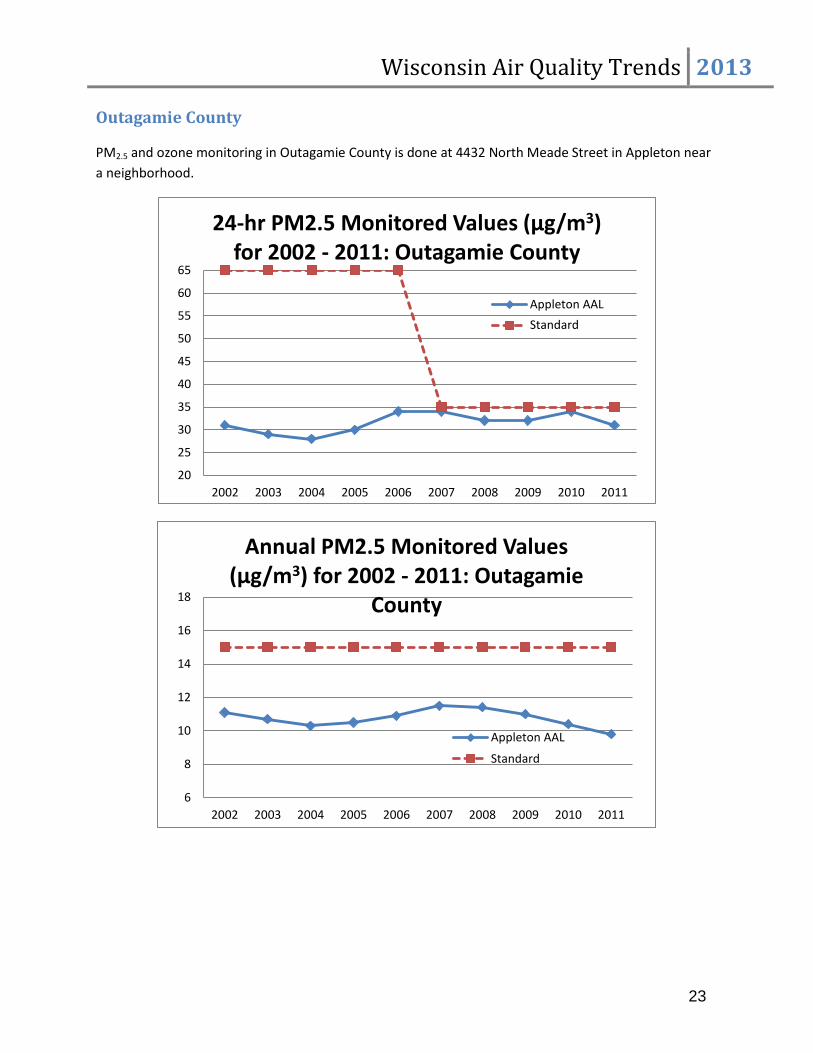
Outagamie County
PM2.5 and ozone monitoring in Outagamie County is done at 4432 North Meade Street in Appleton near a neighborhood.
20
25
30
35
40
45
50
55
60
65
2002 2003 2004 2005 2006 2007 2008 2009 2010 2011
24-hr PM2.5 Monitored Values (µg/m3) for 2002 - 2011: Outagamie County
Appleton AALStandard
6
8
10
12
14
16
18
2002 2003 2004 2005 2006 2007 2008 2009 2010 2011
Annual PM2.5 Monitored Values (µg/m3) for 2002 - 2011: Outagamie
County
Appleton AAL
Standard

Wisconsin Air Quality Trends 2013
24
Ozaukee County
PM2.5 monitoring in Ozaukee Couny is done at 531 Highway D in Harrington Beach State Park, while ozone monitoring is done both at Harrington Beach and at Highway 57 and I43 in Grafton next to the WE Energies landfill.
556065707580859095
100105
2002 2003 2004 2005 2006 2007 2008 2009 2010 2011
8-hr Ozone Monitored Values (ppb) for 2002 - 2011: Outagamie County
Appleton AALStandard
20
25
30
35
40
45
50
55
60
65
2005 2006 2007 2008 2009 2010 2011
24-hr PM2.5 Monitored Values (µg/m3) for 2005 - 2011: Ozaukee County
Harrington Beach
Standard

Wisconsin Air Quality Trends 2013
25
6
8
10
12
14
16
18
2005 2006 2007 2008 2009 2010 2011
Annual PM2.5 Monitored Values (µg/m3) for 2005 - 2011: Ozaukee
County
Harrington Beach
Standard
556065707580859095
100105
2002 2003 2004 2005 2006 2007 2008 2009 2010 2011
8-hr Ozone Monitored Values (ppb) for 2002 - 2011: Ozaukee County
GraftonStandardHarrington Beach
Wisconsin Air Quality Trends 2013
26
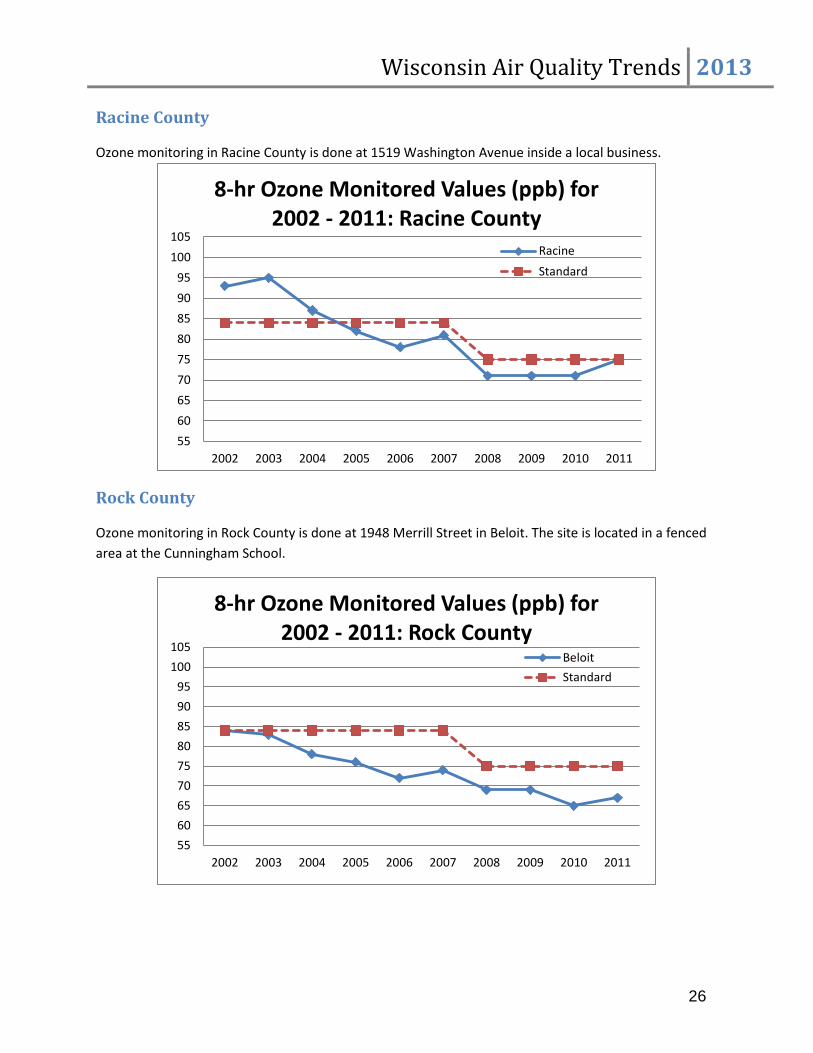
Racine County
Ozone monitoring in Racine County is done at 1519 Washington Avenue inside a local business.
Rock County
Ozone monitoring in Rock County is done at 1948 Merrill Street in Beloit. The site is located in a fenced area at the Cunningham School.
556065707580859095
100105
2002 2003 2004 2005 2006 2007 2008 2009 2010 2011
8-hr Ozone Monitored Values (ppb) for 2002 - 2011: Racine County
RacineStandard
556065707580859095
100105
2002 2003 2004 2005 2006 2007 2008 2009 2010 2011
8-hr Ozone Monitored Values (ppb) for 2002 - 2011: Rock County
BeloitStandard

Wisconsin Air Quality Trends 2013
27
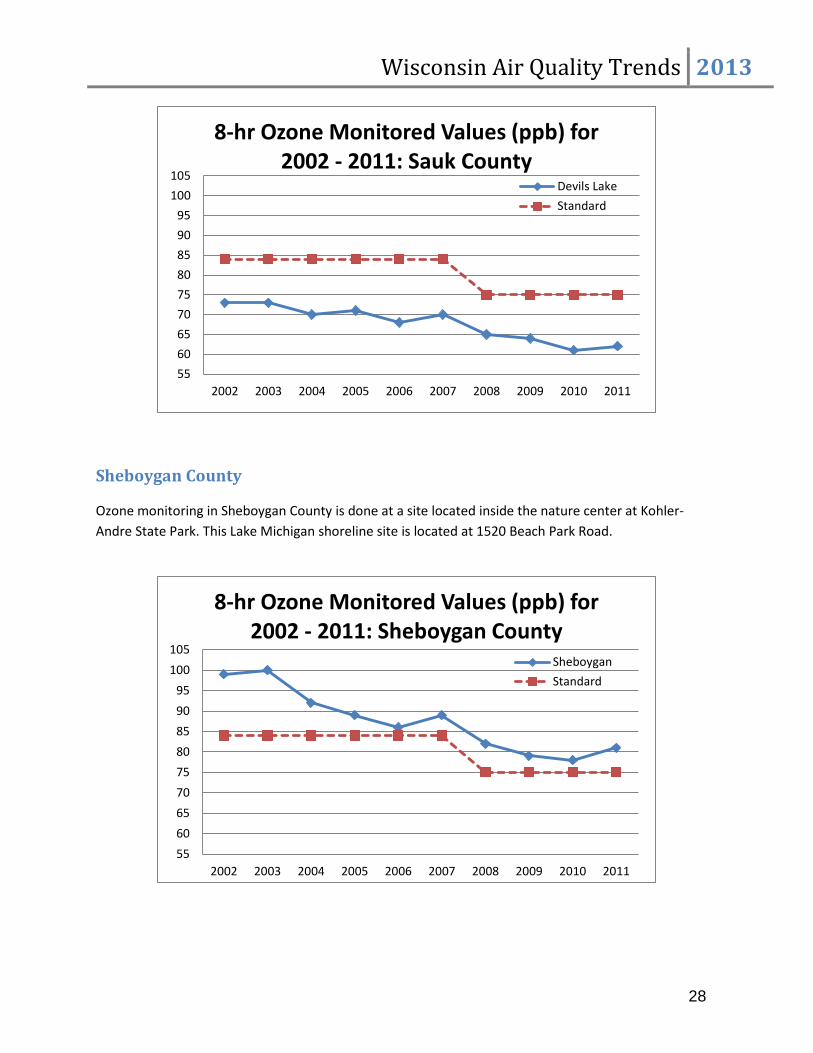
Sauk County
PM2.5 and ozone monitoring in Sauk County are done at Devil’s Lake State Park at E12886 Tower Road in Baraboo.
20
25
30
35
40
45
50
55
60
65
2005 2006 2007 2008 2009 2010 2011
24-hr PM2.5 Monitored Values (µg/m3) for 2005 - 2011: Sauk County
Devil's LakeStandard
6
8
10
12
14
16
18
2005 2006 2007 2008 2009 2010 2011
Annual PM2.5 Monitored Values (µg/m3) for 2005 - 2011: Sauk County
Devil's Lake
Standard
Wisconsin Air Quality Trends 2013
28
Sheboygan County
Ozone monitoring in Sheboygan County is done at a site located inside the nature center at Kohler-Andre State Park. This Lake Michigan shoreline site is located at 1520 Beach Park Road.
556065707580859095
100105
2002 2003 2004 2005 2006 2007 2008 2009 2010 2011
8-hr Ozone Monitored Values (ppb) for 2002 - 2011: Sauk County
Devils LakeStandard
556065707580859095
100105
2002 2003 2004 2005 2006 2007 2008 2009 2010 2011
8-hr Ozone Monitored Values (ppb) for 2002 - 2011: Sheboygan County
SheboyganStandard

Wisconsin Air Quality Trends 2013
29
Taylor County
PM2.5 monitoring in Taylor County is done a rural site one mile east of Perkinstown on State Highway M.
20
25
30
35
40
45
50
55
60
65
2005 2006 2007 2008 2009 2010 2011
24-hr PM2.5 Monitored Values (µg/m3) for 2005 - 2011: Taylor County
Perkinstown
Standard
6
8
10
12
14
16
18
2005 2006 2007 2008 2009 2010 2011
Annual PM2.5 Monitored Values (µg/m3) for 2005 - 2011: Taylor County
Perkinstown
Standard

Wisconsin Air Quality Trends 2013
30
Vilas County
PM2.5 and ozone monitoring in Vilas County is done at a field in the DNR Forestry Site at 10810 County Highway M in Boulder Junction.
1520253035404550556065
2002 2003 2004 2005 2006 2007 2008 2009 2010 2011
24-hr PM2.5 Monitored Values (µg/m3) for 2002 - 2011: Vilas County
Trout Lake
Standard
4
6
8
10
12
14
16
2002 2003 2004 2005 2006 2007 2008 2009 2010 2011
Annual PM2.5 Monitored Values (µg/m3) for 2002 - 2011: Vilas County
Trout Lake
Standard

Wisconsin Air Quality Trends 2013
31
556065707580859095
100105
2002 2003 2004 2005 2006 2007 2008 2009 2010 2011
8-hr Ozone Monitored Values (ppb) for 2002 - 2011: Vilas County
Trout LakeStandard

Wisconsin Air Quality Trends 2013
32
Walworth County
Ozone monitoring in Walworth County is done at a rural site on the outskirts of the City of Lake Geneva. The address for the site is Rural Route 4 Elgin Club Road.
556065707580859095
100105
2002 2003 2004 2005 2006 2007 2008 2009 2010 2011
8-hr Ozone Monitored Values (ppb) for 2002 - 2011: Walworth County
Lake GenevaStandard

Wisconsin Air Quality Trends 2013
33
Waukesha County
PM2.5 and ozone monitoring in Waukesha County is done at 1310 Cleveland Avenue in a fenced-in area on a city lot. The Cleveland Ave. site began sampling for daily PM2.5 on January 22, 2004 and for ozone on April 29, 2004. Prior to these dates, sampling for ozone in Waukesha County was performed at a Carroll College site.
20
25
30
35
40
45
50
55
60
65
2002 2003 2004 2005 2006 2007 2008 2009 2010 2011
24-hr PM2.5 Monitored Values (µg/m3) for 2002 - 2011: Waukesha County
Waukesha
Standard
6
8
10
12
14
16
18
2002 2003 2004 2005 2006 2007 2008 2009 2010 2011
Annual PM2.5 Monitored Values (µg/m3) for 2002 - 2011: Waukesha
County
Waukesha
Standard

Wisconsin Air Quality Trends 2013
34
556065707580859095
100105
2002 2003 2004 2005 2006 2007 2008 2009 2010 2011
8-hr Ozone Monitored Values (ppb) for 2002 - 2011: Waukesha County
Carroll College/Cleveland Ave.Standard
Recommended