CANADIAN TRAVEL MARKET
Wine, Beer & Food Tastings While on Trips Of One or More Nights
A Profile Report
November 14, 2007
Prepared by Lang Research Inc. on behalf of: Ontario Ministry of Tourism, Ontario Tourism Marketing Partnership Corporation, Quebec Ministry of Tourism,
Travel Manitoba, Canadian Tourism Commission, Tourism Saskatchewan, Atlantic Canada Tourism Partnership, Alberta Tourism, Parks, Recreation and Culture, Department of Canadian Heritage, Tourism British
Columbia, Parks Canada Agency, Government of Yukon, Government of Northwest Territories

TAMS 2006: Canadian Activity Profile: Wine, Beer and Food Tastings While on Trips Page 1
Wine, Beer & Food Tastings While on Trips Executive Summary
Over the last two years, 17.7% (4,389,525) of adult Canadians participated in a wine, beer or food tasting while on an out-of-town, overnight trip of one or more nights. A tasting at a winery (12.4%) was most popular followed by a visit to a food processing plant (4.8%), a tasting at a brewery (4.5%) and a cooking or wine tasting course (2.7%). Participating in wine, beer or food tastings while on trips was the 7th most frequent culture and entertainment activity type undertaken by Canadian Pleasure Travelers in the past two years. However, this activity is usually not the main reason for travel as only 17.7% (776,895) reported that tastings were the main reason for taking at least one trip. Those who participated in tastings are over-represented among those 55 to 64, and especially mature couples. This affluent activity segment is the 6th most likely to have a university degree (40.9%) and has the 3rd highest average household income ($81,964). They are over-represented in British Columbia, Quebec and Ontario. Those who participated in a wine, beer or food tasting are more frequent long-haul travelers than most of the other 21 culture and entertainment activity types. They were the 7th most likely to have visited the United States (64.0%), the 6th most likely to have visited Mexico (17.6%), the 6th most likely to have taken a trip to the Caribbean (21.6%) and the 3rd most likely to have traveled overseas (36.6%) in the past two years. However, their regional domestic travel is generally average as they were only the 11th most likely to have taken a trip within their own province or region (90.5%) and the 13th most likely to have traveled to an adjacent province or region (56.2%). They were, however, the 5th most likely to have visited a non-adjacent province or region (42.8%). Relative to the average Canadian Pleasure Traveler, those who participated in tastings while on trips were considerably active in cultural activities (e.g., high art performances, live theatre) and educational-experiential activities (e.g., participatory historical activities, science and technology exhibits). They were also quite active in outdoor activities including resort-based, water activities (e.g., sailing and surfing, fresh water scuba diving and snorkeling), sports (e.g., golf) and skiing (downhill skiing, cross-country skiing). They tend to stay at resorts and other accommodation that specializes in fine cuisine. They prefer vacations that offer novelty, intellectual stimulation and learning opportunities. Those who participated in wine, beer and food tastings are among the heaviest users of the Internet to plan (73.7%) and book (51.8%) travel. They are also avid consumers of travel-related media. In addition to these channels, this segment may be effectively reached through lifestyle media (e.g., cooking shows, city lifestyle magazines), business, finance and investing magazines and news and current events programming.
TAMS 2006: Canadian Activity Profile: Wine, Beer and Food Tastings While on Trips Page 2
Travel Activity and Motivation Survey (TAMS) The TAMS survey examines the recreational activities and travel habits of Canadians
and Americans. The survey examines out-of-town, overnight travel behaviour of one or
more nights over the past two years and provides detailed information on Travelers’
activities, travel motivators, places visited, type of accommodation used, impressions of
Canada, its provinces and territories, demographics and media consumption patterns.
TAMS represents a comprehensive assessment of travel behaviour and motivators and
provides a rich and authoritative database by which to develop marketing strategies and
travel products to attract visitors to Canada. In particular, TAMS was designed to:
o Identify existing and potential tourism markets; o Measure the likelihood of these tourism markets being attracted to vacation
experiences in Canada; o Create packaging opportunities for each of these markets; o Determine how to reach these markets (i.e., in terms of media strategies); and o Provide information on how to fine-tune and target existing marketing campaigns.
TAMS was sponsored by the following organizations:
Ontario Ministry of Tourism Quebec Ministry of Tourism Ontario Tourism Marketing Partnership Corporation Travel Manitoba Canadian Tourism Commission Tourism Saskatchewan Atlantic Canada Tourism Partnership Parks Canada Agency Department of Canadian Heritage Tourism British Columbia Alberta Tourism, Parks, Recreation and Culture Government of Yukon Government of Northwest Territories Statistics Canada
The survey was conducted in Canada and the United States between January 2006 and
June 2006 and it includes only adults (18 years and over). The reference period for the
data is 2004 and 2005.
The Canadian database is used in this current report. This survey was conducted by
Statistics Canada. 31,699 completed questionnaires were returned. The data have been
weighted to project the results to the Canadian population.
This report profiles persons who participated in wine, beer or food tastings while on a trip
and compares them with other Canadian Pleasure Travelers (i.e., those who took at
least one pleasure trip or vacation in the last two years). This report is part of a series of
44 Activity Reports prepared using the Canadian TAMS database.

TAMS 2006: Canadian Activity Profile: Wine, Beer and Food Tastings While on Trips Page 3
Wine, Beer & Food Tastings While on Trips Market Incidence Over the last two years, 17.7% of adult Canadians (4,389,525) participated in a wine,
beer or food tasting while on an out-of-town, overnight trip of one or more nights. A day
visit and tasting at a winery (12.4%) was the most common tasting experience on a trip.
A visit to a food processing plant such as a cheese factory (4.8%) was the next most
common activity followed by a day visit and tasting at a brewery (4.5%) and a cooking or
wine tasting course (2.7%). Participating in wine, beer or food tastings while on trips was
the 7th most frequent culture and entertainment activity type undertaken by Canadian
Pleasure Travelers in the past two years.
Participating in a wine, beer or food tasting was typically not the main reason for travel.
In fact, only 17.7% (776,895) reported that this activity was the main reason for taking at
least one trip in the past two years (the 20th most frequent reason for travel of the 21
culture and entertainment activity types). Taking a cooking or wine tasting course was
more likely than other tasting activities to be cited as the main reason for taking at least
one trip in the last two years.
Fig. 1 Incidence of Wine, Beer & Food Tastings While on Trips1
Number Who Participated in Tastings2
Percent Main
Reason for Trip3
Percent of Pleasure
Travelers4
Percent of Total
Canadian Population5
Size of Market 4,389,525 776,895 18,439,508 24,776,103 Wine, Beer & Food Tastings (All Activities) 4,389,525 17.7% 23.8% 17.7% Day visit and tasting at a winery 3,080,835 17.4% 16.7% 12.4% Visit food processing plant (e.g., cheese factory) 1,197,218 11.9% 6.5% 4.8% Day visit and tasting at a brewery 1,125,537 10.5% 6.1% 4.5% Cooking or wine tasting course 666,331 22.0% 3.6% 2.7% Participated in all four activities 81,314 3.3% 0.4% 0.3%
1 - “Trips” are defined as out-of-town trips for any purpose involving an overnight stay of one or more nights. Trips NOT involving overnight stays are NOT examined in this report.
2 - Defined as individuals who participated in a wine, beer or food tasting while on an out-of-town, overnight trip of one or more nights during the past two years and who took at least one out-of-town pleasure trip of one or more nights during the past two years. This column reports the number of individuals who participated in the activity on at least one trip during the last two years.
3 - This column reports the percent who participated in each activity who stated that the activity was the main reason for taking at least one trip during the past two years.
4 - “Pleasure Travelers” are defined as individuals who have taken at least one out-of-town pleasure trip of one or more nights in the last two years. This column reports the percent of Pleasure Travelers who participated in each activity on at least one trip during the last two years.
5 - This column reports the percent of the Total Canadian Adult Market who participated in each activity on a trip during the past two years.

TAMS 2006: Canadian Activity Profile: Wine, Beer and Food Tastings While on Trips Page 4
Incidence by Region Those who participated in wine, beer and food tastings while on trips are over-
represented among Canadian Pleasure Travelers living in British Columbia, Quebec and
Ontario. They are least likely to live in Manitoba and Saskatchewan.
Fig. 2 Geographic Distribution of Those Who Participated in Wine, Beer & Food Tastings While on Trips
Total
Population
Estimated Number Who Participated in
Tastings on a Trip
Percent of Pleasure Travelers
in Region Who Participated in
Tastings on a Trip
Percent of Total Regional
Population Who Participated in
Tastings on a Trip Canada 24,776,103 4,389,525 23.8% 17.7% Atlantic Provinces 1,822,494 229,329 18.1% 12.6% Quebec 5,940,869 1,094,244 26.1% 18.4% Ontario 9,671,592 1,720,378 24.0% 17.8% Manitoba 843,107 77,577 13.0% 9.2% Saskatchewan 706,325 76,110 14.1% 10.8% Alberta 2,465,540 422,251 21.1% 17.1% British Columbia 3,326,176 769,636 28.9% 23.1%
TAMS 2006: Canadian Activity Profile: Wine, Beer and Food Tastings While on Trips Page 5
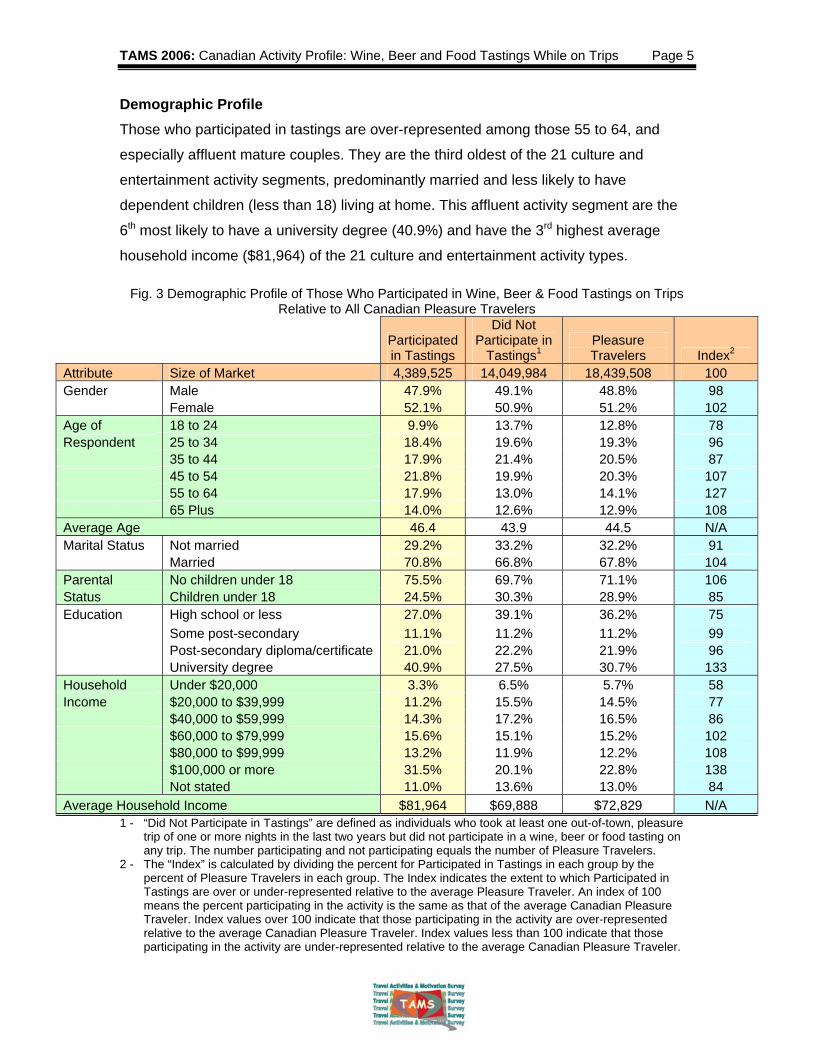
Demographic Profile Those who participated in tastings are over-represented among those 55 to 64, and
especially affluent mature couples. They are the third oldest of the 21 culture and
entertainment activity segments, predominantly married and less likely to have
dependent children (less than 18) living at home. This affluent activity segment are the
6th most likely to have a university degree (40.9%) and have the 3rd highest average
household income ($81,964) of the 21 culture and entertainment activity types.
Fig. 3 Demographic Profile of Those Who Participated in Wine, Beer & Food Tastings on Trips Relative to All Canadian Pleasure Travelers
Participated in Tastings
Did Not Participate in
Tastings1Pleasure Travelers Index2
Attribute Size of Market 4,389,525 14,049,984 18,439,508 100 Gender Male 47.9% 49.1% 48.8% 98 Female 52.1% 50.9% 51.2% 102 Age of 18 to 24 9.9% 13.7% 12.8% 78 Respondent 25 to 34 18.4% 19.6% 19.3% 96 35 to 44 17.9% 21.4% 20.5% 87 45 to 54 21.8% 19.9% 20.3% 107 55 to 64 17.9% 13.0% 14.1% 127 65 Plus 14.0% 12.6% 12.9% 108 Average Age 46.4 43.9 44.5 N/A Marital Status Not married 29.2% 33.2% 32.2% 91 Married 70.8% 66.8% 67.8% 104 Parental No children under 18 75.5% 69.7% 71.1% 106 Status Children under 18 24.5% 30.3% 28.9% 85 Education High school or less 27.0% 39.1% 36.2% 75 Some post-secondary 11.1% 11.2% 11.2% 99 Post-secondary diploma/certificate 21.0% 22.2% 21.9% 96 University degree 40.9% 27.5% 30.7% 133 Household Under $20,000 3.3% 6.5% 5.7% 58 Income $20,000 to $39,999 11.2% 15.5% 14.5% 77 $40,000 to $59,999 14.3% 17.2% 16.5% 86 $60,000 to $79,999 15.6% 15.1% 15.2% 102 $80,000 to $99,999 13.2% 11.9% 12.2% 108 $100,000 or more 31.5% 20.1% 22.8% 138 Not stated 11.0% 13.6% 13.0% 84 Average Household Income $81,964 $69,888 $72,829 N/A
1 - “Did Not Participate in Tastings” are defined as individuals who took at least one out-of-town, pleasure trip of one or more nights in the last two years but did not participate in a wine, beer or food tasting on any trip. The number participating and not participating equals the number of Pleasure Travelers.
2 - The “Index” is calculated by dividing the percent for Participated in Tastings in each group by the percent of Pleasure Travelers in each group. The Index indicates the extent to which Participated in Tastings are over or under-represented relative to the average Pleasure Traveler. An index of 100 means the percent participating in the activity is the same as that of the average Canadian Pleasure Traveler. Index values over 100 indicate that those participating in the activity are over-represented relative to the average Canadian Pleasure Traveler. Index values less than 100 indicate that those participating in the activity are under-represented relative to the average Canadian Pleasure Traveler.

TAMS 2006: Canadian Activity Profile: Wine, Beer and Food Tastings While on Trips Page 6
Travel Activity (During Last Two Years) Those who participated in a wine, beer or food tasting are more frequent long-haul
travelers than most of the other 21 culture and entertainment activity types. They were
the 7th most likely to have visited the United States (64.0%), the 6th most likely to have
visited Mexico (17.6%), the 6th most likely to have taken a trip to the Caribbean (21.6%)
and the 3rd most likely to have traveled overseas (36.6%) in the last two years.
However, their regional domestic travel is only average. They were only the 11th most
likely to have taken a trip within their own province or region (90.5%) and the 13th most
likely to have traveled to an adjacent province or region (56.2%). However, they were
the 5th most likely to have visited a non-adjacent province or region (42.8%) in the last
two years. Ontario (62.1%), Quebec (48.6%) and British Columbia (41.1%) were the
most common destinations.
Fig. 4 Percent Traveling Within Canada and to Other Destinations during Past Two Years
Participated in
Tastings
Did Not Participate in
Tastings Pleasure Travelers Index
Size of Market 4,389,525 14,049,984 18,439,508 100 Canada 97.1% 94.0% 94.8% 102 Took a trip within own province / region 90.5% 84.4% 85.9% 105 Took a trip to an adjacent province / region 56.2% 46.2% 48.6% 116 Took a trip to non-adjacent province / region 42.8% 27.9% 31.4% 136 Newfoundland and Labrador 5.3% 4.0% 4.3% 123 Prince Edward Island 10.9% 6.0% 7.2% 152 New Brunswick 16.3% 10.4% 11.8% 138 Nova Scotia 17.2% 11.3% 12.7% 136 Quebec 48.6% 35.9% 38.9% 125 Ontario 62.1% 50.8% 53.5% 116 Manitoba 10.2% 8.8% 9.2% 112 Saskatchewan 12.4% 11.1% 11.4% 109 Alberta 29.3% 24.8% 25.8% 114 British Columbia 41.1% 27.4% 30.6% 134 Yukon 1.8% 0.8% 1.0% 178 Northwest Territories 0.9% 0.6% 0.7% 143 Nunavut 0.4% 0.3% 0.3% 138 United States 64.0% 46.5% 50.7% 126 Mexico 17.6% 10.7% 12.4% 142 Caribbean 21.6% 13.7% 15.6% 138 All other destinations 36.6% 19.6% 23.6% 155
TAMS 2006: Canadian Activity Profile: Wine, Beer and Food Tastings While on Trips Page 7
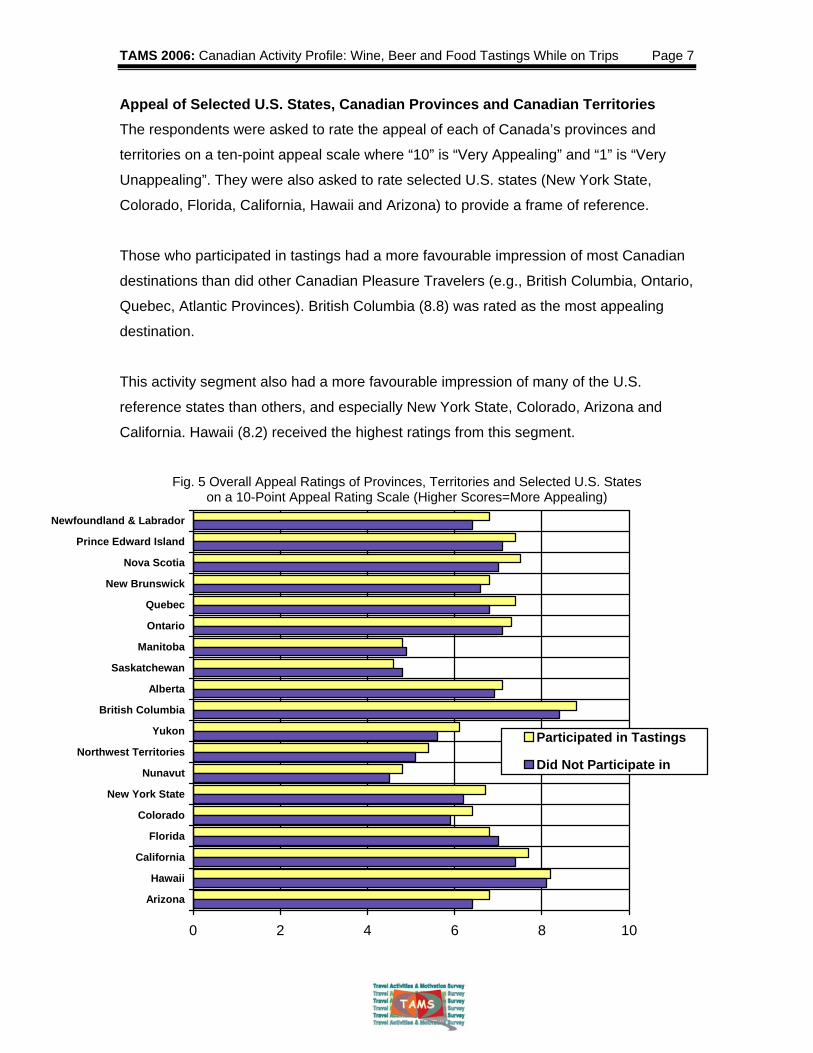
Appeal of Selected U.S. States, Canadian Provinces and Canadian Territories The respondents were asked to rate the appeal of each of Canada’s provinces and
territories on a ten-point appeal scale where “10” is “Very Appealing” and “1” is “Very
Unappealing”. They were also asked to rate selected U.S. states (New York State,
Colorado, Florida, California, Hawaii and Arizona) to provide a frame of reference.
Those who participated in tastings had a more favourable impression of most Canadian
destinations than did other Canadian Pleasure Travelers (e.g., British Columbia, Ontario,
Quebec, Atlantic Provinces). British Columbia (8.8) was rated as the most appealing
destination.
This activity segment also had a more favourable impression of many of the U.S.
reference states than others, and especially New York State, Colorado, Arizona and
California. Hawaii (8.2) received the highest ratings from this segment.
Fig. 5 Overall Appeal Ratings of Provinces, Territories and Selected U.S. States
on a 10-Point Appeal Rating Scale (Higher Scores=More Appealing)
0 2 4 6 8 10
Newfoundland & Labrador
Prince Edward Island
Nova Scotia
New Brunswick
Quebec
Ontario
Manitoba
Saskatchewan
Alberta
British Columbia
Yukon
Northwest Territories
Nunavut
New York State
Colorado
Florida
California
Hawaii
Arizona
Participated in Tastings
Did Not Participate in

TAMS 2006: Canadian Activity Profile: Wine, Beer and Food Tastings While on Trips Page 8
Other Culture and Entertainment Activities Pursued While on Trips Travelers who participated in wine, beer and food tastings were very active in culture
and entertainment pursuits while on trips. They frequently went shopping and dining,
visited historical sites, museums and art galleries and visited fairs and festivals while on
trips. Relative to the average Canadian Pleasure Traveler, they were especially likely to
have attended live art performances (e.g., high art performances, comedy festivals and
clubs, live theatre, musical concerts) and literary and film festivals. They were also more
likely to have taken part in participatory, educational activities (e.g., participatory
historical activities, aboriginal cultural experiences) and to have visited educational
attractions (e.g., science and technology exhibits, garden theme attractions). In terms of
entertainment activities, this segment was also more likely than others to have visited
casinos, spas and sporting events while on trips.
Fig. 6 Other Culture and Entertainment Activities Pursued While on Trips (See Appendix One for a Definition of Each Type of Culture & Entertainment Activity)
Participated in Tastings
Did Not Participate in
Tastings Pleasure Travelers Index
Size of Market 4,389,525 14,049,984 18,439,508 100 Shopping & Dining 96.2% 78.7% 82.9% 116 Historical Sites, Museums & Art Galleries 80.2% 51.5% 58.3% 137 Fairs & Festivals 55.9% 32.0% 37.7% 148 Theme Parks & Exhibits 48.5% 36.3% 39.2% 124 Musical Concerts, Festivals & Attractions 47.5% 28.1% 32.7% 145 Casinos 37.2% 22.4% 25.9% 144 Science & Technology Exhibits 35.5% 19.3% 23.1% 153 Live Theatre 34.8% 16.8% 21.1% 165 Garden Theme Attractions 33.3% 12.7% 17.6% 189 Agro-Tourism 26.3% 12.4% 15.7% 168 Professional Sporting Events 22.8% 13.4% 15.7% 146 Aboriginal Cultural Experiences 19.6% 9.1% 11.6% 169 High Art Performances 19.3% 8.4% 11.0% 176 Spas 18.3% 7.5% 10.0% 182 Comedy Festivals & Clubs 17.8% 7.7% 10.1% 176 Amateur Tournaments 15.5% 10.7% 11.8% 131 Participatory Historical Activities 13.7% 4.5% 6.7% 205 Equestrian & Western Events 11.6% 5.1% 6.7% 173 Literary & Film Festivals 6.0% 1.5% 2.6% 233 National & International Sporting Events 6.0% 2.3% 3.2% 187

TAMS 2006: Canadian Activity Profile: Wine, Beer and Food Tastings While on Trips Page 9
Culture and Entertainment Activities Pursued in a Typical Year Travelers who participated in wine, beer and food tastings are also highly active in
culture and entertainment activities while not traveling. The majority dine in local
restaurants, visit local festivals and fairs and visit local historical sites or heritage
buildings. Relative to the average Canadian Pleasure Traveler, this activity segment is
especially likely to attend local live art performances (e.g., live theatre, classical music
concerts, jazz clubs, ballet and opera), visit educational attractions (e.g., museums, art
galleries or shows, botanical gardens) and visit local day spas.
Fig. 7 Culture and Entertainment Activities Pursued in a Typical Year
Participated in Tastings
Did Not Participate in Tastings
Pleasure Travelers Index
Size of Market 4,389,525 14,049,984 18,439,508 100 Going out to eat in restaurants 96.0% 90.1% 91.5% 105 Going to festivals or fairs 70.9% 58.5% 61.4% 115 Going to historic sites or heritage buildings 52.9% 35.1% 39.3% 135 Going to pick-your-own farms or farmers' market 49.8% 38.2% 41.0% 121 Going to live theatre 48.7% 30.5% 34.8% 140 Going to museums 47.2% 28.2% 32.7% 144 Going to art galleries or art shows 47.2% 27.0% 31.8% 149 Going to amateur sporting events 45.1% 41.0% 42.0% 107 Going to professional sporting events 38.1% 30.2% 32.1% 119 Going to botanical gardens 35.8% 22.1% 25.4% 141 Going dancing 35.3% 28.2% 29.9% 118 Going to zoos or aquariums 34.5% 29.2% 30.4% 113 Going to bars with live pop or rock bands 32.9% 26.1% 27.7% 119 Going to amusement or theme parks 28.9% 28.9% 28.9% 100 Going to classical music concerts 26.2% 13.5% 16.5% 159 Going to rock music concerts 25.7% 21.4% 22.4% 115 Going to day spas 22.1% 11.2% 13.8% 161 Going to gamble in casinos 20.4% 17.4% 18.1% 112 Staying overnight in a hotel or B&B in own city 13.1% 8.9% 9.9% 132 Going to jazz clubs 13.1% 5.8% 7.5% 173 Going to the opera 12.0% 4.9% 6.6% 182 Going to the ballet 11.9% 5.8% 7.3% 163 Going to rodeos 7.9% 7.2% 7.3% 107

TAMS 2006: Canadian Activity Profile: Wine, Beer and Food Tastings While on Trips Page 10
Outdoor Activities Pursued While on Trips Travelers who participated in wine, beer and food tastings were also highly active in
outdoor activities while on trips. The majority enjoyed ocean activities (e.g., sunbathing,
swimming in ocean) and went wildlife viewing while traveling. However, relative to the
average Canadian Pleasure Traveler, this segment was especially likely to have
participated in resort-based, water activities (e.g., sailing and surfing, freshwater scuba
diving and snorkeling), skiing (e.g., downhill skiing, cross country skiing) and fitness
activities (e.g., cycling, exercising and jogging). They also were more likely than others
to have played sports (e.g., golfing, tennis) and gone hiking, climbing and paddling while
on trips. Hunting was the only outdoor trip activity in which this segment’s participation
rate was below-average.
Fig. 8 Outdoor Activities Pursued While on Trips
(See Appendix Two for a Definition of Each Type of Outdoor Activity)
Participated in Tastings
Did Not Participate in
Tastings Pleasure Travelers Index
Size of Market 4,389,525 14,049,984 18,439,508 100 Ocean Activities (e.g., swimming in ocean, sunbathing) 62.7% 44.1% 48.5% 129 Wildlife Viewing 55.9% 36.7% 41.2% 136 Boating & Swimming (e.g., motorboating, swimming in lakes) 50.5% 38.2% 41.1% 123 Hiking, Climbing & Paddling 47.5% 29.9% 34.1% 139 Sports & Games (e.g., tennis, board games) 30.0% 20.4% 22.7% 132 Golfing 26.6% 15.7% 18.3% 145 Fishing 25.7% 22.9% 23.6% 109 Exercising & Jogging 25.3% 12.9% 15.9% 160 Cycling 22.5% 10.7% 13.5% 166 Downhill Skiing & Snowboarding 21.6% 12.5% 14.6% 148 Skating (e.g., ice skating, rollerblading) 17.4% 10.2% 12.0% 146 Cross-country Skiing & Snowshoeing 16.7% 7.0% 9.3% 180 Team Sports (e.g., hockey, baseball) 14.1% 10.5% 11.4% 124 Snowmobiling & ATVing 13.1% 10.8% 11.3% 115 Sailing & Surfing (e.g., sailing, windsurfing, parasailing) 11.1% 4.8% 6.3% 176 Horseback Riding 7.6% 4.1% 4.9% 155 Freshwater Scuba & Snorkeling 5.3% 2.3% 3.0% 175 Wilderness Activities (e.g., wilderness skills course) 4.8% 1.6% 2.4% 201 Hunting 4.3% 4.8% 4.7% 91 Motorcycling 3.8% 2.7% 3.0% 127 Extreme Air Sports (e.g., parachuting) 2.6% 0.7% 1.1% 227

TAMS 2006: Canadian Activity Profile: Wine, Beer and Food Tastings While on Trips Page 11
Outdoor Activities Pursued in a Typical Year Travelers who participated in wine, beer and food tastings are somewhat more active in
outdoor activities than the average Canadian Pleasure Traveler while not traveling. The
majority go on day outings to parks and picnicking, swim, hike, cycle, exercise and
garden at home while not on trips. Relative to the average Canadian Pleasure Traveler
they are especially likely to go skiing (e.g., downhill skiing, cross-country skiing),
canoeing and kayaking, sailing and other boating and to play golf and racquet sports. On
the other hand, they are less likely than others to go ATVing, snowmobiling and hunting.
Fig. 9 Outdoor Activities Pursued in a Typical Year
Participated in Tastings
Did Not Participate in
Tastings Pleasure Travelers Index
Size of Market 4,389,525 14,049,984 18,439,508 100 Day outing to a park 73.7% 64.7% 66.9% 110 Exercising at home or at a fitness club 66.9% 59.1% 61.0% 110 Gardening 66.6% 57.6% 59.8% 111 Swimming 66.4% 58.3% 60.3% 110 Picnicking 60.2% 50.8% 53.1% 113 Hiking 58.9% 45.6% 48.8% 121 Cycling 50.7% 42.3% 44.3% 114 Camping 39.3% 38.4% 38.6% 102 Golfing 35.3% 27.5% 29.4% 120 Ice-skating 30.3% 28.0% 28.5% 106 Sailing or other boating 29.5% 21.6% 23.4% 126 Jogging 28.9% 22.6% 24.1% 120 Fishing 28.1% 29.6% 29.3% 96 Playing team sports 24.6% 22.4% 22.9% 107 Canoeing or kayaking 24.0% 14.7% 16.9% 142 Playing racquet sports (e.g., tennis or badminton) 23.4% 17.8% 19.1% 122 Downhill skiing 23.0% 14.1% 16.2% 142 Cross-country skiing 18.2% 10.7% 12.5% 146 Rollerblading 16.7% 13.7% 14.4% 116 Riding an all-terrain vehicle (ATV) 11.8% 15.1% 14.3% 82 Snowmobiling 8.0% 10.3% 9.8% 82 Horseback riding 7.9% 6.5% 6.8% 115 Snowboarding 6.5% 4.6% 5.0% 129 Hunting 6.1% 8.3% 7.7% 79 Skateboarding 1.7% 1.6% 1.6% 105
TAMS 2006: Canadian Activity Profile: Wine, Beer and Food Tastings While on Trips Page 12
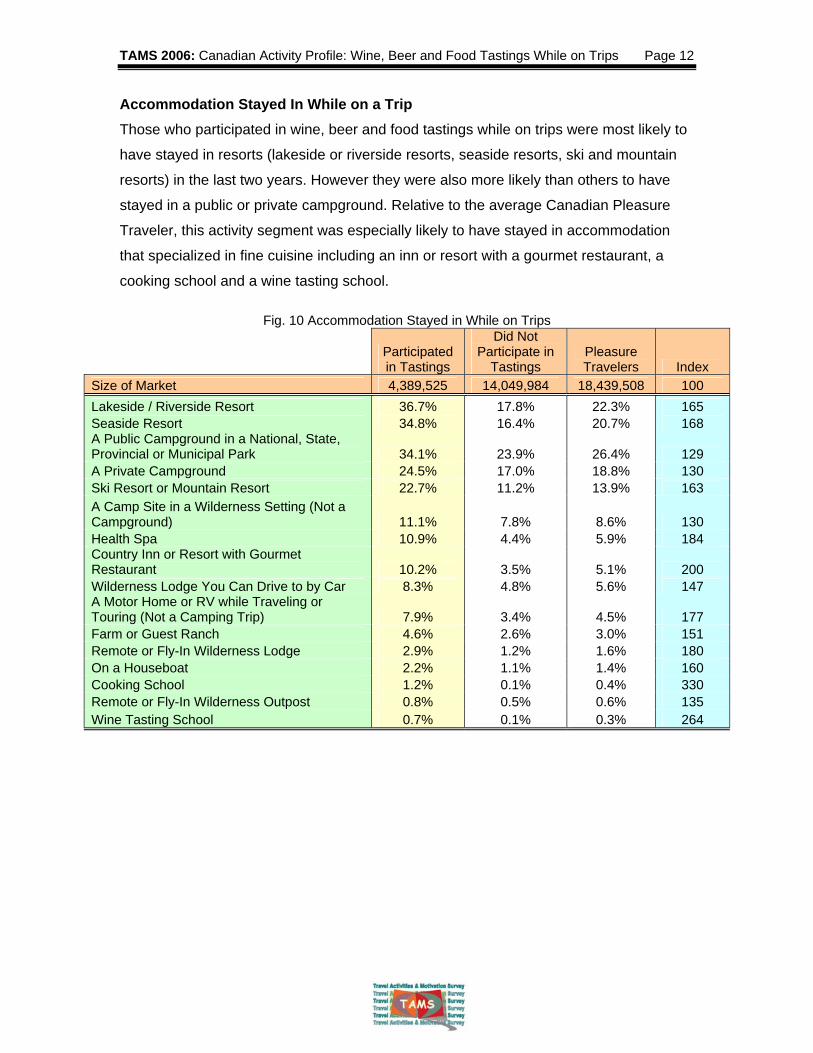
Accommodation Stayed In While on a Trip Those who participated in wine, beer and food tastings while on trips were most likely to
have stayed in resorts (lakeside or riverside resorts, seaside resorts, ski and mountain
resorts) in the last two years. However they were also more likely than others to have
stayed in a public or private campground. Relative to the average Canadian Pleasure
Traveler, this activity segment was especially likely to have stayed in accommodation
that specialized in fine cuisine including an inn or resort with a gourmet restaurant, a
cooking school and a wine tasting school.
Fig. 10 Accommodation Stayed in While on Trips
Participated in Tastings
Did Not Participate in
Tastings Pleasure Travelers Index
Size of Market 4,389,525 14,049,984 18,439,508 100 Lakeside / Riverside Resort 36.7% 17.8% 22.3% 165 Seaside Resort 34.8% 16.4% 20.7% 168 A Public Campground in a National, State, Provincial or Municipal Park 34.1% 23.9% 26.4% 129 A Private Campground 24.5% 17.0% 18.8% 130 Ski Resort or Mountain Resort 22.7% 11.2% 13.9% 163 A Camp Site in a Wilderness Setting (Not a Campground) 11.1% 7.8% 8.6% 130 Health Spa 10.9% 4.4% 5.9% 184 Country Inn or Resort with Gourmet Restaurant 10.2% 3.5% 5.1% 200 Wilderness Lodge You Can Drive to by Car 8.3% 4.8% 5.6% 147 A Motor Home or RV while Traveling or Touring (Not a Camping Trip) 7.9% 3.4% 4.5% 177 Farm or Guest Ranch 4.6% 2.6% 3.0% 151 Remote or Fly-In Wilderness Lodge 2.9% 1.2% 1.6% 180 On a Houseboat 2.2% 1.1% 1.4% 160 Cooking School 1.2% 0.1% 0.4% 330 Remote or Fly-In Wilderness Outpost 0.8% 0.5% 0.6% 135 Wine Tasting School 0.7% 0.1% 0.3% 264

TAMS 2006: Canadian Activity Profile: Wine, Beer and Food Tastings While on Trips Page 13
Tours and Cruises Taken During Past Two Years Travelers who participated in wine, beer and food tastings frequently took tours and
cruises during the past two years. Sameday tours (both guided and self-guided), scenic
countryside drives and city tours were the most common types of tours taken. However,
this segment was three to four times more likely than average to have taken a tour of a
winery or a factory (where they most likely participated in a tasting). They were also
more likely than others to have taken self-guided and guided multi-location tours,
wilderness tours and air tours in an airplane or helicopter. This segment was also more
likely than others to have taken both ocean cruises (e.g., Alaskan cruise), and
freshwater cruises (e.g., St. Lawrence River cruise) in the last two years.
Fig. 11 Tours and Cruises Taken During Past Two Years
Participated in Tastings
Did Not Participate in
Tastings Pleasure Travelers Index
Size of Market 4,389,525 14,049,984 18,439,508 100 A self-guided, sameday tour while on an overnight trip 44.2% 24.6% 29.3% 151 Around the countryside - scenic drives 36.6% 18.0% 22.4% 163 Around the city 35.3% 19.6% 23.4% 151 An organized, sameday, guided tour while on an overnight trip 35.0% 18.2% 22.2% 157 A self-guided, overnight tour where you stayed in different locations 30.6% 14.2% 18.1% 169 To a winery 21.7% 0.6% 5.6% 384 On the water (sightseeing cruise) 21.4% 10.5% 13.1% 164 Wilderness tour 19.7% 10.9% 13.0% 152 An organized, overnight, guided tour where you stayed in different locations 19.1% 7.3% 10.1% 189 Some other type of tour 15.0% 8.2% 9.8% 153 An organized, overnight, guided tour where you stayed in a single location 13.0% 6.2% 7.8% 165 To a casino 10.6% 5.3% 6.5% 162 Caribbean ocean cruise 8.0% 4.6% 5.4% 149 To a factory 7.2% 1.2% 2.6% 272 Ocean cruise – Other 5.8% 2.5% 3.3% 176 Cruise on another lake or river 4.0% 1.9% 2.4% 168 In the air as a pilot or passenger of an airplane or helicopter 3.5% 1.4% 1.9% 187 Alaskan ocean cruise 3.4% 1.1% 1.6% 209 Cruise on the St. Lawrence River 3.1% 1.6% 1.9% 160 Some other type of cruise 2.6% 1.3% 1.6% 162 Great Lakes cruise 1.1% 0.7% 0.8% 133 Submarine cruise 0.4% 0.1% 0.1% 300

TAMS 2006: Canadian Activity Profile: Wine, Beer and Food Tastings While on Trips Page 14
Benefits Sought While On a Vacation As with the majority of Canadian Pleasure Travelers, those who participated in wine,
beer and food tastings while on trips take vacations to relax and relieve stress, get a
break from their day-to-day environment, create lasting memories and enrich family
relationships. However, relative to other Canadian Pleasure Travelers, this activity
segment is especially likely to pursue vacations that offer novelty (e.g., seeing or doing
something new), intellectual stimulation (e.g., enrich their perspective on life, stimulate
your mind) and learning opportunities (e.g., gain knowledge of history and culture of a
destination).
Fig.12 Benefits Sought While On a Vacation
65%
65%
55%
54%
52%
47%
40%
35%
34%
23%
21%
17%
14%
13%
9%
66%
68%
52%
53%
42%
48%
45%
26%
21%
15%
19%
15%
12%
13%
10%
0% 10% 20% 30% 40% 50% 60% 70% 80%
To relax and relieve stress
To get a break from your day-to-day environment
To create lasting memories
To enrich your relationship w ith your spouse/partner/children
To see or do something new and different
To have a life w ith no fixed schedule
To keep family ties alive
To enrich your perspective on life
To gain knowledge of history, other cultures or other places
To stimulate your mind/be intellectually challenged
To renew personal connections w ith people (other than family)
To be challenged physically/to feel physically energized
To have stories to share back at home
To be pampered
To seek solitude and isolation
Participated in Tastings
Did Not Participate in Tastings
(Percent Rating Each Benefit as “Highly Important”)

TAMS 2006: Canadian Activity Profile: Wine, Beer and Food Tastings While on Trips Page 15
Other Attributes of a Destination Considered Important Similar to other Canadian Pleasure Travelers, those who participate in wine, beer and
food tastings on trips consider it important to feel safe while on vacation. However,
relative to the average Canadian Pleasure Traveler, this activity segment is especially
likely to look for culturally distinctive destinations that offer lots of things for adults to see
and do and that are directly accessible by air. Conversely, they are less concerned
whether a destination has lots of things for children to see and do (since they appear to
travel primarily without children) and whether the destination is conveniently access by
car (since they tend to be long-haul travelers). They also consider it less important than
others that a destination has low-cost package deals and friends or relatives living
nearby.
Fig. 13 Importance of Destination Attributes (% Rating Each Attribute as “Highly Important”)
64%
49%
41%
38%
33%
32%
25%
20%
18%
13%
13%
12%
12%
12%
10%
8%
8%
4%
67%
50%
37%
45%
28%
29%
25%
23%
24%
13%
13%
12%
8%
18%
15%
6%
12%
6%
0% 10% 20% 30% 40% 50% 60% 70%
Feeling safe at the destination
No health concerns at the destination
Lots of things for adults to see and do
Convenient access by car
Direct access by air
Availability of mid-range accommodation
Information about the destination available on the Internet
Availability of budget accommodation
Low cost package deals available for the destination
Convenient access by train/bus
Availability of camping
Great shopping opportunities
Being at a place that is very different culturally than mine
Lots of things for children to see and do
Being familiar with the culture and language of the destination
Availability of luxury accommodation
Having friends or relatives living there
Destination is disabled-person-friendly
Participated in Tastings Did Not Participate in Tastings

TAMS 2006: Canadian Activity Profile: Wine, Beer and Food Tastings While on Trips Page 16
How Destinations are Selected As with most Canadian Pleasure Travelers, the majority of those who participated in
wine, beer and food tastings while on trips begin planning their trips with a particular
destination in mind. However, they are also more likely than other Canadian Pleasure
Travelers to begin planning vacations by considering what types of vacation experiences
they would like to have while on a trip.
Fig. 14 How Destinations Are Selected (Summer and Winter Vacations)
Participated in Tastings
Did Not Participate in
Tastings Pleasure Travelers Index
Size of Market 4,389,525 14,049,984 18,439,508 100 Summer Started with a desired destination in mind 52.9% 47.0% 48.5% 109 Started by considering specific activities wanted to do 14.4% 13.6% 13.8% 105 Started with a certain type of vacation experience in mind 22.1% 24.2% 23.7% 93 Looked for packaged deals - no destination in mind 1.6% 1.2% 1.3% 122 Considered something else first 3.4% 4.6% 4.3% 79 Don't know / Other 5.5% 9.3% 8.4% 66 Winter Started with a desired destination in mind 51.1% 47.7% 48.6% 105 Started by considering specific activities wanted to do 18.7% 14.5% 15.6% 120 Started with a certain type of vacation experience in mind 17.5% 20.0% 19.3% 91 Looked for packaged deals - no destination in mind 3.5% 3.1% 3.2% 109 Considered something else first 4.1% 4.8% 4.7% 89 Don't know / Other 5.2% 9.9% 8.6% 60

TAMS 2006: Canadian Activity Profile: Wine, Beer and Food Tastings While on Trips Page 17
Trip Planning and Information Sources Consulted The majority of those who participated in wine, beer and food tastings while on trips
were responsible for planning their trips either on their own (43.4%) or with someone
else (16.1%). When making vacation plans, this activity segment consults a wider range
of sources than the average Canadian Pleasure Traveler. The majority use the Internet,
word-of-mouth and past experiences to plan trips. However, this activity segment is
especially likely to obtain travel-related information from travel guidebooks such as
Fodor’s, television programs, newspaper or magazine articles, email newsletters or
magazines, official government travel brochures and visitor information centres and
trade, travel or sports shows.
Fig. 15 Who Plans Vacations and Information Sources Consulted
Participated in Tastings
Did Not Participate in Tastings
Pleasure Travelers Index
Size of Market 4,389,525 14,049,984 18,439,508 100 Who Plans Respondent plans trips 43.4% 41.6% 42.0% 103 Trips? Trip planning a shared responsibility 16.1% 16.5% 16.4% 98 Someone else plans trips 40.6% 41.9% 41.5% 98 Information An Internet website 77.7% 61.1% 65.2% 119 Sources Advice of others / Word-of-mouth 59.8% 48.2% 51.1% 117 Consulted Past experience / Been there before 58.4% 47.7% 50.4% 116 A travel agent 46.2% 30.1% 34.1% 135 Maps 41.8% 29.5% 32.6% 128
Official travel guides or brochures from state / province 40.2% 21.2% 26.0% 155
Visitor information centres 34.8% 19.6% 23.4% 149 Articles in newspapers / magazines 33.0% 16.8% 20.9% 158 An auto club such as CAA 26.3% 14.8% 17.7% 149 Travel guide books such as Fodor's 25.3% 9.7% 13.6% 186 Advertisements in newspapers / magazines 20.6% 12.1% 14.3% 145 Programs on television 14.1% 5.3% 7.5% 188 Travel information received in the mail 13.7% 7.2% 8.8% 155
An electronic newsletter or magazine received by e-mail 7.6% 3.0% 4.2% 181
Advertisements on television 6.9% 4.3% 5.0% 139 Visits to trade, travel or sports shows 5.8% 2.2% 3.1% 185

TAMS 2006: Canadian Activity Profile: Wine, Beer and Food Tastings While on Trips Page 18
Use of the Internet to Plan and Arrange Trips Travelers who participated in wine, beer and food tastings are among the heaviest users
of the Internet to research (73.7%) and book (51.8%) travel. In fact, of the 21 culture and
entertainment activity types, this activity segment was the 3rd most likely to research and
book travel online. The majority use hotel or resort websites, official tourism websites,
airline websites and travel planning and booking websites such as Expedia. They are
also more likely than others to use the websites of cruise lines and motorcoach lines.
The most commonly book trip components online were accommodation and airline
tickets. However, this activity segment was more likely than others to purchase tickets
for travel by rail, bus or ship over the Internet.
Fig. 16 Use of the Internet to Plan and Book Travel
Participated in Tastings
Did Not Participate in Tastings
Pleasure Travelers Index
Size of Market 4,389,525 14,049,984 18,439,508 100 Percent Using Does not use the Internet 26.3% 45.4% 40.8% 64 Internet to Plan Uses Internet to plan trips only 21.9% 22.2% 22.1% 99 or Book Travel Uses Internet to book part of trip 51.8% 32.4% 37.0% 140 Types of A website of a hotel or resort 64.7% 53.7% 57.0% 113 Websites Consulted
A tourism website of a country / region / city 60.8% 45.1% 49.8% 122
An airline website 55.7% 42.3% 46.3% 120 A travel planning / booking website 52.8% 42.7% 45.7% 115 A website of an attraction 40.4% 31.9% 34.5% 117 Some other website 27.8% 27.5% 27.6% 101 A cruise line website 11.7% 6.5% 8.1% 144 A motorcoach website 3.4% 2.0% 2.5% 139 Parts of Trips Accommodation 77.3% 65.1% 69.2% 112 Booked Over Air tickets 74.7% 66.9% 69.5% 107 The Internet Car rental 35.1% 23.2% 27.1% 129
Tickets or fees for specific activities or attractions 27.9% 21.5% 23.6% 118
Tickets for rail, bus or boat / ship fares 20.3% 12.8% 15.3% 132 A package containing two or more items 17.4% 14.4% 15.4% 113 Other 5.2% 3.3% 3.9% 131

TAMS 2006: Canadian Activity Profile: Wine, Beer and Food Tastings While on Trips Page 19
Media Consumption Habits Travelers who participated in wine, beer and food tastings are among the most frequent
consumers of travel-related media including the travel sections of newspapers, travel
magazines, travel websites and travel television shows. In addition to these channels,
this segment may also be effectively reached through lifestyle-related media (e.g.,
cooking shows on television, home & garden television shows, house & home websites,
city lifestyle magazines), business, finance and investing magazines and news and
current events programs. In terms of radio advertising, they can best be reached through
jazz or classical music radio stations and news / talk / information radio stations.
Fig. 17 Media Consumption Habits
Participated in Tastings
Did Not Participate in
Tastings Pleasure Travelers Index
Size of Market 4,389,525 14,049,984 18,439,508 100 Newspaper Reads daily newspaper 90.3% 86.3% 87.3% 104 Readership Reads weekend edition of newspaper 90.6% 86.3% 87.3% 104
Reads local neighbourhood or community newspapers 66.3% 60.0% 61.5% 108
Reads other types of newspapers 22.8% 15.4% 17.2% 133
Frequently or occasionally reads travel section of daily newspaper 59.0% 41.6% 45.7% 129
Frequently or occasionally reads travel section of weekend newspaper 62.9% 42.5% 47.3% 133
Types of Travel (e.g., Condé Nast) 19.2% 9.4% 11.8% 163 Magazines Business, finance and investing 24.6% 13.7% 16.3% 151 Read Magazines about your city 17.6% 10.2% 12.0% 147 (Top 5 Indexed) Newsmagazine 32.8% 21.5% 24.2% 136 Outdoor activities / sports 17.0% 11.5% 12.8% 133 Type of Travel shows 40.7% 27.1% 30.3% 134 Television Cooking shows 37.7% 29.9% 31.7% 119 Programs Home & garden shows 39.6% 32.4% 34.2% 116 Watched History 47.0% 40.2% 41.8% 112 (Top 5 Indexed) Science & nature shows 48.5% 42.4% 43.8% 111 Type of Jazz/Big band 13.2% 7.4% 8.8% 151 Radio Classical music 24.5% 15.0% 17.2% 142 Programs Multicultural 11.0% 7.5% 8.4% 131 Listened To News / Talk / Information 48.8% 36.4% 39.4% 124 (Top 5 Indexed) Soft music / Adult contemporary 31.1% 24.1% 25.7% 121 Types of Travel 64.0% 45.9% 50.6% 127 Websites Network news sites (e.g., CBC, CNN) 41.8% 34.2% 36.1% 116 Visited House and home 32.1% 26.8% 28.1% 114 (Top 5 Indexed) Newspaper sites 35.1% 30.7% 31.8% 110 Sites for specific activities or interests 39.3% 34.7% 35.9% 110

TAMS 2006: Canadian Activity Profile: Wine, Beer and Food Tastings While on Trips Page 20
Appendix One
Canadian TAMS 2006 Culture and Entertainment Segmentation Activity Segment Activities in Segment
Well-known Historic Sites or Buildings Well-known Natural Wonders Other Historic Sites, Monuments and Buildings
Historical Replicas of Cities or Towns With Historic Re-Enactments
Strolling Around a City to Observe Buildings and Architecture
Museum - Military / War Museums
Art Galleries
Historical Sites, Museums & Art Galleries
Museum - General History or Heritage Museums Paleontological/Archaeological Sites Shop Or Browse - Bookstore or Music Store Shop Or Browse – Antiques Shop Or Browse - Clothing, Shoes and Jewellery
Shop Or Browse - Gourmet Foods in Retail Stores
Shop Or Browse - Local Arts & Crafts Studios or Exhibitions
Shop Or Browse - Greenhouse or Garden Centre
Dining - Restaurants Offering Local Ingredients and Recipes
High-End Restaurants with an International Reputation
Shopping & Dining
Went to Local Outdoor Cafes Other High-End Restaurants Aboriginal Cuisine (Tasted or Sampled) Aboriginal Arts and Crafts Shows Aboriginal Heritage Attractions (e.g., Museums, Interpretive Centres)
Aboriginal Cultural Experiences in a Remote or Rural Setting
Aboriginal Cultural Experiences
Aboriginal Festivals & Events (e.g., Powwows)
Aboriginal Outdoor Adventure and / or Sports
Farmers' Markets or Country Fairs Firework Displays Carnivals Ethnic Festivals Fairs & Festivals Exhibition or Fairs Food / Drink Festivals Science or Technology Museums Children's Museums Science & Technology Theme Parks Science & Technology
Exhibits Planetarium
Went to an Imax Movie Theatre
Amusement Park Aquariums Water Theme Park Zoos Movie Theme Park Theme Parks & Exhibits
Wax Museums Entertainment Farms (e.g., Corn Maze, Petting Zoo)
Classical or Symphony Concert High Art Performances Opera
Ballet or Other Dance Performances
Professional Football Games Professional Golf Tournaments Professional Basketball Games Professional Ice Hockey Games Professional Sporting
Events Professional Baseball Games Professional Soccer Games Live Theatre
Live Theatre Theatre Festivals Live Theatre with Dinner
Literary & Film Festivals Literary Festivals or Events International Film Festivals Went to Wineries for Day Visits and Tasting Cooking / Wine Tasting Courses
Tastings Went to Breweries for Day Visits and Tasting
Visited Food Processing Plants (e.g., Cheese Factory)
Casinos Went to a Casino Spas Day Visit to a Health & Wellness Spas while on an Overnight Trip
Historical Re-Enactments (as an Actor) Interpretive Program at a Historic Site or National / Provincial Park Participatory Historical
Activities Curatorial Tours Archaeological Digs Equine (Horse) Competitions Western Theme Events (e.g., Rodeos) Equestrian & Western
Events Horse Races

TAMS 2006: Canadian Activity Profile: Wine, Beer and Food Tastings While on Trips Page 21
Appendix One Canadian TAMS 2006 Culture and Entertainment Segmentation
Activity Segment Activities in Segment Dining At A Farm
Agro-Tourism Went Fruit Picking at Farms or Open Fields Harvesting and / or Other Farm Operations
Curling Bonspiel National & International Sporting Events Professional Figure Skating
National / International Sporting Events such as the Olympic Games
Gardens Theme Attractions
Garden Theme Park Botanical Gardens
Amateur Tournaments Amateur Sports Tournaments and Competitions
Amateur Tournaments and Competitions other than Sports-related
Music Festivals Musical Attractions Jazz Concert Free Outdoor Performances (e.g., Theatre,
Concerts) in a Park Musical Concerts, Festivals & Attractions
Rock & Roll/Popular Music Concert Country & Western Music Concert
Comedy Festivals & Clubs Comedy Festivals Stand-up Comedy Clubs & Other Variety
Shows

TAMS 2006: Canadian Activity Profile: Wine, Beer and Food Tastings While on Trips Page 22
Appendix Two: Canadian TAMS 2006 Outdoor Activity Segmentation Activity Segment Activities in Segment
Played During a Stay at a Golf Resort with Overnight Stay Golfing Played an Occasional Game While on a Trip
Golf Tour Package to Play on Various Courses
Hunting for Small Game Hunting Hunting for Big Game
Hunting for Birds
Fresh-Water Fishing Salt-Water Fishing Fishing Ice Fishing Trophy Fishing
Viewing Land Based Animals Bird Watching Whale Watching & Other Marine Life Visited National, Provincial / State Park Wildlife Viewing Wildflowers / Flora Viewing Viewing Northern Lights Mountain Climbing / Trekking Fresh Water Kayaking / Canoeing Rock Climbing Ocean Kayaking / Canoeing
Same Day Hiking Excursion While on a Trip of 1+ Nights
Hiking, Climbing & Paddling Hiking / Backpacking in Wilderness Setting
With Overnight Camping or Lodging White Water Rafting
Motorboating Boating & Swimming Water Skiing
Swimming in Lakes
Swimming in Oceans Snorkeling in Sea / Ocean Ocean Activities Sunbathing, Sitting on a Beach Scuba Diving in Sea/Ocean
Sailing Parasailing Sailing & Surfing Wind Surfing Kite Surfing
Freshwater Scuba & Snorkeling
Scuba Diving in Lakes / Rivers Snorkeling in Lakes / Rivers
Exercising & Jogging Working Out in Fitness Centre Jogging or Exercising Outdoors Overnight Touring Trip
Cycling Mountain Biking Recreational - Same Day Excursion
Motorcycling Overnight Touring Trip Same Day Excursion Horseback Riding With an Overnight Stop Same Day Excursion
All Terrain Vehicle - Overnight Touring Trip Snowmobiling As an Overnight Touring Trip Snowmobiling & ATVing All Terrain Vehicle - Same Day Excursion Snowmobiling Day Use on Organized Trail Downhill Skiing & Snowboarding
Snowboarding Downhill Skiing
Cross-country Skiing Cross-country Skiing & Snowshoeing Snowshoeing
Cross-country or Back Country as an Overnight Touring Trip
Wilderness Skills Courses Wilderness Activities Ice Climbing
Dog Sledding
Skating Ice Skating In-Line / Rollerblading Parachuting
Extreme Air Sports Hang Gliding Hot Air Ballooning
Ice Hockey Curling Football Basketball Team Sports Baseball or Softball Soccer Board Games Badminton Volleyball Tennis Beach Volleyball Sports & Games
Bowling Mini-Golf
Recommended