8/13/2019 What is Remote Sensing & Air Photo Interpretation
http://slidepdf.com/reader/full/what-is-remote-sensing-air-photo-interpretation 1/46
NATIONAL OPEN UNIVERSITY OF NIGERIA
COURSE CODE: ESM238
COURSE TITLE:
ELEMENTS OF REMOTE SENSING AND AERIAL PHOTO INTERPRETATION
8/13/2019 What is Remote Sensing & Air Photo Interpretation
http://slidepdf.com/reader/full/what-is-remote-sensing-air-photo-interpretation 2/46
2
ELEMENTS OF REMOTE SENSING AND AERIAL PHOTO INTERPRETATION
By
Dr. Oyekanmi Babatimehin
Department of Geography
Obafemi Awolowo University,
Ile – Ife
8/13/2019 What is Remote Sensing & Air Photo Interpretation
http://slidepdf.com/reader/full/what-is-remote-sensing-air-photo-interpretation 3/46
8/13/2019 What is Remote Sensing & Air Photo Interpretation
http://slidepdf.com/reader/full/what-is-remote-sensing-air-photo-interpretation 4/46
4
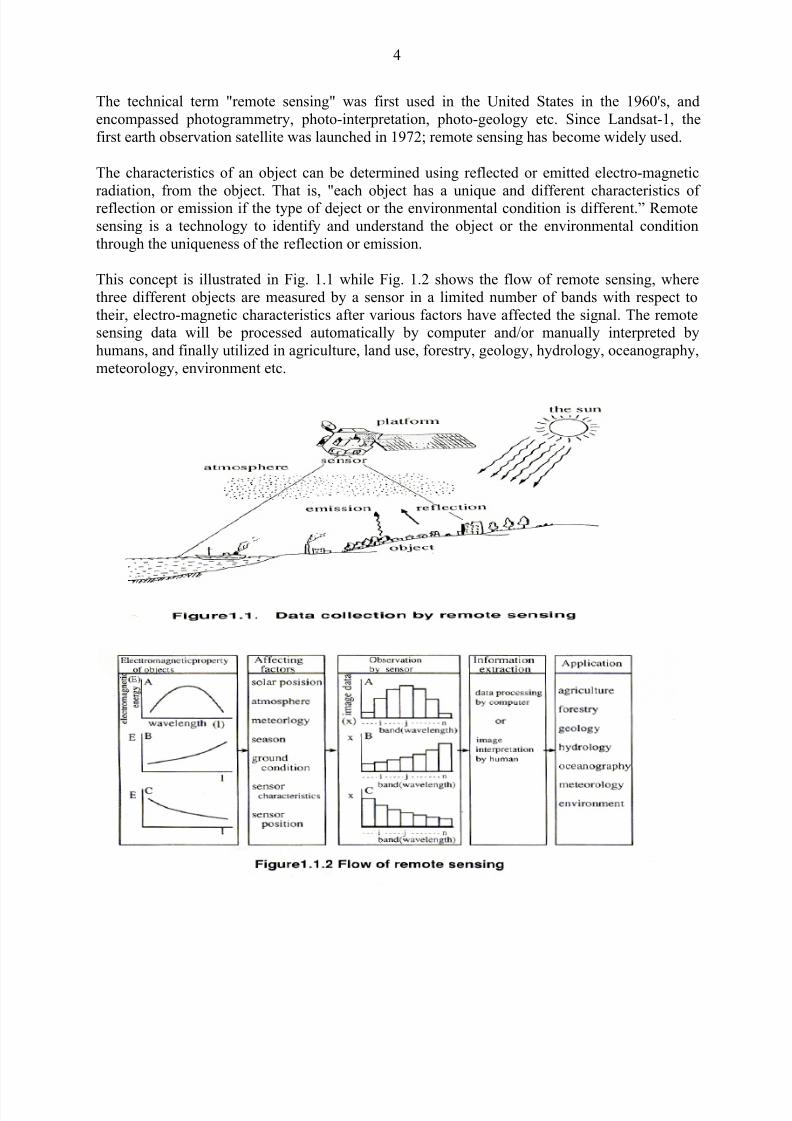
The technical term "remote sensing" was first used in the United States in the 1960's, and
encompassed photogrammetry, photo-interpretation, photo-geology etc. Since Landsat-1, the
first earth observation satellite was launched in 1972; remote sensing has become widely used.
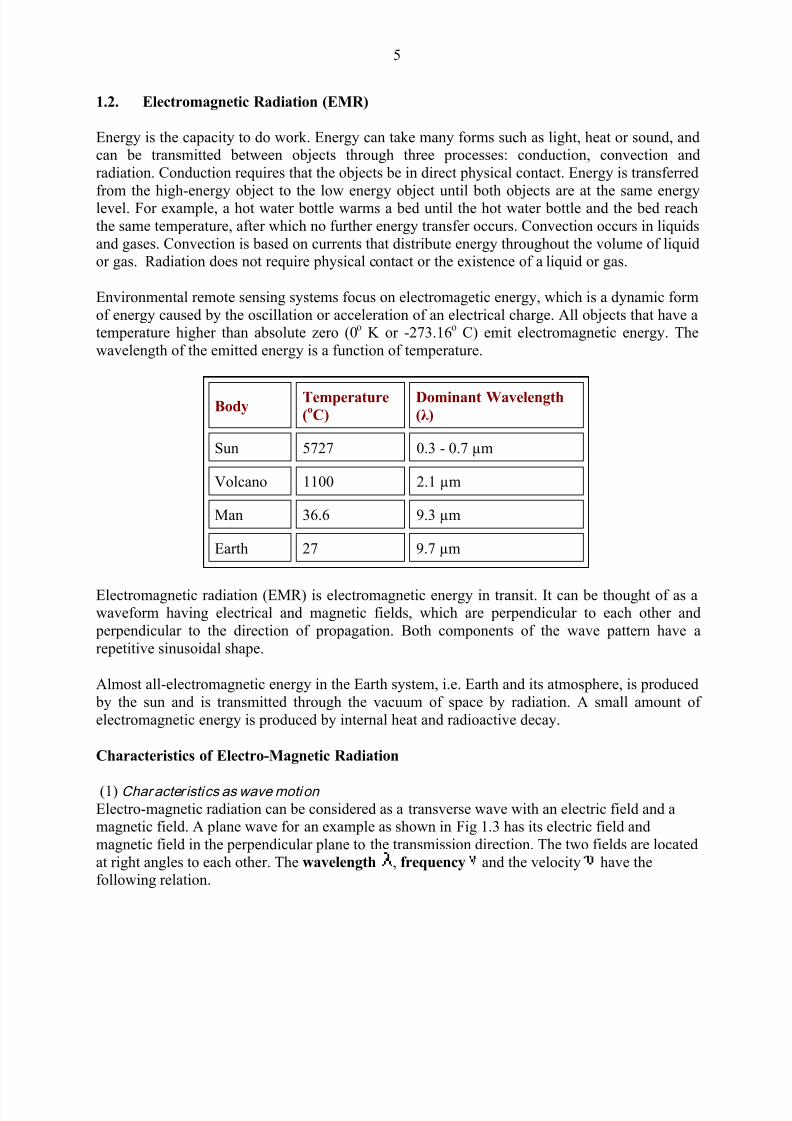
The characteristics of an object can be determined using reflected or emitted electro-magnetic
radiation, from the object. That is, "each object has a unique and different characteristics ofreflection or emission if the type of deject or the environmental condition is different.” Remote
sensing is a technology to identify and understand the object or the environmental condition
through the uniqueness of the reflection or emission.
This concept is illustrated in Fig. 1.1 while Fig. 1.2 shows the flow of remote sensing, where
three different objects are measured by a sensor in a limited number of bands with respect to
their, electro-magnetic characteristics after various factors have affected the signal. The remotesensing data will be processed automatically by computer and/or manually interpreted by
humans, and finally utilized in agriculture, land use, forestry, geology, hydrology, oceanography,
meteorology, environment etc.
8/13/2019 What is Remote Sensing & Air Photo Interpretation
http://slidepdf.com/reader/full/what-is-remote-sensing-air-photo-interpretation 5/46
8/13/2019 What is Remote Sensing & Air Photo Interpretation
http://slidepdf.com/reader/full/what-is-remote-sensing-air-photo-interpretation 6/46
6
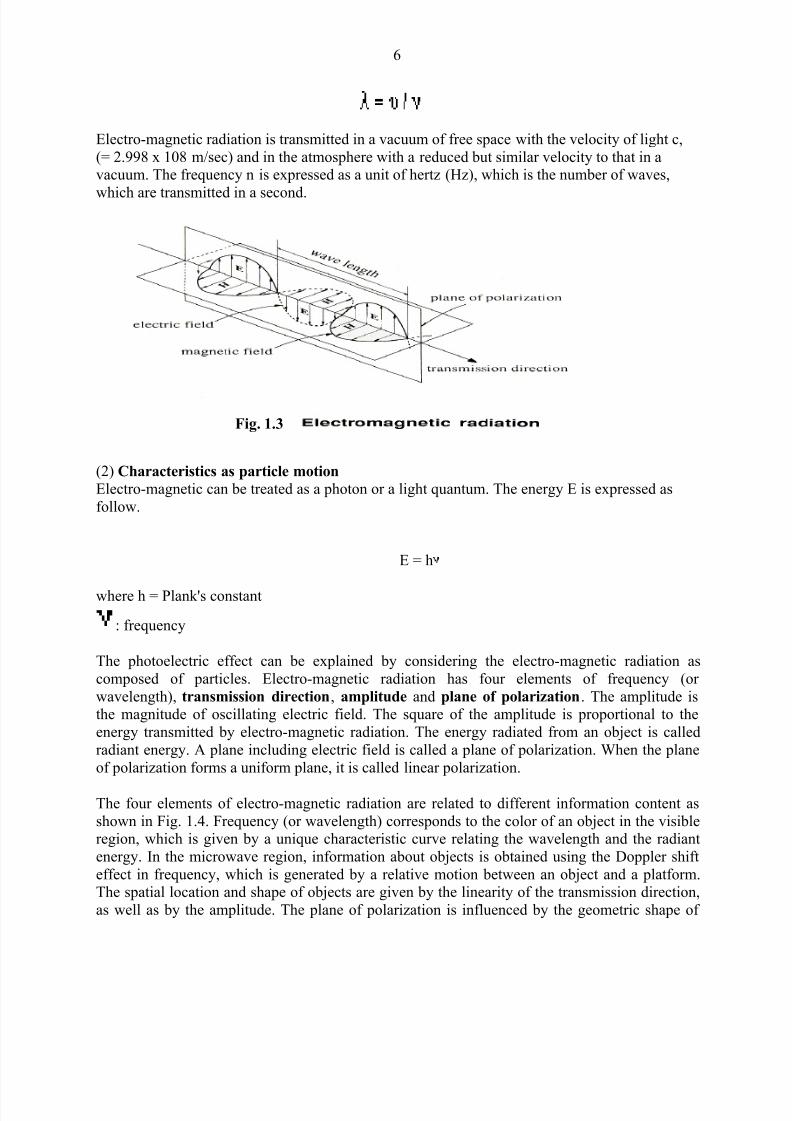
Electro-magnetic radiation is transmitted in a vacuum of free space with the velocity of light c,
(= 2.998 x 10⁸ m/sec) and in the atmosphere with a reduced but similar velocity to that in avacuum. The frequency n is expressed as a unit of hertz (Hz), which is the number of waves,
which are transmitted in a second.
(2) Characteristics as particle motion
Electro-magnetic can be treated as a photon or a light quantum. The energy E is expressed as
follow.
E = h
where h = Plank's constant
: frequency
The photoelectric effect can be explained by considering the electro-magnetic radiation as
composed of particles. Electro-magnetic radiation has four elements of frequency (or
wavelength), transmission direction, amplitude and plane of polarization. The amplitude isthe magnitude of oscillating electric field. The square of the amplitude is proportional to the
energy transmitted by electro-magnetic radiation. The energy radiated from an object is called
radiant energy. A plane including electric field is called a plane of polarization. When the plane
of polarization forms a uniform plane, it is called linear polarization.
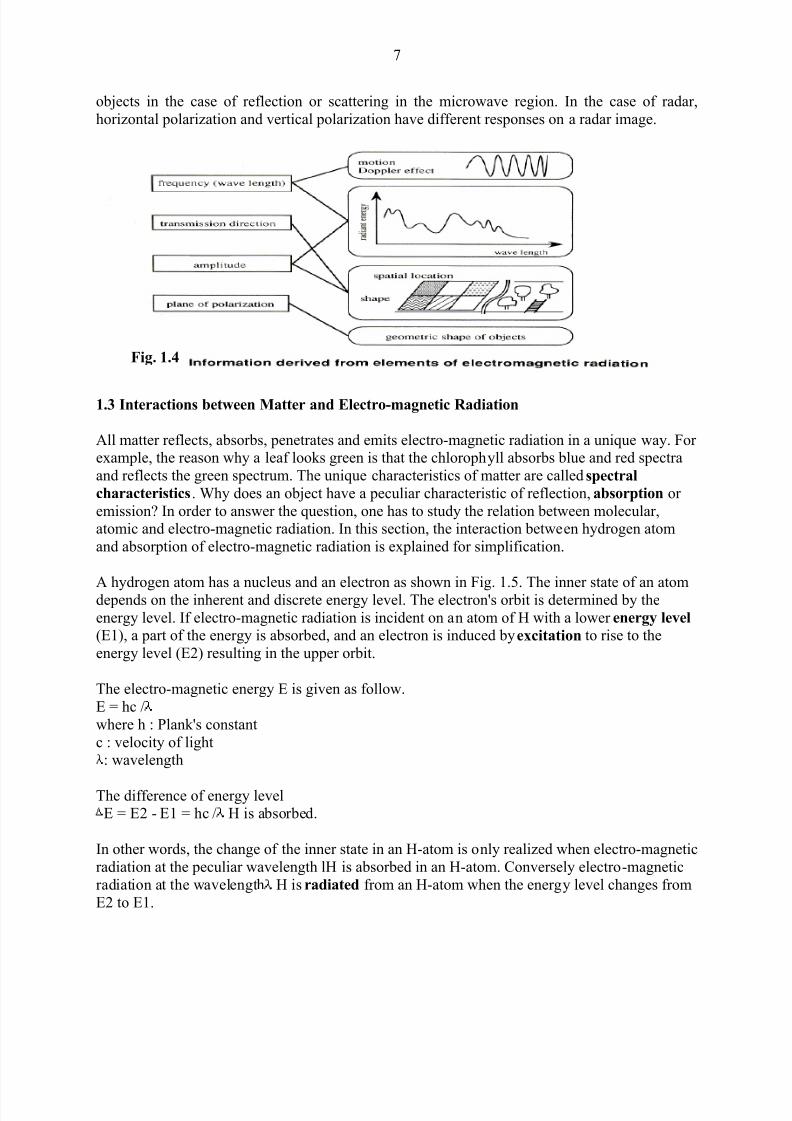
The four elements of electro-magnetic radiation are related to different information content as
shown in Fig. 1.4. Frequency (or wavelength) corresponds to the color of an object in the visibleregion, which is given by a unique characteristic curve relating the wavelength and the radiant
energy. In the microwave region, information about objects is obtained using the Doppler shift
effect in frequency, which is generated by a relative motion between an object and a platform.The spatial location and shape of objects are given by the linearity of the transmission direction,
as well as by the amplitude. The plane of polarization is influenced by the geometric shape of
Fig. 1.3
8/13/2019 What is Remote Sensing & Air Photo Interpretation
http://slidepdf.com/reader/full/what-is-remote-sensing-air-photo-interpretation 7/46
7
objects in the case of reflection or scattering in the microwave region. In the case of radar,
horizontal polarization and vertical polarization have different responses on a radar image.
1.3 Interactions between Matter and Electro-magnetic Radiation
All matter reflects, absorbs, penetrates and emits electro-magnetic radiation in a unique way. Forexample, the reason why a leaf looks green is that the chlorophyll absorbs blue and red spectra
and reflects the green spectrum. The unique characteristics of matter are called spectral
characteristics. Why does an object have a peculiar characteristic of reflection, absorption or
emission? In order to answer the question, one has to study the relation between molecular,atomic and electro-magnetic radiation. In this section, the interaction between hydrogen atom
and absorption of electro-magnetic radiation is explained for simplification.
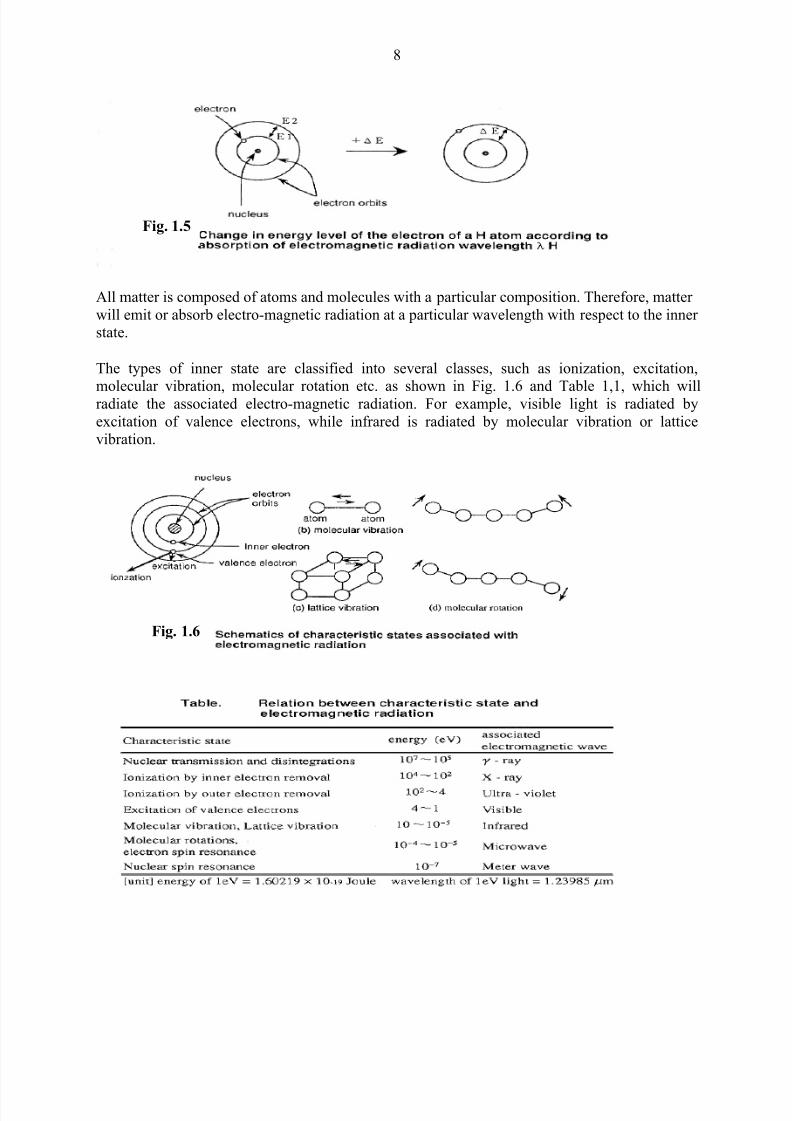
A hydrogen atom has a nucleus and an electron as shown in Fig. 1.5. The inner state of an atomdepends on the inherent and discrete energy level. The electron's orbit is determined by the
energy level. If electro-magnetic radiation is incident on an atom of H with a lower energy level (E1), a part of the energy is absorbed, and an electron is induced by excitation to rise to the
energy level (E2) resulting in the upper orbit.
The electro-magnetic energy E is given as follow.
E = hc /
where h : Plank's constant
c : velocity of light: wavelength
The difference of energy levelE = E2 - E1 = hc / H is absorbed.
In other words, the change of the inner state in an H-atom is only realized when electro-magnetic
radiation at the peculiar wavelength lH is absorbed in an H-atom. Conversely electro-magnetic
radiation at the wavelength H is radiated from an H-atom when the energy level changes from
E2 to E1.
Fig. 1.4
8/13/2019 What is Remote Sensing & Air Photo Interpretation
http://slidepdf.com/reader/full/what-is-remote-sensing-air-photo-interpretation 8/46
8
All matter is composed of atoms and molecules with a particular composition. Therefore, matter
will emit or absorb electro-magnetic radiation at a particular wavelength with respect to the innerstate.
The types of inner state are classified into several classes, such as ionization, excitation,
molecular vibration, molecular rotation etc. as shown in Fig. 1.6 and Table 1,1, which willradiate the associated electro-magnetic radiation. For example, visible light is radiated by
excitation of valence electrons, while infrared is radiated by molecular vibration or latticevibration.
Fig. 1.5
Fig. 1.6
8/13/2019 What is Remote Sensing & Air Photo Interpretation
http://slidepdf.com/reader/full/what-is-remote-sensing-air-photo-interpretation 9/46
9
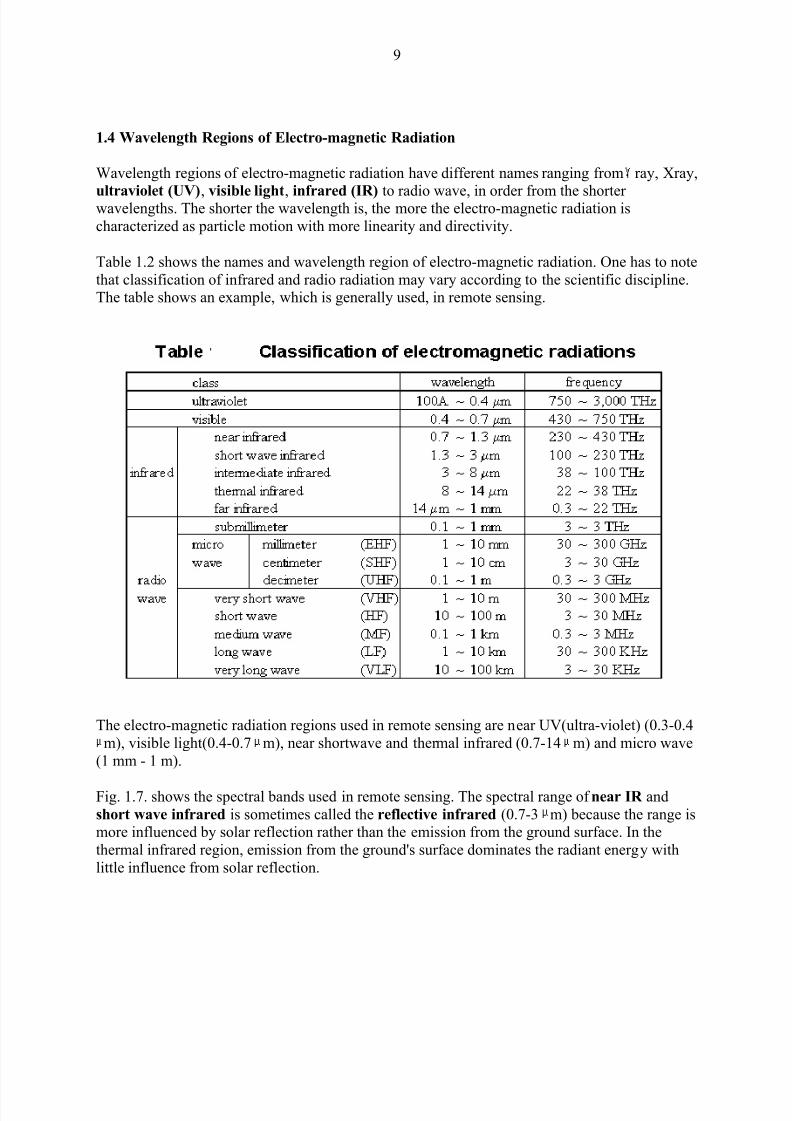
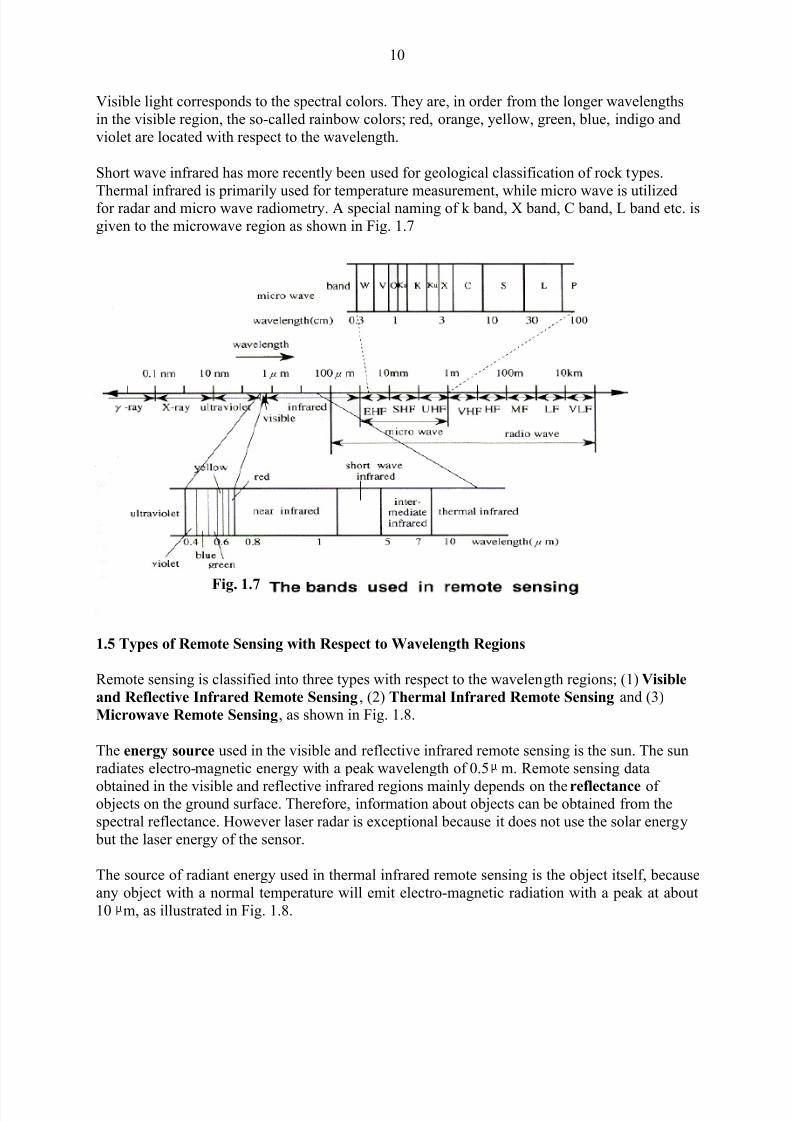
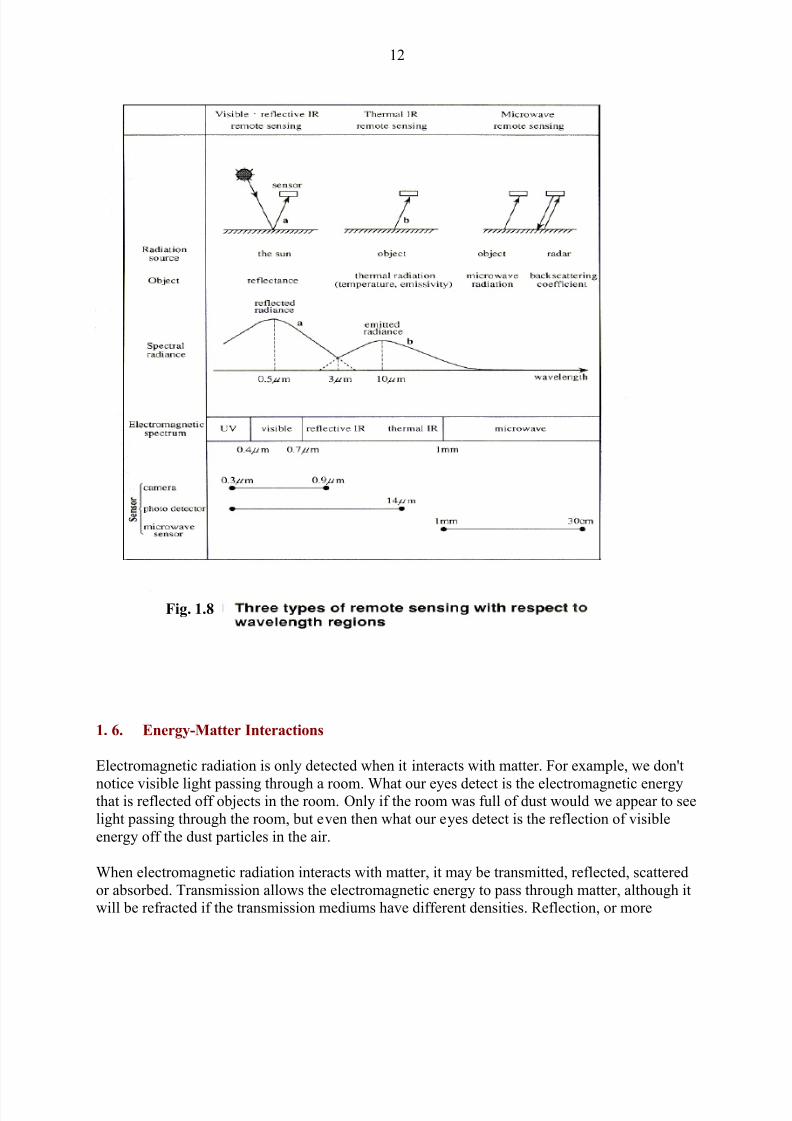
1.4 Wavelength Regions of Electro-magnetic Radiation
Wavelength regions of electro-magnetic radiation have different names ranging from ray, Xray,
ultraviolet (UV), visible light, infrared (IR) to radio wave, in order from the shorterwavelengths. The shorter the wavelength is, the more the electro-magnetic radiation is
characterized as particle motion with more linearity and directivity.
Table 1.2 shows the names and wavelength region of electro-magnetic radiation. One has to note
that classification of infrared and radio radiation may vary according to the scientific discipline.The table shows an example, which is generally used, in remote sensing.
The electro-magnetic radiation regions used in remote sensing are near UV(ultra-violet) (0.3-0.4
m), visible light(0.4-0.7 m), near shortwave and thermal infrared (0.7-14 m) and micro wave
(1 mm - 1 m).
Fig. 1.7. shows the spectral bands used in remote sensing. The spectral range of near IR and
short wave infrared is sometimes called the reflective infrared (0.7-3 m) because the range ismore influenced by solar reflection rather than the emission from the ground surface. In the
thermal infrared region, emission from the ground's surface dominates the radiant energy with
little influence from solar reflection.
8/13/2019 What is Remote Sensing & Air Photo Interpretation
http://slidepdf.com/reader/full/what-is-remote-sensing-air-photo-interpretation 10/46
8/13/2019 What is Remote Sensing & Air Photo Interpretation
http://slidepdf.com/reader/full/what-is-remote-sensing-air-photo-interpretation 11/46
11
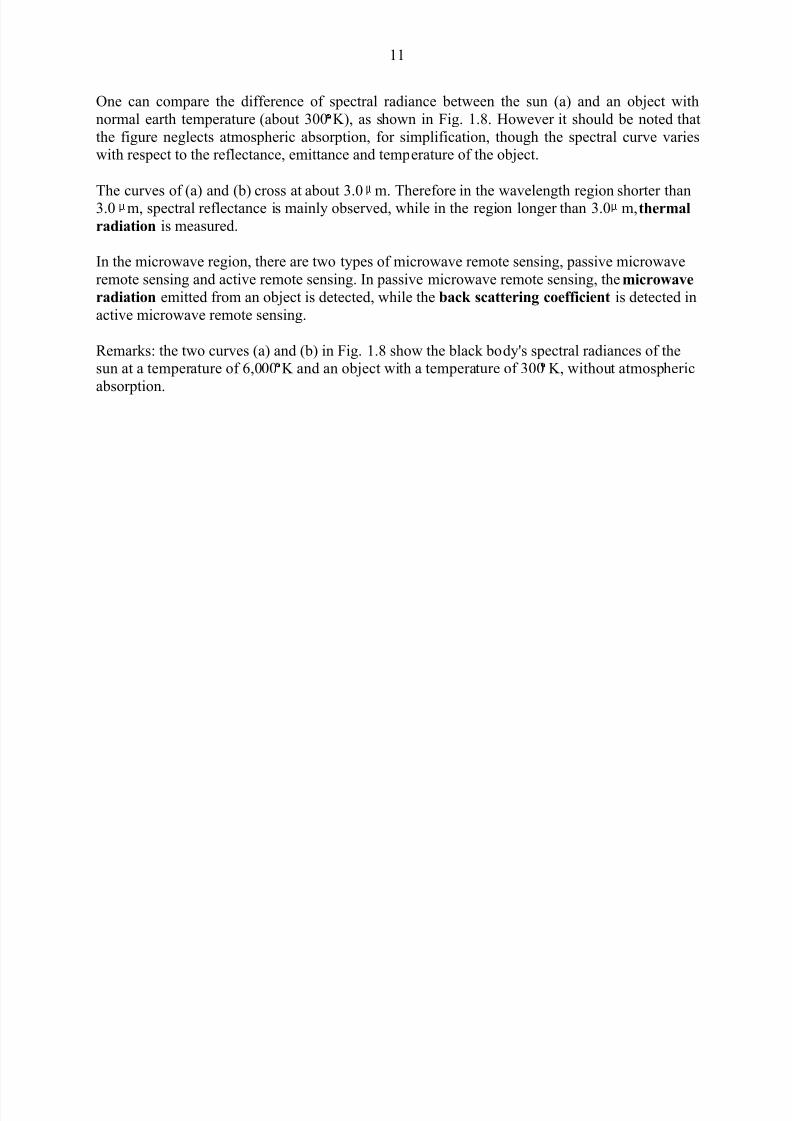
One can compare the difference of spectral radiance between the sun (a) and an object with
normal earth temperature (about 300 K), as shown in Fig. 1.8. However it should be noted that
the figure neglects atmospheric absorption, for simplification, though the spectral curve varieswith respect to the reflectance, emittance and temperature of the object.
The curves of (a) and (b) cross at about 3.0 m. Therefore in the wavelength region shorter than3.0 m, spectral reflectance is mainly observed, while in the region longer than 3.0 m, thermal
radiation is measured.
In the microwave region, there are two types of microwave remote sensing, passive microwave
remote sensing and active remote sensing. In passive microwave remote sensing, the microwave
radiation emitted from an object is detected, while the back scattering coefficient is detected in
active microwave remote sensing.
Remarks: the two curves (a) and (b) in Fig. 1.8 show the black body's spectral radiances of thesun at a temperature of 6,000 K and an object with a temperature of 300 K, without atmospheric
absorption.
8/13/2019 What is Remote Sensing & Air Photo Interpretation
http://slidepdf.com/reader/full/what-is-remote-sensing-air-photo-interpretation 12/46
12
1. 6. Energy-Matter Interactions
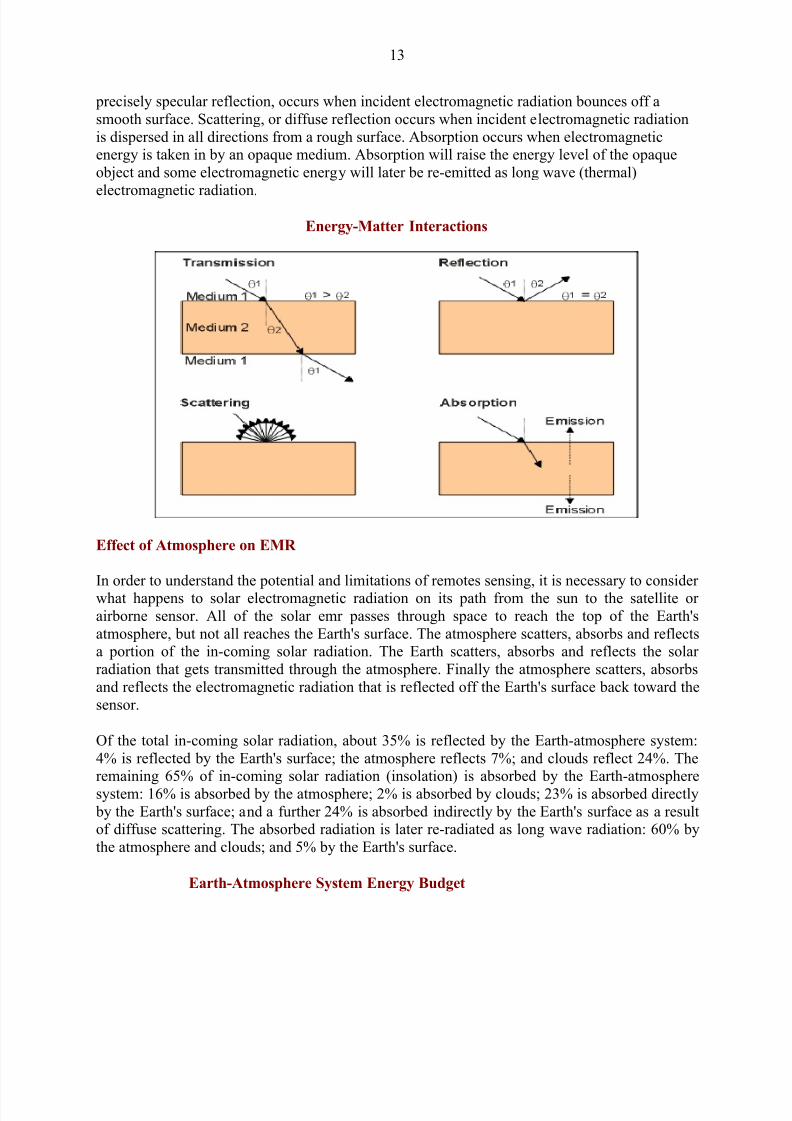
Electromagnetic radiation is only detected when it interacts with matter. For example, we don't
notice visible light passing through a room. What our eyes detect is the electromagnetic energythat is reflected off objects in the room. Only if the room was full of dust would we appear to see
light passing through the room, but even then what our eyes detect is the reflection of visible
energy off the dust particles in the air.
When electromagnetic radiation interacts with matter, it may be transmitted, reflected, scattered
or absorbed. Transmission allows the electromagnetic energy to pass through matter, although itwill be refracted if the transmission mediums have different densities. Reflection, or more
Fig. 1.8
8/13/2019 What is Remote Sensing & Air Photo Interpretation
http://slidepdf.com/reader/full/what-is-remote-sensing-air-photo-interpretation 13/46
13
precisely specular reflection, occurs when incident electromagnetic radiation bounces off a
smooth surface. Scattering, or diffuse reflection occurs when incident electromagnetic radiation
is dispersed in all directions from a rough surface. Absorption occurs when electromagneticenergy is taken in by an opaque medium. Absorption will raise the energy level of the opaque
object and some electromagnetic energy will later be re-emitted as long wave (thermal)
electromagnetic radiation.
Energy-Matter Interactions
Effect of Atmosphere on EMR
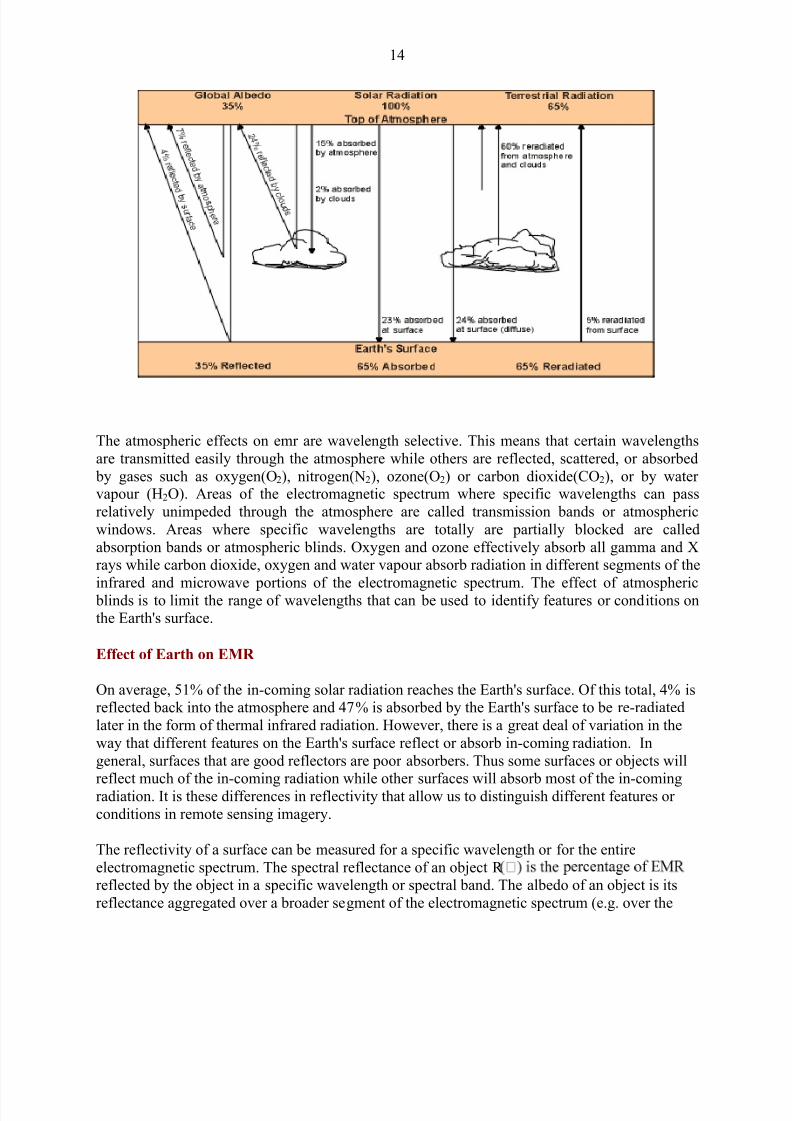
In order to understand the potential and limitations of remotes sensing, it is necessary to considerwhat happens to solar electromagnetic radiation on its path from the sun to the satellite or
airborne sensor. All of the solar emr passes through space to reach the top of the Earth's
atmosphere, but not all reaches the Earth's surface. The atmosphere scatters, absorbs and reflectsa portion of the in-coming solar radiation. The Earth scatters, absorbs and reflects the solar
radiation that gets transmitted through the atmosphere. Finally the atmosphere scatters, absorbs
and reflects the electromagnetic radiation that is reflected off the Earth's surface back toward the
sensor.
Of the total in-coming solar radiation, about 35% is reflected by the Earth-atmosphere system:
4% is reflected by the Earth's surface; the atmosphere reflects 7%; and clouds reflect 24%. Theremaining 65% of in-coming solar radiation (insolation) is absorbed by the Earth-atmosphere
system: 16% is absorbed by the atmosphere; 2% is absorbed by clouds; 23% is absorbed directly
by the Earth's surface; and a further 24% is absorbed indirectly by the Earth's surface as a resultof diffuse scattering. The absorbed radiation is later re-radiated as long wave radiation: 60% by
the atmosphere and clouds; and 5% by the Earth's surface.
Earth-Atmosphere System Energy Budget
8/13/2019 What is Remote Sensing & Air Photo Interpretation
http://slidepdf.com/reader/full/what-is-remote-sensing-air-photo-interpretation 14/46
14
The atmospheric effects on emr are wavelength selective. This means that certain wavelengths
are transmitted easily through the atmosphere while others are reflected, scattered, or absorbed
by gases such as oxygen(O2), nitrogen(N2), ozone(O2) or carbon dioxide(CO2), or by watervapour (H2O). Areas of the electromagnetic spectrum where specific wavelengths can pass
relatively unimpeded through the atmosphere are called transmission bands or atmospheric
windows. Areas where specific wavelengths are totally are partially blocked are called
absorption bands or atmospheric blinds. Oxygen and ozone effectively absorb all gamma and Xrays while carbon dioxide, oxygen and water vapour absorb radiation in different segments of the
infrared and microwave portions of the electromagnetic spectrum. The effect of atmospheric blinds is to limit the range of wavelengths that can be used to identify features or conditions onthe Earth's surface.
Effect of Earth on EMR
On average, 51% of the in-coming solar radiation reaches the Earth's surface. Of this total, 4% isreflected back into the atmosphere and 47% is absorbed by the Earth's surface to be re-radiated
later in the form of thermal infrared radiation. However, there is a great deal of variation in the
way that different features on the Earth's surface reflect or absorb in-coming radiation. In
general, surfaces that are good reflectors are poor absorbers. Thus some surfaces or objects will
reflect much of the in-coming radiation while other surfaces will absorb most of the in-comingradiation. It is these differences in reflectivity that allow us to distinguish different features or
conditions in remote sensing imagery.
The reflectivity of a surface can be measured for a specific wavelength or for the entire
electromagnetic spectrum. The spectral reflectance of an object R reflected by the object in a specific wavelength or spectral band. The albedo of an object is its
reflectance aggregated over a broader segment of the electromagnetic spectrum (e.g. over the
8/13/2019 What is Remote Sensing & Air Photo Interpretation
http://slidepdf.com/reader/full/what-is-remote-sensing-air-photo-interpretation 15/46
15
visible portion of the spectrum) or over the entire spectrum. The higher the albedo, the more
reflective the surface and the brighter the surface will appear in remotely sensed imagery.
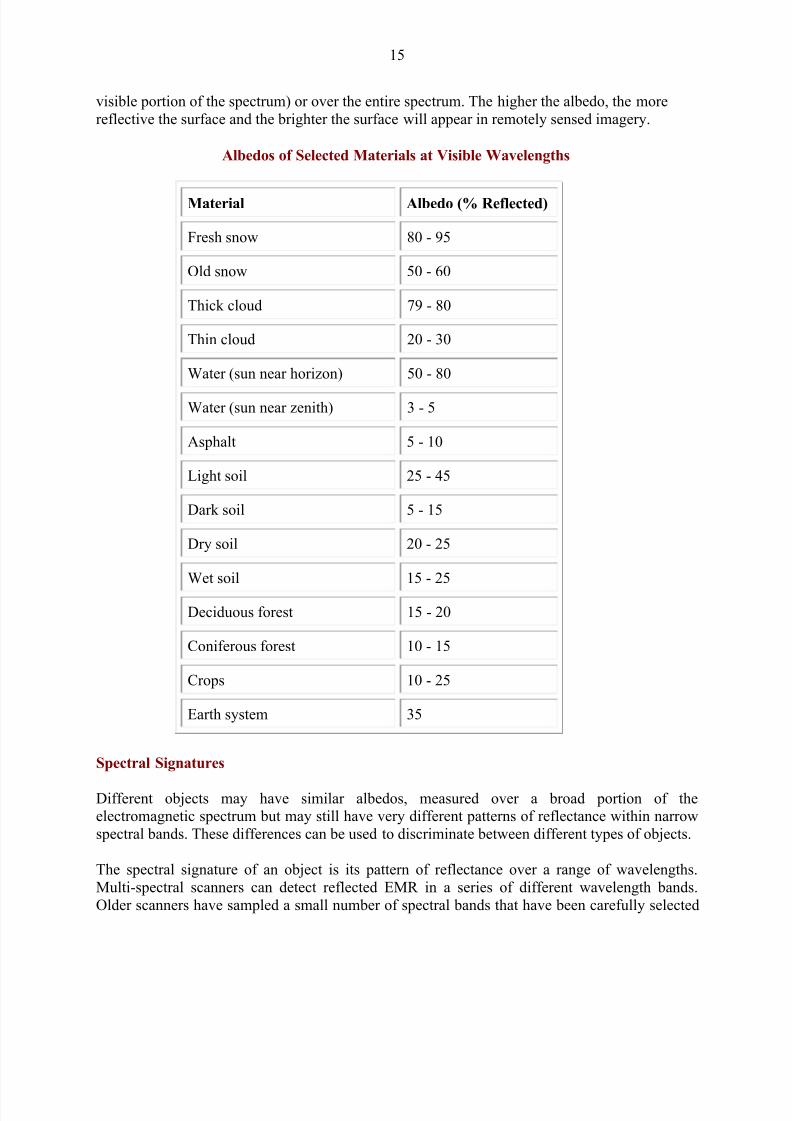
Albedos of Selected Materials at Visible Wavelengths
Material Albedo (% Reflected)
Fresh snow 80 - 95
Old snow 50 - 60
Thick cloud 79 - 80
Thin cloud 20 - 30
Water (sun near horizon) 50 - 80
Water (sun near zenith) 3 - 5
Asphalt 5 - 10
Light soil 25 - 45
Dark soil 5 - 15
Dry soil 20 - 25
Wet soil 15 - 25
Deciduous forest 15 - 20
Coniferous forest 10 - 15
Crops 10 - 25
Earth system 35
Spectral Signatures
Different objects may have similar albedos, measured over a broad portion of theelectromagnetic spectrum but may still have very different patterns of reflectance within narrow
spectral bands. These differences can be used to discriminate between different types of objects.
The spectral signature of an object is its pattern of reflectance over a range of wavelengths.
Multi-spectral scanners can detect reflected EMR in a series of different wavelength bands.
Older scanners have sampled a small number of spectral bands that have been carefully selected
8/13/2019 What is Remote Sensing & Air Photo Interpretation
http://slidepdf.com/reader/full/what-is-remote-sensing-air-photo-interpretation 16/46
16
to suit particular purposes. New hyper-spectral scanners can sample 100s of spectral bands and
offer the potential for a much broader range of remote sensing applications.
Spectral signatures are not unlimited in their ability to discriminate between different types of
surfaces or objects. Spectral signatures are not necessarily unique. Objects that have similar
spectral signatures will be difficult or impossible to tell apart. Spectral signatures also depend onthe time of day since shadows affect the pattern of reflected EMR.
Spectral signatures for different surfaces can be obtained using a device called a radiometer. Theradiometer detects the EMR reflected off a surface in a specified spectral band. By measuring
reflectance in many different bands, the spectral signature over the full range of wavelengths can
be obtained.
Electro-optical scanners such as Landsat MSS or Thematic Mapper are designed to detect EMR
in narrow spectral bands. Photographic film records reflected EMR over a broad portion of theelectromagnetic spectrum. However, a wide variety of filters can be used to make photographic
film more selective.
1.7 Black Body Radiation
An object radiates unique spectral radiant flux depending on the temperature and emissivity ofthe object. This radiation is called thermal radiation because it mainly depends on temperature.
Thermal radiation can be expressed in terms of black body theory.
A black body is matter, which absorbs all electro-magnetic energy, incident upon it and does not
reflect nor transmit any energy. According to Kirchhoff's law the ratio of the radiated energy
from an object in thermal static equilibrium, to the absorbed energy is constant and only
dependent on the wavelength and the temperature T. A black body shows the maximum radiationas compared with other matter. Therefore a black body is called a perfect radiator.
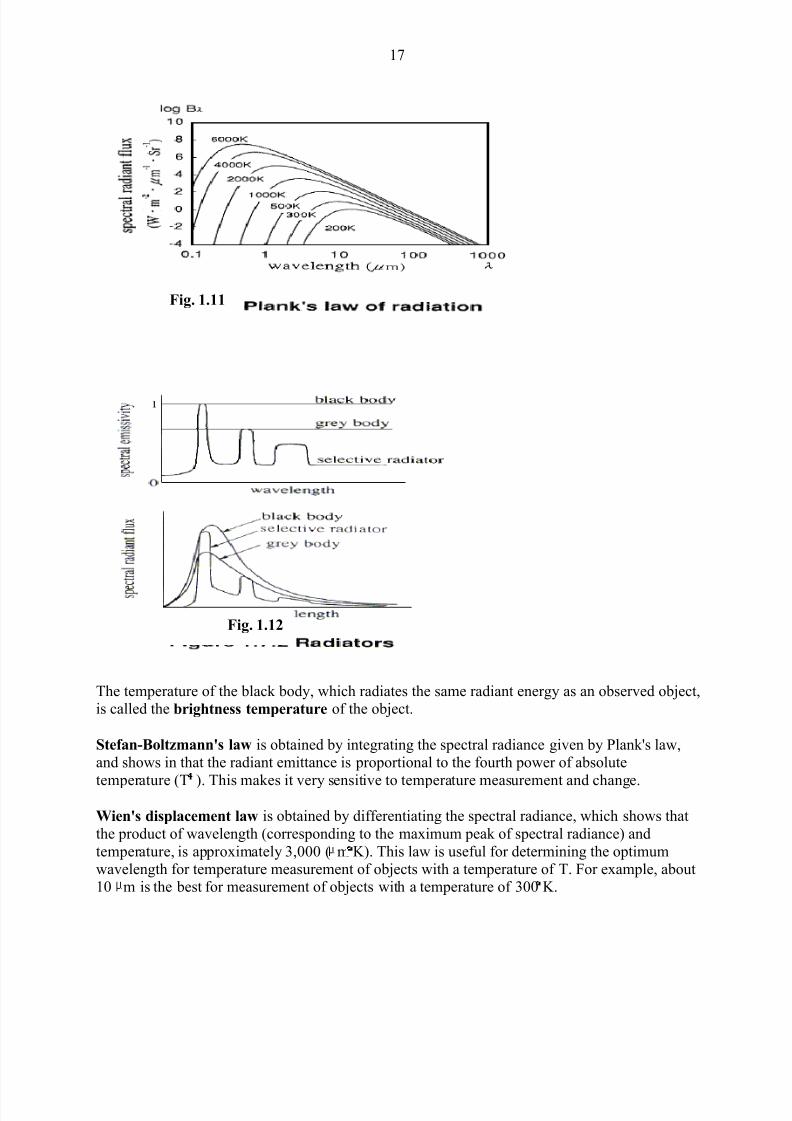
Black body radiation is defined as thermal radiation of a black body, and can be given by
Plank's law as a function of temperature T and wavelength as shown in Fig. 1.11 and Table 1.4.
In remote sensing, a correction for emissivity should be made because normal observed objects
are not black bodies. Emissivity can be defined by the following formula-
Emissivity ranges between 0 and 1 depending on the dielectric constant of the object, surfaceroughness, temperature, wavelength, look angle etc. Fig. 1.12 shows the spectral emissivity and
spectral radiant flux for three objects that are a back body, a gray body and a selective radiator.
8/13/2019 What is Remote Sensing & Air Photo Interpretation
http://slidepdf.com/reader/full/what-is-remote-sensing-air-photo-interpretation 17/46
17
The temperature of the black body, which radiates the same radiant energy as an observed object,is called the brightness temperature of the object.
Stefan-Boltzmann's law is obtained by integrating the spectral radiance given by Plank's law,and shows in that the radiant emittance is proportional to the fourth power of absolute
temperature (T ). This makes it very sensitive to temperature measurement and change.
Wien's displacement law is obtained by differentiating the spectral radiance, which shows that
the product of wavelength (corresponding to the maximum peak of spectral radiance) and
temperature, is approximately 3,000 ( m K). This law is useful for determining the optimumwavelength for temperature measurement of objects with a temperature of T. For example, about10 m is the best for measurement of objects with a temperature of 300 K.
Fig. 1.12
Fig. 1.11
8/13/2019 What is Remote Sensing & Air Photo Interpretation
http://slidepdf.com/reader/full/what-is-remote-sensing-air-photo-interpretation 18/46
18
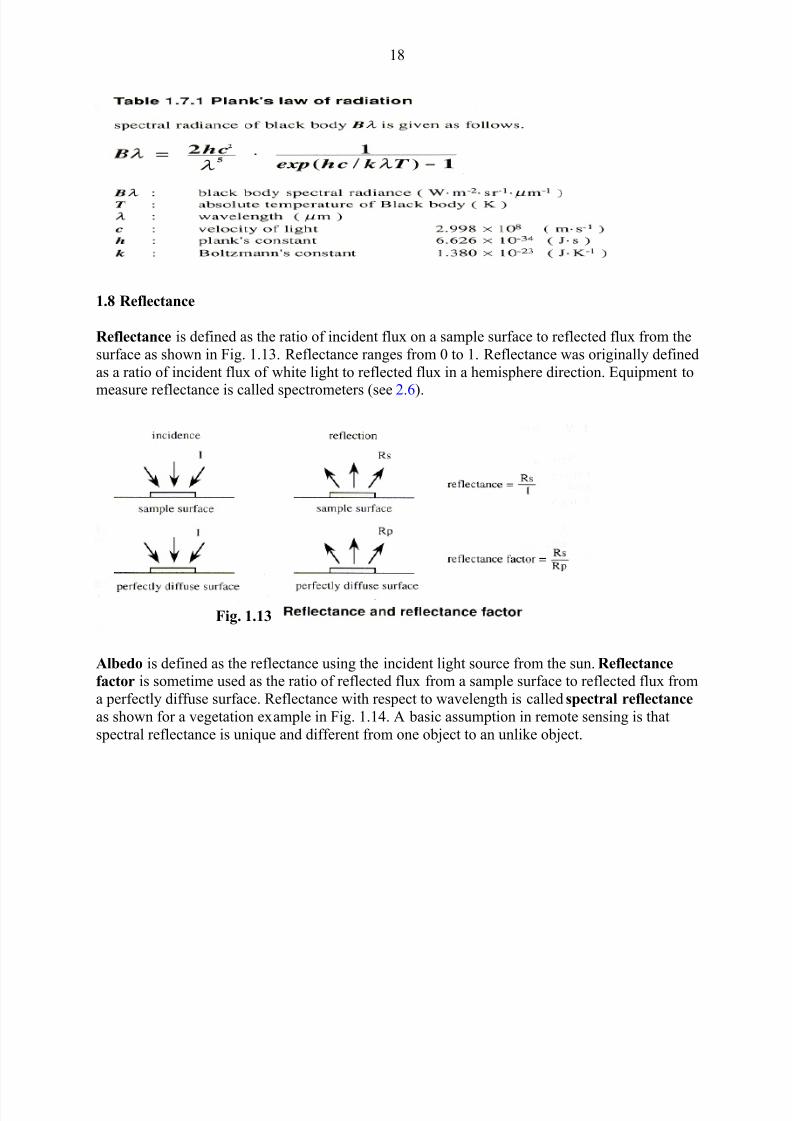
1.8 Reflectance
Reflectance is defined as the ratio of incident flux on a sample surface to reflected flux from the
surface as shown in Fig. 1.13. Reflectance ranges from 0 to 1. Reflectance was originally defined
as a ratio of incident flux of white light to reflected flux in a hemisphere direction. Equipment to
measure reflectance is called spectrometers (see 2.6).
Albedo is defined as the reflectance using the incident light source from the sun. Reflectance
factor is sometime used as the ratio of reflected flux from a sample surface to reflected flux from
a perfectly diffuse surface. Reflectance with respect to wavelength is called spectral reflectance
as shown for a vegetation example in Fig. 1.14. A basic assumption in remote sensing is that
spectral reflectance is unique and different from one object to an unlike object.
Fig. 1.13
8/13/2019 What is Remote Sensing & Air Photo Interpretation
http://slidepdf.com/reader/full/what-is-remote-sensing-air-photo-interpretation 19/46
19
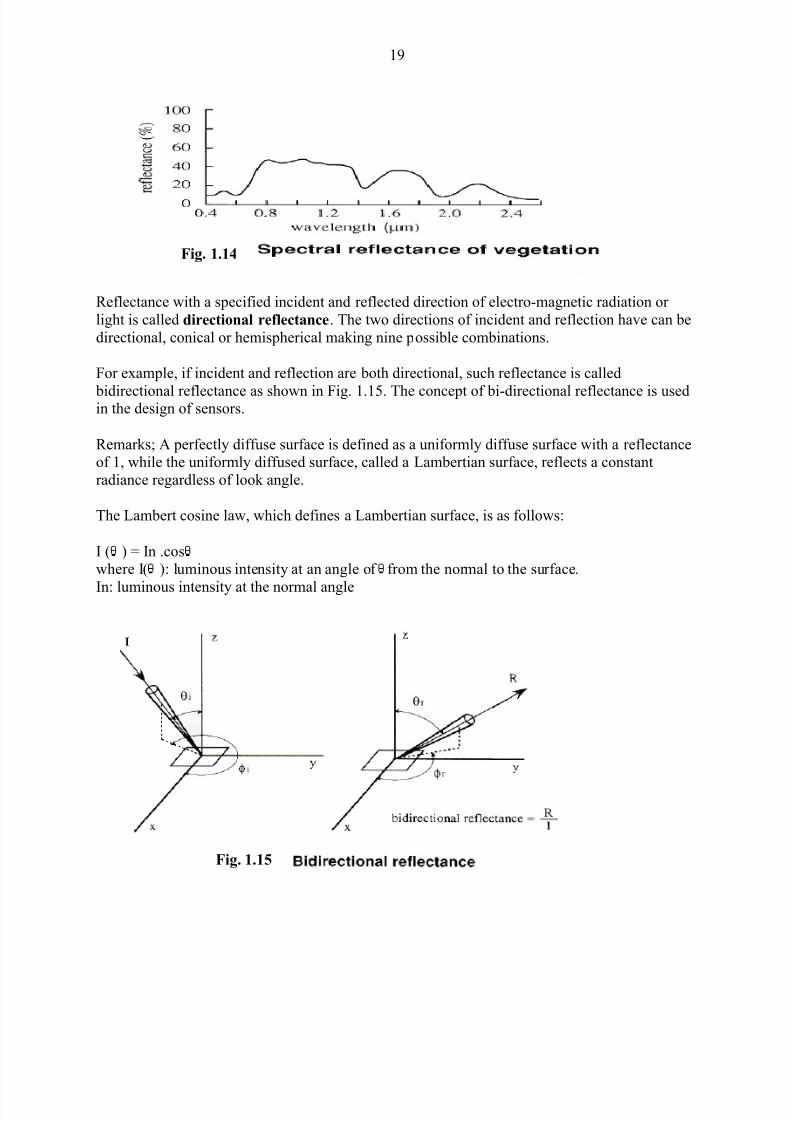
Reflectance with a specified incident and reflected direction of electro-magnetic radiation or
light is called directional reflectance. The two directions of incident and reflection have can be
directional, conical or hemispherical making nine possible combinations.
For example, if incident and reflection are both directional, such reflectance is called
bidirectional reflectance as shown in Fig. 1.15. The concept of bi-directional reflectance is usedin the design of sensors.
Remarks; A perfectly diffuse surface is defined as a uniformly diffuse surface with a reflectanceof 1, while the uniformly diffused surface, called a Lambertian surface, reflects a constant
radiance regardless of look angle.
The Lambert cosine law, which defines a Lambertian surface, is as follows:
I ( ) = In .coswhere I( ): luminous intensity at an angle of from the normal to the surface.
In: luminous intensity at the normal angle
Fig. 1.14
Fig. 1.15
8/13/2019 What is Remote Sensing & Air Photo Interpretation
http://slidepdf.com/reader/full/what-is-remote-sensing-air-photo-interpretation 20/46
20
1.9 Spectral Reflectance of Land Covers
Spectral reflectance is assumed to be different with respect to the type of land cover. This is the principle that in many cases allows the identification of land covers with remote sensing by
observing the spectral reflectance or spectral radiance from a distance far removed from the
surface.
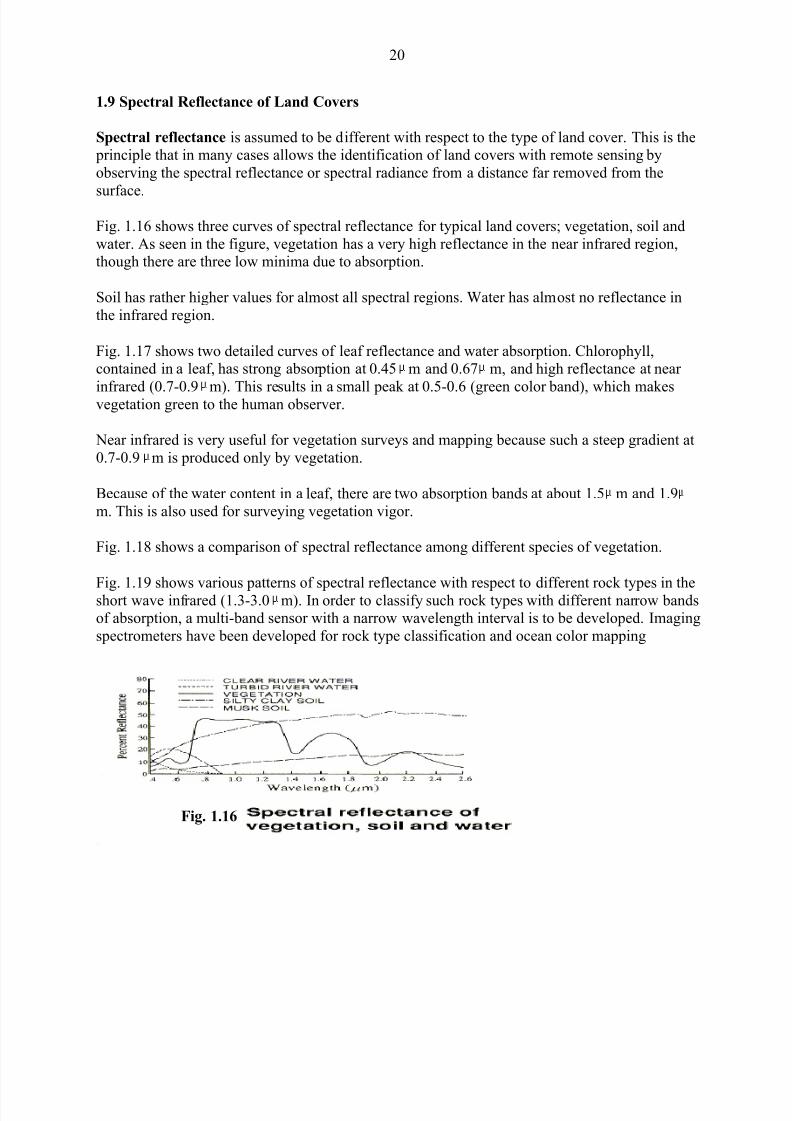
Fig. 1.16 shows three curves of spectral reflectance for typical land covers; vegetation, soil and
water. As seen in the figure, vegetation has a very high reflectance in the near infrared region,though there are three low minima due to absorption.
Soil has rather higher values for almost all spectral regions. Water has almost no reflectance in
the infrared region.
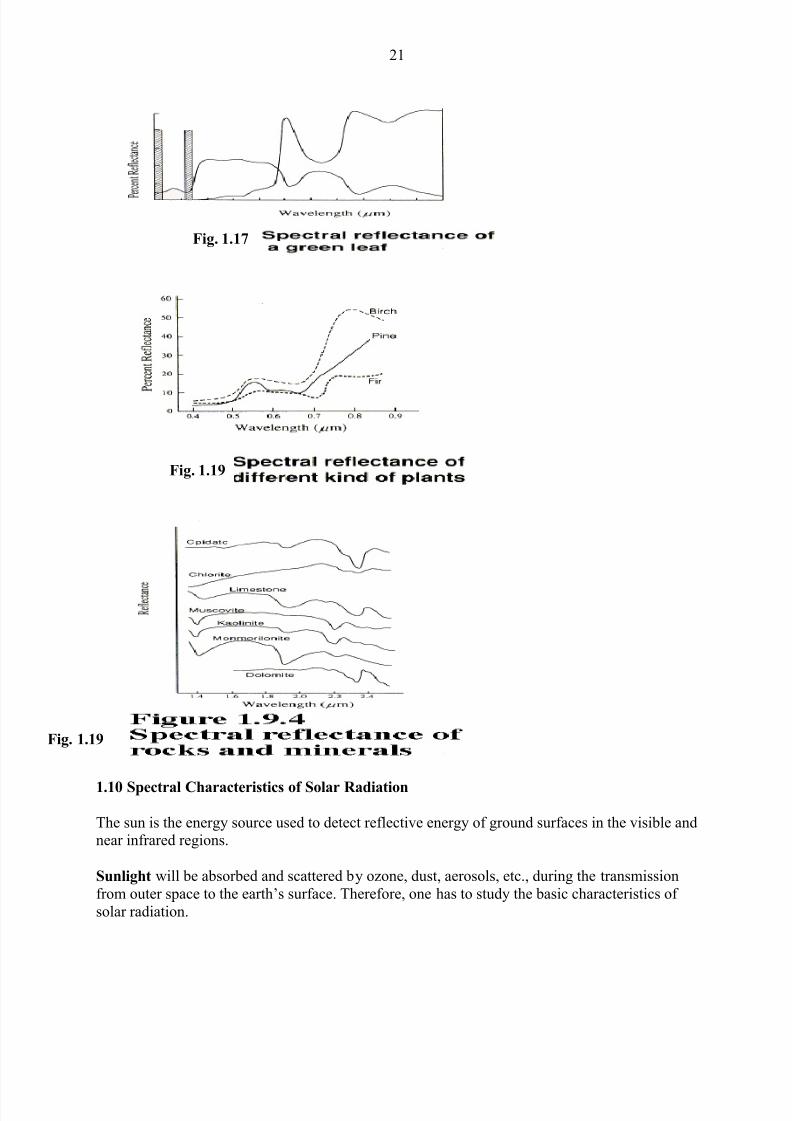
Fig. 1.17 shows two detailed curves of leaf reflectance and water absorption. Chlorophyll,contained in a leaf, has strong absorption at 0.45 m and 0.67 m, and high reflectance at near
infrared (0.7-0.9 m). This results in a small peak at 0.5-0.6 (green color band), which makesvegetation green to the human observer.
Near infrared is very useful for vegetation surveys and mapping because such a steep gradient at
0.7-0.9 m is produced only by vegetation.
Because of the water content in a leaf, there are two absorption bands at about 1.5 m and 1.9
m. This is also used for surveying vegetation vigor.
Fig. 1.18 shows a comparison of spectral reflectance among different species of vegetation.
Fig. 1.19 shows various patterns of spectral reflectance with respect to different rock types in theshort wave infrared (1.3-3.0 m). In order to classify such rock types with different narrow bandsof absorption, a multi-band sensor with a narrow wavelength interval is to be developed. Imaging
spectrometers have been developed for rock type classification and ocean color mapping
Fig. 1.16
8/13/2019 What is Remote Sensing & Air Photo Interpretation
http://slidepdf.com/reader/full/what-is-remote-sensing-air-photo-interpretation 21/46
21
1.10 Spectral Characteristics of Solar Radiation
The sun is the energy source used to detect reflective energy of ground surfaces in the visible andnear infrared regions.
Sunlight will be absorbed and scattered by ozone, dust, aerosols, etc., during the transmission
from outer space to the earth’s surface. Therefore, one has to study the basic characteristics of
solar radiation.
Fig. 1.17
Fig. 1.19
Fig. 1.19
8/13/2019 What is Remote Sensing & Air Photo Interpretation
http://slidepdf.com/reader/full/what-is-remote-sensing-air-photo-interpretation 22/46
22
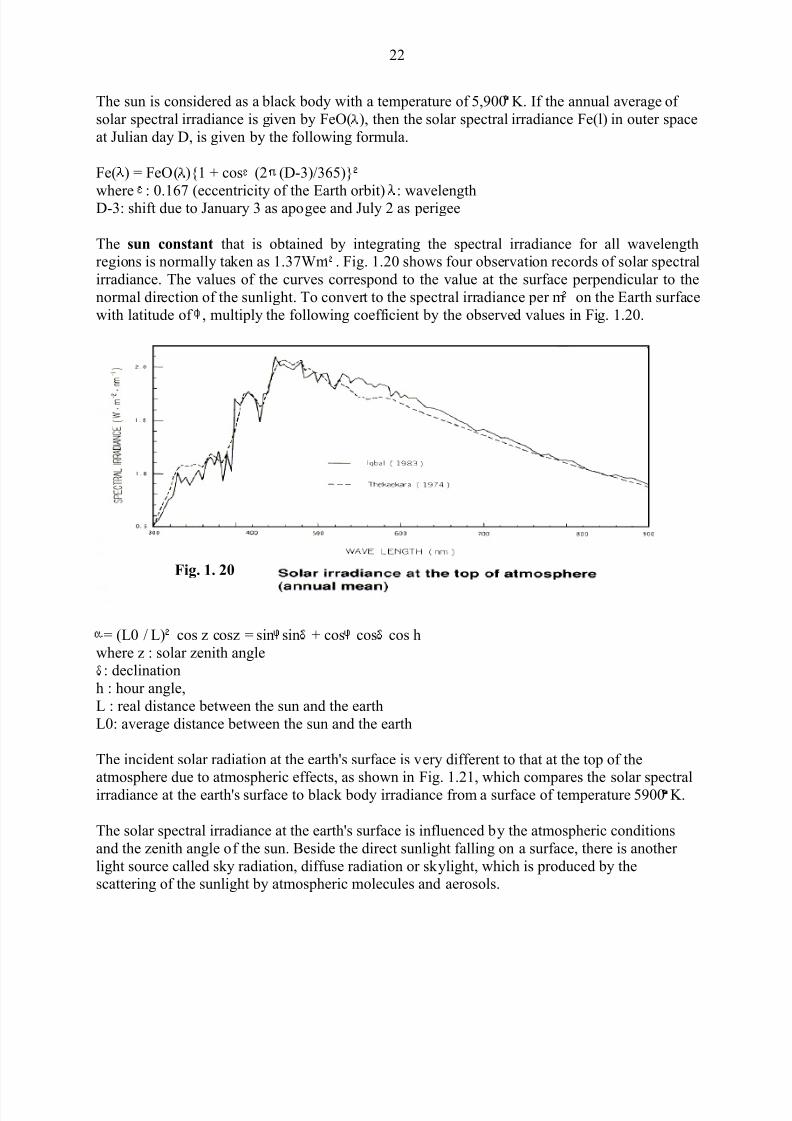
The sun is considered as a black body with a temperature of 5,900 K. If the annual average of
solar spectral irradiance is given by FeO( ), then the solar spectral irradiance Fe(l) in outer space
at Julian day D, is given by the following formula.
Fe( ) = FeO( ){1 + cos (2 (D-3)/365)}
where : 0.167 (eccentricity of the Earth orbit) : wavelengthD-3: shift due to January 3 as apogee and July 2 as perigee
The sun constant that is obtained by integrating the spectral irradiance for all wavelengthregions is normally taken as 1.37Wm . Fig. 1.20 shows four observation records of solar spectral
irradiance. The values of the curves correspond to the value at the surface perpendicular to the
normal direction of the sunlight. To convert to the spectral irradiance per m on the Earth surface
with latitude of , multiply the following coefficient by the observed values in Fig. 1.20.
= (L0 / L) cos z cosz = sin sin + cos cos cos h
where z : solar zenith angle: declination
h : hour angle,
L : real distance between the sun and the earth
L0: average distance between the sun and the earth
The incident solar radiation at the earth's surface is very different to that at the top of theatmosphere due to atmospheric effects, as shown in Fig. 1.21, which compares the solar spectral
irradiance at the earth's surface to black body irradiance from a surface of temperature 5900 K.
The solar spectral irradiance at the earth's surface is influenced by the atmospheric conditions
and the zenith angle of the sun. Beside the direct sunlight falling on a surface, there is another
light source called sky radiation, diffuse radiation or skylight, which is produced by thescattering of the sunlight by atmospheric molecules and aerosols.
Fig. 1. 20
8/13/2019 What is Remote Sensing & Air Photo Interpretation
http://slidepdf.com/reader/full/what-is-remote-sensing-air-photo-interpretation 23/46
23
The skylight is about 10 percent of the direct sunlight when the sky is clear and the sun's
elevation angle is about 50 degree. The skylight has a peak in its spectral characteristic curve at a
wavelength of 0.45 m.
1.11 Transmittance of the Atmosphere
The sunlight's transmission through the atmosphere is affected by absorption and scattering ofatmospheric molecules and aerosols. The reduction of sunlight intensity is called extinction. The
rate of extinction is expressed as extinction coefficient.
The optical thickness of the atmosphere corresponds to the integrated value of the extinctioncoefficient at each altitude by the atmospheric thickness. The optical thickness indicates the
magnitude of absorption and scattering of the sunlight. The following elements will influence the
transmittance of the atmosphere.
a. Atmospheric molecules (smaller size than wavelength):
carbon dioxygen, ozone, nitrogen gas, and other molecules
b. Aerosols (larger size than wavelength):
water drops such as fog and haze, smog, dust and other particles with a bigger size
Scattering by atmospheric molecules with a smaller size than the wavelength of the sunlight is
called Rayleigh scattering. Raleigh scattering is inversely proportional to the fourth power of
the wavelength.
The contribution of atmospheric molecules to the optical thickness is almost constant spatially
and with time, although it varies somewhat depending on the season and the latitude.
Scattering by aerosols with larger size than the wavelength of the sunlight is called Mie
scattering. The source of aerosols will be suspended particles such as sea water or dust in the
atmosphere blown from the sea or the ground, urban garbage, industrial smoke, volcanic ashes
etc., which varies to a great extent depending upon the location and the time. In addition, the
optical characteristics and the size distribution also change with respect to humidity, temperatureand other environmental conditions. This makes it difficult to measure the effect of aerosol
scattering.
8/13/2019 What is Remote Sensing & Air Photo Interpretation
http://slidepdf.com/reader/full/what-is-remote-sensing-air-photo-interpretation 24/46
24
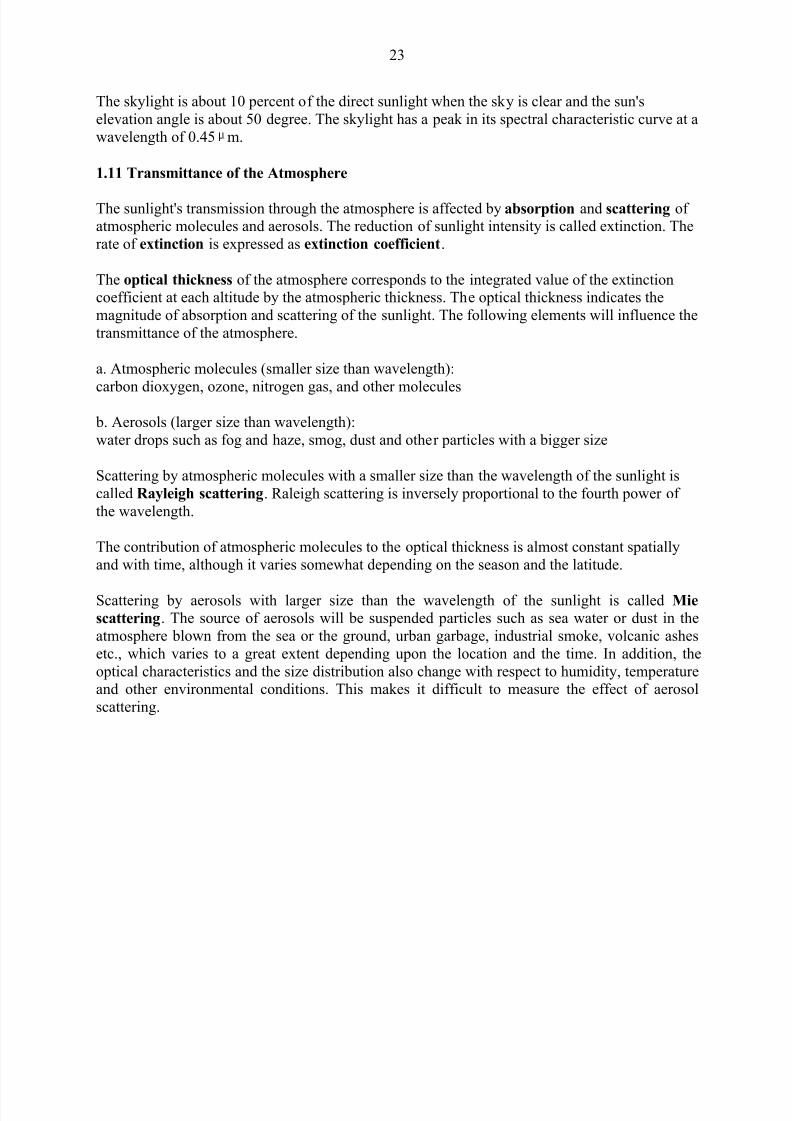
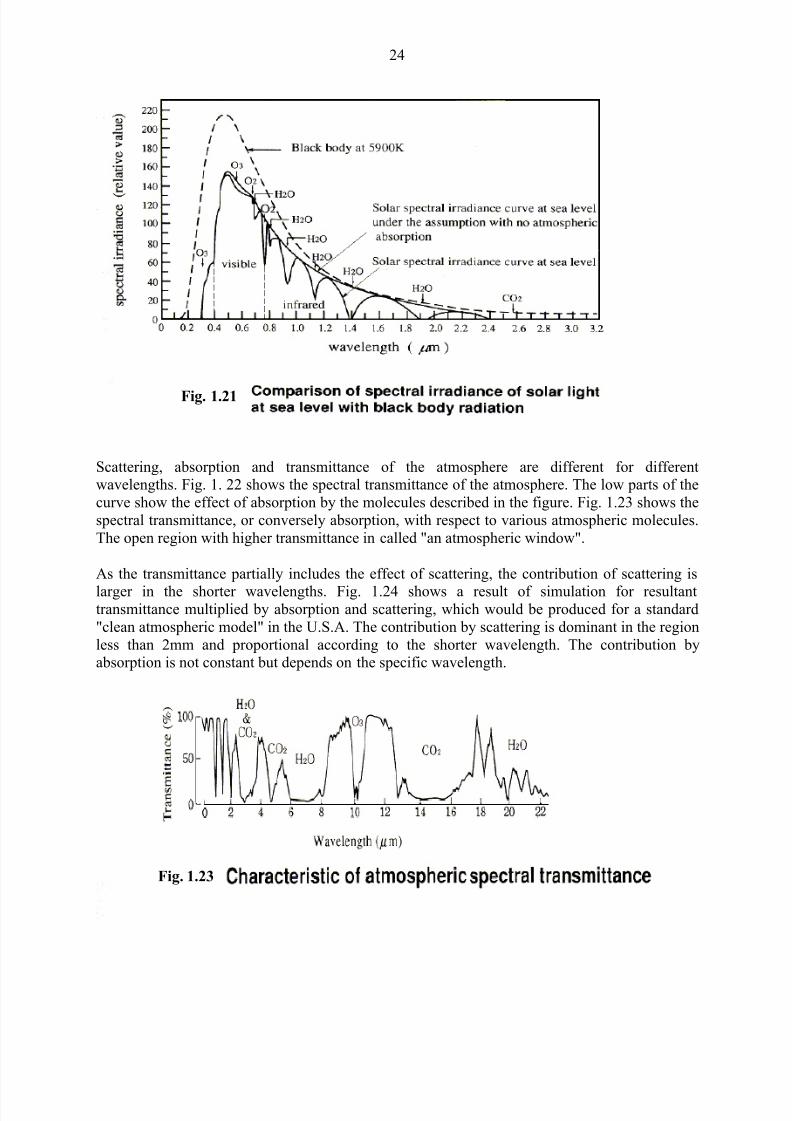
Scattering, absorption and transmittance of the atmosphere are different for differentwavelengths. Fig. 1. 22 shows the spectral transmittance of the atmosphere. The low parts of the
curve show the effect of absorption by the molecules described in the figure. Fig. 1.23 shows the
spectral transmittance, or conversely absorption, with respect to various atmospheric molecules.
The open region with higher transmittance in called "an atmospheric window".
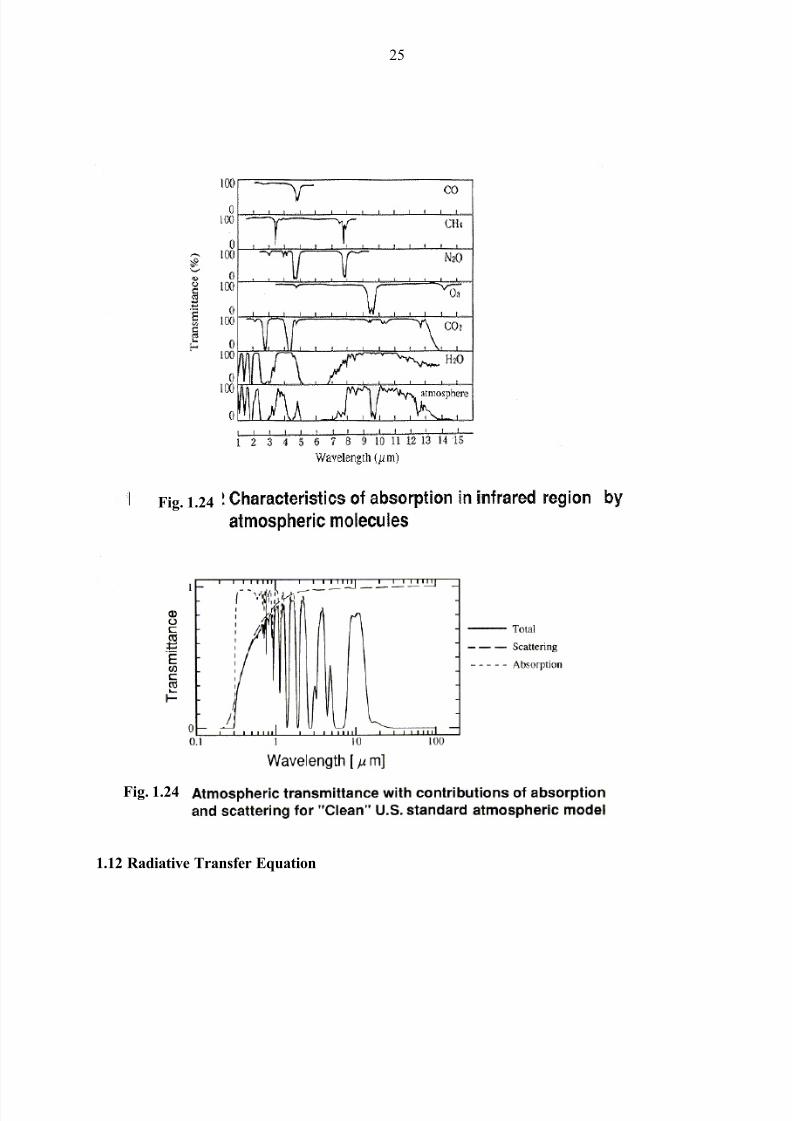
As the transmittance partially includes the effect of scattering, the contribution of scattering is
larger in the shorter wavelengths. Fig. 1.24 shows a result of simulation for resultanttransmittance multiplied by absorption and scattering, which would be produced for a standard
"clean atmospheric model" in the U.S.A. The contribution by scattering is dominant in the region
less than 2mm and proportional according to the shorter wavelength. The contribution byabsorption is not constant but depends on the specific wavelength.
Fig. 1.21
Fig. 1.23
8/13/2019 What is Remote Sensing & Air Photo Interpretation
http://slidepdf.com/reader/full/what-is-remote-sensing-air-photo-interpretation 25/46
25
1.12 Radiative Transfer Equation
Fig. 1.24
Fig. 1.24
8/13/2019 What is Remote Sensing & Air Photo Interpretation
http://slidepdf.com/reader/full/what-is-remote-sensing-air-photo-interpretation 26/46
26
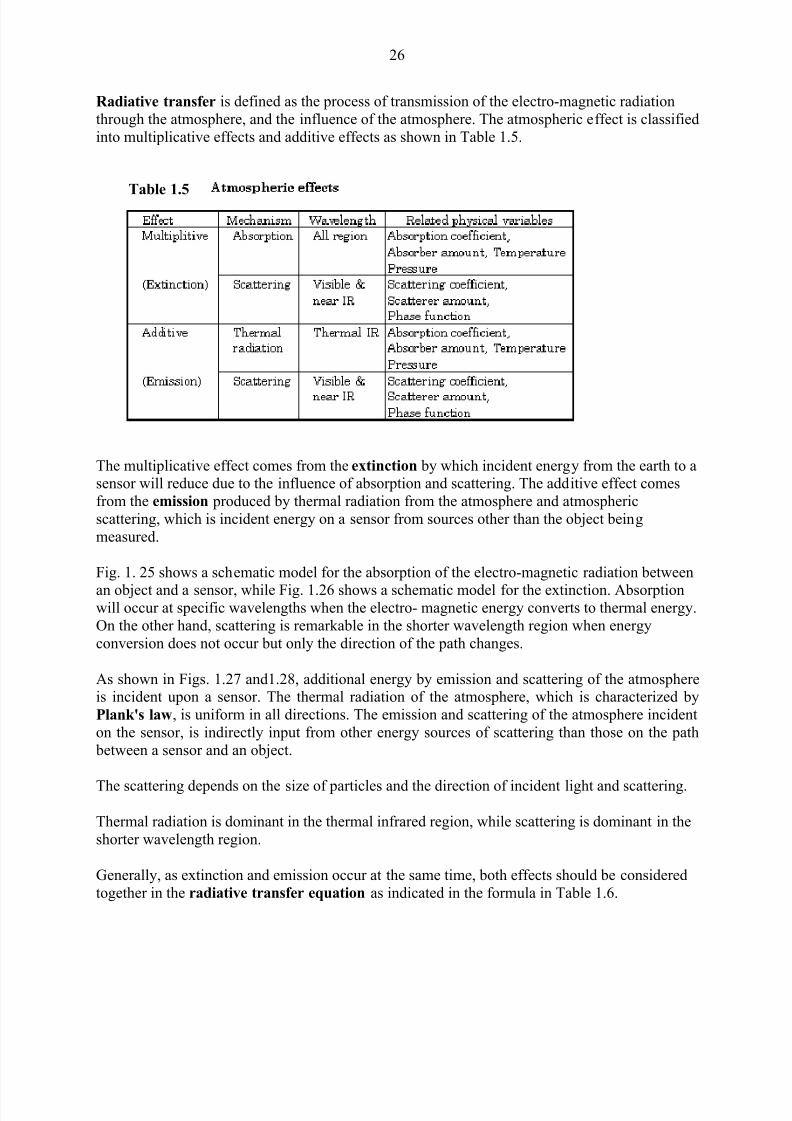
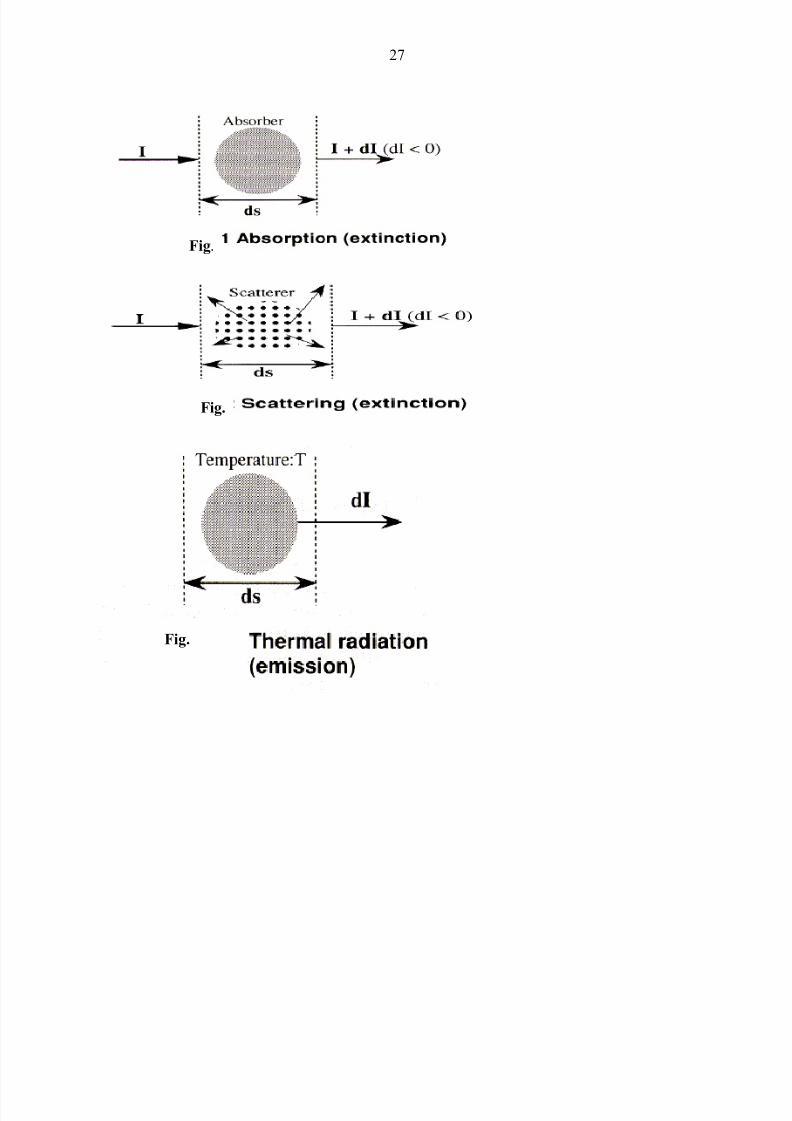
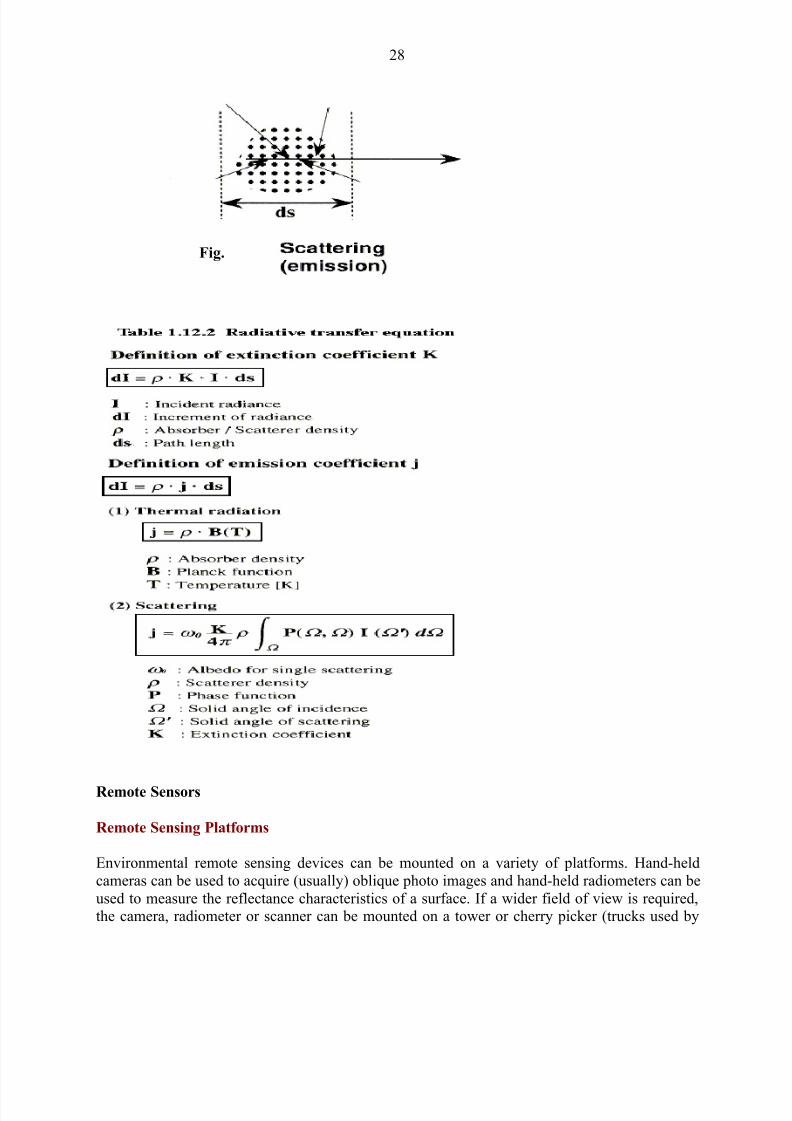
Radiative transfer is defined as the process of transmission of the electro-magnetic radiation
through the atmosphere, and the influence of the atmosphere. The atmospheric effect is classified
into multiplicative effects and additive effects as shown in Table 1.5.
The multiplicative effect comes from the extinction by which incident energy from the earth to asensor will reduce due to the influence of absorption and scattering. The additive effect comes
from the emission produced by thermal radiation from the atmosphere and atmospheric
scattering, which is incident energy on a sensor from sources other than the object being
measured.
Fig. 1. 25 shows a schematic model for the absorption of the electro-magnetic radiation between
an object and a sensor, while Fig. 1.26 shows a schematic model for the extinction. Absorptionwill occur at specific wavelengths when the electro- magnetic energy converts to thermal energy.
On the other hand, scattering is remarkable in the shorter wavelength region when energy
conversion does not occur but only the direction of the path changes.
As shown in Figs. 1.27 and1.28, additional energy by emission and scattering of the atmosphereis incident upon a sensor. The thermal radiation of the atmosphere, which is characterized by
Plank's law, is uniform in all directions. The emission and scattering of the atmosphere incident
on the sensor, is indirectly input from other energy sources of scattering than those on the path
between a sensor and an object.
The scattering depends on the size of particles and the direction of incident light and scattering.
Thermal radiation is dominant in the thermal infrared region, while scattering is dominant in the
shorter wavelength region.
Generally, as extinction and emission occur at the same time, both effects should be considered
together in the radiative transfer equation as indicated in the formula in Table 1.6.
Table 1.5
8/13/2019 What is Remote Sensing & Air Photo Interpretation
http://slidepdf.com/reader/full/what-is-remote-sensing-air-photo-interpretation 27/46
27
Fig.
Fig.
Fig.
8/13/2019 What is Remote Sensing & Air Photo Interpretation
http://slidepdf.com/reader/full/what-is-remote-sensing-air-photo-interpretation 28/46
28
Remote Sensors
Remote Sensing Platforms
Environmental remote sensing devices can be mounted on a variety of platforms. Hand-held
cameras can be used to acquire (usually) oblique photo images and hand-held radiometers can be
used to measure the reflectance characteristics of a surface. If a wider field of view is required,the camera, radiometer or scanner can be mounted on a tower or cherry picker (trucks used by
Fig.
8/13/2019 What is Remote Sensing & Air Photo Interpretation
http://slidepdf.com/reader/full/what-is-remote-sensing-air-photo-interpretation 29/46
29
hydro department to repair electrical lines or replace burnt out street lamps). These platforms are
commonly used to collect radiometer data representing the reflectance of different surfaces or
land cover types. For mapping and analysis of spatial patterns, however, we usually rely onremote sensing devices mounted on low or high altitude aircraft or on satellites. In general, the
higher the altitude of the platform, the smaller the scale of the resulting remote sensing imagery,
although scale is also dependent on the configuration of the remote sensing device.
Cameras
Photographic Camera/Film Systems
The term "photographic" refers to systems that use films coated with photosensitive silver halide
emulsions to record an image. Silver halide crystals are structurally changed when exposed to
light, producing a latent image on the film. When the exposed film is placed in a developer
solution, the silver halide crystals turn to black metallic silver. The speed of this transformationdepends upon the intensity of light striking the silver halide crystals at the instant of exposure:
crystals exposed to intense light turn black very quickly while crystals exposed to less intenselight turn black more slowly. The development process can be arrested by rinsing the film to
remove all traces of the developer solution. The result is a continuous tone negative (bright spotsappear black and vice versa) image.
Photographic camera/film systems have been used since the first decades of the 20th century tocollect spatial data. Aerial photographs are the primary data input for production of topographic
maps, although various types of "ground truth" information are needed to verify interpretation of
the air photo imagery and to ensure accurate transformation of the image data into map or GISdatabase format. Photographic films are sensitive to reflected EMR in wavelengths ranging
from the mid-ultraviolet to the near-IR. The camera's entire field of view is recorded
instantaneously. The film detects and records the EMR reflected from surfaces within the field ofview as a continuous tone image.
Digital Cameras
Digital cameras are a recent development. Like the traditional photographic camera, they use a
lens to focus reflected EMR but use an array of EMR sensors rather than photographic film torecord the image. Sensor arrays can have different spatial resolutions, ranging from 512 by 512
for a 35 mm equivalent image up to 2048 by 2048 for applications requiring finer spatial detail.
The sensors detect reflected EMR for each wavelength for which they are calibrated. The
resulting image is comprised of picture elements or pixels, each of which records a brightnessvalue for the spatial field of view it detects. A 2048 by 2048 pixel image contains 4.2 million
pixels!
Trimetregon Cameras
A trimetregon camera is actually an array of three cameras that take simultaneous overlapping
images of the terrain. This type of camera is used to take air photos in areas of mountainous
terrain. The central camera in the array takes a vertical air photo while the left and right cameras
8/13/2019 What is Remote Sensing & Air Photo Interpretation
http://slidepdf.com/reader/full/what-is-remote-sensing-air-photo-interpretation 30/46
30
record oblique images of adjacent terrain. This type of camera is used to obtain images of steep
valleys. By flying along the valleys and collecting overlapping images of the floor and sides of
the valleys, trimetregon cameras can overcome the problems that are associated with normal parallel traverse air photo coverage in areas with high local relief.
Optical-Electrical Scanners
Electro-optical scanners used in both airborne and satellite remote sensing are somewhat similar
to digital cameras in that they use an array of electronic sensors, in combination with mirror/lensoptical devices to scan a scene and record an image. Each sensor in the array produces an
electrical signal for each wavelength detected. The electrical signals can be recorded on magnetic
tape. In the case of satellite sensors, the continuous electrical signals are usually converted into
digital numbers representing up to 256 gray levels before being transmitted to Earth-basedreceiving stations. Optical-electrical scanners offer the potential of real time data acquisition
since there is no delay while film is being developed and prints produced for distribution.
Active vs Passive Remote Sensors
Remote sensing devices can be classified according to whether they are active or passivedevices. Passive remote sensing devices detect reflected EMR while active remove sensing
devices emit a signal and detect the intensity of the signal reflected back off an object. A
photographic camera used with available light and Landsat MSS, Landsat Thematic Mapper, or
SPOT satellite imagery are examples of passive remote sensing systems. A photographic cameraused with a flash attachment, radar and sonar are examples of active remote sensing systems.
8/13/2019 What is Remote Sensing & Air Photo Interpretation
http://slidepdf.com/reader/full/what-is-remote-sensing-air-photo-interpretation 31/46
31
2.0 Concepts of Aerial Photography
What is an aerial photograph?
An aerial photograph, in broad terms, is any photograph taken from the air. Normally, air photos
are taken vertically from an aircraft using a highly accurate camera. There are several things youcan look for to determine what makes one photograph different from another of the same area,
including type of film, scale, and overlap. Other important concepts used in aerial photography
are stereoscopic coverage, fiducial marks, focal length, roll and frame numbers, and flight linesand index maps. The following material will help you understand the fundamentals of aerial
photography by explaining these basic technical concepts.
What information can I fi nd on an air photo?
Unlike a map, features on an aerial photograph are not generalized or symbolized. Air photosrecord all visible features on the Earth's surface from an overhead perspective. Although thefeatures are visible, they are not always easily identifiable. The process of studying and gathering
the information required for the identification of the various cultural and natural features is called
photo interpretation. With careful interpretation, air photos are an excellent source of spatial datafor studying the Earth's environment.
Basic Concepts of Aeri al Photography
Film: most air photo missions are flown using black and white film, however colour, infrared,and false-colour infrared film are sometimes used for special projects.
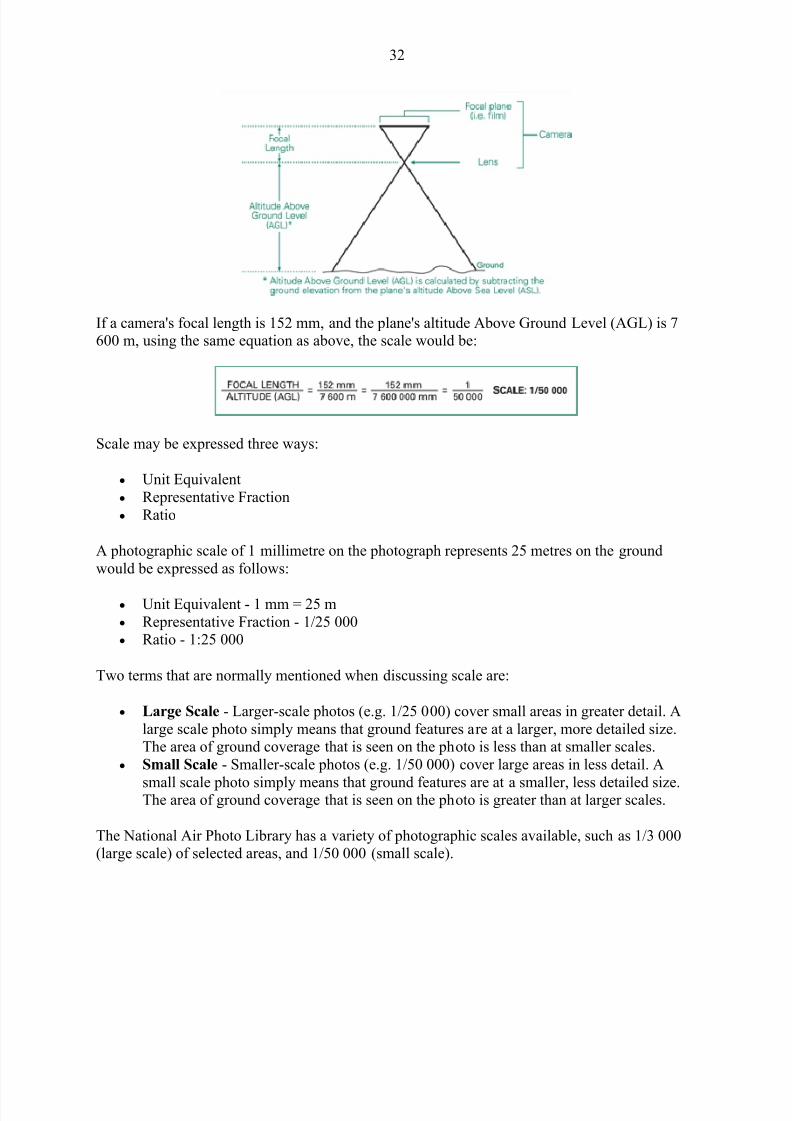
Focal length: the distance from the middle of the camera lens to the focal plane (i.e. the film).As focal length increases, image distortion decreases. The focal length is precisely measured
when the camera is calibrated.
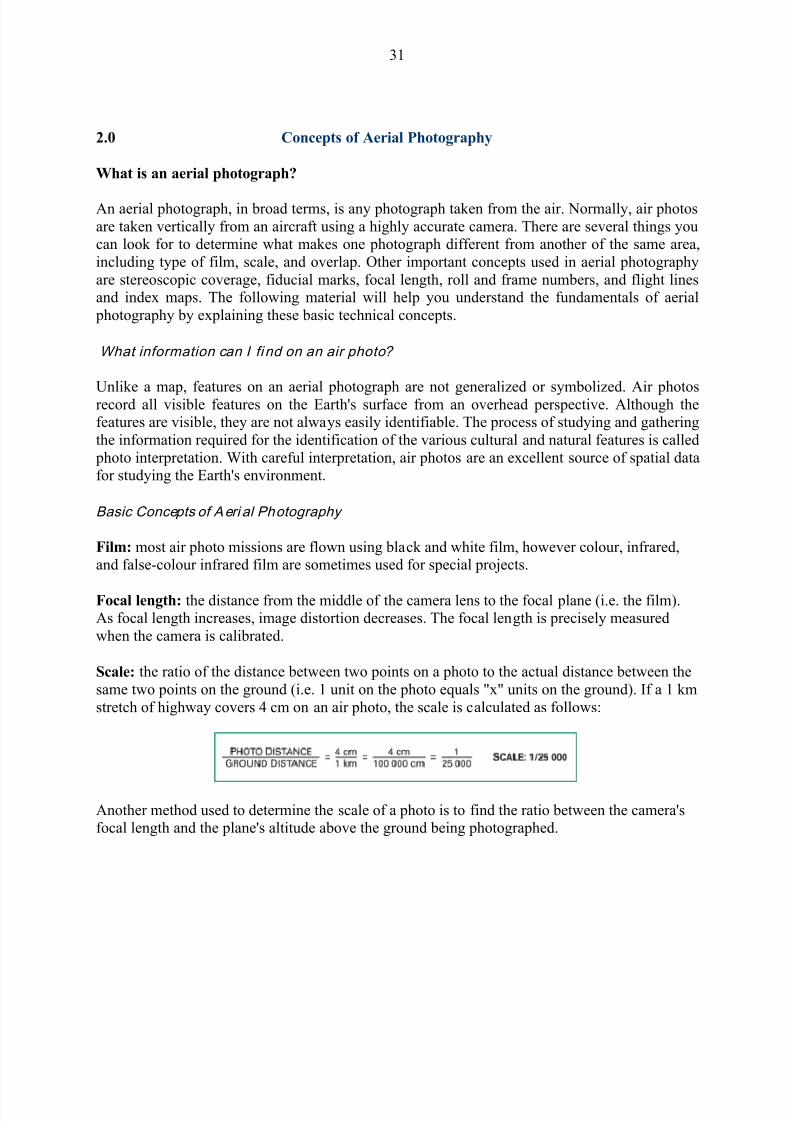
Scale: the ratio of the distance between two points on a photo to the actual distance between the
same two points on the ground (i.e. 1 unit on the photo equals "x" units on the ground). If a 1 km
stretch of highway covers 4 cm on an air photo, the scale is calculated as follows:
Another method used to determine the scale of a photo is to find the ratio between the camera'sfocal length and the plane's altitude above the ground being photographed.
8/13/2019 What is Remote Sensing & Air Photo Interpretation
http://slidepdf.com/reader/full/what-is-remote-sensing-air-photo-interpretation 32/46
32
If a camera's focal length is 152 mm, and the plane's altitude Above Ground Level (AGL) is 7600 m, using the same equation as above, the scale would be:
Scale may be expressed three ways:
Unit Equivalent
Representative Fraction
Ratio
A photographic scale of 1 millimetre on the photograph represents 25 metres on the ground
would be expressed as follows:
Unit Equivalent - 1 mm = 25 m
Representative Fraction - 1/25 000
Ratio - 1:25 000
Two terms that are normally mentioned when discussing scale are:
Large Scale - Larger-scale photos (e.g. 1/25 000) cover small areas in greater detail. A
large scale photo simply means that ground features are at a larger, more detailed size.The area of ground coverage that is seen on the photo is less than at smaller scales.
Small Scale - Smaller-scale photos (e.g. 1/50 000) cover large areas in less detail. A
small scale photo simply means that ground features are at a smaller, less detailed size.The area of ground coverage that is seen on the photo is greater than at larger scales.
The National Air Photo Library has a variety of photographic scales available, such as 1/3 000(large scale) of selected areas, and 1/50 000 (small scale).
8/13/2019 What is Remote Sensing & Air Photo Interpretation
http://slidepdf.com/reader/full/what-is-remote-sensing-air-photo-interpretation 33/46
33
Fiducial marks: small registration marks exposed on the edges of a photograph. The distances
between fiducial marks are precisely measured when a camera is calibrated, and cartographers
when compiling a topographic map use this information.
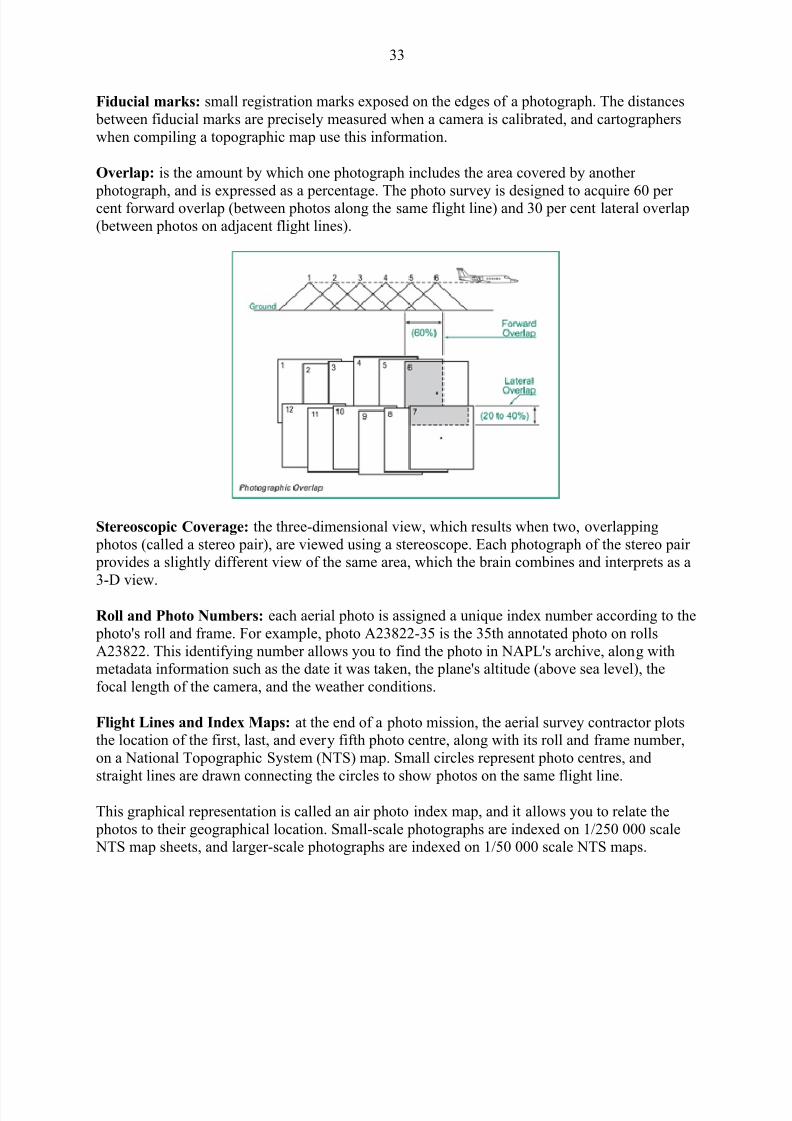
Overlap: is the amount by which one photograph includes the area covered by another
photograph, and is expressed as a percentage. The photo survey is designed to acquire 60 percent forward overlap (between photos along the same flight line) and 30 per cent lateral overlap
(between photos on adjacent flight lines).
Stereoscopic Coverage: the three-dimensional view, which results when two, overlapping
photos (called a stereo pair), are viewed using a stereoscope. Each photograph of the stereo pair provides a slightly different view of the same area, which the brain combines and interprets as a
3-D view.
Roll and Photo Numbers: each aerial photo is assigned a unique index number according to the
photo's roll and frame. For example, photo A23822-35 is the 35th annotated photo on rolls
A23822. This identifying number allows you to find the photo in NAPL's archive, along withmetadata information such as the date it was taken, the plane's altitude (above sea level), the
focal length of the camera, and the weather conditions.
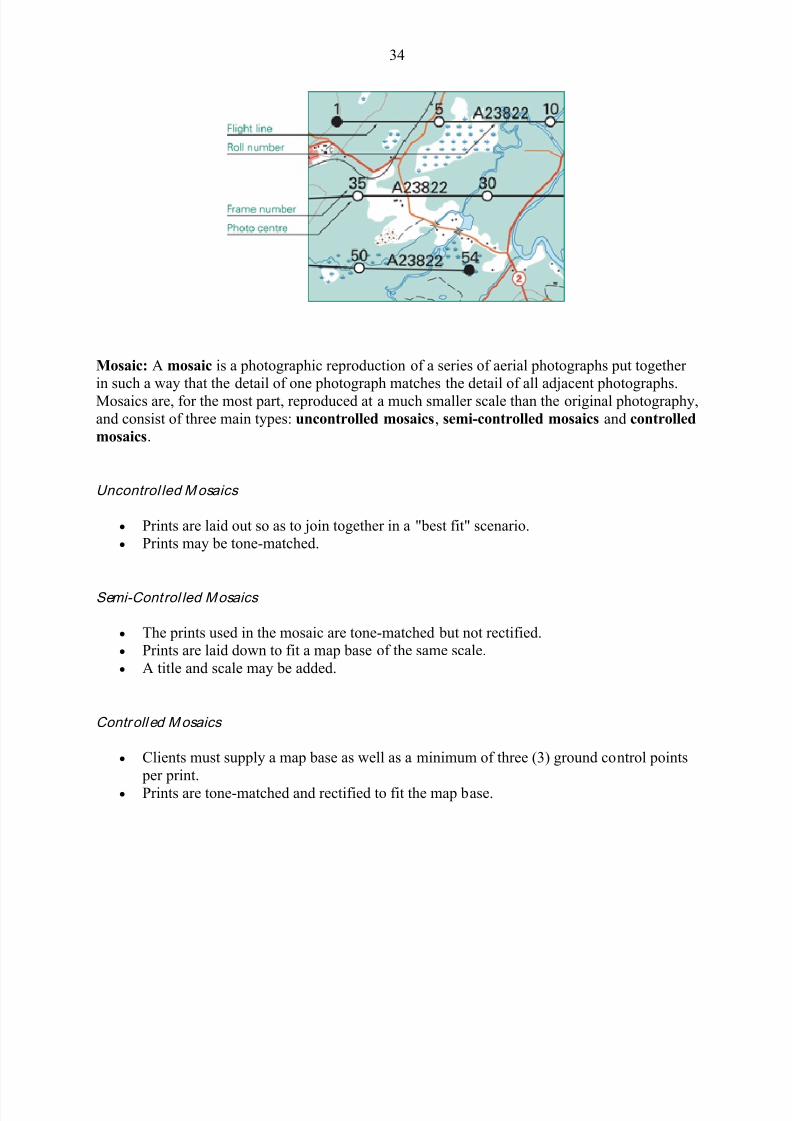
Flight Lines and Index Maps: at the end of a photo mission, the aerial survey contractor plotsthe location of the first, last, and every fifth photo centre, along with its roll and frame number,
on a National Topographic System (NTS) map. Small circles represent photo centres, and
straight lines are drawn connecting the circles to show photos on the same flight line.
This graphical representation is called an air photo index map, and it allows you to relate the
photos to their geographical location. Small-scale photographs are indexed on 1/250 000 scale NTS map sheets, and larger-scale photographs are indexed on 1/50 000 scale NTS maps.
8/13/2019 What is Remote Sensing & Air Photo Interpretation
http://slidepdf.com/reader/full/what-is-remote-sensing-air-photo-interpretation 34/46
34
Mosaic: A mosaic is a photographic reproduction of a series of aerial photographs put togetherin such a way that the detail of one photograph matches the detail of all adjacent photographs.
Mosaics are, for the most part, reproduced at a much smaller scale than the original photography,
and consist of three main types: uncontrolled mosaics, semi-controlled mosaics and controlled
mosaics.
Uncontrol led Mosaics
Prints are laid out so as to join together in a "best fit" scenario.
Prints may be tone-matched.
Semi-Control led Mosaics
The prints used in the mosaic are tone-matched but not rectified.
Prints are laid down to fit a map base of the same scale.
A title and scale may be added.
Controll ed Mosaics
Clients must supply a map base as well as a minimum of three (3) ground control points
per print.
Prints are tone-matched and rectified to fit the map base.
8/13/2019 What is Remote Sensing & Air Photo Interpretation
http://slidepdf.com/reader/full/what-is-remote-sensing-air-photo-interpretation 35/46
35
3.0 Elements, Aids, Techniques, Methods & Procedures of Airphoto Interpretation
I. Definitions
Photo Interpretation: The act of examining aerial photographs/images for the purpose ofidentifying objects and judging their significance.
Photography: The art or process of producing images on a sensitized surface by the action of
light or other radiant energy.
Image: A reproduction or imitation of the form of a person or thing. The optical counterpart of
an object produced by a lens or mirror or other optical system.
Photogrammetry: The science or art of obtaining reliable measurements by means of
photography.
Before an interpreter commences the reading of the photo, the concept of stereoscopy must be
understood.
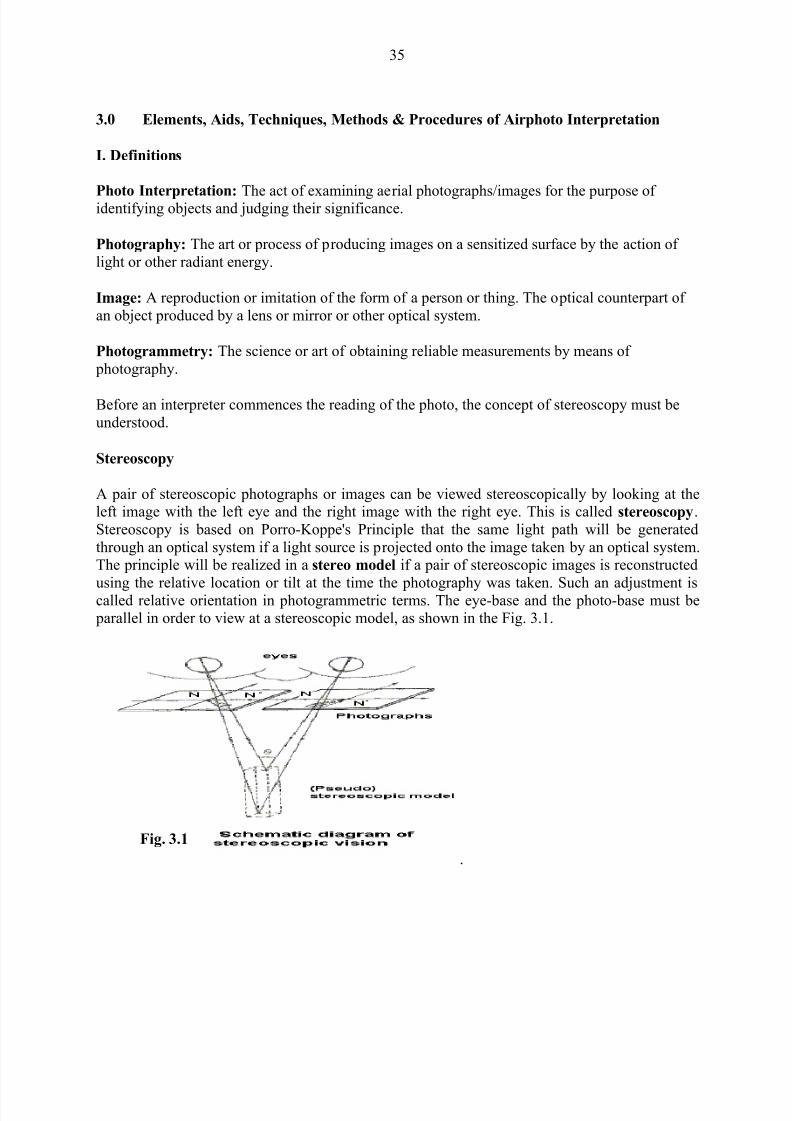
Stereoscopy
A pair of stereoscopic photographs or images can be viewed stereoscopically by looking at theleft image with the left eye and the right image with the right eye. This is called stereoscopy.
Stereoscopy is based on Porro-Koppe's Principle that the same light path will be generated
through an optical system if a light source is projected onto the image taken by an optical system.The principle will be realized in a stereo model if a pair of stereoscopic images is reconstructed
using the relative location or tilt at the time the photography was taken. Such an adjustment iscalled relative orientation in photogrammetric terms. The eye-base and the photo-base must be parallel in order to view at a stereoscopic model, as shown in the Fig. 3.1.
.
Fig. 3.1
8/13/2019 What is Remote Sensing & Air Photo Interpretation
http://slidepdf.com/reader/full/what-is-remote-sensing-air-photo-interpretation 36/46
36
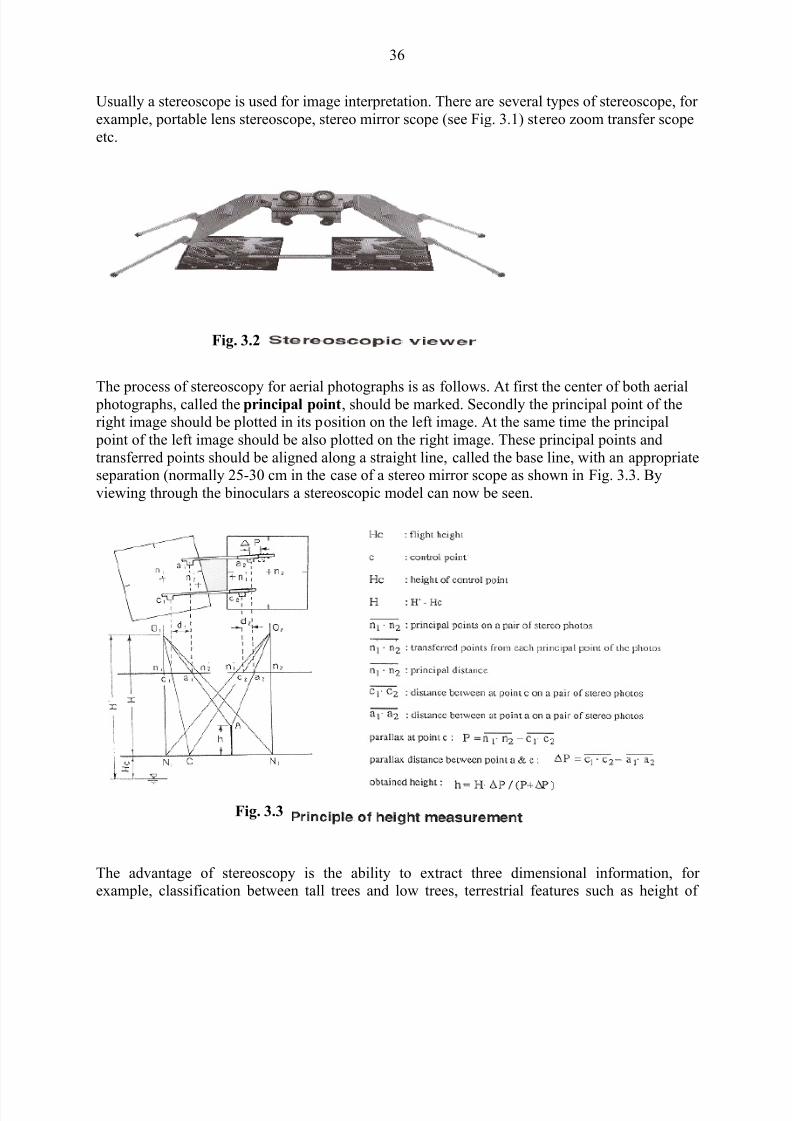
Usually a stereoscope is used for image interpretation. There are several types of stereoscope, for
example, portable lens stereoscope, stereo mirror scope (see Fig. 3.1) stereo zoom transfer scope
etc.
The process of stereoscopy for aerial photographs is as follows. At first the center of both aerial photographs, called the principal point, should be marked. Secondly the principal point of theright image should be plotted in its position on the left image. At the same time the principal
point of the left image should be also plotted on the right image. These principal points and
transferred points should be aligned along a straight line, called the base line, with an appropriateseparation (normally 25-30 cm in the case of a stereo mirror scope as shown in Fig. 3.3. By
viewing through the binoculars a stereoscopic model can now be seen.
The advantage of stereoscopy is the ability to extract three dimensional information, forexample, classification between tall trees and low trees, terrestrial features such as height of
Fig. 3.2
Fig. 3.3
8/13/2019 What is Remote Sensing & Air Photo Interpretation
http://slidepdf.com/reader/full/what-is-remote-sensing-air-photo-interpretation 37/46
37
terraces, slope gradient, detailed geomorphology in flood plains, dip of geological layers and so
on.
The principle of height measurement by stereoscopic vision is based on the use of parallax,
which corresponds to the distance between image points, of the same object on the ground, on
the left and right image. The height difference can be computed if the parallax difference ismeasured between two points of different height, using a parallax bar, as shown in Fig. 3.3
above.
II. Activities of Airphoto/Image Interpretation
Detection/Identification - This is primarily a stimulus and response activity. The stimuli are the
elements of image interpretation. The interpreter conveys his or her response to these stimuli
with descriptions and labels that are expressed in qualitative terms e.g. likely, possible, or
probable. Very rarely do interpreter use definite statements with regard to describing featuresidentified on aerial photography.
Measurement - As opposed to detection and identification, the making of measurements is primarily quantitative. Techniques used by air photo interpreters typically are not as precise as
those employed by photogrammetrists who use sophisticated instruments in making their
measurements. Measurements made by photo interpreters will get you close; given high quality,high resolution, large-scale aerial photographs and appropriate interpretation tools andequipment, you can expect to be within feet; whereas with photogrammetry if you employ the
same type of photography and the appropriate equipment you could expect to be within inches.
Problem Solving - Interpreters are often required to identify objects from a study of associated
objects that they can identify; or to identify object complexes from an analysis of their
component objects. Analysts may also be asked to examine an image, which depicts the effectsof some process, and suggest a possible or probable cause. A solution may not always consist of
a positive identification. The answer may be expressed as a number of likely scenarios with
statements of probability of correctness attached by the interpreter.
Air photo interpretation is to photogrammetry as statistics is to mathematics; one deals with
precision the other with probability.
8/13/2019 What is Remote Sensing & Air Photo Interpretation
http://slidepdf.com/reader/full/what-is-remote-sensing-air-photo-interpretation 38/46
38
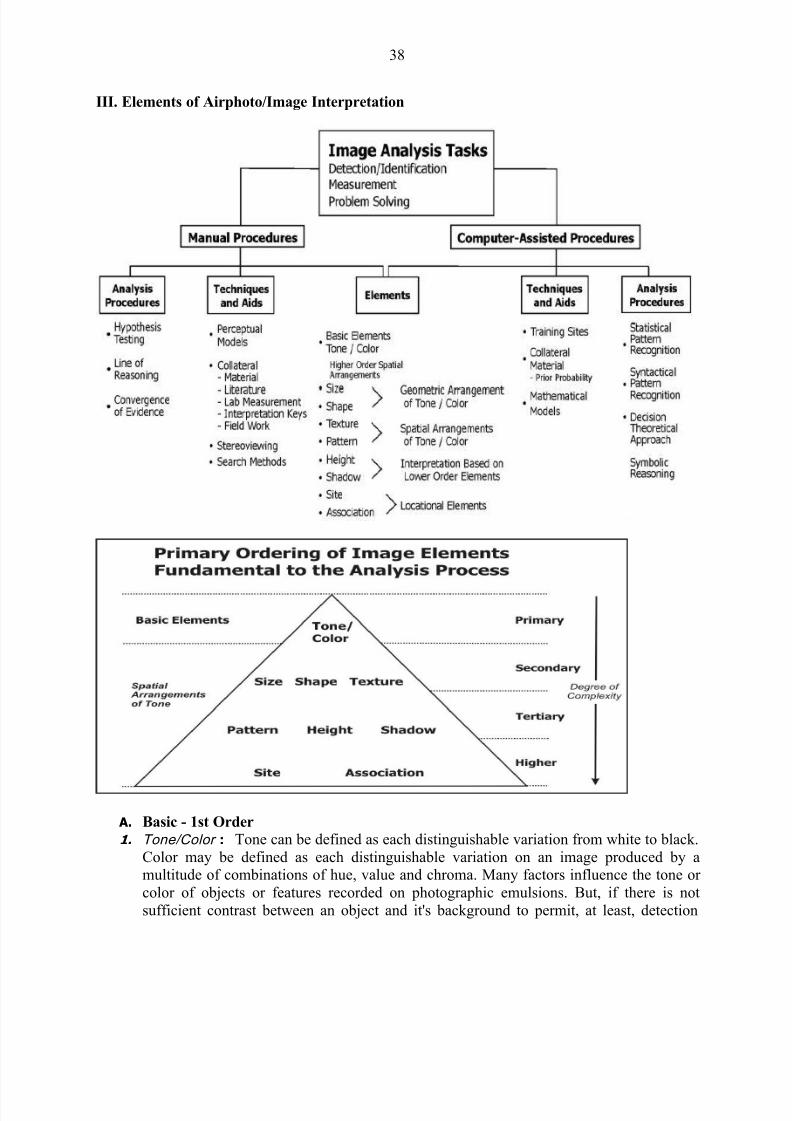
III. Elements of Airphoto/Image Interpretation
A. Basic - 1st Order 1. Tone/Color : Tone can be defined as each distinguishable variation from white to black.
Color may be defined as each distinguishable variation on an image produced by amultitude of combinations of hue, value and chroma. Many factors influence the tone or
color of objects or features recorded on photographic emulsions. But, if there is not
sufficient contrast between an object and it's background to permit, at least, detection
8/13/2019 What is Remote Sensing & Air Photo Interpretation
http://slidepdf.com/reader/full/what-is-remote-sensing-air-photo-interpretation 39/46
39
there can be no identification. While a human interpreter may only be able to distinguish
between ten and twenty shades of gray; interpreters can distinguish many more colors.
Some authors state that interpreters can distinguish at least 100 times more variations ofcolor on color photography than shades of gray on black and white photography
2. Resolution: Resolution can be defined as the ability of the entire photographic system,including lens, exposure, and processing, and other factors, to render a sharply defined
image. An object or feature must be resolved in order to be detected and/or identified.
Resolution is one of the most difficult concepts to address in image analysis because itcan be described for systems in terms of modulation transfer (or point spread) functions,
or it can be discussed for camera lenses in terms of being able to resolve so many line
pairs per millimeter. There are resolution targets that help to determine this when testing
camera lenses for metric quality. Photo interpreters often talk about resolution in terms ofground resolved distance, which is the smallest normal contrast object that can be
identified and measured.
B. 2nd Order - Geometric Arrangements of Tone/Color
1. Size: Size can be important in discriminating objects and features (cars vs. trucks or buses, single family vs. multifamily residences, brush vs. trees, etc.). In the use of size as
a diagnostic characteristic both the relative and absolute sizes of objects can be important.
Size can also be used in judging the significance of objects and features. The size of thecrowns of trees can be related to board feet that may be cut for specific species in
managed forests. The size of agricultural fields can be related to water use in arid areas,
or the amount of fertilizers used. The size of runways gives an indication of the types of
aircraft that can be accommodated.
2. Shape: The shape of objects/features can provide diagnostic clues that aid identification.The Pentagon building in Washington is a diagnostic shape. For example, man-madefeatures have straight edges while natural features tend not to. Roads can have right angle
(90°) turns, railroads can't. Other examples include freeway interchanges, old
fortifications (European cities), and military installations (surface to air missile sites).
C. 2nd. Order - Spatial Arrangement of Tone/Color
1. Texture: Texture is the frequency of change and arrangement of tones. This is a micro
image characteristic. The visual impression of smoothness or roughness of an area can
often be a valuable clue in image interpretation. Still water bodies are typically finetextured, grass medium, brush rough. There are always exceptions though and scale can
and does play a role; grass could be smooth, brush medium and forest rough on higher
altitude aerial photograph of the same area.
2. Pattern: Pattern is the spatial arrangement of objects. Patterns can be either man-made or
natural. Pattern is a macro image characteristic. It is the regular arrangement of objectsthat can be diagnostic of features on the landscape. An orchard has a particular pattern.
Pattern can also be important in geologic or geomorphologic analysis; drainage pattern
8/13/2019 What is Remote Sensing & Air Photo Interpretation
http://slidepdf.com/reader/full/what-is-remote-sensing-air-photo-interpretation 40/46
40
can reveal a great deal about the lithology and geologic structural patterns of the
underlying strata. Dendridic drainage patterns develop on flat-bedded sediments, radial on
domes, linear or trellis in areas with faults etc. It must be noted here that pattern is highlyscale dependent.
D. 3rd. Order - Locational or Positional Elements
1. Site: Site refers to how objects are arranged with respect to one another, or with respect to
terrain features. Aspect, topography, geology, soil, vegetation and cultural features on thelandscape are distinctive factors that the interpreter should be aware of when examining a
site. The relative importance of each of these factors will vary with local conditions, but
all are important. Just as some vegetation grows in swamps others grow on sandy ridges or
on the sunny side vs. the shaded sides of hills. Crop types may prefer certain conditions(e.g. orchards on hillsides). Man made features may also be found on rivers (e.g. power
plant) or on hilltops (e.g. observatory or radar facility).
2. Association: Some objects are so commonly associated with one another thatidentification of one tends to indicate or confirm the existence of another. Smoke stacks,
cooling ponds, transformer yards, coal piles, railroad tracks = coal fired power plant. Aridterrain, basin bottom location, highly reflective surface, sparse vegetation = playa, which
typically have halophytic vegetation e.g. saltbush. Association is one of the most helpful
interpretation clues in identifying man made installations. Aluminum manufacturerequires large amounts of electrical energy. Schools of different grade levels typically
have characteristic playing fields, parking lots and clusters of buildings. Nuclear power
plants are associated with a source of cooling water; weather patterns can be associated
with pollution sources etc.
E. 3rd. Order - Interpreted from lower order elements
1. Height: For some types of analysis e.g. land forms, forestry and some intelligence
applications, some interpreters believe that after tone/color height is the most importantelement for identification. This is a point of debate, but height can add significant
information in many types of interpretation tasks, particularly those that deal with the
analysis of man-made features and vegetation. How tall a tree is can tell something aboutthe expected amount of board feet. How deep an excavation is can tell something about
the amount of material that was removed (in some mining operations excavators are paid
on the basis of material removed as determined by photogrammetric measurement of
volume).
2. Shadow: Geologists like low sun angle photography because of the features that
shadow patterns can help identify (e.g. fault lines and fracture patterns). Church steeplesand smokestacks can cast shadows that can facilitate their identification. Tree
identification can be aided by an examination of the shadows thrown. Shadows can also
inhibit interpretation. On infrared aerial photography shadows are typically very black andcan render targets in shadows uninterpretable.
8/13/2019 What is Remote Sensing & Air Photo Interpretation
http://slidepdf.com/reader/full/what-is-remote-sensing-air-photo-interpretation 41/46
41
IV. Techniques of Photographic/Image Interpretation
Collateral Material
A review of all existing source material that pertains to a given area, process, type of
facility or object, can aid in the interpretation process. The use of collateral material mayalso result in a better definition of the scope, objectives and problems associated with a
given project. Also called "ancillary data", collateral material may come in the form of
text, tables, maps, graphs, or image metadata. Census data, a map or description of theflora of a given area, a land use map, meteorological statistics, or agricultural crop reports
can all be used in support of a given interpretation. Basically, collateral material
represents data/information that an interpreter may use to aid in the interpretation
process. Material contained within a Geographic Information System (GIS) that is used toassist an interpreter in an analysis task can be considered collateral data. Two classes of
collateral materials deserve special mention: interpretation keys and field verification.
Interpretation Keys
An interpretation key is a set of guidelines used to assist interpreters in rapidly
identifying features. Determination of the type of key and the method of presentation to
be employed will depend upon,
a) The number of objects or conditions to be identified; and,
b) The variability typically encountered within each class of features or objects within the
key.
Some authors say that as a general rule, keys are more easily constructed and used for theidentification of man-made objects and features than for natural vegetation and landforms. For
analysis of natural features, training and field experience are often essential to achieve consistentresults. Basically, an interpretation key helps the interpreter organize the information present in
image form and guides him/her to the correct identification of unknown objects. Keys can be
used in conjunction with any type of remotely sensed data. Such keys can differ from thoseemployed in other disciplines in that they can consist largely of illustrations, e.g. landforms,
industrial facilities, military installations. Many types of keys are already available, if you can
find or get your hands on them. This can often be very difficult and a reason why people develop
their own keys.
Depending upon the manner in which the diagnostic features are organized, two types of keys aregenerally recognized.
1) Selective keys, and
2) Elimination keys.
8/13/2019 What is Remote Sensing & Air Photo Interpretation
http://slidepdf.com/reader/full/what-is-remote-sensing-air-photo-interpretation 42/46
42
Selective keys are arranged in such a way that an interpreter simply selects that example that
most closely corresponds to the object they are trying to identify, e.g. industries, landforms etc.
Elimination Keys are arranged so that the interpreter follows a precise step-wise process thatleads to the elimination of all items except the one(s) that he is trying to identify. Dichotomous
keys are essentially a class of elimination key. Most interpreters prefer to use elimination keys in
their analyses.
Field Verification
Field verification can be considered a form of collateral material because it is typicallyconducted to assist in the analysis process. Essentially, this is the process of familiarizing the
interpreter with the area or type of feature. This type of verification is done prior to the
interpretation to develop a visual "signature" of how the feature(s) of interest appear on theground. After an interpretation is made field verification can be conducted to verify accuracy.
Fieldwork is sometimes calculated as being three times as expensive as lab analysis. (This is
why good interpreters can be so valuable). The nature, amount, timing, method of acquisition,
and data integration procedures should be carefully thought out. Will you use windshieldsurveys, point or transect sampling? Will the sampling be random or systematic?
The amount and type of field work required for a given project may vary greatly and is
generally dependent upon the,
a. Type of analysis involved.
b. Image quality, including scale resolution and information to be interpreted.
c. Accuracy requirements for both classification, and boundary delineation.d. Experience of the interpreter and the knowledge of the sensor, area, and subject.
e. Terrain conditions, and the accessibility of the study area.
f. Personnel availability, access to ancillary material.g. Cost considerations.
Handling of Imagery
Although a good deal of photo interpretation is still done using paper prints, the use of
diapositive transparencies is increasing. Transparencies can be used either as single frames or asa roll. Care should be taken when handling transparencies so that they are not marred. An orderly
procedure for the handling of either prints or transparencies should be developed and adhered to
in any interpretation project. Airphotos are typically numbered with flight name and/or frame
number, and should be kept in order in so far as practical. Different dates and flight lines should be kept separate, etc. Anytime transparencies are used surfaces should be as clean as possible
and the interpreter should either wear cotton gloves or be sure not to touch the emulsion surface
as skin oils can cause image deterioration.
Stereo Viewing
8/13/2019 What is Remote Sensing & Air Photo Interpretation
http://slidepdf.com/reader/full/what-is-remote-sensing-air-photo-interpretation 43/46
43
Binocular vision is natural to all of us, but to the trained interpreter the ability to perceive stereo
is an incredibly valuable asset. Stereoviewing will be covered in detail later, but suffice it to say
that viewing high quality stereo aerial photography though a mirror stereoscope is like seeing inanother dimension. Although the identification and interpretation of many landscapes can be
accomplished with mono, stereo is required for certain types of studies. The following are some
tips for using stereo effectively.
Basics for Stereoviewing
1. Make certain that the photos are properly aligned, preferably with the shadows falling towardthe viewer.
2. Keep the eye base and the long axis of the stereoscope parallel to the flight line.
3. Maintain an even glare free illumination on the prints or transparencies.
4. Arrange for comfortable sitting and sufficient illumination.
5. Keep the lenses of the stereoscope clean, properly focused and separated to your interpupillary
distance.
6. The novice interpreter should not work with stereo more than 30 minutes out of any hour
period. You have not had a headache until you've had one that comes from doing stereointerpretation for too long!
Trouble Shooting Stereo
1. Your eyes may be of unequal strength. If you normally wear glasses for reading or close-upwork, you should also wear glasses when using the stereoscope.
2. Poorly illumination, misaligned prints or uncomfortable viewing positions may resultin eye fatigue.
3. Illness or severe emotional distress may create sensations of dizziness in one using astereoscope.
4. Reversal of prints may cause psuedo-stereo. A similar problem may occur if prints are alignedwith the shadows falling away from rather than towards the interpreter.
5. Objects that change positions between exposures cannot be viewed in stereo.
6. In areas of steep topography, scale differences in adjacent photographs may make it difficult
to obtain a three dimensional image.
7. Dark shadows or clouds may prohibit stereo viewing of an area by obscuring an object on one photo.
8/13/2019 What is Remote Sensing & Air Photo Interpretation
http://slidepdf.com/reader/full/what-is-remote-sensing-air-photo-interpretation 44/46
44
D. Further Definitions: The Multi Concept
Multi-Station: The successive overlapping of images taken along a given flight line as beingflown by an aircraft or by a satellite along an orbit path. Think of it like "multi-position". Not to
be confused with multi-stage.
Multi-Band: Multi-band indicates individual spectral bands within a given region of the EMspectrum (e.g. the red green and blue bands of the visible portion of the EM spectrum). Often
seen to have an overlapping meaning with the next term, multi-spectral.
Multi-Spectral: The use of images from various regions of the EM spectrum (e.g. ultra-violet,
visible, infrared, thermal and microwave)
Multi-Date: The use of multiple aerial photographs or remotely sensed images taken over timeof a given area.
Multi-Stage: This typically means using ground based photos, oblique low altitude photos andvertical photographs or remotely sensed images from platforms flying at different altitudes.
Multi-stage has also been applied to sampling strategies; A multi-stage sampling scheme as used
in statistics is one where progressively more information is obtained for progressively smaller
sub-samples of the area being studied.
Multi-Direction: There are times when more information can be obtained using viewing angles
other than vertical
Multi-Disciplinary: Basically, no one interpreter can know everything about a system in
question. By using teams of interpreters and experts with expertise in different disciplines more
information may be gained for a given application. In the legal system this is most similar to the"convergence of evidence" idea; having different viewpoints and different information sources to
prove a point adds validity.
Multi-Thematic: Remote sensing images are one-time write, many times read. Many different
themes (e.g. hydrology, vegetation, transportation, urban areas, etc.) can be extracted from a
single set of images.
Multi-Use: Many potential users from environmental planners to resource managers to public
policy decision-makers can use outputs derived from image analysis and interpretation.
E. Methods of Search
There are basically two techniques that people tend to follow when searching for imagery. One is
logical search and the other can be termed the "fishing expedition". In the latter, the fishing
expedition, the interpreter searches the imagery in a random fashion attempting to find
recognizable features or object that will lead to whatever the interpretation goal happens to be.At some point even this type of interpretation begins to logically converge. Patterns of
anomalous vegetation may lead to looking for water sources, which may lead to looking for
8/13/2019 What is Remote Sensing & Air Photo Interpretation
http://slidepdf.com/reader/full/what-is-remote-sensing-air-photo-interpretation 45/46
45
transportation systems, illegal growing etc. Logical search is a more systematic method of
analysis most often used by interpreters.
The logical search involve these things:
1. The interpreter should always keep in mind the basic qualities of the imagery they are dealingwith, e.g. film filter combination, the season and time of day of acquisition, and the image scale,
etc. In addition the interpreter should always remember to examine all the titling information on
an image.
2. Interpretation should begin with the general and proceed to the specific. After gaining anoverall impression of the photograph the interpreter should begin to examine the physical
features (e.g. water bodies, mountains, forests, etc.) and cultural features (e.g. urban areas, farms,
road networks etc.). The interpreter should then move to more specific questions e.g. what type
of trees makes up the forest? What types of roads are present?
3. Interpretation should be conducted logically one step at a time. Following from 2 above it isgood to go from a detailed examination of landforms to vegetation, to hydrology and so on.Then address cultural features in the same fashion. What types of urban features are present
single-family residences, multi-family residences, industries, retail districts and so on.
F. Convergence of Evidence
1. Image interpretation is basically a deductive process. Features that can be detected andidentified lead the interpreter to the location and identification of other features. This is
convergence, and for many applications of air photo interpretation this involves the activities of
one or two individuals synthesizing a large amount of information.
2. Deductive interpretation requires either the conscious or unconscious consideration of all of
the elements of image interpretation. The completeness and accuracy of an interpretation is insome measure proportional to the interpreters understanding of the "how and the why" of the
elements, techniques and methods of interpretation.
References:
Areola, O. 1986, An Introduction to Aerial Photo – Interpretation in the African Continent,
Evans Brothers (Nig,) Ltd, 175p
Avery T. E. and G. L Berlin, 1992, Fundamentals of remote Sensing and Air photoInterpretation, Fifth Edition, New York, Macmillan Publishing Company, 472 p. [pages
51-67]

8/13/2019 What is Remote Sensing & Air Photo Interpretation
http://slidepdf.com/reader/full/what-is-remote-sensing-air-photo-interpretation 46/46
46
Estes, J.E., E.J. Hajic, and L.R. Tinney (Author-editors), “Fundamentals of Image Analysis:
Analysis of Visible and Thermal Infrared Data”, Chapter 24, in Manual of Remote
Sensing, 2nd. ed. Falls Church, Va. American Society of Photogrammetry, pp. 987-1124.
Jensen, J.R., 2000, Remote Sensing of the Environment: An Earth Resource Perspective, Upper
Saddle River, NJ: Prentice Hall, 544 pages.
Norman, K. (Ed.) (2004) Principles of Remote Sensing, ITC Educational Textbook Series, 250
p.
Paine, D. E, 1981, Aerial Photography and Image Interpretation for Resource Management, New York, John Wiley and Sons, 571 p.
Recommended