Embed Size (px)
Citation preview
Lecture Series SGL 308: Introduction to Geological Mapping Lecture 8
114
LECTURE 8
REMOTE SENSING METHODS: THE USE AND INTERPRETATION OF SATELLITE IMAGES
LECTURE OUTLINE
Page
8.0 Introduction 114
8.1 Objectives 115
8.2 Remote Sensing: Method of Operation 115
8.3 Importance of Remote Sensing Method 115
8.4 Landsat Satellite 116
8.5 Sensors in the Landsat Satellites 116
8.6 Degree of Resolution 117
8.7 Image Interpretation
8.7.1 Case example 1
8.7.2 Case example 2
8.7.3 Case example 3
118
118
118
120
8.8 Application 121
8.9 Summary 123
8.10 Reference 124
8.0 INTRODUCTION The world consumption of many resources over the past several decades has been
increasing exponentially. Improvement in the standard of living for billions of people
living in underdeveloped countries, who currently represent the fastest-growing segment
of the world population, has increased the demand pressure of these resources. In order to
meet this demand, a variety of new methods are being applied to the search or exploration
for these resources. One strategy being used for averting further mineral shortages

Lecture Series SGL 308: Introduction to Geological Mapping Lecture 8
115
includes the application of remote sensing as a new exploration method to find more
mineral resources.
8.1 OBJECTIVES
Objectives
By the end of this lecture you should be able to:
a). Explain the method of operation of remote sensing.
b). Describe the importance of remote sensing method.
c). Describe how the Landsat satellite imaging system covers every part of the earth.
d). Explain how the sensors in Landsat satellite detect wavelengths of energy.
e). State the degree of resolution of Landsat images.
f). List the application of remote sensing method in geological exploration studies.
8.2 REMOTE SENSING: METHOD OF OPERATION Remote sensing methods are becoming increasingly sophisticated and valuable in mineral
exploration. These methods rely on detection, recording, and analysis of wave-
transmitted energy, such as visible light and infrared radiation, rather than on direct
physical contact and sampling. Aerial photography is one example, satellite imagery
another.
8.3 IMPORTANCE OF REMOTE SENSING METHOD Remote sensing, especially using satellites, is a quick and efficient way to scan broad
areas, to examine regions having such rugged topography or hostile climate that they
cannot easily be explored on foot or with surface-based vehicles, and to view areas to
which ground access is limited for political reasons. One of the best known and most
comprehensive earth satellites imaging system is the one initiated in 1972, known as
Landsat.
Lecture Series SGL 308: Introduction to Geological Mapping Lecture 8
116
8.4 LANDSAT SATELLITE Landsat satellites orbit the earth in such a way that images can be made of each part of
the earth. Each orbit is slightly offset from the previous one, with the areas viewed on one
orbit overlapping the scenes of the previous orbit (compare the side-lap and overlap
feature in aerial photography discussed in Lecture 6). Each satellite makes fourteen orbits
each day; complete coverage of the earth takes eighteen days.
8.5 SENSORS IN THE LANDSAT SATELLITES The sensors in the Landsat satellites do not detect all wavelengths of energy reflected
from the surface. They do not take photographs in the conventional sense. They are
particularly sensitive to selected green and red wavelengths in the visible light spectrum
and to a portion of the infrared (invisible heat radiation, with wavelengths somewhat
longer than those of red light). These wavelengths were chosen because plants reflect
light most strongly in the green and infrared. Different plants, rocks, and soils reflect
different proportions of radiation of different wavelengths. Even the same feature may
produce a somewhat different image under different conditions: Wet soils differs from
dry; sediment-laden water looks different from clear waters; a given plant variety may
reflect a different radiation spectrum depending on what trace elements it has
concentrated from the underlying soil or how vigorously it is growing.
Describe the importance of remote sensing method in the search of resources.
Why are sensors in the Landsat satellites particularly selected to be sensitive in the green, red and infrared wavelengths?
Lecture Series SGL 308: Introduction to Geological Mapping Lecture 8
117
8.6 DEGREE OF RESOLUTION Landsat images can be powerful mapping tools. The smallest features that can be
distinguished in a Landsat image are about 80 meters (250 feet) in size, which
indicates the quality of the resolution. Multiple images can be joined into mosaics
covering whole countries or continents.
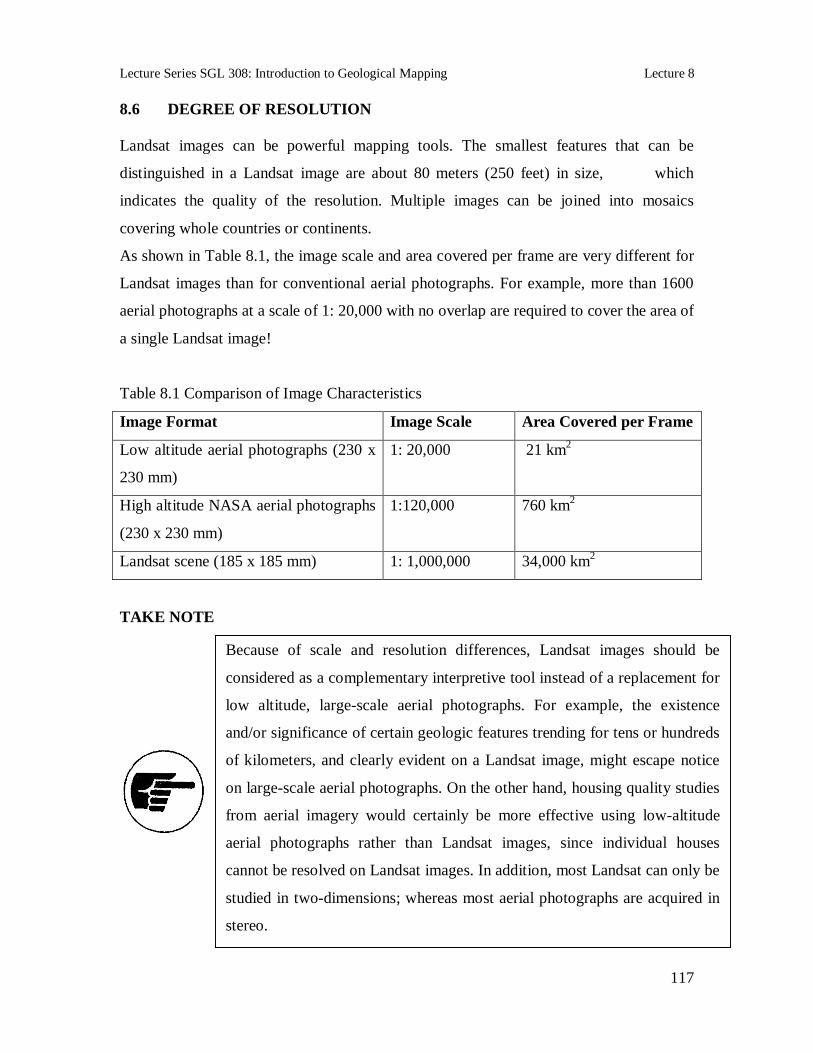
As shown in Table 8.1, the image scale and area covered per frame are very different for
Landsat images than for conventional aerial photographs. For example, more than 1600
aerial photographs at a scale of 1: 20,000 with no overlap are required to cover the area of
a single Landsat image!
Table 8.1 Comparison of Image Characteristics
Image Format Image Scale Area Covered per Frame
Low altitude aerial photographs (230 x
230 mm)
1: 20,000 21 km2
High altitude NASA aerial photographs
(230 x 230 mm)
1:120,000 760 km2
Landsat scene (185 x 185 mm) 1: 1,000,000 34,000 km2
TAKE NOTE
Because of scale and resolution differences, Landsat images should be
considered as a complementary interpretive tool instead of a replacement for
low altitude, large-scale aerial photographs. For example, the existence
and/or significance of certain geologic features trending for tens or hundreds
of kilometers, and clearly evident on a Landsat image, might escape notice
on large-scale aerial photographs. On the other hand, housing quality studies
from aerial imagery would certainly be more effective using low-altitude
aerial photographs rather than Landsat images, since individual houses
cannot be resolved on Landsat images. In addition, most Landsat can only be
studied in two-dimensions; whereas most aerial photographs are acquired in
stereo.
Lecture Series SGL 308: Introduction to Geological Mapping Lecture 8
118
8.7 IMAGE INETRPRETATION
As mentioned in Section 8.4, each Landsat satellite passes over the same area on the
earth’s surface during daylight hours every 18 days, or about 20 times per year. The
actual number of times per year a given ground area is imaged depends on amount of
cloud cover, sun angle, and whether or not the satellite is in operation on any specific
pass. This provides the opportunity for many areas to have Landsat images available for
several dates per year. Because the appearance of the ground in many areas with climatic
change is dramatically different in different seasons, the image interpretation process is
often improved by utilizing images from two or more dates.
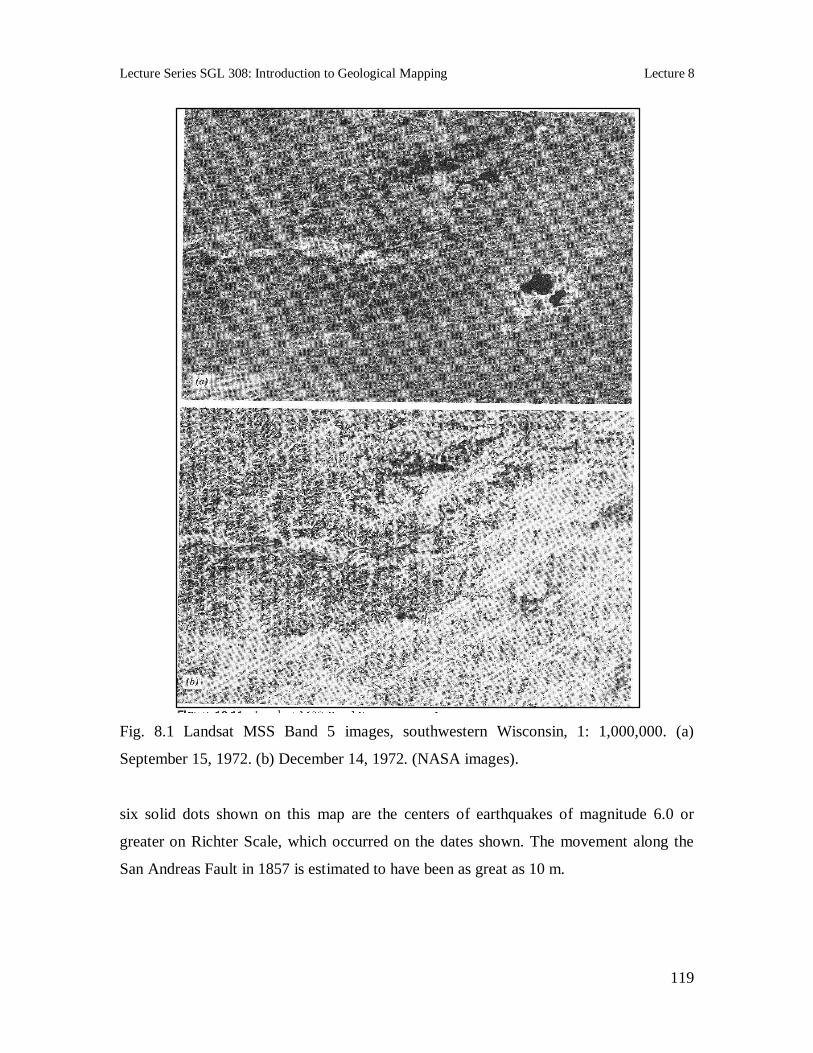
8.7.1 Case example 1:
A Landsat MSS (Multi-Spectral Scanner) Band 5 image of a portion of Wisconsin (USA)
was imaged in September and December (Fig. 8.1). The ground is snow-covered (about
200 mm deep) in the December image and all water bodies are frozen, except for a small
stretch of the Wisconsin River. The Physiography of the area can be better appreciated by
viewing the December image, due in part to the low solar elevation angle in winter that
accentuates subtle relief. A series of stream valleys cuts into the horizontally bedded
sedimentary rock in the upper-left portion of this scene. The snow-covered upland areas
and valley floors have a very light tone, whereas the steep, tree-covered, valley sides
have a darker tone. The identification of urban, agricultural, and water areas can better be
accomplished using the September image. The identification of forested areas can be
more positively done using the December image.
8.7.2 Case Example 2:
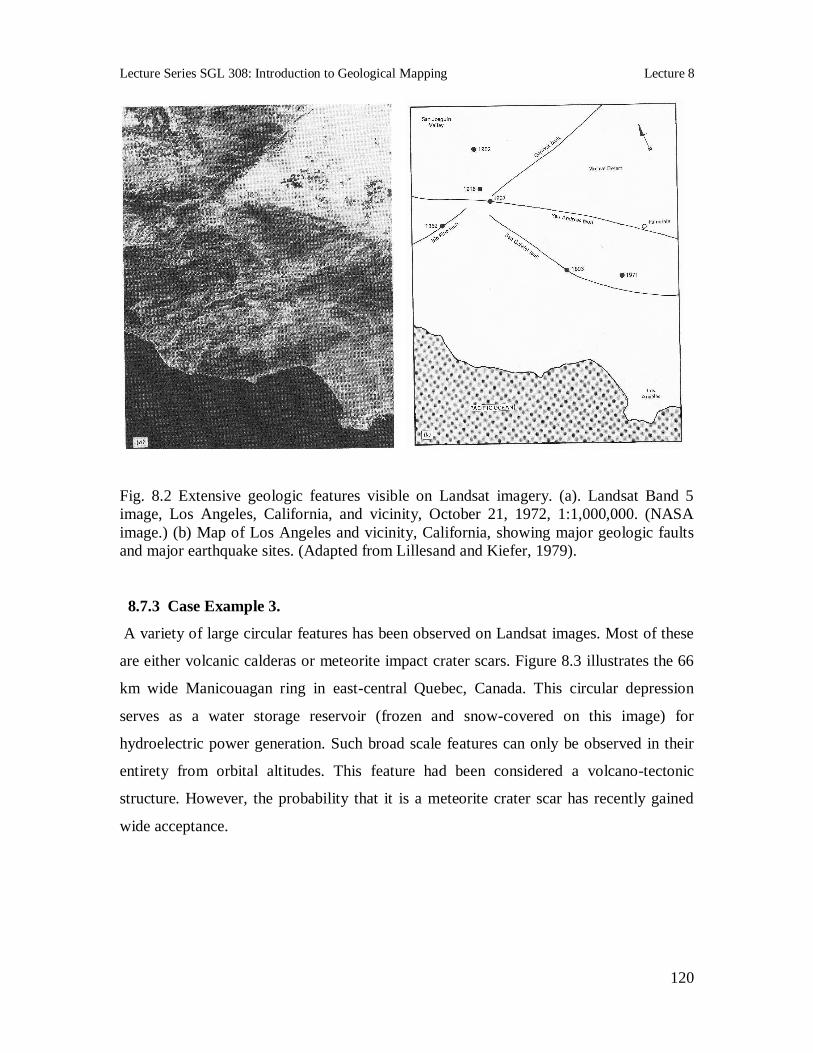
Figure 8.2 illustrates extensive geologic features that are clearly visible on Landsat
images. Figure 8.2a is a Band 5 Landsat image showing an area north and east of Los
Angeles, California (Williams and Carter, 1976). Figure 8.2b is a map of major geologic
faults visible on this Landsat image along which movement is known to have occurred.
The well-known San Andreas Fault that bisects this image is nearly 1,000 km long. The
San Francisco earthquake of 1906 occurred because of movement along this fault. The
Lecture Series SGL 308: Introduction to Geological Mapping Lecture 8
119
Fig. 8.1 Landsat MSS Band 5 images, southwestern Wisconsin, 1: 1,000,000. (a)
September 15, 1972. (b) December 14, 1972. (NASA images).
six solid dots shown on this map are the centers of earthquakes of magnitude 6.0 or
greater on Richter Scale, which occurred on the dates shown. The movement along the
San Andreas Fault in 1857 is estimated to have been as great as 10 m.
Lecture Series SGL 308: Introduction to Geological Mapping Lecture 8
120
Fig. 8.2 Extensive geologic features visible on Landsat imagery. (a). Landsat Band 5 image, Los Angeles, California, and vicinity, October 21, 1972, 1:1,000,000. (NASA image.) (b) Map of Los Angeles and vicinity, California, showing major geologic faults and major earthquake sites. (Adapted from Lillesand and Kiefer, 1979). 8.7.3 Case Example 3.
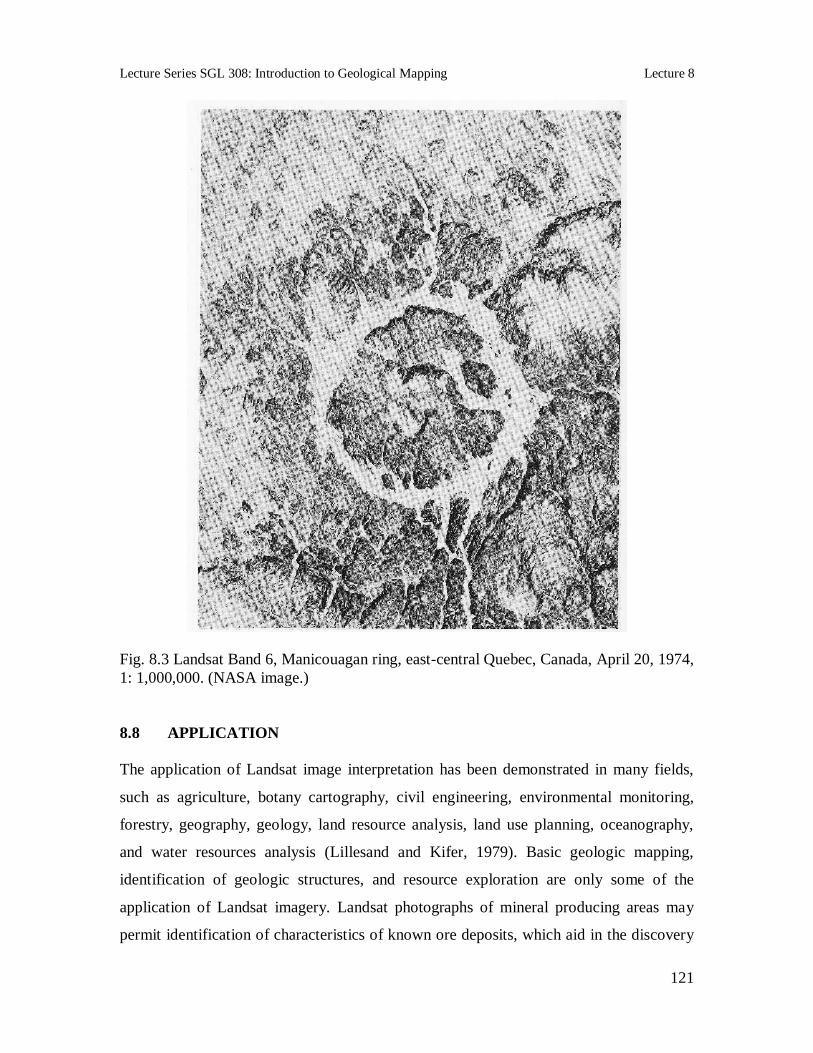
A variety of large circular features has been observed on Landsat images. Most of these
are either volcanic calderas or meteorite impact crater scars. Figure 8.3 illustrates the 66
km wide Manicouagan ring in east-central Quebec, Canada. This circular depression
serves as a water storage reservoir (frozen and snow-covered on this image) for
hydroelectric power generation. Such broad scale features can only be observed in their
entirety from orbital altitudes. This feature had been considered a volcano-tectonic
structure. However, the probability that it is a meteorite crater scar has recently gained
wide acceptance.
Lecture Series SGL 308: Introduction to Geological Mapping Lecture 8
121
Fig. 8.3 Landsat Band 6, Manicouagan ring, east-central Quebec, Canada, April 20, 1974, 1: 1,000,000. (NASA image.) 8.8 APPLICATION The application of Landsat image interpretation has been demonstrated in many fields,
such as agriculture, botany cartography, civil engineering, environmental monitoring,
forestry, geography, geology, land resource analysis, land use planning, oceanography,
and water resources analysis (Lillesand and Kifer, 1979). Basic geologic mapping,
identification of geologic structures, and resource exploration are only some of the
application of Landsat imagery. Landsat photographs of mineral producing areas may
permit identification of characteristics of known ore deposits, which aid in the discovery

Lecture Series SGL 308: Introduction to Geological Mapping Lecture 8
122
of new ore deposits. Satellite images also provide a means of surveying the geology of
large areas easily without actually walking over them. Indeed, satellite imagery, often
enhanced by computerized image processing, improves the efficiency of geologists
searching for new ore deposits.
For example in Fig. 8.4, recognizable features include a granitic intrusion (round feature
at top center) and folded layers of sedimentary rock. Such imagery is especially useful
when some ground truth can be obtained – information gathered by direct surface
examination. Alternatively, Landsat images of inaccessible regions can be compared with
images of other regions that have been mapped and sampled directly, and the similarities
in imagery characteristics used to infer the actual geology or vegetation.
Fig. 8.4 Landsat satellite image provide a means of surveying the geology of large areas without actually walking over them. Recognizable features include a granitic intrusion (round feature at top center) and folded layers of sedimentary rock (below). (Photo after Montgomery, 1989.)
Lecture Series SGL 308: Introduction to Geological Mapping Lecture 8
123
8.9 Summary
In this lecture we have noted that remote sensing method rely on detection, recording,
and analysis of wave-transmitted energy, such as visible light and infrared radiation,
rather than on direct physical contact and sampling. This method is important in scanning
broad areas, examining regions of rugged topography or hostile climate that cannot easily
be explored on foot and to view areas to which ground access is limited due to political
reasons.
The Landsat is one of the best known and most comprehensive remote sensing earth
satellites imaging system initiated in 1972. The Landsat satellites, with a resolution of 80
meters, orbit the earth in such a way that images can be made of each part of the earth.
The sensors in the Landsat satellites are particularly sensitive to selected green and red
wavelengths in the visible light spectrum and to a portion of the infrared. These
wavelengths were chosen because plants reflect light most strongly in the green and
infrared. It is also true that different plants, rocks, and soils reflect different proportions
of radiation of different wavelengths.
Finally it was noted that the Landsat imagery remote sensing method can be applied in
basic geologic mapping, identification of geologic structures, and resource exploration.
For example, Landsat photographs of mineral producing areas may permit identification
ACTIVITY
List three applications of the Landsat imagery remote sensing method in geological studies.
SUMMARY
Lecture Series SGL 308: Introduction to Geological Mapping Lecture 8
124
of characteristics of known ore deposits, which can aid in the discovery of new ore
deposits. In general, satellite imageries can often be enhanced by computerized image
processing, which in turn can improve the efficiency of geologists searching for new ore
deposits.
8.10 References
Brookins, D.G. (1981). Earth resources, energy, and the environment. Columbus, Ohio: Charles E. Merrill. Lillesand, T.M. and Kiefer, R.W. (1979). Remote Sensing and Image Interpretation. John Wiley & Sons, New York, 612pp. Montgomery, C.W. (1989). Environmental Geology. 2nd Edition. Wm. C. Brown Publishers, Dubuque, Iowa. 476pp. NASA, Landsat Data Users Handbook, Doc. No. 76SDS4258 Goddard Space
REFERENCES/ SUGGESTED READINGS


![[REMOTE SENSING] 3-PM Remote Sensing](https://img.pdfslide.us/doc/110x75/61f2bbb282fa78206228d9e2/remote-sensing-3-pm-remote-sensing.jpg)