Wellbeing Guidance for
Appraisal: Supplementary Green Book Guidance
July 2021
Wellbeing Guidance for Appraisal:
Supplementary Green Book Guidance
July 2021

© Crown copyright 2021
This publication is licensed under the terms of the Open Government Licence v3.0 except
where otherwise stated. To view this licence, visit nationalarchives.gov.uk/doc/open-
government-licence/version/3.
Where we have identified any third party copyright information you will need to obtain
permission from the copyright holders concerned.
This publication is available at: www.gov.uk/official-documents.
Any enquiries regarding this publication should be sent to us at
1
Contents 1. Introduction and background .................................................................. 3
1.1 What is wellbeing? ......................................................................................... 3
1.2 Wellbeing in policy development ..................................................................... 3
1.3 Guidance structure ......................................................................................... 5
2. Wellbeing evidence and assumptions ....................................................... 6
2.1 Measuring wellbeing ...................................................................................... 6
2.2 Important findings from wellbeing research ..................................................... 7
2.3 Subjective wellbeing effects and economics ................................................... 10
3. Wellbeing in the policy-making process ................................................. 13
3.1 Research - identifying areas requiring policy action ........................................ 13
3.2 Strategic stage .............................................................................................. 14
3.3 Drawing up and narrowing down the longlist ................................................ 15
4.1 Overview ...................................................................................................... 19
4.2 Wellbeing in Social Cost Benefit Analysis and Social Cost-Effectiveness Analysis:
Overview ............................................................................................................ 21
4.3 Social Cost Benefit Analysis: monetise relevant costs and benefits ................... 23
4.4 Social CBA where full monetisation is not possible ......................................... 32
4.5 Wellbeing CEA: Monetise costs and compare to wellbeing benefits ................ 34
4.6 Wellbeing in appraisal: wider considerations .................................................. 37
5. Wellbeing in monitoring and evaluation ................................................ 43
5.1 Principles for measuring and evaluating wellbeing ......................................... 43
5.2 Incorporating wellbeing in evaluation ............................................................ 44
6. Checklist for analysts ............................................................................. 48
Annexes .................................................................................................... 49
Annex 1 - Measuring wellbeing ........................................................................... 49
Annex 2 - Quantifying and monetising wellbeing effects ...................................... 54
Annex 3 - Determining cause and effect in wellbeing studies................................ 71
Annex 4 - Wellbeing policy tool ........................................................................... 73
Annex 5 - Sources of wellbeing data ................................................................... 76
Glossary ............................................................................................................. 79
Bibliography ....................................................................................................... 81
2
The guidance has been prepared in accordance with the established process for
Green Book supplementary guidance by the Social Impacts Task Force through a
specialist cross government sub-group on wellbeing appraisal.
Written by: Sara MacLennan (Department for Environment, Food and Rural Affairs),
Iven Stead (in previous capacity as economist within Department for Transport) and
Allan Little (Department for Education).
Input from: Craig Lindsay (Department for Work and Pensions), Philip Ball and
Maxim Harper (Department for Culture, Media and Sport), Margherita Mussella
(What Works Centre for Wellbeing) and Joseph Lowe (Green Book editor, HM
Treasury), with editorial input from Amanda Rowlatt (Department for Transport
Chief Analyst and Chair of the Social Impacts Task Force).
A number of academics and practitioners have provided significant input and
advice, including: Paul Frijters, London School of Economics Centre for Economic
Performance; Andrew Oswald, Warwick University; Daniel Fujiwara, London School
of Economics; Carol Graham, Brookings University; Kelsey O’Connor, STATEC
Research and IZA; John Henderson, health economist, former Department for Health
and Social Care; Jan DeNeve, University of Oxford; Paul Dolan, London School of
Economics; Gus O’Donnell; Catherine Connolly, Economicsense; Will Watt, State of
Life; Nancy Hey, What Works Centre for Wellbeing; members of Defra’s Economic
Advisory Panel; as well as a long list of analysts across departments and further
academics and practitioners with valuable advice and comments.
This guidance is however a technical government document and should not be
considered a reflection of any contributor’s views in full.
3
1. Introduction and background
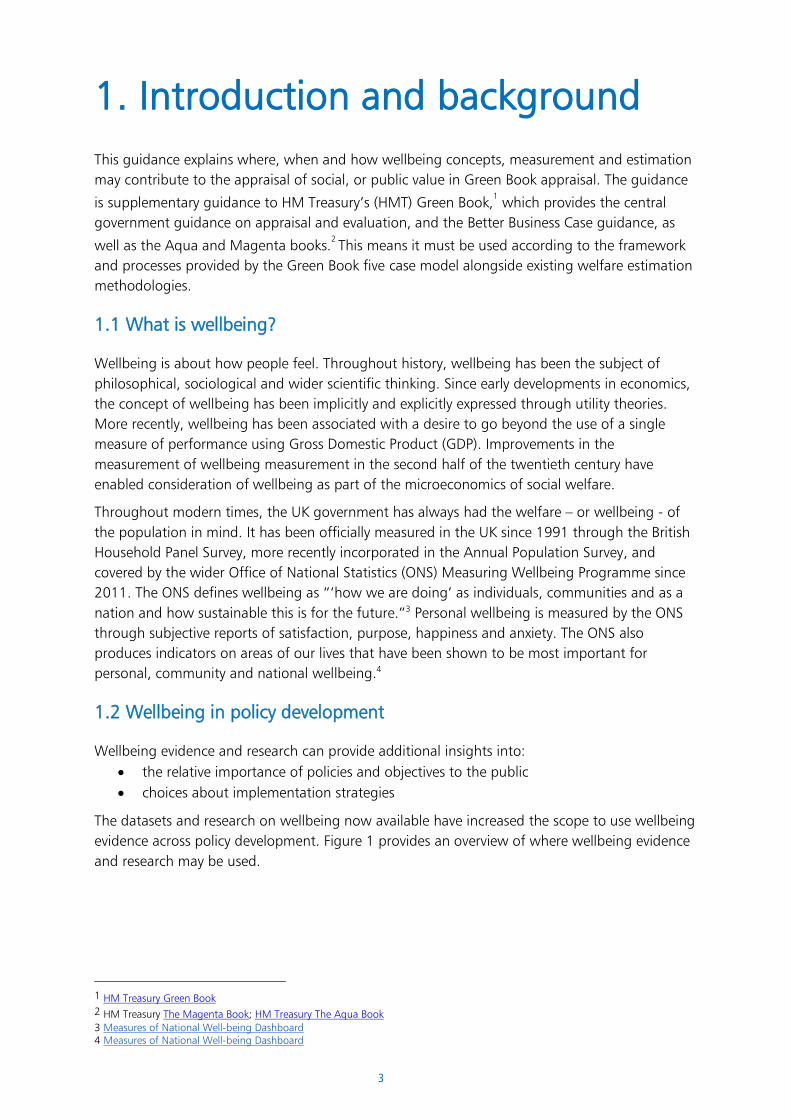
This guidance explains where, when and how wellbeing concepts, measurement and estimation
may contribute to the appraisal of social, or public value in Green Book appraisal. The guidance
is supplementary guidance to HM Treasury’s (HMT) Green Book,1 which provides the central
government guidance on appraisal and evaluation, and the Better Business Case guidance, as
well as the Aqua and Magenta books.2 This means it must be used according to the framework
and processes provided by the Green Book five case model alongside existing welfare estimation
methodologies.
1.1 What is wellbeing?
Wellbeing is about how people feel. Throughout history, wellbeing has been the subject of
philosophical, sociological and wider scientific thinking. Since early developments in economics,
the concept of wellbeing has been implicitly and explicitly expressed through utility theories.
More recently, wellbeing has been associated with a desire to go beyond the use of a single
measure of performance using Gross Domestic Product (GDP). Improvements in the
measurement of wellbeing measurement in the second half of the twentieth century have
enabled consideration of wellbeing as part of the microeconomics of social welfare.
Throughout modern times, the UK government has always had the welfare – or wellbeing - of
the population in mind. It has been officially measured in the UK since 1991 through the British
Household Panel Survey, more recently incorporated in the Annual Population Survey, and
covered by the wider Office of National Statistics (ONS) Measuring Wellbeing Programme since
2011. The ONS defines wellbeing as “‘how we are doing’ as individuals, communities and as a
nation and how sustainable this is for the future.”3 Personal wellbeing is measured by the ONS
through subjective reports of satisfaction, purpose, happiness and anxiety. The ONS also
produces indicators on areas of our lives that have been shown to be most important for
personal, community and national wellbeing.4
1.2 Wellbeing in policy development
Wellbeing evidence and research can provide additional insights into:
• the relative importance of policies and objectives to the public
• choices about implementation strategies
The datasets and research on wellbeing now available have increased the scope to use wellbeing
evidence across policy development. Figure 1 provides an overview of where wellbeing evidence
and research may be used.
1 HM Treasury Green Book 2 HM Treasury The Magenta Book; HM Treasury The Aqua Book
3 Measures of National Well-being Dashboard 4 Measures of National Well-being Dashboard
4
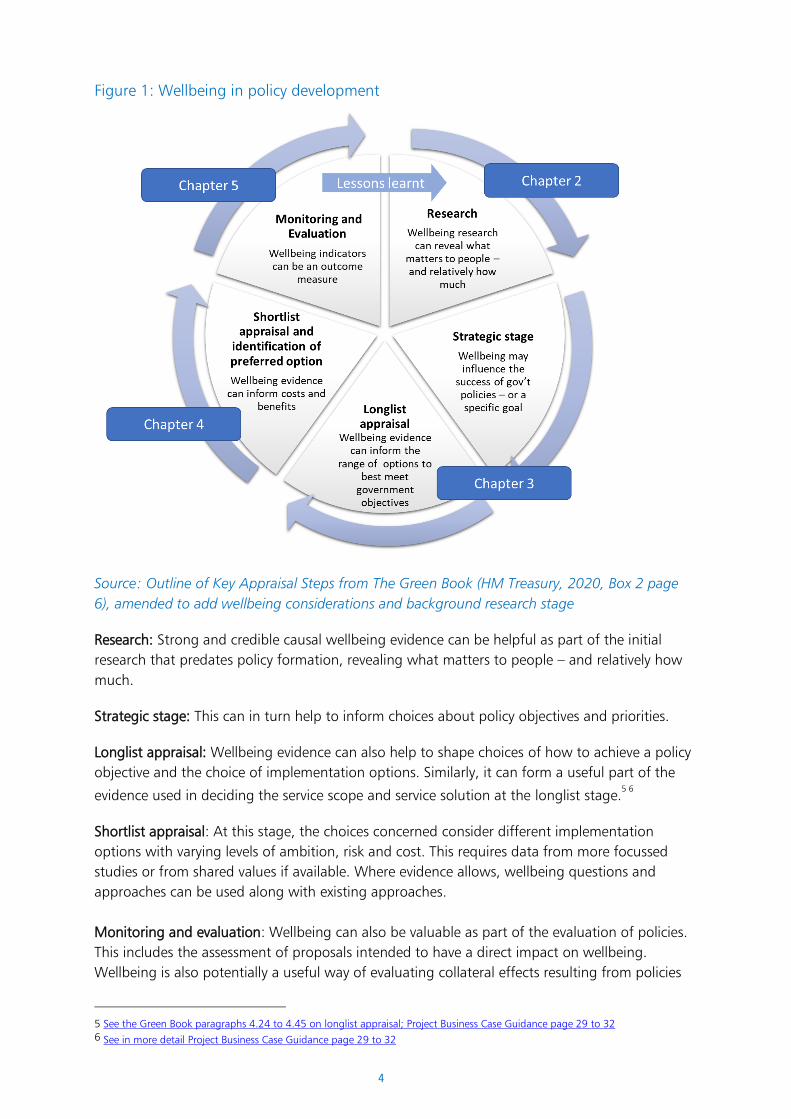
Figure 1: Wellbeing in policy development
Source: Outline of Key Appraisal Steps from The Green Book (HM Treasury, 2020, Box 2 page
6), amended to add wellbeing considerations and background research stage
Research: Strong and credible causal wellbeing evidence can be helpful as part of the initial
research that predates policy formation, revealing what matters to people – and relatively how
much.
Strategic stage: This can in turn help to inform choices about policy objectives and priorities.
Longlist appraisal: Wellbeing evidence can also help to shape choices of how to achieve a policy
objective and the choice of implementation options. Similarly, it can form a useful part of the
evidence used in deciding the service scope and service solution at the longlist stage.5 6
Shortlist appraisal: At this stage, the choices concerned consider different implementation
options with varying levels of ambition, risk and cost. This requires data from more focussed
studies or from shared values if available. Where evidence allows, wellbeing questions and
approaches can be used along with existing approaches.
Monitoring and evaluation: Wellbeing can also be valuable as part of the evaluation of policies.
This includes the assessment of proposals intended to have a direct impact on wellbeing.
Wellbeing is also potentially a useful way of evaluating collateral effects resulting from policies
5 See the Green Book paragraphs 4.24 to 4.45 on longlist appraisal; Project Business Case Guidance page 29 to 32 6 See in more detail Project Business Case Guidance page 29 to 32
5
that are not specifically aimed at wellbeing results. Wellbeing effects may reflect systemic effects
across society and the economy in areas such as health, education, mobility, communication,
working conditions, local environment, public spaces, crime, social cohesion and public safety.
They may also assist in quantifying aesthetic and cultural issues.
1.3 Guidance structure
The remainder of this guidance is structured as follows:
Part I: Background and overview for analysts, policy professionals and decision-makers
• Chapter 2 provides an overview of wellbeing evidence and how it may relate to the
standard economic assumptions generally used in formulating and evaluating policy
options
• Chapter 3 sets out the specific steps which analysts can take to understand where, when
and how wellbeing evidence can be incorporated in compiling the strategic case and in
longlist appraisal
Part II: Practical steps for analysts
• Chapter 4 offers a step-by-step guide for analysts on how to incorporate wellbeing into
consideration of social / public value and its use in social cost-benefit analysis
• Chapter 5 discusses how wellbeing can be incorporated in the monitoring and evaluation
stages of the policy process
• Chapter 6 provides a checklist for analysts incorporating wellbeing into appraisal
Annexes: Further background
Annexes A1 – A5 provide background information to aid understanding and technical detail on
the wellbeing literature discussed in this guidance; they include tables of values from wellbeing
research, sources of further reading and detail on wellbeing measurement
6
2. Wellbeing evidence and assumptions
This chapter summarises how wellbeing is measured in official statistics and provides some of
the evidence.
2.1 Measuring wellbeing
The Office for National Statistics (ONS) uses four survey questions to measure personal
wellbeing. The questions are:
“Overall, how satisfied are you with your life nowadays?”
“Overall, to what extent do you feel the things you do in your life are worthwhile?”
“Overall, how happy did you feel yesterday?”
“Overall, how anxious did you feel yesterday?”1
People are asked to respond to the questions on a scale from 0 to 10 where 0 is “not at all” and
10 is “completely”.
These are known as the ONS4. ONS first added these questions to the Annual Population Survey
(APS), in April 2011. The APS is the source of the national estimates of personal wellbeing in the
UK that are published quarterly by ONS.
Community wellbeing can be measured through a range of indicators (See Annex A for more
information).
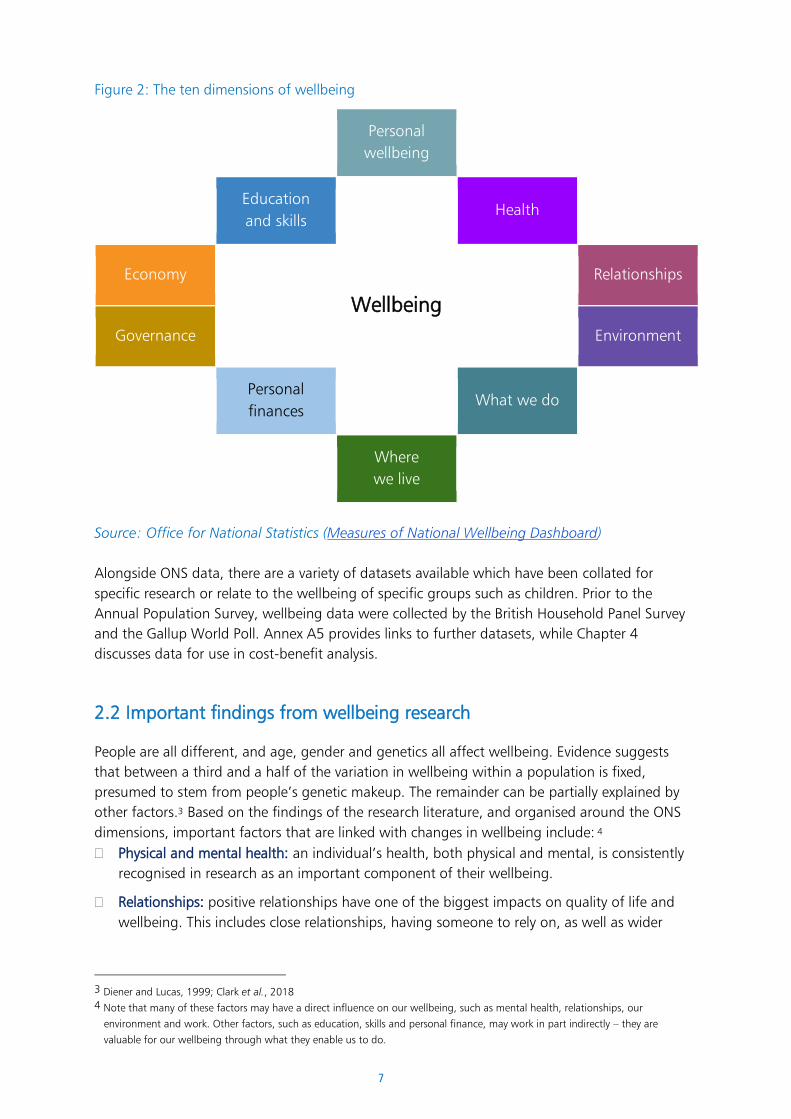
The ONS also measures ten broad dimensions (the ONS calls them “domains”) that have been
shown to matter most to people in the UK (Figure 2) – the measures of national wellbeing.2
The wellbeing dimensions are assessed with a set of indicators including objective measures -
such as crime rates - and subjective measures such as how people feel about their lives. For
example, the ‘Where we live’ dimension includes objective measures such as accessing the
natural environment and crime rates, while the ‘Our relationships’ dimension includes self-
reported assessment of feelings of loneliness. The ONS Measuring National Wellbeing
programme reports progress against these dimensions twice a year.
1 See Annex A for more information on the source of and reasoning for these questions
2 Measures of National Well-being Dashboard
7
Figure 2: The ten dimensions of wellbeing
Personal
wellbeing
Education
and skills Health
Economy
Wellbeing
Relationships
Governance Environment
Personal
finances What we do
Where
we live
Source: Office for National Statistics (Measures of National Wellbeing Dashboard)
Alongside ONS data, there are a variety of datasets available which have been collated for
specific research or relate to the wellbeing of specific groups such as children. Prior to the
Annual Population Survey, wellbeing data were collected by the British Household Panel Survey
and the Gallup World Poll. Annex A5 provides links to further datasets, while Chapter 4
discusses data for use in cost-benefit analysis.
2.2 Important findings from wellbeing research
People are all different, and age, gender and genetics all affect wellbeing. Evidence suggests
that between a third and a half of the variation in wellbeing within a population is fixed,
presumed to stem from people’s genetic makeup. The remainder can be partially explained by
other factors.3 Based on the findings of the research literature, and organised around the ONS
dimensions, important factors that are linked with changes in wellbeing include: 4
Physical and mental health: an individual’s health, both physical and mental, is consistently
recognised in research as an important component of their wellbeing.
Relationships: positive relationships have one of the biggest impacts on quality of life and
wellbeing. This includes close relationships, having someone to rely on, as well as wider
3 Diener and Lucas, 1999; Clark et al., 2018 4 Note that many of these factors may have a direct influence on our wellbeing, such as mental health, relationships, our
environment and work. Other factors, such as education, skills and personal finance, may work in part indirectly – they are
valuable for our wellbeing through what they enable us to do.
8
interactions in a neighbourhood or community. Conversely, feelings of loneliness have a
negative impact.
What people do: generally, having a job is good for wellbeing and considered one of the
most important factors linked with wellbeing.5 Being in a ‘high quality’ job is even better.6
Other types of activity can also affect wellbeing, to a lesser extent - from physical exercise to
taking part in music or art. How people feel when they take part in activity also matters. For
example, giving to others or learning something new can give a sense of purpose, which has
a positive effect on wellbeing. Some activities have an immediate impact, others might have
a longer-term effect.7
Where people live: an individual's dwelling (including aspects such as heating and
dampness), their local environment and the type of community in which they live are
important, including having a safe, clean and pleasant environment, access to facilities and
being part of a cohesive community.
Personal Finance: level of income has a significant effect on wellbeing. As income increases,
it becomes less important for improving wellbeing. A high level of debt can be stressful and
debilitating, and may have a negative effect on feelings of wellbeing.8
Education and Skills: have an impact on employment opportunities and the types of job
available to individuals. Evidence has shown that adult training and education also have
impacts on wellbeing, with varying effects for different groups.9
Governance: trust in institutions alongside the ability to influence decisions, which are
important for people’s lives, are important not only in the workplace and at a community
level, but also at a national level.
Economy: the state of the economy, including GDP movements, unemployment rate
movements, and inflation, have major effects on happiness levels.10
Environment: wellbeing evidence has shown that experiencing nature can improve
wellbeing, for example by reducing stress.11 Similarly, studies have shown a positive link
between wellbeing and environmental factors such as air and noise pollution, temperature
and precipitation.12 Environmental actions can also play a role in the wellbeing of future
generations, through impacts on natural capital.
Contributory factors to wellbeing
Many of the aspects which influence personal wellbeing simply add up, to a certain extent. For
example, people are:
5 See e.g. Clark and Oswald (1994), Winklemann and Winklemann (2003), Jahoda (1982) as well as a systematic review in What
Works Centre for Wellbeing (2017a)
6 For a review of interventions influencing wellbeing through changes to job quality, see Daniels et al. (2017) and associated What
Works for Wellbeing (2017) briefing.
7 See Annex A1 and https://measure.whatworkswellbeing.org/ for an overview of relevant measures 8 See e.g. Butterworth et al. (2009), Bridges and Disney (2010), Selenko and Batinic (2011).
9 For a literature review as well as a systematic review of interventions focusing on adults at greater risk of inequalities or
marginalisation see Tregaskis and Nandi (2018). 10 See e.g. Di Tella, MacCulloch and Oswald (2001)
11 See relevant aspects of Defra Evidence Statement: Health and the Natural Environment and Defra Evidence Statement: The
wellbeing and human health benefits of exposure to the marine and coastal environment 12 Krekel and MacKerron, 2020 as well as literature from Luechinger, Levinson and Welsch
9
● happier on average when in a job rather than unemployed
● even happier if the job is higher quality
● happier still with a high quality job, and in good health
Different aspects also balance each other out. For example, evidence shows that losing a job has
one of the biggest negative impacts on wellbeing. However, where people have social support
from friends and family, they suffer less.13 These positive relationships ‘buffer’ the negative
impact. In the workplace, additional demands or stress can be negative, but this can be
compensated by an increase in purpose, meaning that these jobs can be associated with higher
wellbeing overall.14
Other factors may be positively or negatively reinforcing. For example, better support from
family could be the key to finding a job. Being in work can then provide more opportunities for
connecting with others, becoming physically active, or taking part in cultural activities. The initial
improvement in support could have a ‘multiplier effect’ since each of the following changes can
contribute to people feeling happier about their lives. The reverse is also true: some evidence
suggests that mental health issues and lower wellbeing may impact negatively on employment
trajectories,15 which in turn could further lower wellbeing.
Factors do not influence people in the same way. Initial wellbeing levels play a role. Evidence
suggests that those who have lower wellbeing show a greater increase in wellbeing when they
participate in cultural activities or spend time in green spaces.16 It also depends partially on
characteristics, for example, the impact of employment on wellbeing depends on personality,
values, gender, age, among others.17
Reflecting this, it is important to consider the external conditions which affect wellbeing, the
choices people make alongside the options available, as well as people’s personal capacity and
response to these factors.
Basic needs and low wellbeing
Evidence suggests that meeting certain ‘basic needs’ is highly important, for example meeting a
‘minimum standard’ across levels of health, relationships, security, feelings of purpose, and the
environment.
It has been estimated that around one percent of the UK population score ‘low‘ (0-4) across all
ONS4 measures of wellbeing in 2014-2016 (ONS, 2018).18 The factors that are consistently
associated with people experiencing lowest wellbeing include bad or very bad health,
unemployment, long-term illness or disability (among other things causing economic inactivity),
13 See Gedikli et al. (2017) What Works Centre for Wellbeing briefing for a systematic review of relevant evidence 14 See Daniels et al. (2017) What Works Centre for Wellbeing briefing for a systematic review 15 See Gedikli et al. (2017) and Longhi et al. (2018) What Works Centre for Wellbeing briefings for reviews 16 See for example, Hartig et al (2014), Mitchell and Popham (2008) and Heritage Lottery Fund (2011) 17 See above references
18 Scoring "low" across ONS4 measures, or 0-4, from the 2014-16 Annual Population Survey. Data from ONS publication:
Understanding well-being inequalities: Who has the poorest personal well-being?
10
having no-one to rely on, being single, widowed, divorced or separated, having basic or no
education.19
2.3 Subjective wellbeing effects and economics
Many of the results in the wellbeing literature are consistent with standard economic insights,
theory and assumptions. For example, increases in income improve reported quality of life more
for those on lower incomes than for those on higher incomes, is consistent with the law of
diminishing marginal utility of income (Layard et al., 2008). Similarly, one additional contact is
more important for the wellbeing of someone with very limited social contacts than for
someone with many, or a new green space is more beneficial for those who previously had none
than for those living in the countryside.20
However, other findings from the wellbeing – and related behavioural economics - literature
diverge from common economic assumptions. For instance:
Reference points
There is a growing body of evidence that both comparisons and positions; and direction of
change are important. For example, a loss from an existing state matters more than an identical
gain. Wellbeing evidence also suggests that individuals’ relative positions can matter more than
absolute positions (Di Tella and MacCulloch, 2010; Clark and Oswald, 1996 and Easterlin,
1974). As such income comparisons can affect satisfaction: an increase in someone else’s
income can reduce the sense of wellbeing of a person whose income does not rise (Clark et al..,
2018).
This would have implications for policy making if wellbeing was related only to interpersonal
comparisons of wealth or status: as one person’s wellbeing improved, someone else’s wellbeing
would necessarily deteriorate.21
However, not all aspects of people’s lives are subject to
comparative effects. For example, voluntarily giving to others improves the wellbeing of the giver
as well as that of the recipient (Dunn et al., 2014). Improving the quality of relationships
improves the wellbeing of all parties. Improving the mental health of one partner in a
relationship - say, through counselling - may improve the wellbeing of the other partner as well
(Mervin and Frijter, 2014).
19 For the wellbeing responses of the Annual Population Survey more than 300,000 adults (those aged 16 years and over) are
sampled every year. The survey does not cover adults living in communal establishments such as care homes or prisons. Factors
may relate to underlying aspects – for example, renting is also a factor which ONS analysis identified as associated with scoring
‘low’ across all ONS4 measures. It may not be renting per se which causes low wellbeing, but rather the broader insecurity around
accommodation and in some cases, housing quality. Having a basic or no education may have an impact on employment
prospects and job quality. 20 These findings are consistent with the economic concept of social welfare maximisation, which generally requires prioritising
meeting ‘basic needs’ before seeking to improve an already ‘adequate’ situation because the former has a greater impact on
overall social wellbeing. 21 See range of papers by Gordon D.A Brown
11
Adaptation
In the economics literature it is often assumed that consuming more, or a lasting improvement
in individual’s circumstances, raises utility. However, wellbeing evidence shows that people
adapt to many life events and changes so that the wellbeing impact can diminish over time.22
This would have significant implications for policy if all changes simply become ‘normalised’ due
to acclimatisation over time. In that case every policy change could only temporarily influence
wellbeing. However, importantly, this does not apply to all aspects of life and studies that have
followed the same participants over time show that wellbeing can change significantly over the
long term.23
For example, when people are in a stable partnership, their wellbeing ratings are higher than
those of people not in such relationships. They also stay higher.24 People who are unemployed
have lower ratings of wellbeing than others, and wellbeing stays low while they remain out of
work (Clark et al., 2018). Further, research suggests that people do not adapt to the negative
impact of noise (Weinstein, 1982), disagreeable job conditions, nor to the positive benefits of
volunteering (Binder and Freytag, 2013). People tend to adapt little to situations that regularly
draw their attention (Dolan, 2014). Positive interventions such as cognitive-behavioural therapy
for people with moderate to mild depression has been shown to have a lasting impact on
wellbeing (Butler et al., 2006).
Importance of relationships, trust and fairness
Wellbeing evidence emphasises the contribution to welfare of social relationships to family and
friends (Clark et al., 2018). These relationships are generally given less attention in standard
economic literature.
Economics generally focuses on the outcomes which are achieved – and the resources which are
allocated among individuals or groups. In contrast, wellbeing research suggests that procedural
fairness matters as well. There are conditions under which a less favourable outcome is preferred
if the process has been considered fair (see Lind and Tyler, 1988; and Hollander-Blumoff and
Tyler, 2008).
Challenges of predictions
Classic methods for valuation of social welfare rely on predictions of utility: they ask people what
they think will make them happy or observe their actions (such as tracking what they buy).
Surveys in which large numbers of respondents were asked to rate their subjective wellbeing
have shown, however, that what people think will make them happy is not necessarily what
actually does make them happy.25 Nor do actions, such as the jobs people take or the
neighbourhoods they move to, always reveal “experienced” preferences. Experiences may be
different from predictions.
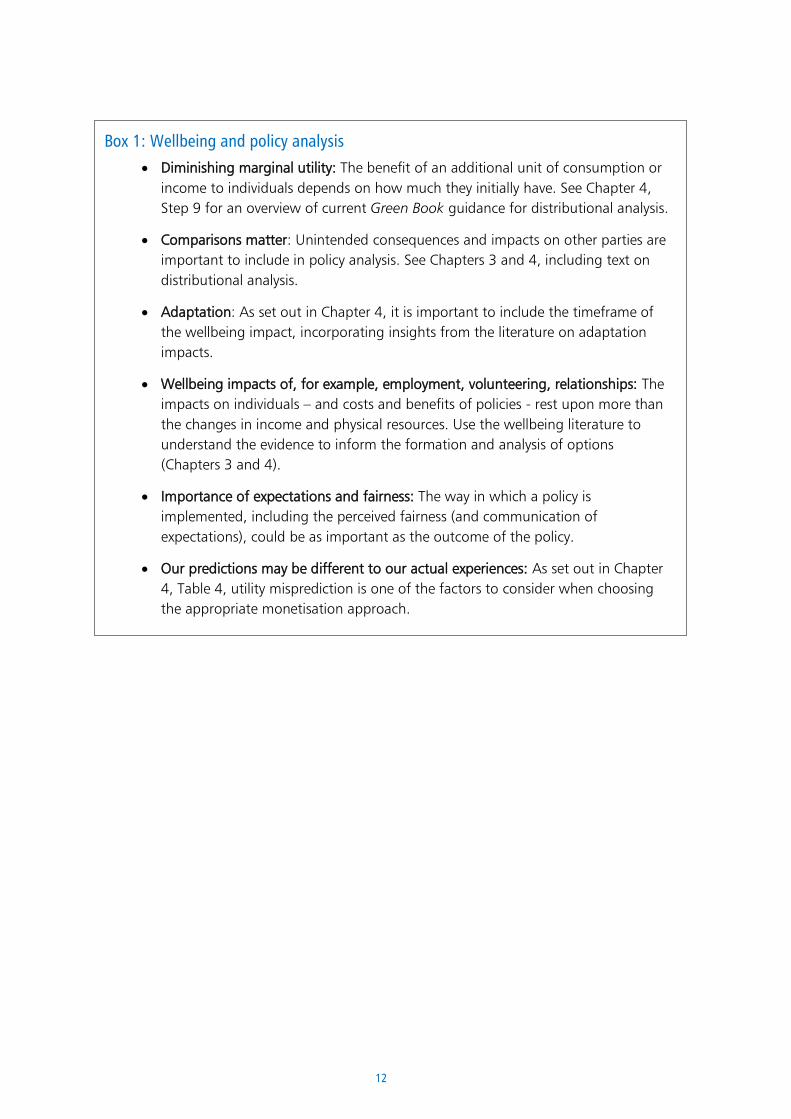
Box 1 summarises what these wellbeing findings imply for appraising policy proposals.
22 For example, see Gilbert et al. (1998) for adaptation to promotion, di Tella & MacCullouch (2010) for adaptation to changes in
income beyond “basic needs”. For adaptation to negative changes in life: Riis et al., (2005) to requiring regular medical treatment
and Lucas (2005) for adaptation to becoming divorced, Graham (2011) for a review of international literature. 23 Fujita and Diener, for example, documented changes in over 17 years of wellbeing data from Germany (Fujita and Diener, 2005).
Hendriks et al. show that those who move to happier countries become happier (Hendriks et al., 2018). 24 Even though the wellbeing ‘boost’ of marriage is short lived, see Lucas et al. (2003) 25 See Dolan and Kahneman (2008) for a discussion of the interpretations of utility and implications
12
Box 1: Wellbeing and policy analysis
• Diminishing marginal utility: The benefit of an additional unit of consumption or
income to individuals depends on how much they initially have. See Chapter 4,
Step 9 for an overview of current Green Book guidance for distributional analysis.
• Comparisons matter: Unintended consequences and impacts on other parties are
important to include in policy analysis. See Chapters 3 and 4, including text on
distributional analysis.
• Adaptation: As set out in Chapter 4, it is important to include the timeframe of
the wellbeing impact, incorporating insights from the literature on adaptation
impacts.
• Wellbeing impacts of, for example, employment, volunteering, relationships: The
impacts on individuals – and costs and benefits of policies - rest upon more than
the changes in income and physical resources. Use the wellbeing literature to
understand the evidence to inform the formation and analysis of options
(Chapters 3 and 4).
• Importance of expectations and fairness: The way in which a policy is
implemented, including the perceived fairness (and communication of
expectations), could be as important as the outcome of the policy.
• Our predictions may be different to our actual experiences: As set out in Chapter
4, Table 4, utility misprediction is one of the factors to consider when choosing
the appropriate monetisation approach.
13
3. Wellbeing in the policy-making process
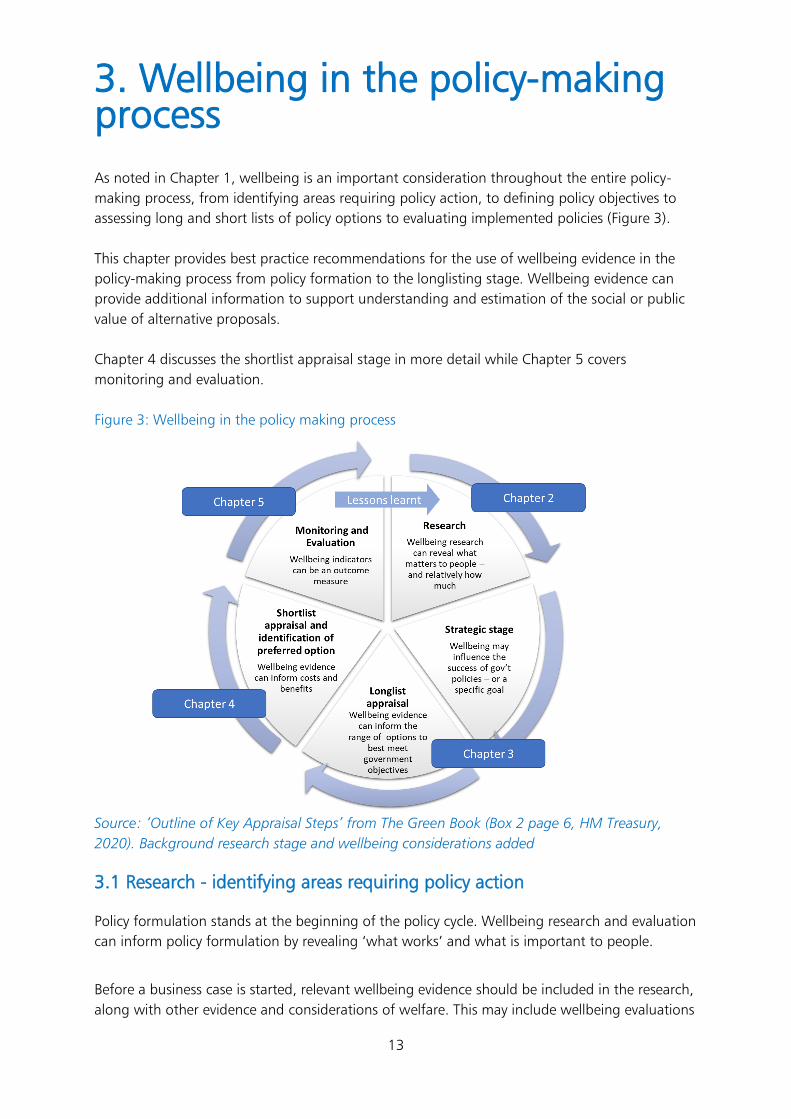
As noted in Chapter 1, wellbeing is an important consideration throughout the entire policy-
making process, from identifying areas requiring policy action, to defining policy objectives to
assessing long and short lists of policy options to evaluating implemented policies (Figure 3).
This chapter provides best practice recommendations for the use of wellbeing evidence in the
policy-making process from policy formation to the longlisting stage. Wellbeing evidence can
provide additional information to support understanding and estimation of the social or public
value of alternative proposals.
Chapter 4 discusses the shortlist appraisal stage in more detail while Chapter 5 covers
monitoring and evaluation.
Figure 3: Wellbeing in the policy making process
Source: ‘Outline of Key Appraisal Steps’ from The Green Book (Box 2 page 6, HM Treasury,
2020). Background research stage and wellbeing considerations added
3.1 Research - identifying areas requiring policy action
Policy formulation stands at the beginning of the policy cycle. Wellbeing research and evaluation
can inform policy formulation by revealing ‘what works’ and what is important to people.
Before a business case is started, relevant wellbeing evidence should be included in the research,
along with other evidence and considerations of welfare. This may include wellbeing evaluations
14
from previous policy interventions as well as general evidence of what matters to the group in
question.
3.2 Strategic stage
In central government, overall policy objectives are determined by ministers or other appointed
decision makers.
Wellbeing may be:
• a direct objective to meet specific needs; examples include the needs of specific groups of
people who may experience low wellbeing
• a favourable policy outcome resulting from the achievement of other objectives such as
‘raising employment’ levels which has well-understood long-term effects on wellbeing
• part of a constraint within which the proposal must be developed, for example avoiding
damage to an environmental factor that is significant for maintaining wellbeing
With this in mind, analysts and policy officials could consider in what way wellbeing evidence
may support the strategic stage and:
• inform the development of policy objectives, for example through highlighting needs of
specific groups and using evidence of what is most important to people. Wellbeing
evidence can also help assess whether a policy may be confounded by adaptation and
comparison.1 Improving wellbeing may be most effective where interventions are
specifically designed with this in mind – for example, concentrating on areas where
evidence suggests there is a long-term impact on wellbeing.
• support modifications or additions to traditional policy objectives. As discussed above,
raising employment levels has well-understood long-term effects on wellbeing. Going
further, long-term epidemiological studies show that the type of employment is also
important for wellbeing.2 Existing policy outcomes thus might have to become more
subtle and targeted to improve wellbeing outcomes. See Box 2 for examples.
• support meeting other policy objectives. Improved health and wellbeing can in turn
increase productivity3 and reduce exit from the workforce – leading to the more effective
delivery of objectives. See Box 3.
As will be covered in Chapter 4, when considering claiming wellbeing effects as part of benefits
calculations, care must be taken not to double count what may also be claimed as a welfare
effect.
1 A change in policy might not have the desired effects if it improves wellbeing only temporarily because of these adaptation or
comparison effects.
2 Long-term epidemiological studies show that improvements in autonomy, support, use of skills, variety at work, balancing
demands and security in the workplace yield long-term mental and physical health benefits. See Marmot et al. (1991.). 3 De Neve et al., 2013
15
As described in the Magenta Book,4 it is important to consider evaluation early, in the context of
this strategic dimension, to maximise opportunities to collect good evidence.
3.3 Drawing up and narrowing down the longlist
Chapter 4 of the Green Book5 describes the longlisting stage in full detail, including the required
“options framework filter” approach. The section below highlights how and where wellbeing
considerations may fit into this existing Green Book framework.
No amount of detailed analysis helps if good policy options are omitted from the start.
Wellbeing evidence, where relevant, can play a valuable role in developing options around the
4 See e.g. Section 1.6 of the Magenta Book (HM Treasury, 2020) 5 See Green Book 2020 Chapter 4 from paragraph 4.1 to 4.11
Box 2: Wellbeing in policy goals
Wellbeing evidence has informed UK policy goals in numerous areas.
• Recognising the importance of social relationships for wellbeing, the UK has
developed an evidence-based strategy to address loneliness across the life course
(DCMS, 2018).
• Schools have been testing a new curriculum, developed as part of a programme to
teach resilience, with lessons in areas important for wellbeing, including
relationships, healthy habits, social media awareness, and mindfulness, to increase
the curriculum’s effectiveness, the programme has a strong focus on teacher
training.
• With the 2018 Good Work Plan, the government placed equal importance on the
quality of work alongside quantity of work. Boosting the quantity of work remains an
important policy objective, but the Good Work Plan also values job quality, i.e. job
satisfaction; fair pay; participation and progression; wellbeing, health and safety; and
voice and autonomy – recognising the importance of these factors for personal
wellbeing.
References:
• A connected society: A strategy for tackling loneliness – Laying the foundations for change (DCMS, 2018).
• Bounce Forward. (n.d) Healthy Minds research project
• Good Work Plan (UK Government, 2018).
Box 3: Impact on productivity and pro-social behaviours
Evidence shows that improvements in people’s sense of wellbeing can improve health,
productivity and pro-social behaviours (Graham et al.., 2004, De Neve et al.., 2013, Oswald
et al.., 2015). This means that policies with an impact on wellbeing may not only have
impacts on how individuals feel, or the functioning or communities, but also have an effect
on among other things the productivity of these individuals, or the readiness for
communities to provide voluntary support for others.
16
scope of the service to be provided, choices about the technical service solution and, in some
cases, inform options for service implementation, delivery and funding. Table 1 summarises.
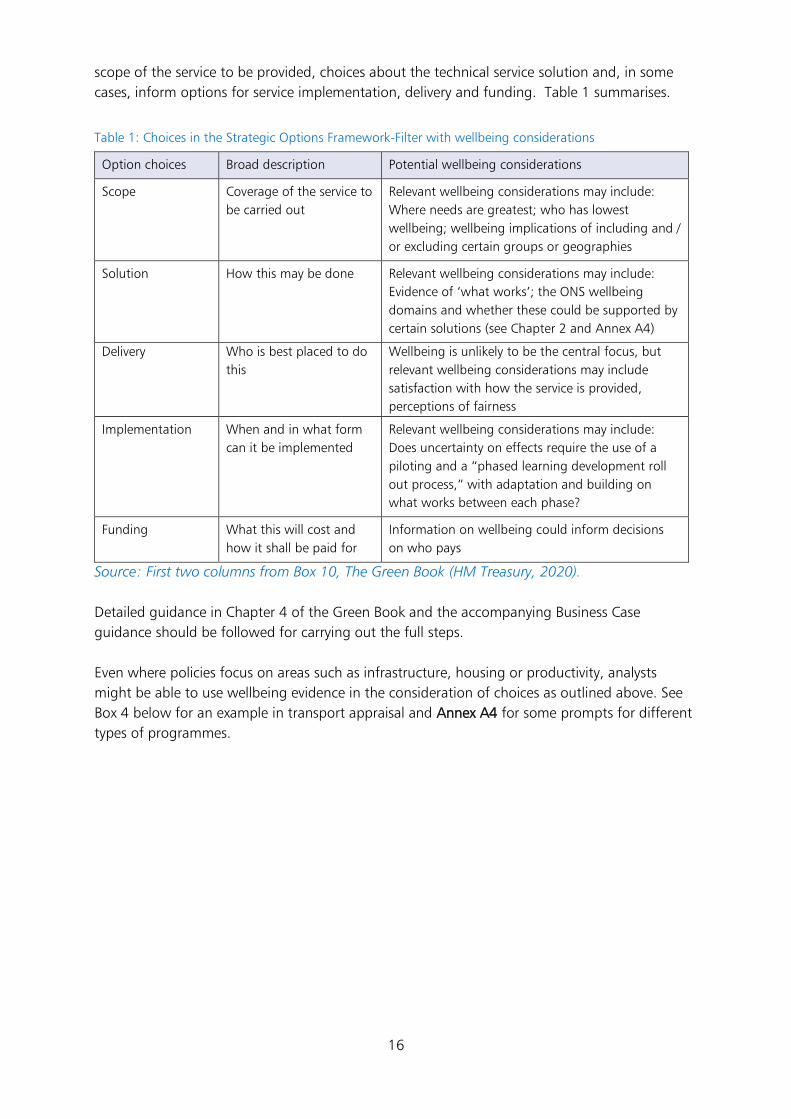
Table 1: Choices in the Strategic Options Framework-Filter with wellbeing considerations
Option choices Broad description Potential wellbeing considerations
Scope Coverage of the service to
be carried out
Relevant wellbeing considerations may include:
Where needs are greatest; who has lowest
wellbeing; wellbeing implications of including and /
or excluding certain groups or geographies
Solution How this may be done Relevant wellbeing considerations may include:
Evidence of ‘what works’; the ONS wellbeing
domains and whether these could be supported by
certain solutions (see Chapter 2 and Annex A4)
Delivery Who is best placed to do
this
Wellbeing is unlikely to be the central focus, but
relevant wellbeing considerations may include
satisfaction with how the service is provided,
perceptions of fairness
Implementation When and in what form
can it be implemented
Relevant wellbeing considerations may include:
Does uncertainty on effects require the use of a
piloting and a “phased learning development roll
out process,” with adaptation and building on
what works between each phase?
Funding What this will cost and
how it shall be paid for
Information on wellbeing could inform decisions
on who pays
Source: First two columns from Box 10, The Green Book (HM Treasury, 2020).
Detailed guidance in Chapter 4 of the Green Book and the accompanying Business Case
guidance should be followed for carrying out the full steps.
Even where policies focus on areas such as infrastructure, housing or productivity, analysts
might be able to use wellbeing evidence in the consideration of choices as outlined above. See
Box 4 below for an example in transport appraisal and Annex A4 for some prompts for different
types of programmes.
17
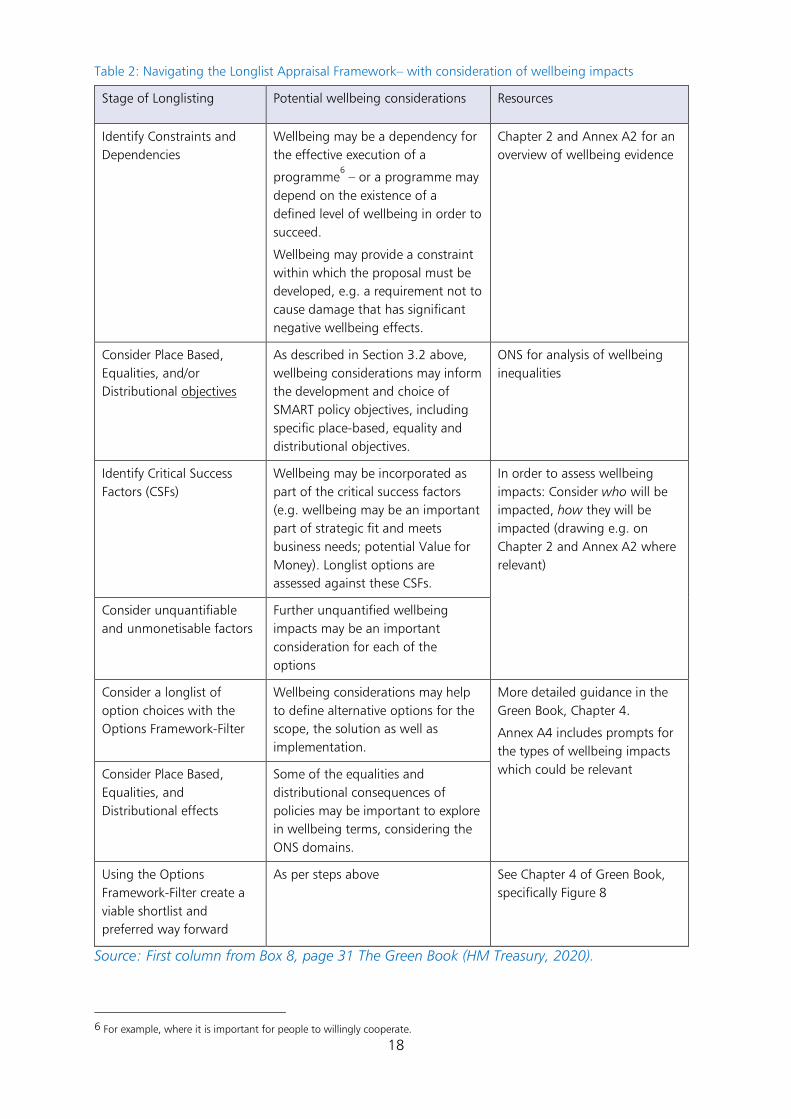
Table 2 summarises the main stages in Green Book longlist appraisal, alongside the potential
wellbeing considerations at each step.
Box 4: Wellbeing in transport appraisal: generating options at the longlist stage
A transport improvement scheme may primarily be planned to reduce congestion and
improve productivity. Wellbeing evidence may help to draw up the longlist of options. For
example, considering the service scope: wellbeing evidence may identify needs of those in a
particular area, or particular groups, informing the choice of options for geographic scope.
Some of the distributional consequences of transport policy – such as accessibility for no-
car households or the relative affordability of public transport for difference socio-economic
groups – could be explored in subjective wellbeing terms. This may offer insights beyond
what conventional, more aggregate, appraisal techniques can offer.
Wellbeing evidence may also inform the proposed service solutions. Alternative options at
the longlist stage may involve promoting active modes, following different route
alignments, or relocating stations and/or multi-modal interchanges. Part of the design
could incorporate the addition of planting trees along the route or in connecting areas – to
reduce noise impacts as well as reflecting the evidence linking wellbeing and local
environmental quality. Different designs may create community ‘meeting points’ with a
positive impact on wellbeing.
Wellbeing evidence may also be relevant for informing the service implementation options.
Should approaches first be trialled, to build on what works for wellbeing?
Using the framework outlined in the Green Book Chapter 4, wellbeing may also be a
dependency for the effective delivery of a programme as well as a constraint within which
the proposal must be developed, for example as part of avoiding damage to an
environmental factor that is significant for maintaining wellbeing.
For an effective focus on improving wellbeing outcomes, it is important not only to change
the external conditions, but also to support personal (internal) resources, and the activities
which people take part in which help to develop the collective wellbeing in the community.
For example, if we are creating cycle infrastructure, do people have the skills, equipment
and motivation to cycle? How could this be changed? What supportive infrastructure or
programming can be set up so that people may adapt the activities they take part in, to use
the cycle infrastructure? Can local connections be drawn upon through this infrastructure,
in order to build community wellbeing?
18
Table 2: Navigating the Longlist Appraisal Framework– with consideration of wellbeing impacts
Stage of Longlisting Potential wellbeing considerations Resources
Identify Constraints and
Dependencies
Wellbeing may be a dependency for
the effective execution of a
programme6 – or a programme may
depend on the existence of a
defined level of wellbeing in order to
succeed.
Wellbeing may provide a constraint
within which the proposal must be
developed, e.g. a requirement not to
cause damage that has significant
negative wellbeing effects.
Chapter 2 and Annex A2 for an
overview of wellbeing evidence
Consider Place Based,
Equalities, and/or
Distributional objectives
As described in Section 3.2 above,
wellbeing considerations may inform
the development and choice of
SMART policy objectives, including
specific place-based, equality and
distributional objectives.
ONS for analysis of wellbeing
inequalities
Identify Critical Success
Factors (CSFs)
Wellbeing may be incorporated as
part of the critical success factors
(e.g. wellbeing may be an important
part of strategic fit and meets
business needs; potential Value for
Money). Longlist options are
assessed against these CSFs.
In order to assess wellbeing
impacts: Consider who will be
impacted, how they will be
impacted (drawing e.g. on
Chapter 2 and Annex A2 where
relevant)
Consider unquantifiable
and unmonetisable factors
Further unquantified wellbeing
impacts may be an important
consideration for each of the
options
Consider a longlist of
option choices with the
Options Framework-Filter
Wellbeing considerations may help
to define alternative options for the
scope, the solution as well as
implementation.
More detailed guidance in the
Green Book, Chapter 4.
Annex A4 includes prompts for
the types of wellbeing impacts
which could be relevant Consider Place Based,
Equalities, and
Distributional effects
Some of the equalities and
distributional consequences of
policies may be important to explore
in wellbeing terms, considering the
ONS domains.
Using the Options
Framework-Filter create a
viable shortlist and
preferred way forward
As per steps above See Chapter 4 of Green Book,
specifically Figure 8
Source: First column from Box 8, page 31 The Green Book (HM Treasury, 2020).
6 For example, where it is important for people to willingly cooperate.
19
4. Wellbeing in shortlist appraisal Chapter 4 sets out how wellbeing evidence may be used to improve the assessment of costs and
benefits in appraisal of shortlist options. This chapter should be read alongside and used in
conjunction with Chapter 5 of the Green Book (2020).
4.1 Overview
HM Treasury’s Green Book states: “...The appraisal of social value, also known as public value, is
based on the principles and ideas of welfare economics and concerns overall social welfare
efficiency…. Social or public value therefore includes all significant costs and benefits that affect
the welfare and wellbeing of the population….” (Paragraph 2.3, The Green Book 2020, HM
Treasury).
The main function of shortlist analysis is to differentiate between the shortlisted options that
have been produced at the longlist analysis stage. At the shortlist stage, Social Cost-Benefit
Analysis or Social Cost-Effectiveness Analysis, is used to identify the option which will optimise
public value and support advice on achieving value for money as defined by the Green Book.
Evidence from wellbeing research and analysis, where relevant and credible, can provide
additional information on positive and negative effects, improving the assessment of important
costs and benefits in shortlist appraisal.7 As discussed below, measurement and valuation should
be proportionate, focused on areas which can make a difference to the choice between options
that is being considered.
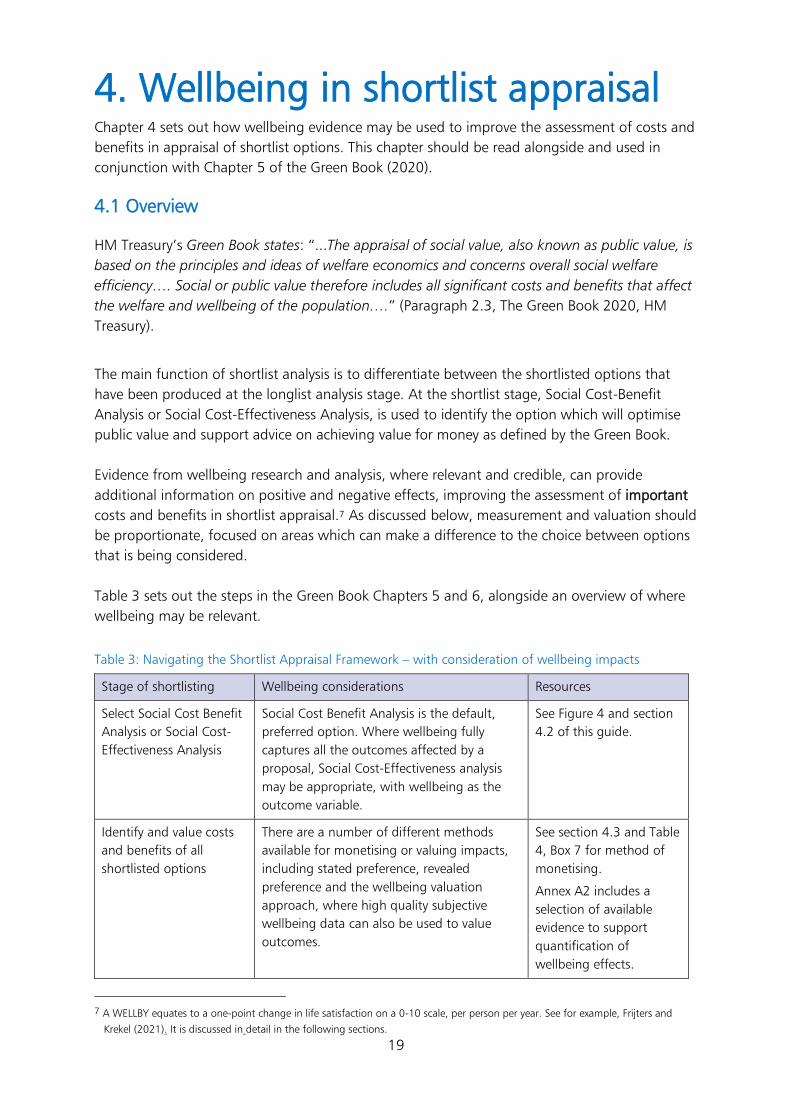
Table 3 sets out the steps in the Green Book Chapters 5 and 6, alongside an overview of where
wellbeing may be relevant.
Table 3: Navigating the Shortlist Appraisal Framework – with consideration of wellbeing impacts
Stage of shortlisting Wellbeing considerations Resources
Select Social Cost Benefit
Analysis or Social Cost-
Effectiveness Analysis
Social Cost Benefit Analysis is the default,
preferred option. Where wellbeing fully
captures all the outcomes affected by a
proposal, Social Cost-Effectiveness analysis
may be appropriate, with wellbeing as the
outcome variable.
See Figure 4 and section
4.2 of this guide.
Identify and value costs
and benefits of all
shortlisted options
There are a number of different methods
available for monetising or valuing impacts,
including stated preference, revealed
preference and the wellbeing valuation
approach, where high quality subjective
wellbeing data can also be used to value
outcomes.
See section 4.3 and Table
4, Box 7 for method of
monetising.
Annex A2 includes a
selection of available
evidence to support
quantification of
wellbeing effects.
7 A WELLBY equates to a one-point change in life satisfaction on a 0-10 scale, per person per year. See for example, Frijters and
Krekel (2021). It is discussed in detail in the following sections.
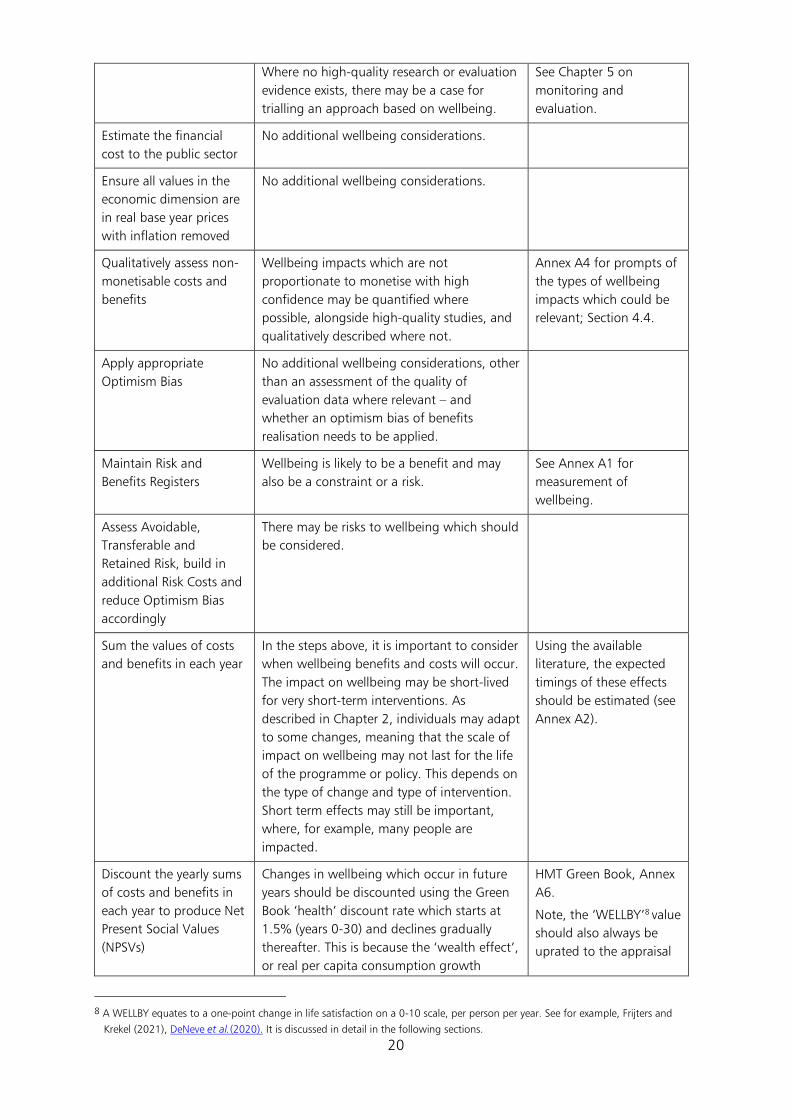
20
Where no high-quality research or evaluation
evidence exists, there may be a case for
trialling an approach based on wellbeing.
See Chapter 5 on
monitoring and
evaluation.
Estimate the financial
cost to the public sector
No additional wellbeing considerations.
Ensure all values in the
economic dimension are
in real base year prices
with inflation removed
No additional wellbeing considerations.
Qualitatively assess non-
monetisable costs and
benefits
Wellbeing impacts which are not
proportionate to monetise with high
confidence may be quantified where
possible, alongside high-quality studies, and
qualitatively described where not.
Annex A4 for prompts of
the types of wellbeing
impacts which could be
relevant; Section 4.4.
Apply appropriate
Optimism Bias
No additional wellbeing considerations, other
than an assessment of the quality of
evaluation data where relevant – and
whether an optimism bias of benefits
realisation needs to be applied.
Maintain Risk and
Benefits Registers
Wellbeing is likely to be a benefit and may
also be a constraint or a risk.
See Annex A1 for
measurement of
wellbeing.
Assess Avoidable,
Transferable and
Retained Risk, build in
additional Risk Costs and
reduce Optimism Bias
accordingly
There may be risks to wellbeing which should
be considered.
Sum the values of costs
and benefits in each year
In the steps above, it is important to consider
when wellbeing benefits and costs will occur.
The impact on wellbeing may be short-lived
for very short-term interventions. As
described in Chapter 2, individuals may adapt
to some changes, meaning that the scale of
impact on wellbeing may not last for the life
of the programme or policy. This depends on
the type of change and type of intervention.
Short term effects may still be important,
where, for example, many people are
impacted.
Using the available
literature, the expected
timings of these effects
should be estimated (see
Annex A2).
Discount the yearly sums
of costs and benefits in
each year to produce Net
Present Social Values
(NPSVs)
Changes in wellbeing which occur in future
years should be discounted using the Green
Book ‘health’ discount rate which starts at
1.5% (years 0-30) and declines gradually
thereafter. This is because the ‘wealth effect’,
or real per capita consumption growth
HMT Green Book, Annex
A6.
Note, the ‘WELLBY’8 value
should also always be
uprated to the appraisal
8 A WELLBY equates to a one-point change in life satisfaction on a 0-10 scale, per person per year. See for example, Frijters and
Krekel (2021), DeNeve et al.(2020). It is discussed in detail in the following sections.
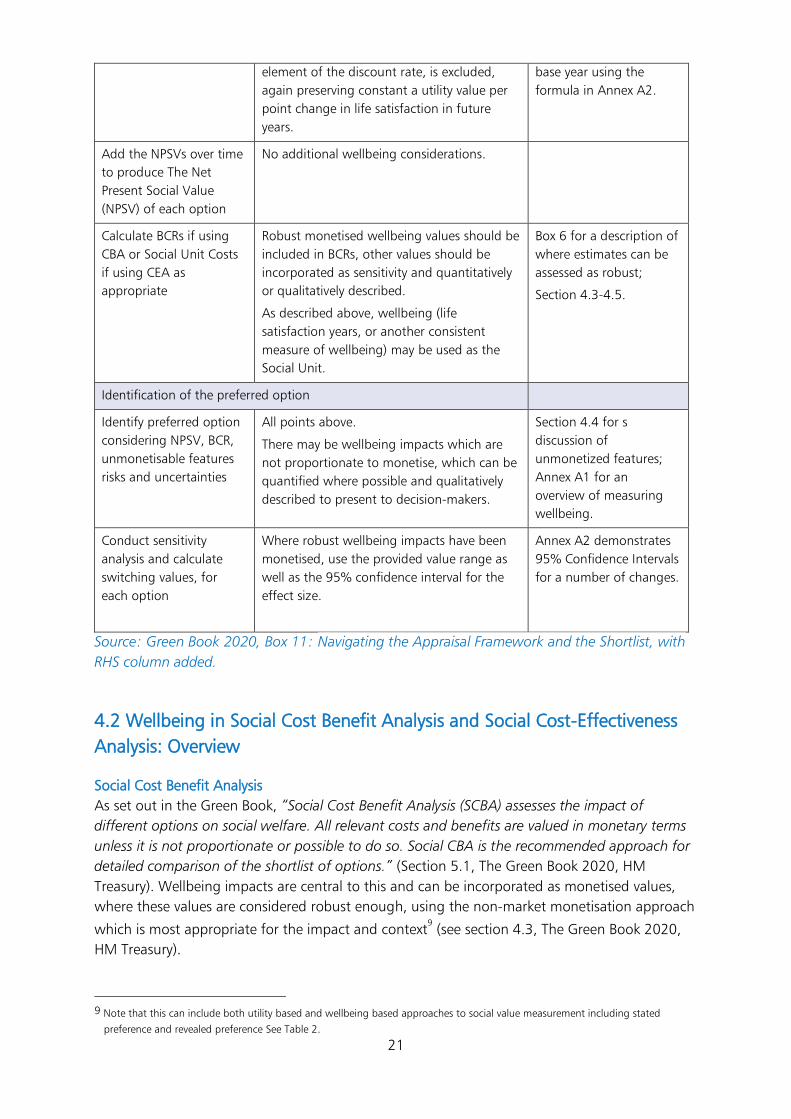
21
element of the discount rate, is excluded,
again preserving constant a utility value per
point change in life satisfaction in future
years.
base year using the
formula in Annex A2.
Add the NPSVs over time
to produce The Net
Present Social Value
(NPSV) of each option
No additional wellbeing considerations.
Calculate BCRs if using
CBA or Social Unit Costs
if using CEA as
appropriate
Robust monetised wellbeing values should be
included in BCRs, other values should be
incorporated as sensitivity and quantitatively
or qualitatively described.
As described above, wellbeing (life
satisfaction years, or another consistent
measure of wellbeing) may be used as the
Social Unit.
Box 6 for a description of
where estimates can be
assessed as robust;
Section 4.3-4.5.
Identification of the preferred option
Identify preferred option
considering NPSV, BCR,
unmonetisable features
risks and uncertainties
All points above.
There may be wellbeing impacts which are
not proportionate to monetise, which can be
quantified where possible and qualitatively
described to present to decision-makers.
Section 4.4 for s
discussion of
unmonetized features;
Annex A1 for an
overview of measuring
wellbeing.
Conduct sensitivity
analysis and calculate
switching values, for
each option
Where robust wellbeing impacts have been
monetised, use the provided value range as
well as the 95% confidence interval for the
effect size.
Annex A2 demonstrates
95% Confidence Intervals
for a number of changes.
Source: Green Book 2020, Box 11: Navigating the Appraisal Framework and the Shortlist, with
RHS column added.
4.2 Wellbeing in Social Cost Benefit Analysis and Social Cost-Effectiveness
Analysis: Overview
Social Cost Benefit Analysis
As set out in the Green Book, “Social Cost Benefit Analysis (SCBA) assesses the impact of
different options on social welfare. All relevant costs and benefits are valued in monetary terms
unless it is not proportionate or possible to do so. Social CBA is the recommended approach for
detailed comparison of the shortlist of options.” (Section 5.1, The Green Book 2020, HM
Treasury). Wellbeing impacts are central to this and can be incorporated as monetised values,
where these values are considered robust enough, using the non-market monetisation approach
which is most appropriate for the impact and context9 (see section 4.3, The Green Book 2020,
HM Treasury).
9 Note that this can include both utility based and wellbeing based approaches to social value measurement including stated
preference and revealed preference See Table 2.
22
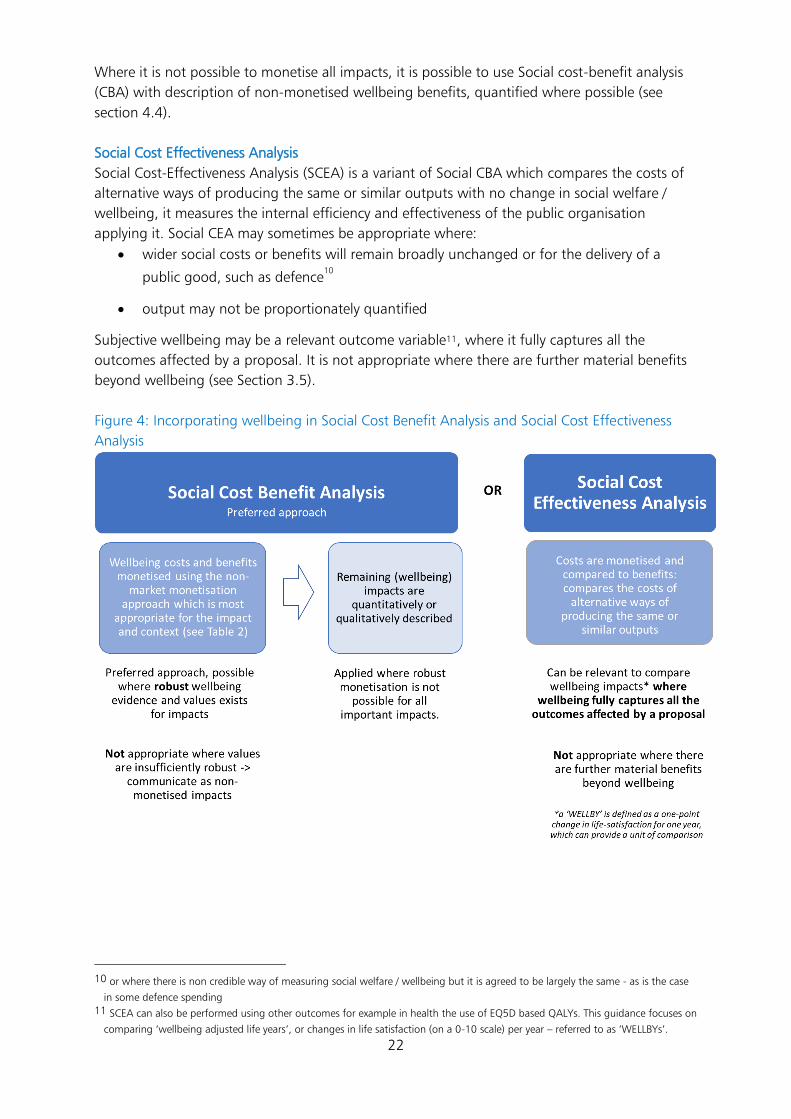
Where it is not possible to monetise all impacts, it is possible to use Social cost-benefit analysis
(CBA) with description of non-monetised wellbeing benefits, quantified where possible (see
section 4.4).
Social Cost Effectiveness Analysis
Social Cost-Effectiveness Analysis (SCEA) is a variant of Social CBA which compares the costs of
alternative ways of producing the same or similar outputs with no change in social welfare /
wellbeing, it measures the internal efficiency and effectiveness of the public organisation
applying it. Social CEA may sometimes be appropriate where:
• wider social costs or benefits will remain broadly unchanged or for the delivery of a
public good, such as defence10
• output may not be proportionately quantified
Subjective wellbeing may be a relevant outcome variable11, where it fully captures all the
outcomes affected by a proposal. It is not appropriate where there are further material benefits
beyond wellbeing (see Section 3.5).
Figure 4: Incorporating wellbeing in Social Cost Benefit Analysis and Social Cost Effectiveness
Analysis
10 or where there is non credible way of measuring social welfare / wellbeing but it is agreed to be largely the same - as is the case
in some defence spending 11 SCEA can also be performed using other outcomes for example in health the use of EQ5D based QALYs. This guidance focuses on
comparing ‘wellbeing adjusted life years’, or changes in life satisfaction (on a 0-10 scale) per year – referred to as ‘WELLBYs’.
23
As set out in the Green Book, the preferred approach is social cost benefit analysis, but the
appropriate approach will depend on the evidence and the nature of the case under
consideration.
4.3 Social Cost Benefit Analysis: monetise relevant costs and benefits
Social Cost Benefit Analysis seeks to express the full costs and benefits of a project in monetary
terms by looking at the impact on people’s wellbeing.12
There are several different methods
available for monetising or valuing these impacts on wellbeing. These include stated preference
methods, revealed preference methods and the wellbeing valuation approach, where subjective
wellbeing data can also be used to value outcomes.
Choosing the most appropriate approach for monetisation requires understanding of the
strengths and weaknesses of different non-market valuation techniques.13
For wellbeing impacts
that can be credibly and proportionately monetised, the ‘type’ of benefit which is being
measured as well as the availability of information will be important. Table 4 sets out where the
different approaches may be more or less appropriate.
It is common to use values from a range of methods in Social Cost Benefit Analysis. Regardless
of which approach is used, it is good practice to:
• consider whether the impact is a loss or a gain and use the appropriate value14
12 As set out in HM Treasury’s Green Book: “Social Cost Benefit Analysis (CBA) assesses the impact of different options on social
welfare. All relevant costs and benefits are valued in monetary terms, unless it is not proportionate or possible to do so. Social Cost
Benefit Analysis (CBA) is the recommended approach for detailed comparison of the shortlist of options.” (Paragraph 5.2 and 5.3,
The Green Book 2020, HM Treasury). 13 see the Green Book for further information, Chapter 6. 14In the case of stated preferences, this will represent the difference in WTA and WTP. Where monetising wellbeing impacts using
the approach recommended in Box 7, the wellbeing impact will be monetised with the same unit value whether it is a gain or a
loss. However, robust wellbeing impacts will show that the wellbeing impact of a gain being different to the impact of a loss.
Where this information is not available, impacts should be adjusted appropriately, with uncertainty where required.
Box 5: Quantifying wellbeing impact to incorporate in SCBA and SCEA In this Chapter subjective wellbeing is mainly quantified through changes in ‘life
satisfaction’ on a 0 – 10 scale. Life satisfaction has become fairly standardised in policy and
economic studies due to increased data availability and its use in numerous studies, which
makes it easier to compare effects consistently. 1 The effects provided in Appendix A2 mainly
show the impacts on life satisfaction on a 0 – 10 point scale.
However, depending on the policy, wellbeing may best be measured and quantified in
other ways, including mental health scales or momentary measures. See Annex A1 on
measuring wellbeing for more information on alternatives.
[1] Life satisfaction is also preferred by many analysts as it incorporates positive and negative emotions (overall wellbeing being a balance of these) together with a cognitive assessment of how well one’s life measures up to aspirations, goals and the achievements of others (Kahneman and Krueger, 2006; Diener, 1984), which means it provides a more holistic view of wellbeing than momentary measures.
24
• use a clear logic to avoid double counting across monetised impacts (see ‘Avoiding
double counting’, below)
• “quality assure” the method of the study used, as discussed in Box 6 below:
o assess whether the important econometric and other assumptions hold
o consider whether the context, population and change which takes place in the
study is relevant to the policy question15
• carry out a sense-check of whether the monetised figure make sense, for example if the
scale of the monetised impact is plausible if scaled up to a relevant population
• compare with findings from elsewhere, including other countries, regions or time – a
process known as ‘triangulation’. Monetised subjective wellbeing values and
conventional WTP/WTA values are not generally expected to coincide, except where an
individual’s stated preferences align perfectly with maximising their own subjective
wellbeing.16
This means that triangulation should not be seeking to assess whether
valuations are the same, but whether differences are plausible given an assessment of
the limitations/omissions that may be a feature of market prices, stated or revealed
preference values
• carry out sensitivity analysis on the value, which in the case of wellbeing may include
taking different valuation methods and more than one subjective wellbeing value
Robust values can be included as monetised values in Social Cost Benefit Analysis. The points
above should be considered for all valuation approaches, including stated and revealed
preference. Robustness in the context of subjective wellbeing valuation is discussed in more
detail in Box 6.
Values where there is less confidence, based on the points above and the principles in Box 6,
may be more appropriate to include as a sensitivity or as additional, non-monetised impacts (see
section 4.4).
15 Value Transfer refers to the use of existing economic valuation evidence in a new appraisal context.
For more information, Defra’s Enabling a Natural Capital Approach guidance discusses Value Transfer methods. 16 Fujiwara and Campbell (2011).
25
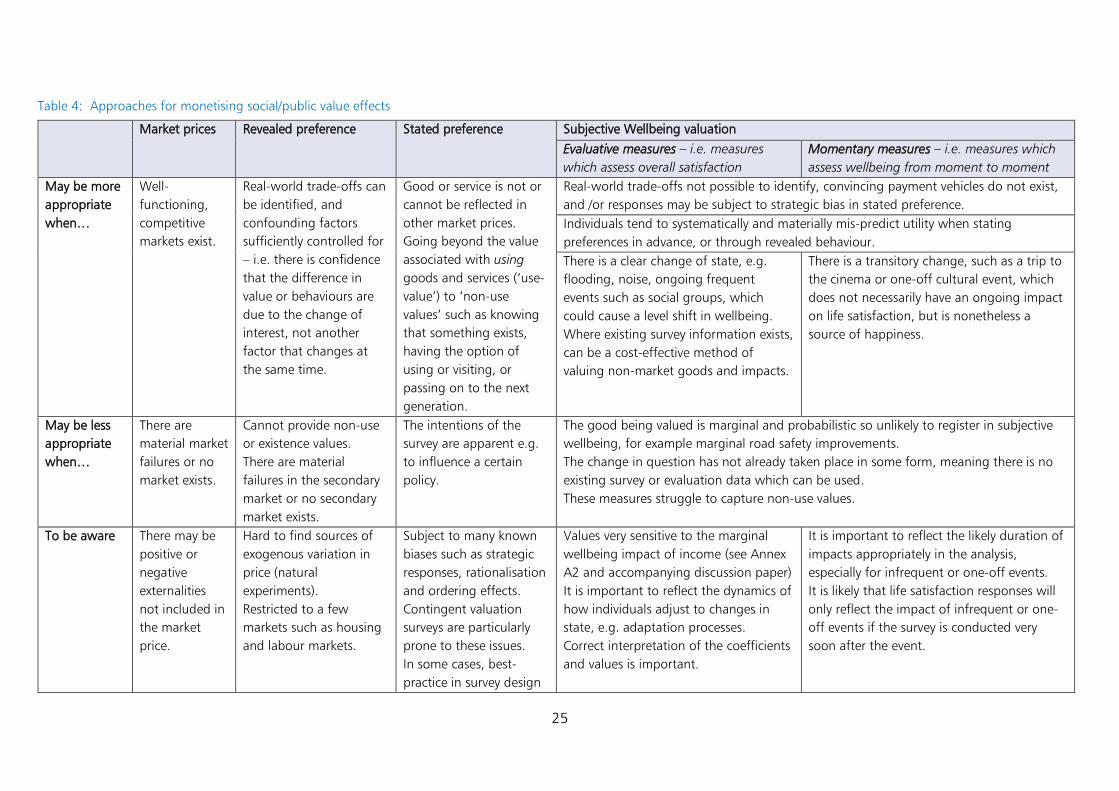
Table 4: Approaches for monetising social/public value effects
Market prices Revealed preference Stated preference Subjective Wellbeing valuation
Evaluative measures – i.e. measures
which assess overall satisfaction
Momentary measures – i.e. measures which
assess wellbeing from moment to moment
May be more
appropriate
when…
Well-
functioning,
competitive
markets exist.
Real-world trade-offs can
be identified, and
confounding factors
sufficiently controlled for
– i.e. there is confidence
that the difference in
value or behaviours are
due to the change of
interest, not another
factor that changes at
the same time.
Good or service is not or
cannot be reflected in
other market prices.
Going beyond the value
associated with using
goods and services (‘use-
value’) to ‘non-use
values’ such as knowing
that something exists,
having the option of
using or visiting, or
passing on to the next
generation.
Real-world trade-offs not possible to identify, convincing payment vehicles do not exist,
and /or responses may be subject to strategic bias in stated preference.
Individuals tend to systematically and materially mis-predict utility when stating
preferences in advance, or through revealed behaviour.
There is a clear change of state, e.g.
flooding, noise, ongoing frequent
events such as social groups, which
could cause a level shift in wellbeing.
Where existing survey information exists,
can be a cost-effective method of
valuing non-market goods and impacts.
There is a transitory change, such as a trip to
the cinema or one-off cultural event, which
does not necessarily have an ongoing impact
on life satisfaction, but is nonetheless a
source of happiness.
May be less
appropriate
when…
There are
material market
failures or no
market exists.
Cannot provide non-use
or existence values.
There are material
failures in the secondary
market or no secondary
market exists.
The intentions of the
survey are apparent e.g.
to influence a certain
policy.
The good being valued is marginal and probabilistic so unlikely to register in subjective
wellbeing, for example marginal road safety improvements.
The change in question has not already taken place in some form, meaning there is no
existing survey or evaluation data which can be used.
These measures struggle to capture non-use values.
To be aware There may be
positive or
negative
externalities
not included in
the market
price.
Hard to find sources of
exogenous variation in
price (natural
experiments).
Restricted to a few
markets such as housing
and labour markets.
Subject to many known
biases such as strategic
responses, rationalisation
and ordering effects.
Contingent valuation
surveys are particularly
prone to these issues.
In some cases, best-
practice in survey design
Values very sensitive to the marginal
wellbeing impact of income (see Annex
A2 and accompanying discussion paper)
It is important to reflect the dynamics of
how individuals adjust to changes in
state, e.g. adaptation processes.
Correct interpretation of the coefficients
and values is important.
It is important to reflect the likely duration of
impacts appropriately in the analysis,
especially for infrequent or one-off events.
It is likely that life satisfaction responses will
only reflect the impact of infrequent or one-
off events if the survey is conducted very
soon after the event.
26
Market prices Revealed preference Stated preference Subjective Wellbeing valuation
Evaluative measures – i.e. measures
which assess overall satisfaction
Momentary measures – i.e. measures which
assess wellbeing from moment to moment
can help to mitigate
these issues.
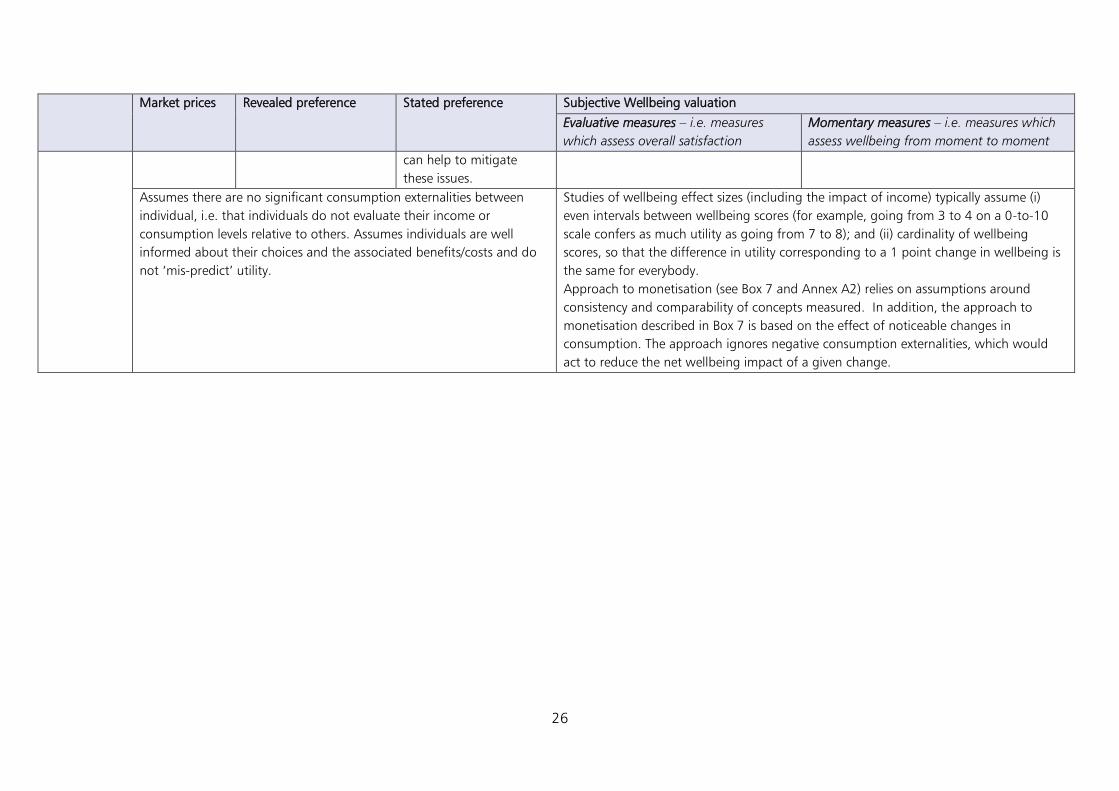
Assumes there are no significant consumption externalities between
individual, i.e. that individuals do not evaluate their income or
consumption levels relative to others. Assumes individuals are well
informed about their choices and the associated benefits/costs and do
not ‘mis-predict’ utility.
Studies of wellbeing effect sizes (including the impact of income) typically assume (i)
even intervals between wellbeing scores (for example, going from 3 to 4 on a 0-to-10
scale confers as much utility as going from 7 to 8); and (ii) cardinality of wellbeing
scores, so that the difference in utility corresponding to a 1 point change in wellbeing is
the same for everybody.
Approach to monetisation (see Box 7 and Annex A2) relies on assumptions around
consistency and comparability of concepts measured. In addition, the approach to
monetisation described in Box 7 is based on the effect of noticeable changes in
consumption. The approach ignores negative consumption externalities, which would
act to reduce the net wellbeing impact of a given change.
27
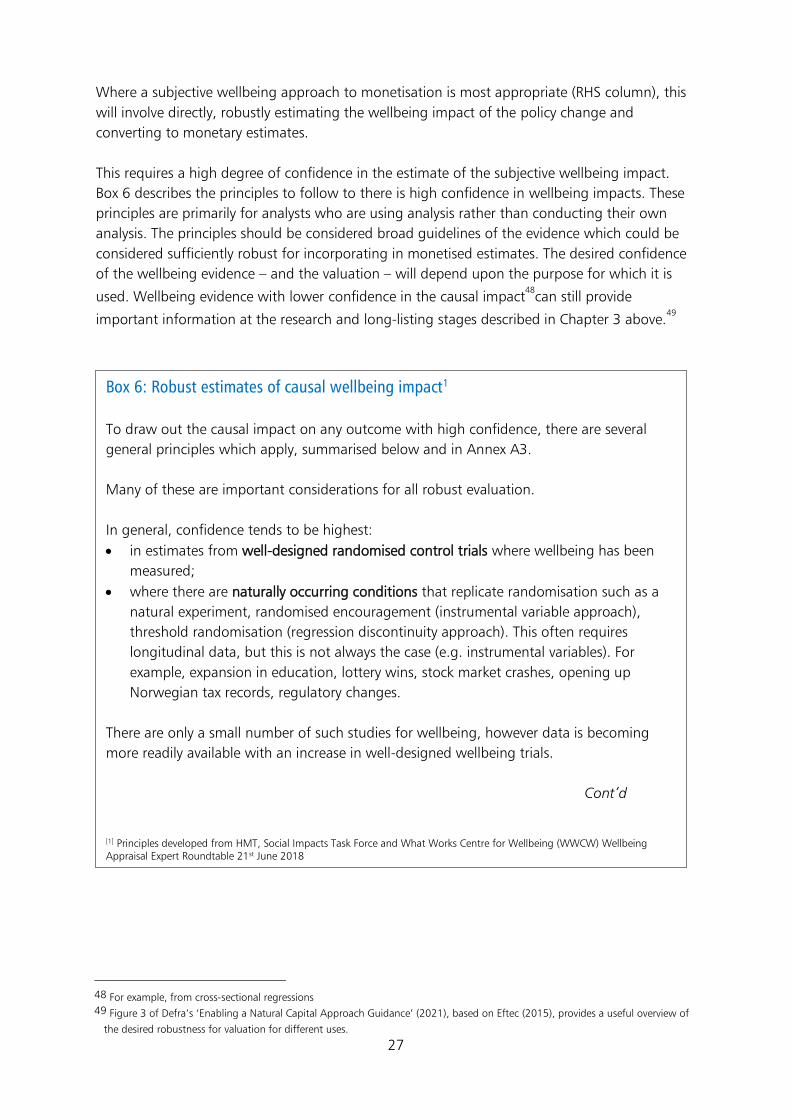
Where a subjective wellbeing approach to monetisation is most appropriate (RHS column), this
will involve directly, robustly estimating the wellbeing impact of the policy change and
converting to monetary estimates.
This requires a high degree of confidence in the estimate of the subjective wellbeing impact.
Box 6 describes the principles to follow to there is high confidence in wellbeing impacts. These
principles are primarily for analysts who are using analysis rather than conducting their own
analysis. The principles should be considered broad guidelines of the evidence which could be
considered sufficiently robust for incorporating in monetised estimates. The desired confidence
of the wellbeing evidence – and the valuation – will depend upon the purpose for which it is
used. Wellbeing evidence with lower confidence in the causal impact48
can still provide
important information at the research and long-listing stages described in Chapter 3 above.49
48 For example, from cross-sectional regressions 49 Figure 3 of Defra’s ‘Enabling a Natural Capital Approach Guidance’ (2021), based on Eftec (2015), provides a useful overview of
the desired robustness for valuation for different uses.
Box 6: Robust estimates of causal wellbeing impact1
To draw out the causal impact on any outcome with high confidence, there are several
general principles which apply, summarised below and in Annex A3.
Many of these are important considerations for all robust evaluation.
In general, confidence tends to be highest:
• in estimates from well-designed randomised control trials where wellbeing has been
measured;
• where there are naturally occurring conditions that replicate randomisation such as a
natural experiment, randomised encouragement (instrumental variable approach),
threshold randomisation (regression discontinuity approach). This often requires
longitudinal data, but this is not always the case (e.g. instrumental variables). For
example, expansion in education, lottery wins, stock market crashes, opening up
Norwegian tax records, regulatory changes.
There are only a small number of such studies for wellbeing, however data is becoming
more readily available with an increase in well-designed wellbeing trials.
Cont’d [1] Principles developed from HMT, Social Impacts Task Force and What Works Centre for Wellbeing (WWCW) Wellbeing Appraisal Expert Roundtable 21st June 2018
28
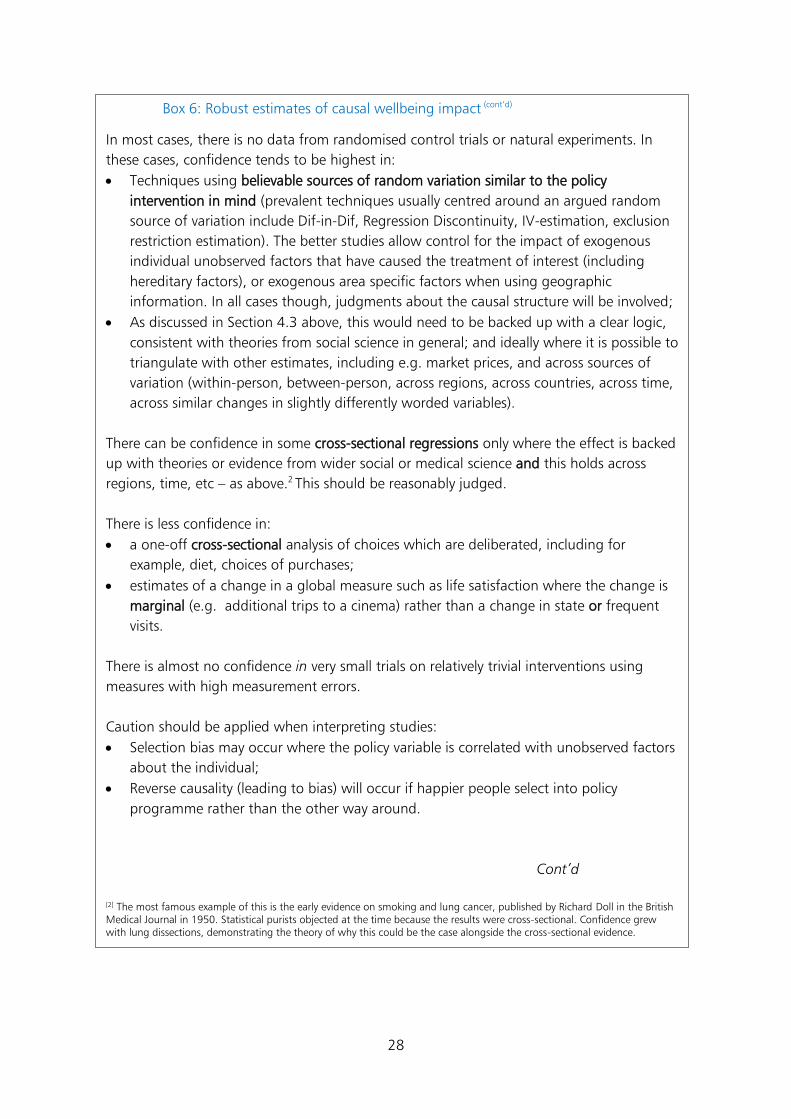
Box 6: Robust estimates of causal wellbeing impact (cont’d)
In most cases, there is no data from randomised control trials or natural experiments. In
these cases, confidence tends to be highest in:
• Techniques using believable sources of random variation similar to the policy
intervention in mind (prevalent techniques usually centred around an argued random
source of variation include Dif-in-Dif, Regression Discontinuity, IV-estimation, exclusion
restriction estimation). The better studies allow control for the impact of exogenous
individual unobserved factors that have caused the treatment of interest (including
hereditary factors), or exogenous area specific factors when using geographic
information. In all cases though, judgments about the causal structure will be involved;
• As discussed in Section 4.3 above, this would need to be backed up with a clear logic,
consistent with theories from social science in general; and ideally where it is possible to
triangulate with other estimates, including e.g. market prices, and across sources of
variation (within-person, between-person, across regions, across countries, across time,
across similar changes in slightly differently worded variables).
There can be confidence in some cross-sectional regressions only where the effect is backed
up with theories or evidence from wider social or medical science and this holds across
regions, time, etc – as above.2 This should be reasonably judged.
There is less confidence in:
• a one-off cross-sectional analysis of choices which are deliberated, including for
example, diet, choices of purchases;
• estimates of a change in a global measure such as life satisfaction where the change is
marginal (e.g. additional trips to a cinema) rather than a change in state or frequent
visits.
There is almost no confidence in very small trials on relatively trivial interventions using
measures with high measurement errors.
Caution should be applied when interpreting studies:
• Selection bias may occur where the policy variable is correlated with unobserved factors
about the individual;
• Reverse causality (leading to bias) will occur if happier people select into policy
programme rather than the other way around.
Cont’d
[2] The most famous example of this is the early evidence on smoking and lung cancer, published by Richard Doll in the British Medical Journal in 1950. Statistical purists objected at the time because the results were cross-sectional. Confidence grew with lung dissections, demonstrating the theory of why this could be the case alongside the cross-sectional evidence.
29
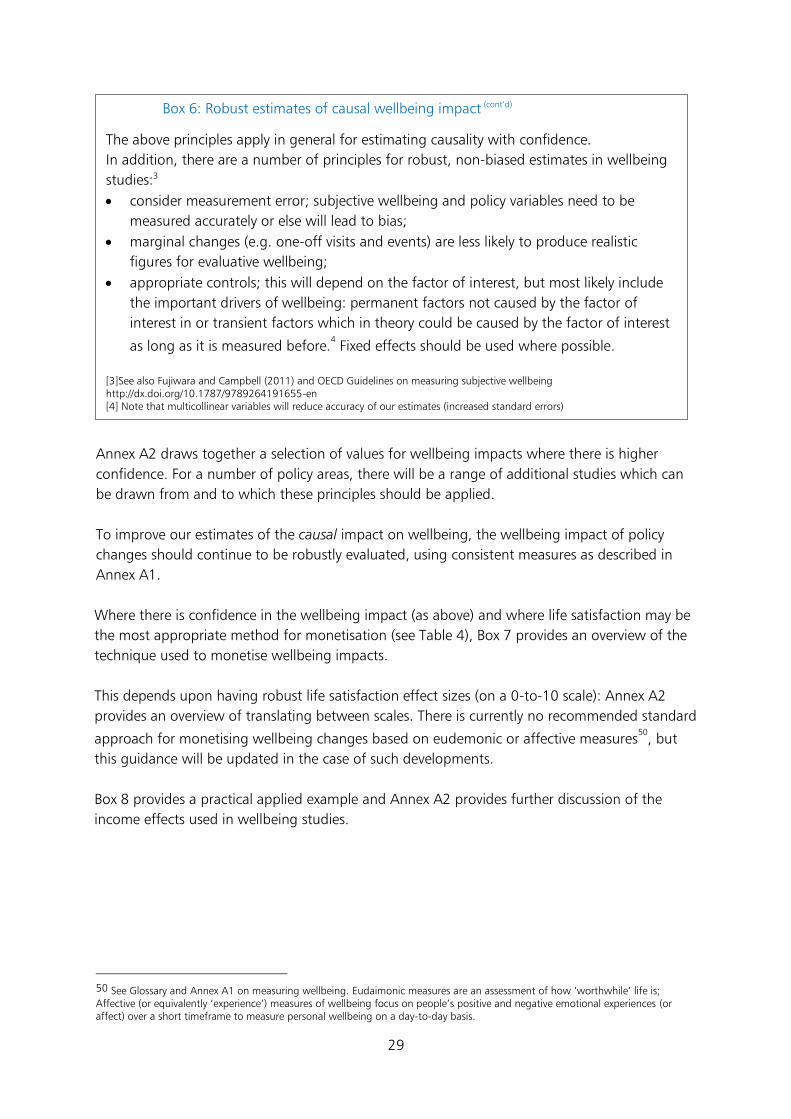
Annex A2 draws together a selection of values for wellbeing impacts where there is higher
confidence. For a number of policy areas, there will be a range of additional studies which can
be drawn from and to which these principles should be applied.
To improve our estimates of the causal impact on wellbeing, the wellbeing impact of policy
changes should continue to be robustly evaluated, using consistent measures as described in
Annex A1.
Where there is confidence in the wellbeing impact (as above) and where life satisfaction may be
the most appropriate method for monetisation (see Table 4), Box 7 provides an overview of the
technique used to monetise wellbeing impacts.
This depends upon having robust life satisfaction effect sizes (on a 0-to-10 scale): Annex A2
provides an overview of translating between scales. There is currently no recommended standard
approach for monetising wellbeing changes based on eudemonic or affective measures50
, but
this guidance will be updated in the case of such developments.
Box 8 provides a practical applied example and Annex A2 provides further discussion of the
income effects used in wellbeing studies.
50 See Glossary and Annex A1 on measuring wellbeing. Eudaimonic measures are an assessment of how ‘worthwhile’ life is; Affective (or equivalently ‘experience’) measures of wellbeing focus on people’s positive and negative emotional experiences (or affect) over a short timeframe to measure personal wellbeing on a day-to-day basis.
Box 6: Robust estimates of causal wellbeing impact (cont’d)
The above principles apply in general for estimating causality with confidence.
In addition, there are a number of principles for robust, non-biased estimates in wellbeing
studies:3
• consider measurement error; subjective wellbeing and policy variables need to be
measured accurately or else will lead to bias;
• marginal changes (e.g. one-off visits and events) are less likely to produce realistic
figures for evaluative wellbeing;
• appropriate controls; this will depend on the factor of interest, but most likely include
the important drivers of wellbeing: permanent factors not caused by the factor of
interest in or transient factors which in theory could be caused by the factor of interest
as long as it is measured before.4 Fixed effects should be used where possible.
[3]See also Fujiwara and Campbell (2011) and OECD Guidelines on measuring subjective wellbeing http://dx.doi.org/10.1787/9789264191655-en [4] Note that multicollinear variables will reduce accuracy of our estimates (increased standard errors)
30
Box 8: Arriving at robust estimates of wellbeing: applied example of monetised wellbeing impacts For the 2019 Price Review, water company Anglian Water commissioned research on the impact of flooding and roadworks on their customers using the wellbeing valuation approach. The resulting study, Valuation of the impact of roadworks and flooding using the Wellbeing Valuation method (2018) provided monetised estimates of wellbeing impacts.
Box 7: Monetising life satisfaction impacts Once we have a robust, causal wellbeing effect estimates, the change in life satisfaction
should be expressed on a 0 to 10 scale. Appendix A2 provides a formula for converting
impacts from other to a 0 to 10 scale.
A factor should also be applied to represent time periods less than one year. For example, if
a wellbeing effect lasts six months, the reported impact on life satisfaction should be
halved before the below monetisation methods are applied.
The resulting change in life satisfaction can be converted to a monetary value by
multiplying by £13,000 [Low: £10,000, High £16,000]. This is the recommended standard
value of one wellbeing adjusted life year – a one-point change in life satisfaction for one
year - a ‘WELLBY’ - in 2019 prices and values.
This approach best achieves broad consistency with the existing evidence base, and
through the use of a single unit value per ‘WELLBY’, is transparent and easy to apply.
Annex A2 provides further details. Because the ‘WELLBY’ is constant, losses and gains of
the same change in life satisfaction are valued equally in magnitude. However, evidence is
likely to highlight that losses of a certain state or good are may have a greater wellbeing
impact than gains of the same state or good – this higher change in wellbeing will then be
multiplied linearly.
Example: a RCT of a specific policy change finds an improvement in wellbeing of 0.2 points
of life satisfaction (on a 0-10 scale) for participants, sustained over 2 years.
The monetary estimate of this change in wellbeing, per individual, per year, in 2019 prices
is given by:
𝑤𝑒𝑙𝑙𝑏𝑒𝑖𝑛𝑔 𝑣𝑎𝑙𝑢𝑎𝑡𝑖𝑜𝑛 = 0.2 x £13,000 = £2,600 𝑝𝑒𝑟 𝑦𝑒𝑎𝑟 (𝑓𝑜𝑟 2 𝑦𝑒𝑎𝑟𝑠)
With a range of £2,000 - £3,200 per year (for 2 years).
31
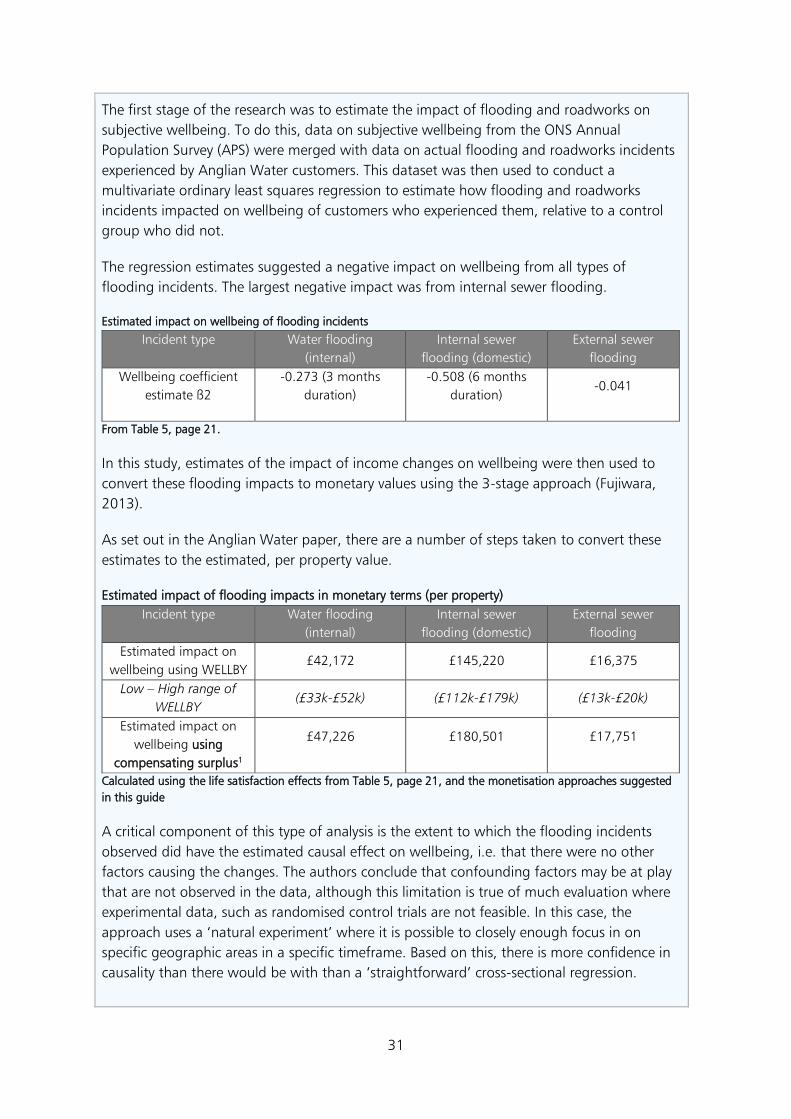
The first stage of the research was to estimate the impact of flooding and roadworks on
subjective wellbeing. To do this, data on subjective wellbeing from the ONS Annual
Population Survey (APS) were merged with data on actual flooding and roadworks incidents
experienced by Anglian Water customers. This dataset was then used to conduct a
multivariate ordinary least squares regression to estimate how flooding and roadworks
incidents impacted on wellbeing of customers who experienced them, relative to a control
group who did not.
The regression estimates suggested a negative impact on wellbeing from all types of
flooding incidents. The largest negative impact was from internal sewer flooding.
Estimated impact on wellbeing of flooding incidents
Incident type Water flooding
(internal)
Internal sewer
flooding (domestic)
External sewer
flooding
Wellbeing coefficient
estimate ß2
-0.273 (3 months
duration)
-0.508 (6 months
duration) -0.041
From Table 5, page 21.
In this study, estimates of the impact of income changes on wellbeing were then used to
convert these flooding impacts to monetary values using the 3-stage approach (Fujiwara,
2013).
As set out in the Anglian Water paper, there are a number of steps taken to convert these
estimates to the estimated, per property value.
Estimated impact of flooding impacts in monetary terms (per property)
Incident type Water flooding
(internal)
Internal sewer
flooding (domestic)
External sewer
flooding
Estimated impact on
wellbeing using WELLBY £42,172 £145,220 £16,375
Low – High range of
WELLBY (£33k-£52k) (£112k-£179k) (£13k-£20k)
Estimated impact on
wellbeing using
compensating surplus1
£47,226 £180,501 £17,751
Calculated using the life satisfaction effects from Table 5, page 21, and the monetisation approaches suggested
in this guide
A critical component of this type of analysis is the extent to which the flooding incidents
observed did have the estimated causal effect on wellbeing, i.e. that there were no other
factors causing the changes. The authors conclude that confounding factors may be at play
that are not observed in the data, although this limitation is true of much evaluation where
experimental data, such as randomised control trials are not feasible. In this case, the
approach uses a ‘natural experiment’ where it is possible to closely enough focus in on
specific geographic areas in a specific timeframe. Based on this, there is more confidence in
causality than there would be with than a ‘straightforward’ cross-sectional regression.
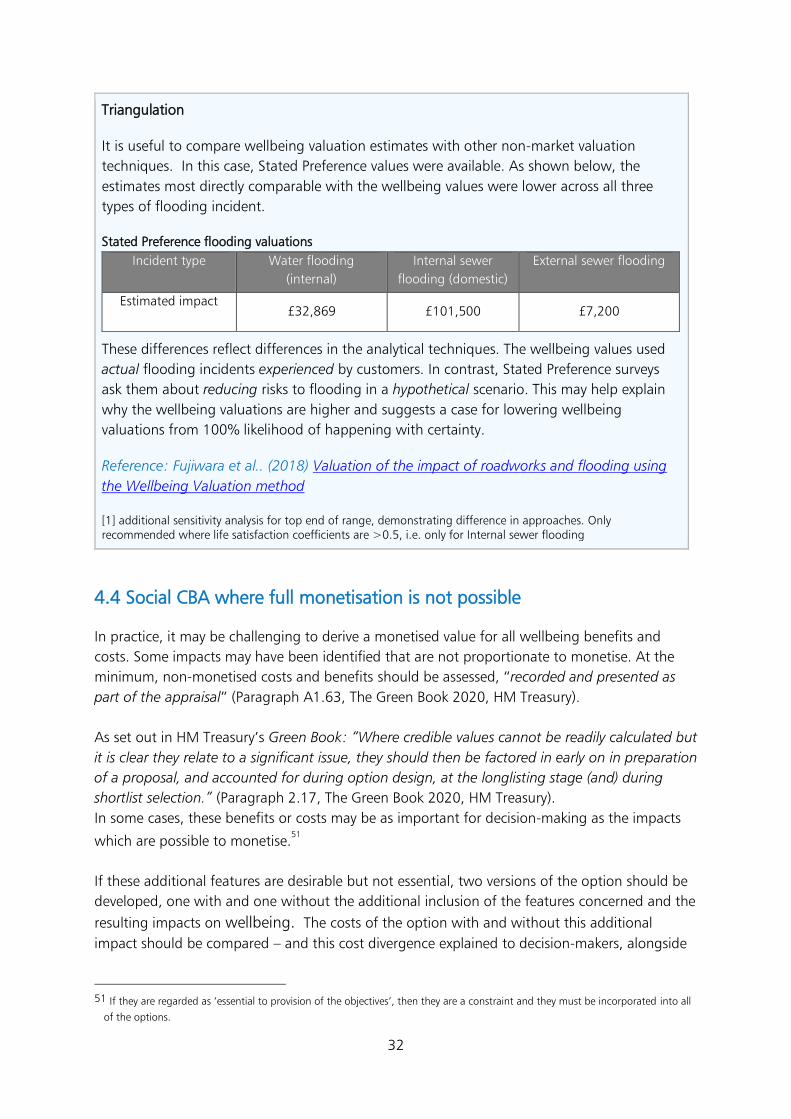
32
Triangulation
It is useful to compare wellbeing valuation estimates with other non-market valuation
techniques. In this case, Stated Preference values were available. As shown below, the
estimates most directly comparable with the wellbeing values were lower across all three
types of flooding incident.
Stated Preference flooding valuations
Incident type Water flooding
(internal)
Internal sewer
flooding (domestic)
External sewer flooding
Estimated impact £32,869 £101,500 £7,200
These differences reflect differences in the analytical techniques. The wellbeing values used
actual flooding incidents experienced by customers. In contrast, Stated Preference surveys
ask them about reducing risks to flooding in a hypothetical scenario. This may help explain
why the wellbeing valuations are higher and suggests a case for lowering wellbeing
valuations from 100% likelihood of happening with certainty.
Reference: Fujiwara et al.. (2018) Valuation of the impact of roadworks and flooding using
the Wellbeing Valuation method
[1] additional sensitivity analysis for top end of range, demonstrating difference in approaches. Only recommended where life satisfaction coefficients are >0.5, i.e. only for Internal sewer flooding
4.4 Social CBA where full monetisation is not possible
In practice, it may be challenging to derive a monetised value for all wellbeing benefits and
costs. Some impacts may have been identified that are not proportionate to monetise. At the
minimum, non-monetised costs and benefits should be assessed, “recorded and presented as
part of the appraisal” (Paragraph A1.63, The Green Book 2020, HM Treasury).
As set out in HM Treasury’s Green Book: “Where credible values cannot be readily calculated but
it is clear they relate to a significant issue, they should then be factored in early on in preparation
of a proposal, and accounted for during option design, at the longlisting stage (and) during
shortlist selection.” (Paragraph 2.17, The Green Book 2020, HM Treasury).
In some cases, these benefits or costs may be as important for decision-making as the impacts
which are possible to monetise.51
If these additional features are desirable but not essential, two versions of the option should be
developed, one with and one without the additional inclusion of the features concerned and the
resulting impacts on wellbeing. The costs of the option with and without this additional
impact should be compared – and this cost divergence explained to decision-makers, alongside
51 If they are regarded as ‘essential to provision of the objectives’, then they are a constraint and they must be incorporated into all
of the options.
33
the potential wellbeing benefits. These wellbeing benefits may be qualitatively described, or
quantified as much as possible, for example, the number of people affected, the likely scale of
the impact (see Annex A2), or the likely duration of the impact. This cost divergence alongside
the description of wellbeing benefits can enable decision-makers to weigh up the options and
take appropriate decisions.
This approach may also involve switching point analysis - “how much would this change in
wellbeing / change in quality of job / environment / social relationships have to be worth, to
make this a less-preferred option?”
Supporting evidence, referenced to good quality research, should be cited when stating
wellbeing benefits and costs.
Box 9: Social Cost Benefit Analysis with non-monetised wellbeing options: illustrative example
This is a purely stylised example, please see the Environment Agency guidance52
for
developing flooding business cases.
A new flooding scheme is under consideration for a community at risk of flooding. There are
a variety of options for implementation. It is not possible to monetise the wellbeing impacts.
However, these additional impacts are important to consider as they relate to further
government objectives in the areas of health and the environment. Wellbeing impacts can be
presented within the options to enable informed decisions.
All estimates are provided in present value terms for a 20-year time period.
Do Nothing:
Risk-adjusted costs of £78m-81mn due to predicted flood risks.
Option 1: Do minimum - Basic design.
Flood protection benefits of £56m-62mn, construction and maintenance costs of £9mn.
Option 2: Design with additional access to enable walking and cycling on the flood barriers.
Flood protection benefits of £56m-62mn, construction and maintenance costs of £10.2m.
Wellbeing benefits: higher number of recreational visits / use of the area over the 20-year
time period, associated with improved wellbeing and mental health. The area will mainly be
accessed by those in the local community, but it is expected that others from neighbouring
communities will also access the recreational area.53
Option 2 results in £1.2m of additional costs compared with potential wellbeing benefits for
20,000 up to 22,000 people, who will more easily be able to use the structure for
52 Flood and coastal defence: develop a project business case - GOV.UK (www.gov.uk) 53 Contact with nature has been shown to result in moderate but significant increases in positive affect as well as in small but
significant decreases in negative affect (McMahan and Estes, 2015). Exercises in green spaces have been found also to improve
hedonic well-being. Physically active forms of transport (e.g., walking or cycling) can have mental health benefits, such as lower
levels of depression or stress (Lee and Sener, 2016)
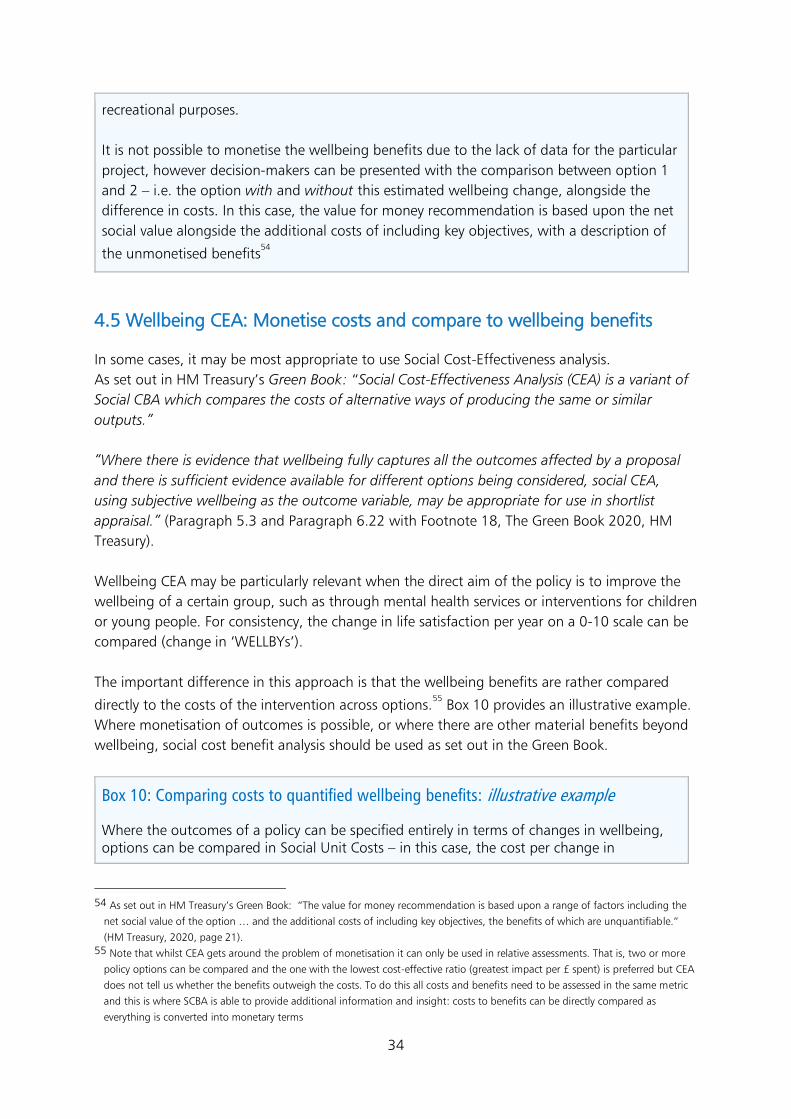
34
recreational purposes.
It is not possible to monetise the wellbeing benefits due to the lack of data for the particular
project, however decision-makers can be presented with the comparison between option 1
and 2 – i.e. the option with and without this estimated wellbeing change, alongside the
difference in costs. In this case, the value for money recommendation is based upon the net
social value alongside the additional costs of including key objectives, with a description of
the unmonetised benefits54
4.5 Wellbeing CEA: Monetise costs and compare to wellbeing benefits
In some cases, it may be most appropriate to use Social Cost-Effectiveness analysis.
As set out in HM Treasury’s Green Book: “Social Cost-Effectiveness Analysis (CEA) is a variant of
Social CBA which compares the costs of alternative ways of producing the same or similar
outputs.”
“Where there is evidence that wellbeing fully captures all the outcomes affected by a proposal
and there is sufficient evidence available for different options being considered, social CEA,
using subjective wellbeing as the outcome variable, may be appropriate for use in shortlist
appraisal.” (Paragraph 5.3 and Paragraph 6.22 with Footnote 18, The Green Book 2020, HM
Treasury).
Wellbeing CEA may be particularly relevant when the direct aim of the policy is to improve the
wellbeing of a certain group, such as through mental health services or interventions for children
or young people. For consistency, the change in life satisfaction per year on a 0-10 scale can be
compared (change in ‘WELLBYs’).
The important difference in this approach is that the wellbeing benefits are rather compared
directly to the costs of the intervention across options.55
Box 10 provides an illustrative example.
Where monetisation of outcomes is possible, or where there are other material benefits beyond
wellbeing, social cost benefit analysis should be used as set out in the Green Book.
Box 10: Comparing costs to quantified wellbeing benefits: illustrative example
Where the outcomes of a policy can be specified entirely in terms of changes in wellbeing, options can be compared in Social Unit Costs – in this case, the cost per change in
54 As set out in HM Treasury’s Green Book: “The value for money recommendation is based upon a range of factors including the
net social value of the option … and the additional costs of including key objectives, the benefits of which are unquantifiable.”
(HM Treasury, 2020, page 21). 55 Note that whilst CEA gets around the problem of monetisation it can only be used in relative assessments. That is, two or more
policy options can be compared and the one with the lowest cost-effective ratio (greatest impact per £ spent) is preferred but CEA
does not tell us whether the benefits outweigh the costs. To do this all costs and benefits need to be assessed in the same metric
and this is where SCBA is able to provide additional information and insight: costs to benefits can be directly compared as
everything is converted into monetary terms
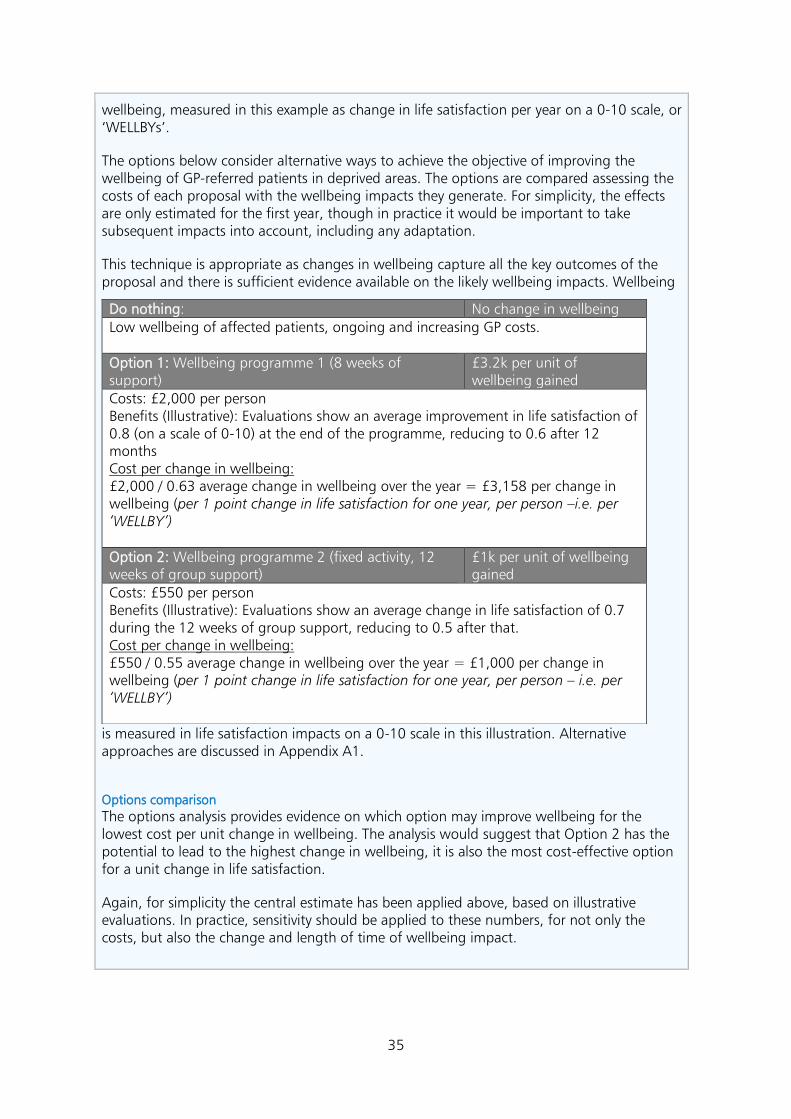
35
wellbeing, measured in this example as change in life satisfaction per year on a 0-10 scale, or ‘WELLBYs’.
The options below consider alternative ways to achieve the objective of improving the wellbeing of GP-referred patients in deprived areas. The options are compared assessing the costs of each proposal with the wellbeing impacts they generate. For simplicity, the effects are only estimated for the first year, though in practice it would be important to take subsequent impacts into account, including any adaptation.
This technique is appropriate as changes in wellbeing capture all the key outcomes of the proposal and there is sufficient evidence available on the likely wellbeing impacts. Wellbeing
is measured in life satisfaction impacts on a 0-10 scale in this illustration. Alternative approaches are discussed in Appendix A1.
Options comparison
The options analysis provides evidence on which option may improve wellbeing for the lowest cost per unit change in wellbeing. The analysis would suggest that Option 2 has the potential to lead to the highest change in wellbeing, it is also the most cost-effective option for a unit change in life satisfaction.
Again, for simplicity the central estimate has been applied above, based on illustrative evaluations. In practice, sensitivity should be applied to these numbers, for not only the costs, but also the change and length of time of wellbeing impact.
Do nothing: No change in wellbeing Low wellbeing of affected patients, ongoing and increasing GP costs. Option 1: Wellbeing programme 1 (8 weeks of support)
£3.2k per unit of wellbeing gained
Costs: £2,000 per person Benefits (Illustrative): Evaluations show an average improvement in life satisfaction of 0.8 (on a scale of 0-10) at the end of the programme, reducing to 0.6 after 12 months Cost per change in wellbeing: £2,000 / 0.63 average change in wellbeing over the year = £3,158 per change in wellbeing (per 1 point change in life satisfaction for one year, per person –i.e. per ‘WELLBY’) Option 2: Wellbeing programme 2 (fixed activity, 12 weeks of group support)
£1k per unit of wellbeing gained
Costs: £550 per person Benefits (Illustrative): Evaluations show an average change in life satisfaction of 0.7 during the 12 weeks of group support, reducing to 0.5 after that. Cost per change in wellbeing: £550 / 0.55 average change in wellbeing over the year = £1,000 per change in wellbeing (per 1 point change in life satisfaction for one year, per person – i.e. per ‘WELLBY’)
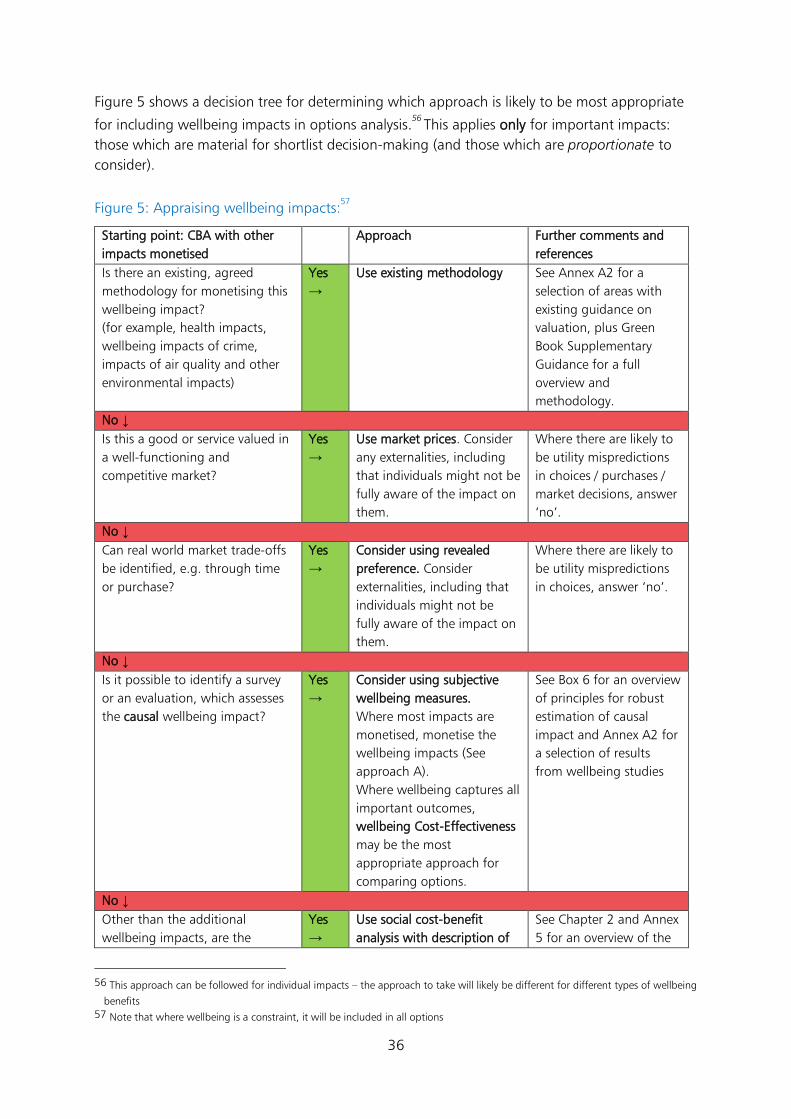
36
Figure 5 shows a decision tree for determining which approach is likely to be most appropriate
for including wellbeing impacts in options analysis.56 This applies only for important impacts:
those which are material for shortlist decision-making (and those which are proportionate to
consider).
Figure 5: Appraising wellbeing impacts:57
Starting point: CBA with other
impacts monetised
Approach Further comments and
references
Is there an existing, agreed
methodology for monetising this
wellbeing impact?
(for example, health impacts,
wellbeing impacts of crime,
impacts of air quality and other
environmental impacts)
Yes
→
Use existing methodology See Annex A2 for a
selection of areas with
existing guidance on
valuation, plus Green
Book Supplementary
Guidance for a full
overview and
methodology.
No ↓
Is this a good or service valued in
a well-functioning and
competitive market?
Yes
→
Use market prices. Consider
any externalities, including
that individuals might not be
fully aware of the impact on
them.
Where there are likely to
be utility mispredictions
in choices / purchases /
market decisions, answer
‘no’.
No ↓
Can real world market trade-offs
be identified, e.g. through time
or purchase?
Yes
→
Consider using revealed
preference. Consider
externalities, including that
individuals might not be
fully aware of the impact on
them.
Where there are likely to
be utility mispredictions
in choices, answer ‘no’.
No ↓
Is it possible to identify a survey
or an evaluation, which assesses
the causal wellbeing impact?
Yes
→
Consider using subjective
wellbeing measures.
Where most impacts are
monetised, monetise the
wellbeing impacts (See
approach A).
Where wellbeing captures all
important outcomes,
wellbeing Cost-Effectiveness
may be the most
appropriate approach for
comparing options.
See Box 6 for an overview
of principles for robust
estimation of causal
impact and Annex A2 for
a selection of results
from wellbeing studies
No ↓
Other than the additional
wellbeing impacts, are the
Yes
→
Use social cost-benefit
analysis with description of
See Chapter 2 and Annex
5 for an overview of the
56 This approach can be followed for individual impacts – the approach to take will likely be different for different types of wellbeing
benefits 57 Note that where wellbeing is a constraint, it will be included in all options
37
majority of important impacts
monetised?
non-monetised wellbeing
benefit(s)
(Section 4.5)
types of issues which
may be important
4.6 Wellbeing in appraisal: wider considerations
Distributional analysis
This section signposts to the current guidance on considering this within policy and appraisal,
including welfare weighting, but does not include any new guidance on inequalities and welfare
weighting.
As described above, wellbeing evidence suggests that distributional effects of a policy are
particularly important to analyse, since:
• “the value of an additional pound of income is higher for a low-income recipient and
lower for a high-income recipient” (Paragraph A3.4, The Green Book 2020, HM Treasury)58
• losses have a greater ‘value’ than gains of the same amount (which should to the most
part, already be incorporated in evidence even when not using wellbeing evidence)
• relative income (and relative ‘visible status’) may have greater impact on wellbeing than
income itself
The impacts of a policy will likely be different for different groups: looking beyond averages and
understanding who will be worst affected is important.
Note that distribution should already be considered in the longlisting stage, see Chapter 4 of the
Green Book and Chapter 3 of this guide.
HM Treasury’s Green Book Section A3 sets out the guidance for distribution appraisal which
should be followed.
Avoiding double counting
There are likely to be many wellbeing impacts of a policy, which may be assessed in different
ways. It is important to have a clear logic, setting out the different impacts and how they are
best quantified and monetised where applicable, to ensure the highest confidence in the
method as well as to avoid “double counting” impacts.
Figure 6 below provides an example on avoiding double counting, based on the illustrative
example of the provision of youth programmes described in Box 11:
• any ‘ongoing effects’ of an improvement in wellbeing need to be included carefully, to
avoid double counting. In Figure 6 below, the wellbeing benefits of volunteering are
estimated only for the years participating in the programme. Beyond the years of the
programme, volunteering may also influence opportunities or life choices – in this
example, the chance of employment. However, since the associated wellbeing impact of
employment is included already, it would be double counting to include any ‘ongoing
wellbeing impacts’ from volunteering.
• caution needs to be applied when considering wellbeing alongside QALY estimates. In
this example, only the wellbeing impacts of the volunteering programme are included.
58 This underpins the reasoning for distributional weighting being presented alongside unweighted cost-benefit analysis.
38
Incorporating additional QALY estimates (if available) may be useful as triangulation,59
but including both would be double counting.
• the impacts due to a reduction in crime, including physical and mental health impacts,
are best monetised using existing Home Office guidance, which in turn rests upon QALY
estimates. No additional wellbeing impacts associated with crime are included, to avoid
double counting.
• analysts should be clear on what aspects of value are included (or specifically excluded)
in a valuation. In the example below, there is no double counting between the wellbeing
impacts associated with moving into employment and the other measures of benefit
associated with employment (productivity). The wellbeing values are additional to the
improved productivity, monetised using average income. Wellbeing estimates can be
considered additional to the income since the impact of income is controlled for in the
studies used.
59 Triangulation is where findings are compared with those from elsewhere, including other countries, regions or time, alongside a
logic check of why there may be similarities or differences between the values. It is used as a ‘sense-check’ of a value. e
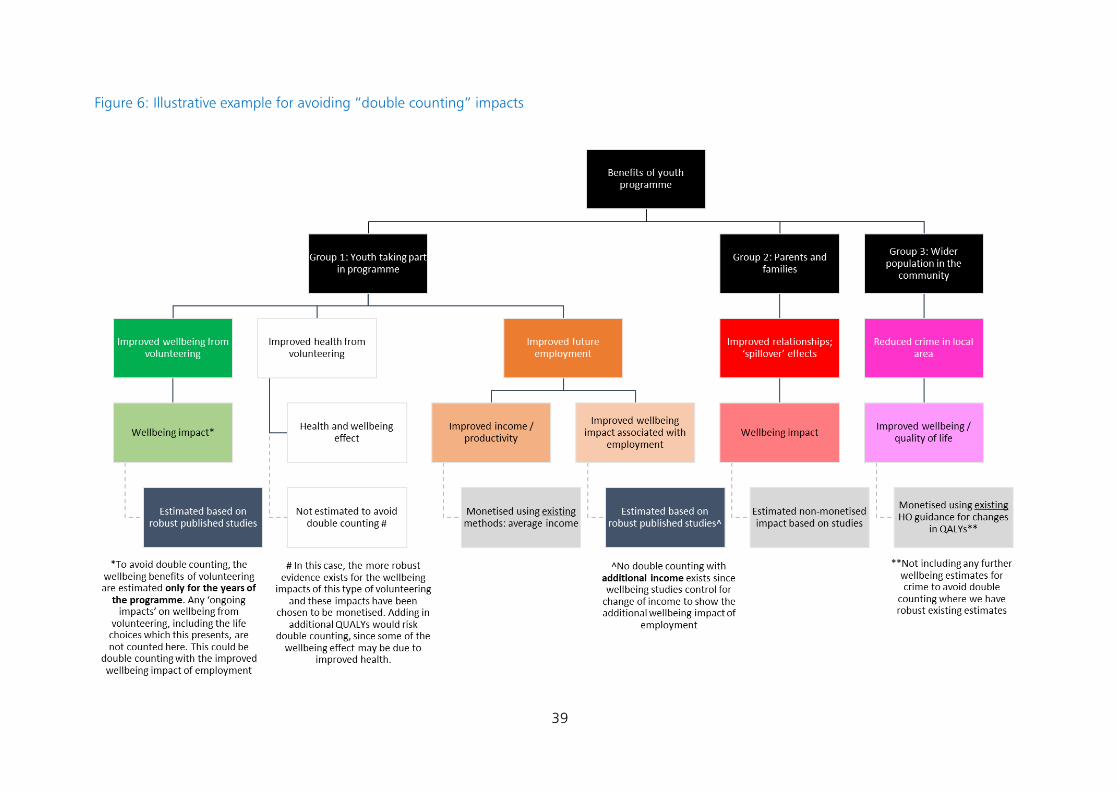
39
Figure 6: Illustrative example for avoiding “double counting” impacts
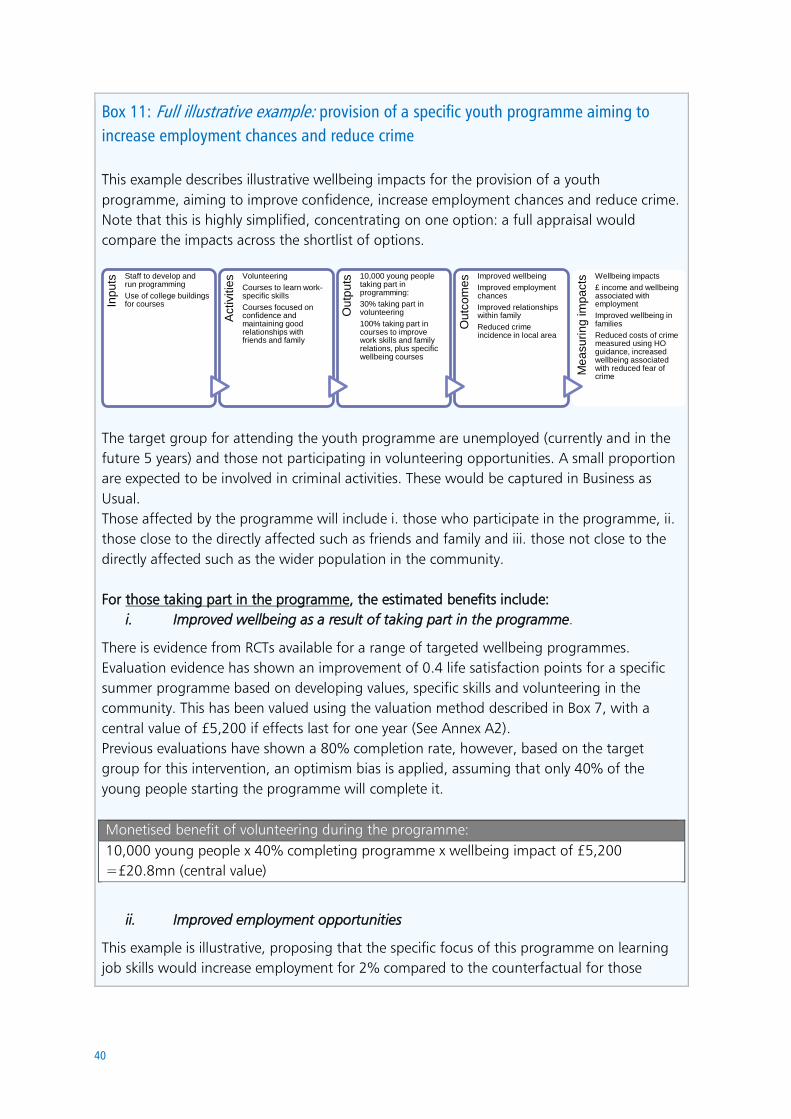
40
Box 11: Full illustrative example: provision of a specific youth programme aiming to
increase employment chances and reduce crime
This example describes illustrative wellbeing impacts for the provision of a youth
programme, aiming to improve confidence, increase employment chances and reduce crime.
Note that this is highly simplified, concentrating on one option: a full appraisal would
compare the impacts across the shortlist of options.
The target group for attending the youth programme are unemployed (currently and in the
future 5 years) and those not participating in volunteering opportunities. A small proportion
are expected to be involved in criminal activities. These would be captured in Business as
Usual.
Those affected by the programme will include i. those who participate in the programme, ii.
those close to the directly affected such as friends and family and iii. those not close to the
directly affected such as the wider population in the community.
For those taking part in the programme, the estimated benefits include:
i. Improved wellbeing as a result of taking part in the programme.
There is evidence from RCTs available for a range of targeted wellbeing programmes.
Evaluation evidence has shown an improvement of 0.4 life satisfaction points for a specific
summer programme based on developing values, specific skills and volunteering in the
community. This has been valued using the valuation method described in Box 7, with a
central value of £5,200 if effects last for one year (See Annex A2).
Previous evaluations have shown a 80% completion rate, however, based on the target
group for this intervention, an optimism bias is applied, assuming that only 40% of the
young people starting the programme will complete it.
Monetised benefit of volunteering during the programme:
10,000 young people x 40% completing programme x wellbeing impact of £5,200
=£20.8mn (central value)
ii. Improved employment opportunities
This example is illustrative, proposing that the specific focus of this programme on learning
job skills would increase employment for 2% compared to the counterfactual for those
Inp
uts Staff to develop and
run programming
Use of college buildings for courses
Activitie
s Volunteering
Courses to learn work-specific skills
Courses focused on confidence and maintaining good relationships with friends and family
Ou
tpu
ts
10,000 young people taking part in programming:
30% taking part in volunteering
100% taking part in courses to improve work skills and family relations, plus specific wellbeing courses
Ou
tco
me
s Improved wellbeing
Improved employment chances
Improved relationships within family
Reduced crime incidence in local area
Me
asu
rin
g im
pa
cts Wellbeing impacts
£ income and wellbeing associated with employment
Improved wellbeing in families
Reduced costs of crime measured using HO guidance, increased wellbeing associated with reduced fear of crime
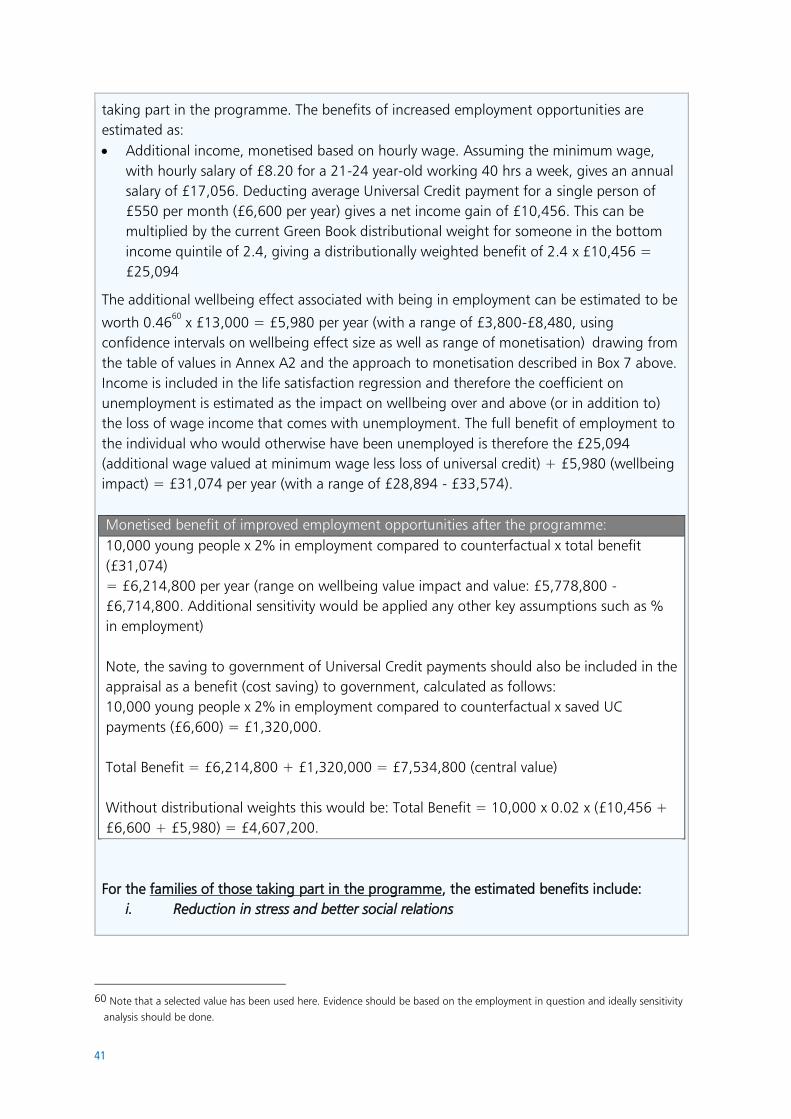
41
taking part in the programme. The benefits of increased employment opportunities are
estimated as:
• Additional income, monetised based on hourly wage. Assuming the minimum wage,
with hourly salary of £8.20 for a 21-24 year-old working 40 hrs a week, gives an annual
salary of £17,056. Deducting average Universal Credit payment for a single person of
£550 per month (£6,600 per year) gives a net income gain of £10,456. This can be
multiplied by the current Green Book distributional weight for someone in the bottom
income quintile of 2.4, giving a distributionally weighted benefit of 2.4 x £10,456 =
£25,094
The additional wellbeing effect associated with being in employment can be estimated to be
worth 0.4660
x £13,000 = £5,980 per year (with a range of £3,800-£8,480, using
confidence intervals on wellbeing effect size as well as range of monetisation) drawing from
the table of values in Annex A2 and the approach to monetisation described in Box 7 above.
Income is included in the life satisfaction regression and therefore the coefficient on
unemployment is estimated as the impact on wellbeing over and above (or in addition to)
the loss of wage income that comes with unemployment. The full benefit of employment to
the individual who would otherwise have been unemployed is therefore the £25,094
(additional wage valued at minimum wage less loss of universal credit) + £5,980 (wellbeing
impact) = £31,074 per year (with a range of £28,894 - £33,574).
Monetised benefit of improved employment opportunities after the programme:
10,000 young people x 2% in employment compared to counterfactual x total benefit
(£31,074)
= £6,214,800 per year (range on wellbeing value impact and value: £5,778,800 -
£6,714,800. Additional sensitivity would be applied any other key assumptions such as %
in employment)
Note, the saving to government of Universal Credit payments should also be included in the
appraisal as a benefit (cost saving) to government, calculated as follows:
10,000 young people x 2% in employment compared to counterfactual x saved UC
payments (£6,600) = £1,320,000.
Total Benefit = £6,214,800 + £1,320,000 = £7,534,800 (central value)
Without distributional weights this would be: Total Benefit = 10,000 x 0.02 x (£10,456 +
£6,600 + £5,980) = £4,607,200.
For the families of those taking part in the programme, the estimated benefits include:
i. Reduction in stress and better social relations
60 Note that a selected value has been used here. Evidence should be based on the employment in question and ideally sensitivity
analysis should be done.
42
Wellbeing evidence in Australia has shown that when the mental health of an individual
improves, there is a ‘spillover’ within families of 15% (Frijters and Mervin, 2014). Using this
evidence, it could be assumed that there will be a similar impact from this programme, if less
marked.
However, in the absence of specific evidence for this type of programme and the absence of
evidence for parents and other family members in the UK, this is not monetised, but
included as an important non-monetised impact.
Non-monetised benefit of better social relations during the programme:
Assumed 2,000-10,000 family members x wellbeing benefit of better family and social
relations
For the local population, the estimated benefits include:
i. Reduced crime
This should be calculated based on the Home Office Costs of Crime calculations, including
the reductions in quality of life associated with certain injuries (see Table 10 in above linked
document).
43
5. Wellbeing in monitoring and evaluation
Chapter 5 should be read in conjunction with HM Treasury’s Magenta Book, the UK
Government’s central guidance on evaluation61
as well as departmental and programme-specific
evaluation guides.62
As described in the Magenta Book, evaluation should be considered early and embedded in the
design of interventions to maximise opportunities to collect good evidence.63
5.1 Principles for measuring and evaluating wellbeing
As a multidimensional concept, different people may interpret wellbeing in different ways. As
such, analysts should keep the following principles in mind when measuring and evaluating
wellbeing:
• consider observable factors (also referred to as objective measures, such as crime rates) as
well as non-observable factors, which are subjective to the person experiencing them
(such as how safe they might feel). Measuring observable factors is useful where they have
an evidenced link to wellbeing, but including subjective measures can help to validate that
addressing these factors could indeed lead to improved wellbeing
• look beyond present wellbeing, and consider and assess the factors which may have an
impact on future wellbeing, such as changes in the stocks of human, social and natural
capital.64 As wellbeing is such a complex, interlinked concept it is important to consider
factors which lie beyond what we are observably changing, including the unintended
consequences on wellbeing65
• use validated measures where possible. When including wellbeing measures, the wording
of individual questions is important, as well as the grouping and ordering of questions.
There are a range of measures which have been subject to thorough scientific testing to
demonstrate their validity (see Annex A1)
• be consistent with existing and standardised measures. Consistency in measurement
makes it possible to compare findings with other approaches, helps to build the evidence
base, allows the findings to be considered and applied in other contexts, and could help
to influence future programme and policy design
61 https://www.gov.uk/government/publications/the-magenta-book 62 Measuring Impact by Design (2019) contains an overview of methods for impact measurement 63 See section 1.6 of the Magenta Book
64 See existing guidance on measuring natural capital and ONS guidance on measuring social capital 65 For example, moving a family into permanent housing may increase their wellbeing by providing a sense of permanence and
security, but equally may yield additional positive or negative effects in terms of changing distance from support networks or e.g.
commute to a job.
44
• different forms of evidence may be needed to understand and assess wellbeing in
different contexts. Mixed method approaches including quantitative and qualitative
evidence may be appropriate
• use a measure which is best suited for the relevant group, e.g. children, adults with
dementia or communication difficulties66
• bear in mind the existing frameworks which are followed for the group, issue or region in
question67
5.2 Incorporating wellbeing in evaluation
Using the stages of the evaluation process as set out in HM Treasury’s Magenta Book, wellbeing
can be incorporated in the following ways:68
Scoping evaluation
Key evaluation steps (from the Magenta Book, see Table 1.1)
• understand the intervention, what it aims to achieve, by when and for whom
• understand the evidence base surrounding the intervention
• develop the Theory of Change
• understand the questions to be answered
Wellbeing considerations for this stage
• understand the wellbeing aims of the intervention and the pathways through which this
will be achieved
• include any wellbeing considerations for target groups, e.g. elderly, disabled, rural
communities
• use existing wellbeing evidence (Annex A2) to inform the links between similar types of
interventions and wellbeing as well as highlighting important gaps. Interventions may
have different effects on diverse population groups. Consider how the evaluation adds to
the existing knowledge base
• draw out, where relevant, wellbeing as part of the theory of change
• many systems and factors converge to effect wellbeing: consider the Magenta Book
Supplementary Guidance on handling complexity in evaluation
• plan early to allow sufficient opportunities to collect good wellbeing evidence69
Resources
66 For example, the ‘Measuring Wellbeing Creatively’ project works with people who have communication difficulties as a result of a
brain injury or stroke. It explores how different colours and sensations can help them express feelings and emotions, which may
help to measure their wellbeing.
In addition, some measures are only appropriate for adults above 15 years (see A1: Measuring Wellbeing) 67 For example, a framework for evaluating rural wellbeing is in development. The Devolved Administrations have their own specific
approaches for assessing wellbeing, based on data availability as well as local/regional issues
68 These sub-sections are based on Table 1.1 in HM Treasury’s Magenta Book (HM Treasury, 2020). 69 For example, to collect baseline information and the opportunity for experimentation in the intervention where feasible and
relevant
45
• Wellbeing Supplementary Green Book Guidance (this guide): ONS dimensions, Table 1,
Overview of evidence, Section 2
• What Works Centre for Wellbeing70
for topic-specific overviews and systematic reviews of the
existing wellbeing evidence base
• Magenta Book Supplementary Guidance on handling complexity in evaluation
Designing evaluation
Key evaluation steps
• identify the evaluation approach(es) that will help meet the learning goals
• begin to plan the evaluation, deciding on the design and questions to be answered and
the reporting points where evidence is needed.
Wellbeing considerations
When seeking to understand or assess changes in wellbeing:
• consider observable factors (‘objective measures’) as well as factors that are subjective to
the person experiencing them
• consider unintended consequences, both positive or negative. Many factors interrelate to
have a final impact on wellbeing: a change in one area can result in unintended impacts in
other areas
• draw from the range of validated measures and consider consistency with measures where
baseline information is available. Using the ONS Harmonised Principles for Measurement
can add to a coherent database and address gaps in evidence (See Annex A1)
• if conducting an impact evaluation, consider what an appropriate counterfactual might be
to estimate changes in wellbeing caused by an intervention
• consider how often and when wellbeing will be measured and monitored: acknowledge
that wellbeing may be subject to adaptation and there is benefit to longer-term follow-
up71
• ensure the scale of the intervention is sufficient to allow impacts on wellbeing to be
measured
Resources
• What Works Centre for Wellbeing (WWCW) How to Measure for an overview of
measurement
• ONS Harmonised Principles for measuring personal wellbeing72
• WWCW Recommended Questions
Choosing the appropriate methods
Key evaluation steps
70 www.whatworkswellbeing.org 71 See also Magenta Book Supplementary Guidance on Handling Complexity in Evaluation
72 https://gss.civilservice.gov.uk/policy-store/personal-well-being/#dissemination-output-
46
• decide on the methods, both for analysis and data collection, that can answer the
evaluation questions
• ensure the chosen methods complement each other and are as efficient as possible
Wellbeing considerations
• when considering changes in wellbeing, using with measures where baseline information
is available may reduce costs. For both objective and subjective measures, there are a
range of existing surveys which can be used or replicated
• consider the best form of evidence to understand and assess wellbeing in different
contexts, including where mixed methods and qualitative evidence may be appropriate
Resources
• WWCW Recommended Questions.
• WWCW Analysing and Using Your Results (Section 5) for information on benchmarking
ONS4 and SWEMWBS73
• Canada Government Measuring Impact by Design (2019) contains an overview of methods
for impact measurement
Conducting evaluation
Key evaluation steps
• execute the evaluation, modify design in response to learning and policy changes or
stakeholder requirements
• feed in evidence where possible in line with known and new decision points
Wellbeing considerations
• the ordering of the wellbeing questions is important. Asking the wellbeing questions after
another theme can influence the responses which individuals give, since attention is drawn
to a specific topic. It is recommended that these questions are placed after the key
demographic questions in surveys. This allows rapport to be developed between the
interviewer and the respondent, as well as ensuring the main survey questions do not impact
on the responses to the personal wellbeing questions
• some measures are only designed to be carried out in particular ways, such as face to face
• ONS has published data on mode effects for two interviewer led modes (telephone and
face to face), showing significant mode effects. Because of this, it is not recommended to
compare wellbeing data that have been collected in different modes
Resources
• ONS Harmonised Principles for measuring personal wellbeing74
• specific guidance documents for the chosen wellbeing measure, see Annex A1: measuring
wellbeing
73 Short Warwick Edinburgh Mental Well-Being Scale
74 https://gss.civilservice.gov.uk/policy-store/personal-well-being/#dissemination-output-
47
Disseminating, using and learning
Key evaluation steps
• prepare final evaluation analysis and outputs
Wellbeing considerations
• communicate the impact clearly, including the detail of how wellbeing was measured and
the questions used
• where relevant, report differences across groups
• report unexpected wellbeing consequences as well as the outcomes which were set out to
be changed
Resources
• WWCW Analysing and Using Your Results
48
6. Checklist for analysts
This chapter provides a ‘checklist’ for analysts. It is intended as a set of questions that analysts
can use to assess wellbeing impacts across the policy development process.
Since wellbeing is an overarching concept, interchangeable with social welfare or social value,
there is no separate requirement for reporting beyond what is required for good economic
appraisal. The existing Impact Assessment template and Business Case approach should be
followed, referring to wellbeing as part of the costs and benefits.
Throughout the policy cycle, the questions you may wish to consider are:
• At an early stage of the policy cycle, are you familiar with the relevant wellbeing research,
including the wellbeing implications of related policy interventions?
• Have you considered wellbeing impacts in your critical success factors, at longlist appraisal
stage?
• Have you developed a Theory of Change to consider wellbeing impacts for the proposed way
forward?
• Have you considered unintended consequences, including wellbeing externalities and relative
wellbeing effects?
• Have you considered set an appropriate timeframe over which to appraise wellbeing
impacts? Have you given regard to the duration of impact and the potential for adaption to
a change of state?
• In your shortlist appraisal, have you weighed the relative merits of cost benefit analysis, cost-
effectiveness analysis and other methods, given the nature of the policy options and
available evidence?
• In appraising the quantifiable impacts on wellbeing, have you taken care to avoid “double
counting” outcomes?
• Where monetisation of wellbeing impacts is feasible and appropriate, have you identified
appropriate valuation method(s) and evidence?
• Where wellbeing impacts are not quantified and/or monetised, have you assessed whether
these are likely to be decisive and ensured that these are reported alongside the cost-benefit
metrics?
• In undertaking your wellbeing appraisal, have you critically appraised the standard of
evidence that was available, performed appropriate quality assurance, sense checks and
sensitivity analysis? Have you presented any related risks and uncertainties transparently and
objectively?
• Is your distributional analysis in line with the Green Book, and does this give regard to
variable wellbeing impacts across different groups of society?
• Have you incorporated wellbeing into the monitoring and evaluation plans, in alignment
with the HM Treasury’s Magenta Book?
• Have you taken steps to ensure that the evidence gathered through your evaluation feeds
back into future decisions?
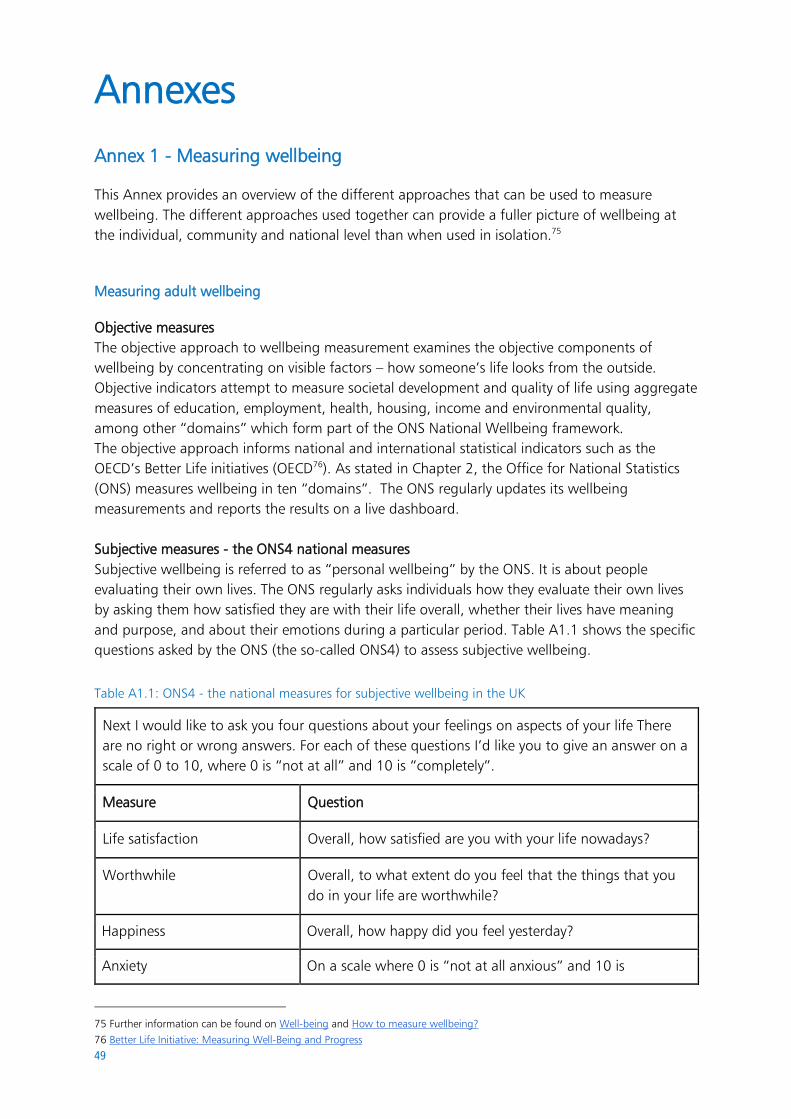
49
Annexes
Annex 1 - Measuring wellbeing
This Annex provides an overview of the different approaches that can be used to measure
wellbeing. The different approaches used together can provide a fuller picture of wellbeing at
the individual, community and national level than when used in isolation.75
Measuring adult wellbeing
Objective measures
The objective approach to wellbeing measurement examines the objective components of
wellbeing by concentrating on visible factors – how someone’s life looks from the outside.
Objective indicators attempt to measure societal development and quality of life using aggregate
measures of education, employment, health, housing, income and environmental quality,
among other “domains” which form part of the ONS National Wellbeing framework.
The objective approach informs national and international statistical indicators such as the
OECD’s Better Life initiatives (OECD76). As stated in Chapter 2, the Office for National Statistics
(ONS) measures wellbeing in ten “domains”. The ONS regularly updates its wellbeing
measurements and reports the results on a live dashboard.
Subjective measures - the ONS4 national measures
Subjective wellbeing is referred to as “personal wellbeing” by the ONS. It is about people
evaluating their own lives. The ONS regularly asks individuals how they evaluate their own lives
by asking them how satisfied they are with their life overall, whether their lives have meaning
and purpose, and about their emotions during a particular period. Table A1.1 shows the specific
questions asked by the ONS (the so-called ONS4) to assess subjective wellbeing.
Table A1.1: ONS4 - the national measures for subjective wellbeing in the UK
Next I would like to ask you four questions about your feelings on aspects of your life There
are no right or wrong answers. For each of these questions I’d like you to give an answer on a
scale of 0 to 10, where 0 is “not at all” and 10 is “completely”.
Measure Question
Life satisfaction Overall, how satisfied are you with your life nowadays?
Worthwhile Overall, to what extent do you feel that the things that you
do in your life are worthwhile?
Happiness Overall, how happy did you feel yesterday?
Anxiety On a scale where 0 is “not at all anxious” and 10 is
75 Further information can be found on Well-being and How to measure wellbeing?
76 Better Life Initiative: Measuring Well-Being and Progress
50
“completely anxious”, overall how anxious did you feel
yesterday?
Source: ONS. Personal wellbeing frequently asked questions.77
Subjective data on wellbeing in the UK have been systematically collected since 2011. These are
collected quarterly by the ONS as part of the Annual Population Survey (APS) from 300,000
people per year and are publicly available, providing a means for comparison, benchmarking
and building the evidence base. Breakdowns are available for specific geographies,
characteristics and industry sectors, among others.78
The ONS personal wellbeing measures are included in a large number of national surveys in the
UK.79
There is a large and ever-expanding collection of data and research using the life satisfaction
measure which can be used to test and compare different determinants of wellbeing. A benefit
of wellbeing surveys is that they do not ask if particular things (such as income) or activities
(such as smoking or exercising) make respondents happy. Behavioural economics shows that
such assessments may be unreliable, since attention is overly drawn to a specific aspect of our
lives.80 Instead, investigators identify how strongly various factors affect wellbeing by examining
the relationship between those factors (such as socioeconomic status or views about the value
of hard work) and self-reported wellbeing.
Subjective measures can be split by the ‘type’ of wellbeing they are seeking to measure
(evaluative, eudemonic and affective wellbeing, see box A1 and Glossary) as well as the
timescale they aim to represent.
Those included in longer-term panel data surveys (such as the ONS4) aim to capture ongoing
differences in wellbeing and changes in ‘states’, or an individual’s evaluation or their state.
Other measures use ‘in-the-moment’ data which are very short term - and aim to capture
experiences.81 These two sets of data can be used for different things. ‘Momentary’ or
experiential measures may capture certain impacts not captured by longer-term / evaluative
wellbeing measures, such as the effects of singular events or visits to museums,82 however
evaluative measures capture longer-term effects related to civic engagement, or a change in
‘state’ such as unemployment.
77 Further information on the development of the questions available: Dolan, Layard and Metcalf (2011) Report to the ONS
Measuring Subjective Wellbeing for Public Policy
78 Personal well-being frequently asked questions
79For a list of surveys that use the four ONS personal wellbeing questions please see: Surveys using our four personal well-being
questions 80 See GES (2011) Valuation Techniques for Social Cost-Benefit Analysis for preference anomalies, including anchoring
81 An example of this is ‘Mappiness’, an application that permits individuals to record their wellbeing scores via their phone.
Individuals receive randomly timed requests to complete a very short survey which asks them to rate how they feel at the current
moment, stating how happy, how relaxed, and how awake they feel. This has allowed for the collection of more than one million
observations from tens of thousands of individuals in the UK since August 2010, alongside information of location and activity.
Dolan and Kudrna (2016) also propose how experiential data can be used and applied in practice
82 By the time you are asked in a survey, these smaller events are harder to identify.
51
Box A1.1: Personal subjective wellbeing
Personal subjective wellbeing measures can include:
• an overall assessment of someone’s life, usually to find out whether they feel generally
satisfied or not (sometimes referred to as evaluative wellbeing)
• their overall sense of purpose, and how well they function (sometimes referred to as
eudaimonia)
• the positive or negative feelings they’ve had recently – for example, how happy or anxious
they’ve been (also referred to as positive affect and negative affect). See Annex A for more
information on measurement.
Subjective measures - other
There are other subjective measures of wellbeing that relate mainly to physical health, and
mental and psychological aspects of individual wellbeing.
For example, the Warwick-Edinburgh Mental Wellbeing Scales (WEMWBS) were developed to
help measure the mental wellbeing in the population, and to help evaluate projects,
programmes and policies aimed at raising wellbeing.83 The WEMWBS questionnaires - or
inventories - measure the feeling and psychological functioning aspects of wellbeing in a
systematic way. Other scales include the EuroQol-5D (EQ5D), World Health Organisation Quality
of Life instrument (WHOQOL-BREF) and the General Health Questionnaire (GHQ12).
In addition, measures specific to certain themes or “domains” are used and surveyed in the UK
and worldwide. These include satisfaction with job, neighbourhood or service, among others.
These can be helpful for service design as well as understanding contributing drivers of overall
wellbeing.
In a global setting, indexes such as The Global Person Generated Index (GPGI)84
allows people to
define their own wellbeing.
Measuring child and young person wellbeing
There are a number of specific initiatives that measure the wellbeing of children and young
people.
The ONS has specific measures for children’s wellbeing (aged 0-15 years, varies by question)85
and young people’s wellbeing (aged 16-24) 86, which complement the national measures of
wellbeing. These are organised under 7 of the national wellbeing “domains” described in
Chapter 2: personal wellbeing, our relationships, health, what we do, where we live, personal
finance, and education and skills.
Some questions match those asked in the adult measuring national wellbeing programme (e.g.
participation in arts or cultural activities, feelings of safety), others are specifically designed to
83 For more information visit About WEMWBS. 84 Martin, Camfield & Ruta (2010) 85 Dataset Children's well-being measures
86 Dataset young person’s well-being measures
52
reflect themes important for these age groups (e.g. talking to parents about things that matter;
quarrelling with parents). Questions vary slightly for child and young person wellbeing. These
are designed to shed light both on their current wellbeing and on their future prospects. As with
the adult national wellbeing programme, some measures are objective and others subjective.
The aim is to provide a holistic view of life in the UK for children and young people, reflecting
both the circumstances of their lives and their own perspectives.
Another example is the Good Childhood Index developed by the Children’s Society. It is a
measure of subjective wellbeing intended for children aged eight and over.87 The index is based
on ten “domains”, covering themes such as relationships with family and friends, appearance,
school, choices available, and money and material possessions. A survey developed by the
organisation found that the most important “domains” for children are: family; friends;
appearance; school; school work. They now use the topics in all their surveys for children, asking
how satisfied they are with them on a scale from 0 to 10.
The Education Endowment Foundation (EEF) provides a list of validated measures to be used in
relation to child and adolescent outcomes as part of the SPECTRUM database.88
As part of this, for example, the WEMWBS has also been validated for use with children aged 13
and over and has been used in the Health Survey for England since 2010. SWEMWBS has been
validated for use with children aged 11 and over. Mean WEMWBS scores are reported each year
for the age group 16 to 24 years and are available from the UK Data Service.89
Measuring community wellbeing
Community wellbeing is the combination of social, economic, environmental, cultural and
political conditions that people and their communities say they need to fulfil their potential.
Similar to individual wellbeing, community wellbeing can be measured through objective
measures including access to healthcare, security and social relations as well as subjective
measures, such as how safe people feel and the trust they have in others. However, community
wellbeing is more than the sum of individuals’ wellbeing as it also includes the relationships
between people, and collective attitudes and behaviours.
One important component of community wellbeing is social capital, which describes the extent
and nature of connections with others, and the collective attitudes and behaviours between
people that support a well-functioning, close-knit society. The ONS, for example, measures
social capital through a 25-indicator framework, covering topics such as social network support,
trust and co-operative norms, personal relationships, and civic participation.90Loneliness is an
important consideration within community wellbeing and social capital.
See the What Works Centre for Wellbeing Social Capital recommended questions for the detail
of these validated questions and how to benchmark.
87 https://www.childrenssociety.org.uk/what-we-do/research/wellbeing/background-programme/good-childhood-index
88 For a list of measures, see SPECTRUM Database
89 https://ukdataservice.ac.uk/
90 Social capital in the UK. The ONS domains match the OECD’s framework for measuring social capital, see Four Interpretations of
Social Capital: An Agenda for Measurement
53
The What Works Centre for Wellbeing ‘Systematic scoping review of indicators of community
wellbeing in the UK’91 explores existing community wellbeing measures that organisations and
groups around the country are using.
Box A1.2: Scotland’s National Wellbeing Framework
The Scottish Government describes the National Performance Framework (NPF) as Scotland’s
‘wellbeing framework’. This recognises that for Scotland to become ‘a more successful country
with opportunities for all to flourish through increased wellbeing’ requires progress towards all
of the 11 outcomes, and application of the NPF values. This approach recognises that increasing
wellbeing means improving lives across Scotland now as well as creating the conditions to
ensure wellbeing for future generations.
Bringing individual and societal perspectives together, wellbeing can be defined as ‘living well’
both as individuals and collectively, as society. The Scottish Government view ‘living well’ in
broad terms and see this as encompassing the following areas, which form the focus of our
National Performance Framework outcomes: Health; Fair work & Business; Economy; Poverty;
Environment; Education; Children; Communities; Human Rights; Culture; International.
Scottish Government also consider ‘wellbeing’ to be about living well now and in the future and
believe it is fundamental to protect and invest in the capital stocks that sustain wellbeing over
time including: natural capital (the stock of natural assets), economic capital (those assets which
can be easily monetised), human capital (the skills and competencies of the population,
including democratic participation) and social capital (how society is organised, networks and
levels of trust) to ensure the sustainability of Scotland’s wellbeing.
91 Bagnall et al., (2017), ‘Systematic scoping review of indicators of community wellbeing in the UK’
https://whatworkswellbeing.org/product/ community-wellbeing-indicators-scoping-review/
54
Annex 2 - Quantifying and monetising wellbeing effects
Monetising wellbeing impacts
Once we are content with a robust wellbeing effect size, there are a range of options which can
be considered for ‘translating’ a change in life satisfaction into income92
.
In seeking an approach which can achieve approximate consistency with existing government
values which are accepted and used;93
fits within the existing theoretical framework of values
used within SCBA; can be practically applied and is easy to adopt; is consistent with evidence on
the link between wellbeing and income; is robust and based on published research and does not
lead to any unintended consequences or disadvantage for certain groups.
The accompanying discussion paper sets out a review of approaches against these criteria. On
the basis of the options and these criteria, in particular consistency, this guide proposes that a
robust estimate of a change in life satisfaction can be converted to a monetary value by
multiplying by £13,000 [Low: £10,000, High £16,000]. This is the recommended standard value
of one wellbeing adjusted life year - a ‘WELLBY’94
- in 2019 prices and values.
The value of WELLBY derived in this way can then be applied linearly to any change in life
satisfaction. For example, reducing life satisfaction by 0.4 for 1 year would have a value of 0.4 x
£13,000 = £5,200, with a range of £4,000 - £6,400. The same WELLBY value should be applied
to all individuals regardless of income and represents a population average willingness to pay.
This is justified on equity grounds, a per the approach taken for valuing life and health impacts
in the Green Book.95
As the WELLBY is a constant unit value, losses and gains are valued equally.
While the behavioural economics literature suggests losses are often valued more highly than
equivalent gains (beyond what can be explained by diminishing marginal utility of income),
using the same per-unit value for all wellbeing impacts has the benefit of being transparent and
easy to apply. Furthermore, it is in line with the existing Green Book approach to valuing life and
health impacts.
Derivation of the recommended WELLBY value and low-high range
There are two main approaches to estimating the monetary value of a WELLBY, defined as one
statistical unit of life-satisfaction on a 0-10 scale for one person for one year. Both are aiming to
estimate the Willingness to Pay for changes in Life Satisfaction.
Approach 1: Pivoting off the Green Book value of a QALY
• This approach focuses on achieving consistency with existing valuations used in Government.
It is based on Frijters & Krekel (2021) and applies the monetised value of a QALY, derived
92 Note this is not simply a focus on how our wellbeing is affected with a change in income, but rather how best to monetise a
change in wellbeing, in the same way that a change in health related quality of life is monetised through the QALY approach and
monetisation of the QALY. 93 For example, for the Value of a Statistical Life Year and value of a Quality Adjusted Life Year as set out in the Green Book. 94 See Frijters & Krekel ,2021. 95 See Green Book annex A1.
55
from the Value of a Statistical Life Year96, to the appropriate number of WELLBYs. As
described above, a WELLBY is defined as a one-point change in life satisfaction for one year.
• To determine the number of WELLBYs equivalent to one life year, we need to consider what
is incorporated in the relative measures. As is described in Brazier et al.’s (2016) paper for
the Department of Health, a QALY is a sub-set of what is captured within life satisfaction. A
QALY, when measured with the EQ-5D, represents the value of an additional life year lived
with no problems with mobility, self-care or usual activities, no pain or discomfort, and no
anxiety or depression.97 Brazier et al.’s research sponsored by NICE emphasises that there are
additional dimensions to wellbeing (and wellbeing as measured by Life Satisfaction) which
are not captured within these dimensions of the QALY.
• We can broadly align life satisfaction scores with the upper and lower bound of a QALY
based on research and papers from Frijters et al. (1999, 2021) as well as data from the ONS.
Frijters & Krekel (2021) note that the average life satisfaction of someone with no health
problems is around 8 (on a 0-10 scale).98 There are different assumptions which can be
taken for the bottom end of the range. There are QALY states worse than 0 – i.e. negative
QALYs, yet the bottom end of the life satisfaction range is 0. Very little is known about
individuals who answer 0 on a QALY and 0-2 on a life satisfaction scale.99 Frijters (1999)
look at the life satisfaction point at which individuals become indifferent between
continuing to live or not. Peasgood et al., (2018) implemented a very similar idea on UK
respondents and found the zero-point to be around 2.100
• However, this may be an overestimation of the point of indifference, when comparing with
observed behaviour (in this case, committing suicide): approximately 0.01 take their own
lives, yet a higher proportion of ONS respondents give 2 or lower on a life satisfaction score.
In the other direction, ONS data shows that the average Life Satisfaction of those self-
reporting their health to be ‘very bad’ is around 5.101 Based on the limited data available, the
point of indifference with a QALY of 0 is considered to align with a life satisfaction score of
greater than 0, which we assume is a score of 1 (on a 0-10 scale).
• One QALY is then associated with a 7- point change in life satisfaction (from someone with
no health problems, to as bad as death: 8-to-1).
• Given a QALY is worth £60,000 as per HMT Green Book guidance (2014 prices and values),
or £70,158 in 2019 prices and values,102
one WELLBY would have a value of £70,158/(8-1)
= £10,023.
This conversion relies on a number of assumptions, but these assumptions can be considered
logical, given the evidence available. In addition, this broad magnitude of the WELLBY is
corroborated by research by Huang et al. (2018), which uses an instrumental variables approach
96 In turn estimated through Carthy et al. (1999) willingness to pay values 97 The highest level of health which can be expected 98 Previous ONS data from 2014/15 Personal well-being estimates personal characteristics - Office for National Statistics (ons.gov.uk)
shows that the mean life satisfaction of individuals reporting ‘very good’ health is over 8 on a 0-10 scale. Recent data from ONS
Coronavirus personal and economic well-being impacts - Office for National Statistics (ons.gov.uk) shows that those reporting that
they do not have specific health conditions report a mean life satisfaction of over 8 (See Row 120, tab ‘changes for parts of
population’).
99 Respondents in Peasgood et al. (2018) found lower ends of the life satisfaction scale difficult to imagine 100 With a small sample: further research is encouraged. 101Personal well-being estimates personal characteristics - Office for National Statistics (ons.gov.uk) Note that ‘very bad’ health is considered higher than a 0 QALY 102 Uplifted to 2019 prices using GDP deflator growth (ONS series MNF2), and real GDP per capita growth (ONS series IHXW) in
conjunction with the marginal utility of income elasticity parameter of 1.3 as recommended in the main text.
56
that ensures ‘noticeability’ of the income change.103 We rely on the QALY based derivation as it
is based on established existing approaches to valuing life and health impacts in the Green Book.
This consistency with existing government values should be continually reviewed. If and when
any government figures for the value of a statistical life year update - including the methods and
approaches taken for this valuation - the consistency to the wellbeing income approach will
need to be reviewed.
Approach 2: Calculating the willingness to pay for life satisfaction changes
The second approach is based on analysis of the relationship between ln(income) and life
satisfaction. Fujiwara (2021) finds the coefficient on ln(income) is 1.25 (with life satisfaction
measured on a 1-7 scale). We can define a WELLBY in this context as the aggregation of WTP
for many infinitesimally small individual gains in life satisfaction which sum to 1 point of life
satisfaction for one year (i.e. 1 WELLBY).104
If life satisfaction us related to ln(income), this can be
computed as the inverse of the marginal utility of income:
𝑊𝑇𝑃 − 𝑊𝐸𝐿𝐿𝐵𝑌 = [𝑓′(ln(𝑀))
𝑀]
−1
=𝑀
𝛽𝑌
This expression is simply the marginal rate of substitution between income and life satisfaction.
In this expression 𝛽𝑌 is the coefficient on ln(income), converted to a 0-10 scale. Given we are
using a ln(income) coefficient of 1.25 on a 1-7 scale, this needs multiplying by 11/7 to be
expressed on a 0-10 scale. Then, we have:
𝛽𝑌 =11
7(1.25) = 1.96
We can then calculate the WTP per WELLBY with reference to average earnings based on ONS
data, which were £30,673 in 2019 as follows:
𝑊𝑇𝑃 (𝑊𝐸𝐿𝐿𝐵𝑌) =£30,673
1.96= £15,649.
For simplicity this is rounded to £16,000.
Deriving the central recommended WELLBY value
Summarising, we have derived two estimates of the monetary equivalent value of a WELLBY,
£10,023, and £15,649 (both in 2019 prices and values). We treat these as the upper and lower
bound, and take the mid-point as the recommended central estimate of the WTP-per-WELLBY,
which is then:
𝑊𝑇𝑃 (𝑊𝐸𝐿𝐿𝐵𝑌) =10,000 + 16,000
2= £13,000.
Therefore, the recommended value of a WELLBY, alongside the low-high range recommended
for sensitivity testing, is given in the below table.
103 These authors find that a one-off loss of income of approximately £9,000 reduced life satisfaction by 1 point for 1 year (2015
prices). The value of a WELLBY under this approach would therefore be £10,246 in 2019 prices – aiding comparability. 104 This is analogous to the definition of the Value of a Life Year and Value of a Prevented Fatality. See
https://www.gov.uk/government/publications/valuation-of-risks-to-life-and-health-monetary-value-of-a-life-year-voly/a-scoping-
study-on-the-valuation-of-risks-to-life-and-health-the-monetary-value-of-a-life-year-voly.
57
WTP-WELLBY value
(2019 prices and values) Source
Low £10,000
Based on QALY value (updated to
2019 prices), broadly using approach
in Frijters and Krekel (2021) but
adapting to reflect wider academic
comment on low-point conversion
Central £13,000 Midpoint of low and high
High £16,000 Based on ln(income) coefficient of
1.96105 from Fujiwara (2021)
Further details: price year and discounting
To convert to convert this figure into a different price and value base year using outturn ONS
economic data, the following formula should be used:
𝑊𝑇𝑃 (𝑊𝐸𝐿𝐿𝐵𝑌𝑡) = 𝑊𝑇𝑃 (𝑊𝐸𝐿𝐿𝐵𝑌𝑏𝑎𝑠𝑒) ∙𝐺𝐷𝑃_𝑑𝑒𝑓𝑙𝑎𝑡𝑜𝑟𝑡
𝐺𝐷𝑃_𝑑𝑒𝑓𝑙𝑎𝑡𝑜𝑟𝑏𝑎𝑠𝑒∙ (
𝐺𝐷𝑃_𝑝𝑒𝑟_𝑐𝑎𝑝𝑖𝑡𝑎𝑡
𝐺𝐷𝑃_𝑝𝑒𝑟_𝑐𝑎𝑝𝑖𝑡𝑎𝑏𝑎𝑠𝑒)
1.3
Where 1.3 is the negative of the marginal utility of income elasticity, taken from the HMT Green
Book Annex 3 on distributional weights (HMT, 2020). Applying the elasticity in this way ensures
that the ‘utility value’ of one unit of life satisfaction change is held constant over time.
In appraisal, changes in wellbeing which occur in future years are discounted using the Green
Book ‘health’ discount rate which starts at 1.5% (years 0-30) and declines gradually thereafter.
This is because the ‘wealth effect’, or real per capita consumption growth element of the
discount rate, is excluded, again preserving constant a utility value per point change in life
satisfaction in future years. Please refer to the HMT Green Book, Annex A6. Note, the WELLBY
value should always be uprated to the appraisal base year using the formula above.
Optional consideration: Monetising wellbeing impacts for non-marginal changes using the
ln(income) approach
For large changes in life satisfaction it may be important to consider the impact of diminishing
marginal utility of income on valuations, which is not reflected in the WELLBY approach. This
means the monetary equivalent value will not be a linear function of the size of the change (as
under the WELLBY approach) but the slope will increase (decrease) as the required gain (loss) in
income to offset the life satisfaction change increases. This follows directly from diminishing
marginal utility of income and the concavity of the utility function. For small changes in life
satisfaction this makes little difference to appraisal values.
Drawing on standard welfare economics, there are two possible ways of measuring the
monetary equivalent of a given change in life satisfaction. The formulae given below are based
on the ln(income) approach described above and are taken from Fujiwara (2013).
105 On a 0-10 scale, original study based on 1-7 scale and noted coefficient of 1.25
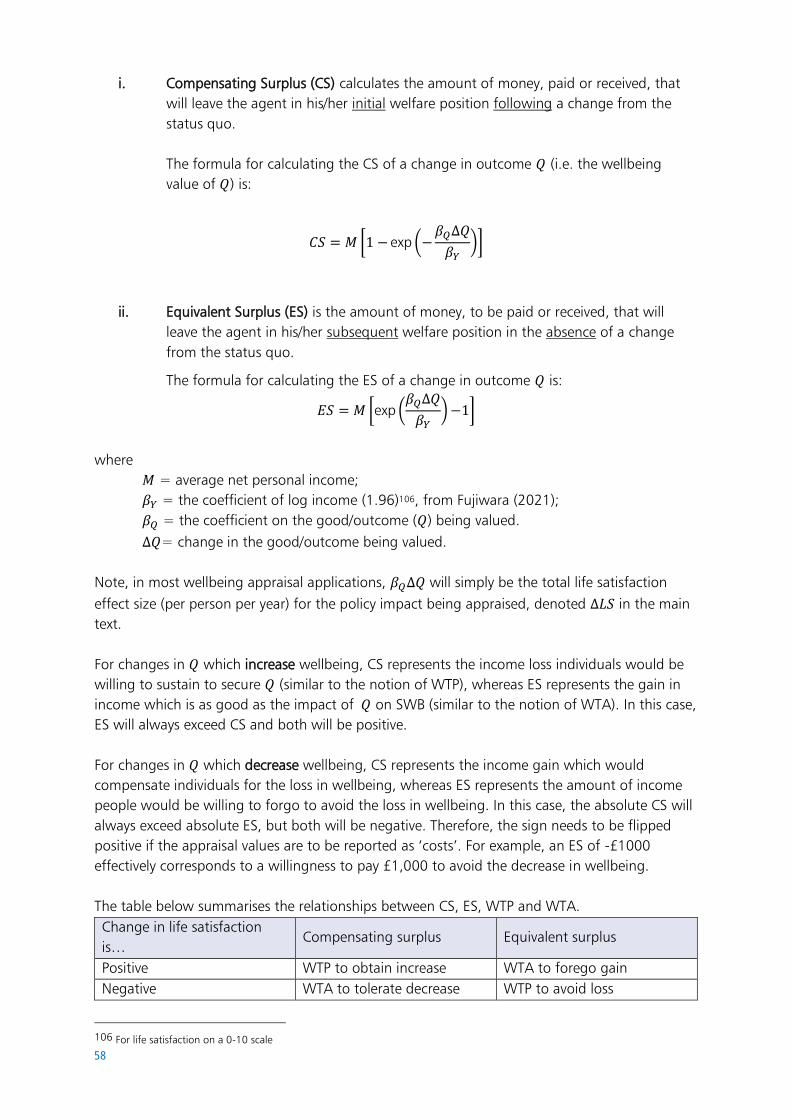
58
i. Compensating Surplus (CS) calculates the amount of money, paid or received, that
will leave the agent in his/her initial welfare position following a change from the
status quo.
The formula for calculating the CS of a change in outcome 𝑄 (i.e. the wellbeing
value of 𝑄) is:
𝐶𝑆 = 𝑀 [1 − exp (−𝛽𝑄∆𝑄
𝛽𝑌)]
ii. Equivalent Surplus (ES) is the amount of money, to be paid or received, that will
leave the agent in his/her subsequent welfare position in the absence of a change
from the status quo.
The formula for calculating the ES of a change in outcome 𝑄 is:
𝐸𝑆 = 𝑀 [exp (𝛽𝑄∆𝑄
𝛽𝑌) −1]
where
𝑀 = average net personal income;
𝛽𝑌 = the coefficient of log income (1.96)106, from Fujiwara (2021);
𝛽𝑄 = the coefficient on the good/outcome (𝑄) being valued.
∆𝑄= change in the good/outcome being valued.
Note, in most wellbeing appraisal applications, 𝛽𝑄∆𝑄 will simply be the total life satisfaction
effect size (per person per year) for the policy impact being appraised, denoted ∆𝐿𝑆 in the main
text.
For changes in 𝑄 which increase wellbeing, CS represents the income loss individuals would be
willing to sustain to secure 𝑄 (similar to the notion of WTP), whereas ES represents the gain in
income which is as good as the impact of 𝑄 on SWB (similar to the notion of WTA). In this case,
ES will always exceed CS and both will be positive.
For changes in 𝑄 which decrease wellbeing, CS represents the income gain which would
compensate individuals for the loss in wellbeing, whereas ES represents the amount of income
people would be willing to forgo to avoid the loss in wellbeing. In this case, the absolute CS will
always exceed absolute ES, but both will be negative. Therefore, the sign needs to be flipped
positive if the appraisal values are to be reported as ‘costs’. For example, an ES of -£1000
effectively corresponds to a willingness to pay £1,000 to avoid the decrease in wellbeing.
The table below summarises the relationships between CS, ES, WTP and WTA.
Change in life satisfaction
is… Compensating surplus Equivalent surplus
Positive WTP to obtain increase WTA to forego gain
Negative WTA to tolerate decrease WTP to avoid loss
106 For life satisfaction on a 0-10 scale
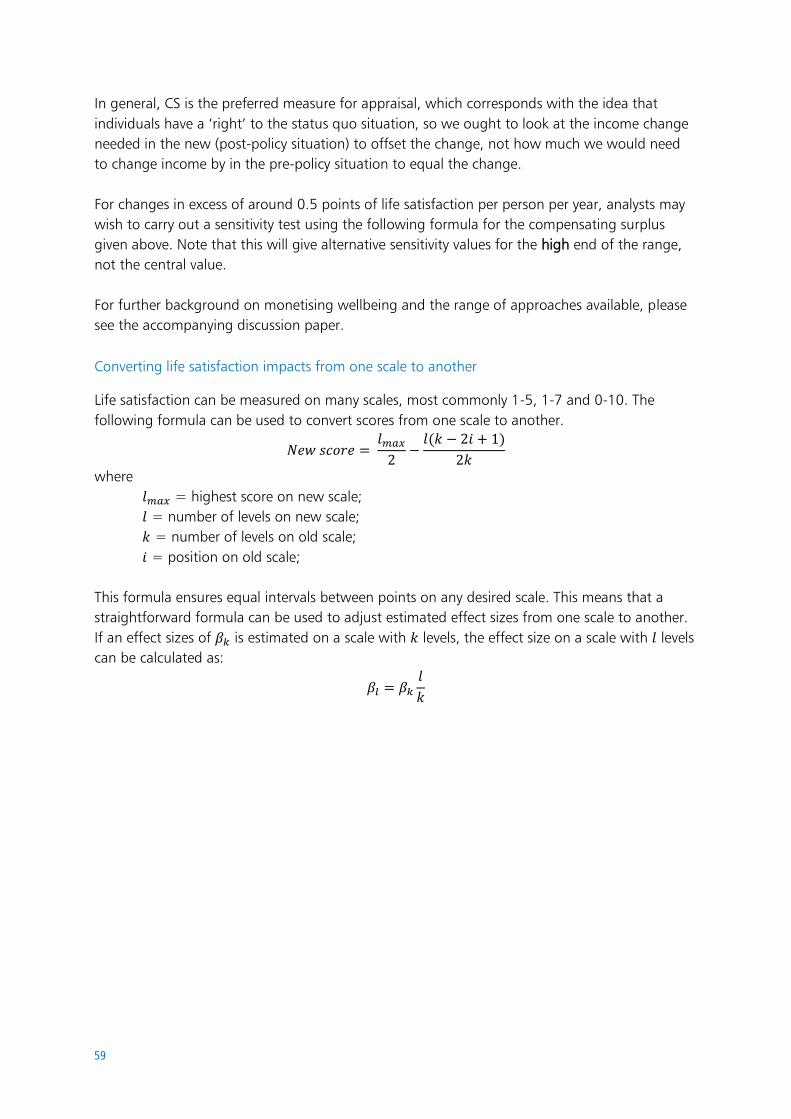
59
In general, CS is the preferred measure for appraisal, which corresponds with the idea that
individuals have a ‘right’ to the status quo situation, so we ought to look at the income change
needed in the new (post-policy situation) to offset the change, not how much we would need
to change income by in the pre-policy situation to equal the change.
For changes in excess of around 0.5 points of life satisfaction per person per year, analysts may
wish to carry out a sensitivity test using the following formula for the compensating surplus
given above. Note that this will give alternative sensitivity values for the high end of the range,
not the central value.
For further background on monetising wellbeing and the range of approaches available, please
see the accompanying discussion paper.
Converting life satisfaction impacts from one scale to another
Life satisfaction can be measured on many scales, most commonly 1-5, 1-7 and 0-10. The
following formula can be used to convert scores from one scale to another.
𝑁𝑒𝑤 𝑠𝑐𝑜𝑟𝑒 = 𝑙𝑚𝑎𝑥
2−
𝑙(𝑘 − 2𝑖 + 1)
2𝑘
where
𝑙𝑚𝑎𝑥 = highest score on new scale;
𝑙 = number of levels on new scale;
𝑘 = number of levels on old scale;
𝑖 = position on old scale;
This formula ensures equal intervals between points on any desired scale. This means that a
straightforward formula can be used to adjust estimated effect sizes from one scale to another.
If an effect sizes of 𝛽𝑘 is estimated on a scale with 𝑘 levels, the effect size on a scale with 𝑙 levels
can be calculated as:
𝛽𝑙 = 𝛽𝑘
𝑙
𝑘
60
Selection of wellbeing values from literature
There is a large and expanding collection of data and research on wellbeing. The table below
sets out a summary of wellbeing effects which may be relevant for policy analysis, including a
sub-set of those in Frijters et al.. (2020) and drawing from further relevant studies.
The rows below have been selected to show a broad spectrum of the ONS dimensions of
wellbeing and are not exhaustive of the wellbeing studies which are available. It should be noted
that the relative importance of these factors varies across individuals and groups, including
geographies, ages and other characteristics. In some cases, the specific wellbeing impacts for
certain groups have been drawn out and where possible, analysis should be specific for the
group in question.
The table mainly focuses on studies showing the effect on life satisfaction along with a selection
of monetised values. As set out in the guide (Chapter 4), the life satisfaction approach for
monetisation will not be relevant in all cases. This depends on the effect as well as the
techniques and data available in a certain area of focus. Where a specific change is already
robustly monetised using e.g. QALYs or a damage cost method, this is signposted in the table.
In these situations, these existing methods for monetising wellbeing should be used.
Where shown, monetary values below have been calculated by applying the recommended
monetisation approach by the life satisfaction figures available in the data. These monetary
values – when applied to life satisfaction figures - are drawn out to be illustrative of the data
available and should not be considered HMT recommended values. Figures should not be used
without first assessing the data for the context and policy change in question, plus assessing any
further evidence available.
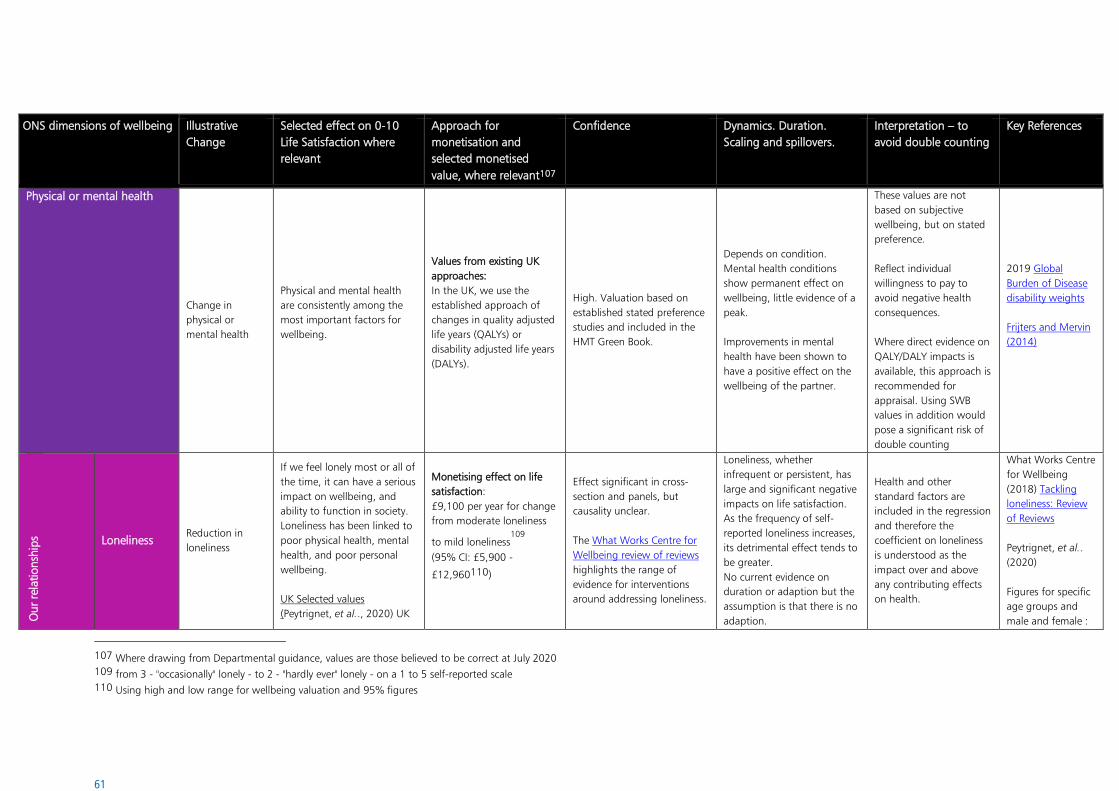
61
ONS dimensions of wellbeing Illustrative
Change Selected effect on 0-10
Life Satisfaction where
relevant
Approach for
monetisation and
selected monetised
value, where relevant107
Confidence Dynamics. Duration.
Scaling and spillovers. Interpretation – to
avoid double counting Key References
Physical or mental health
Change in
physical or
mental health
Physical and mental health
are consistently among the
most important factors for
wellbeing.
Values from existing UK
approaches:
In the UK, we use the
established approach of
changes in quality adjusted
life years (QALYs) or
disability adjusted life years
(DALYs).
High. Valuation based on
established stated preference
studies and included in the
HMT Green Book.
Depends on condition.
Mental health conditions
show permanent effect on
wellbeing, little evidence of a
peak.
Improvements in mental
health have been shown to
have a positive effect on the
wellbeing of the partner.
These values are not
based on subjective
wellbeing, but on stated
preference.
Reflect individual
willingness to pay to
avoid negative health
consequences.
Where direct evidence on
QALY/DALY impacts is
available, this approach is
recommended for
appraisal. Using SWB
values in addition would
pose a significant risk of
double counting
2019 Global
Burden of Disease
disability weights
Frijters and Mervin
(2014)
Our
rela
tionsh
ips Loneliness
Reduction in
loneliness
If we feel lonely most or all of
the time, it can have a serious
impact on wellbeing, and
ability to function in society.
Loneliness has been linked to
poor physical health, mental
health, and poor personal
wellbeing.
UK Selected values
(Peytrignet, et al.., 2020) UK
Monetising effect on life
satisfaction:
£9,100 per year for change
from moderate loneliness
to mild loneliness109
(95% CI: £5,900 -
£12,960110)
Effect significant in cross-
section and panels, but
causality unclear.
The What Works Centre for
Wellbeing review of reviews
highlights the range of
evidence for interventions
around addressing loneliness.
Loneliness, whether
infrequent or persistent, has
large and significant negative
impacts on life satisfaction.
As the frequency of self-
reported loneliness increases,
its detrimental effect tends to
be greater.
No current evidence on
duration or adaption but the
assumption is that there is no
adaption.
Health and other
standard factors are
included in the regression
and therefore the
coefficient on loneliness
is understood as the
impact over and above
any contributing effects
on health.
What Works Centre
for Wellbeing
(2018) Tackling
loneliness: Review
of Reviews
Peytrignet, et al..
(2020)
Figures for specific
age groups and
male and female :
107 Where drawing from Departmental guidance, values are those believed to be correct at July 2020 109 from 3 - "occasionally" lonely - to 2 - "hardly ever" lonely - on a 1 to 5 self-reported scale 110 Using high and low range for wellbeing valuation and 95% figures
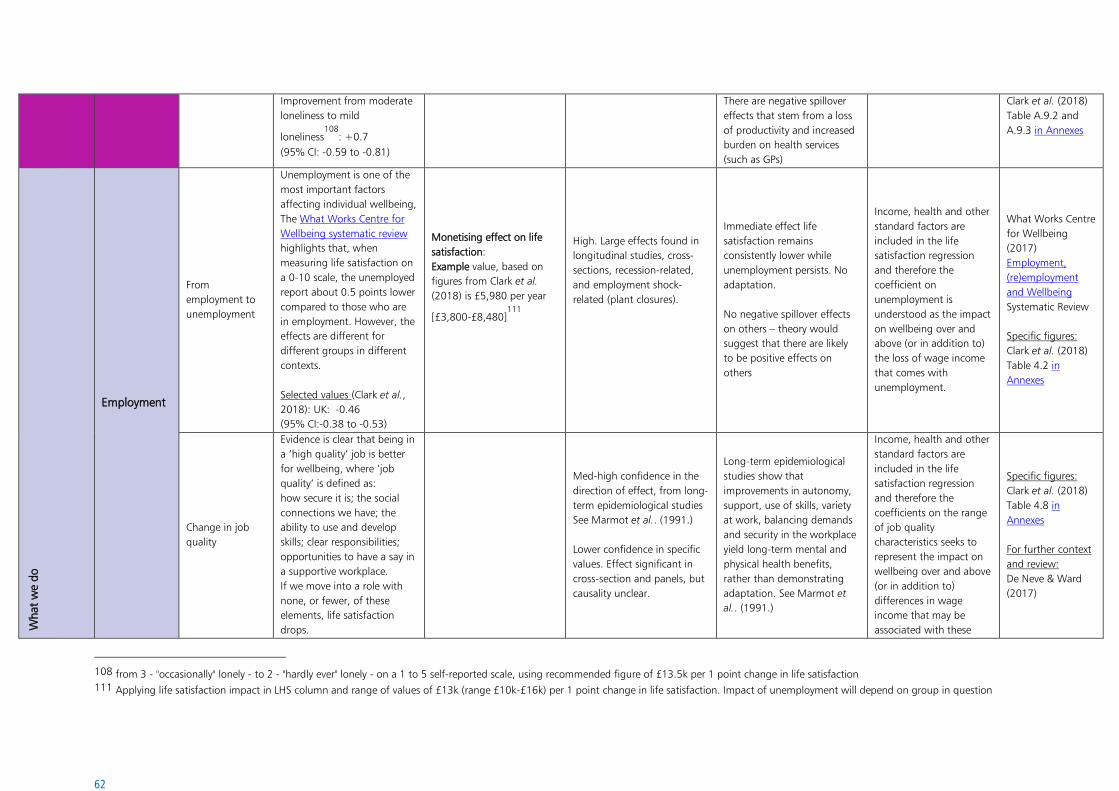
62
Improvement from moderate
loneliness to mild
loneliness108
: +0.7
(95% CI: -0.59 to -0.81)
There are negative spillover
effects that stem from a loss
of productivity and increased
burden on health services
(such as GPs)
Clark et al. (2018)
Table A.9.2 and
A.9.3 in Annexes
What
we
do
Employment
From
employment to
unemployment
Unemployment is one of the
most important factors
affecting individual wellbeing,
The What Works Centre for
Wellbeing systematic review
highlights that, when
measuring life satisfaction on
a 0-10 scale, the unemployed
report about 0.5 points lower
compared to those who are
in employment. However, the
effects are different for
different groups in different
contexts.
Selected values (Clark et al.,
2018): UK: -0.46
(95% CI:-0.38 to -0.53)
Monetising effect on life
satisfaction:
Example value, based on
figures from Clark et al.
(2018) is £5,980 per year
[£3,800-£8,480]111
High. Large effects found in
longitudinal studies, cross-
sections, recession-related,
and employment shock-
related (plant closures).
Immediate effect life
satisfaction remains
consistently lower while
unemployment persists. No
adaptation.
No negative spillover effects
on others – theory would
suggest that there are likely
to be positive effects on
others
Income, health and other
standard factors are
included in the life
satisfaction regression
and therefore the
coefficient on
unemployment is
understood as the impact
on wellbeing over and
above (or in addition to)
the loss of wage income
that comes with
unemployment.
What Works Centre
for Wellbeing
(2017)
Employment,
(re)employment
and Wellbeing
Systematic Review
Specific figures:
Clark et al. (2018)
Table 4.2 in
Annexes
Change in job
quality
Evidence is clear that being in
a ‘high quality’ job is better
for wellbeing, where ‘job
quality’ is defined as:
how secure it is; the social
connections we have; the
ability to use and develop
skills; clear responsibilities;
opportunities to have a say in
a supportive workplace.
If we move into a role with
none, or fewer, of these
elements, life satisfaction
drops.
Med-high confidence in the
direction of effect, from long-
term epidemiological studies
See Marmot et al.. (1991.)
Lower confidence in specific
values. Effect significant in
cross-section and panels, but
causality unclear.
Long-term epidemiological
studies show that
improvements in autonomy,
support, use of skills, variety
at work, balancing demands
and security in the workplace
yield long-term mental and
physical health benefits,
rather than demonstrating
adaptation. See Marmot et
al.. (1991.)
Income, health and other
standard factors are
included in the life
satisfaction regression
and therefore the
coefficients on the range
of job quality
characteristics seeks to
represent the impact on
wellbeing over and above
(or in addition to)
differences in wage
income that may be
associated with these
Specific figures:
Clark et al. (2018)
Table 4.8 in
Annexes
For further context
and review:
De Neve & Ward
(2017)
108 from 3 - "occasionally" lonely - to 2 - "hardly ever" lonely - on a 1 to 5 self-reported scale, using recommended figure of £13.5k per 1 point change in life satisfaction 111 Applying life satisfaction impact in LHS column and range of values of £13k (range £10k-£16k) per 1 point change in life satisfaction. Impact of unemployment will depend on group in question
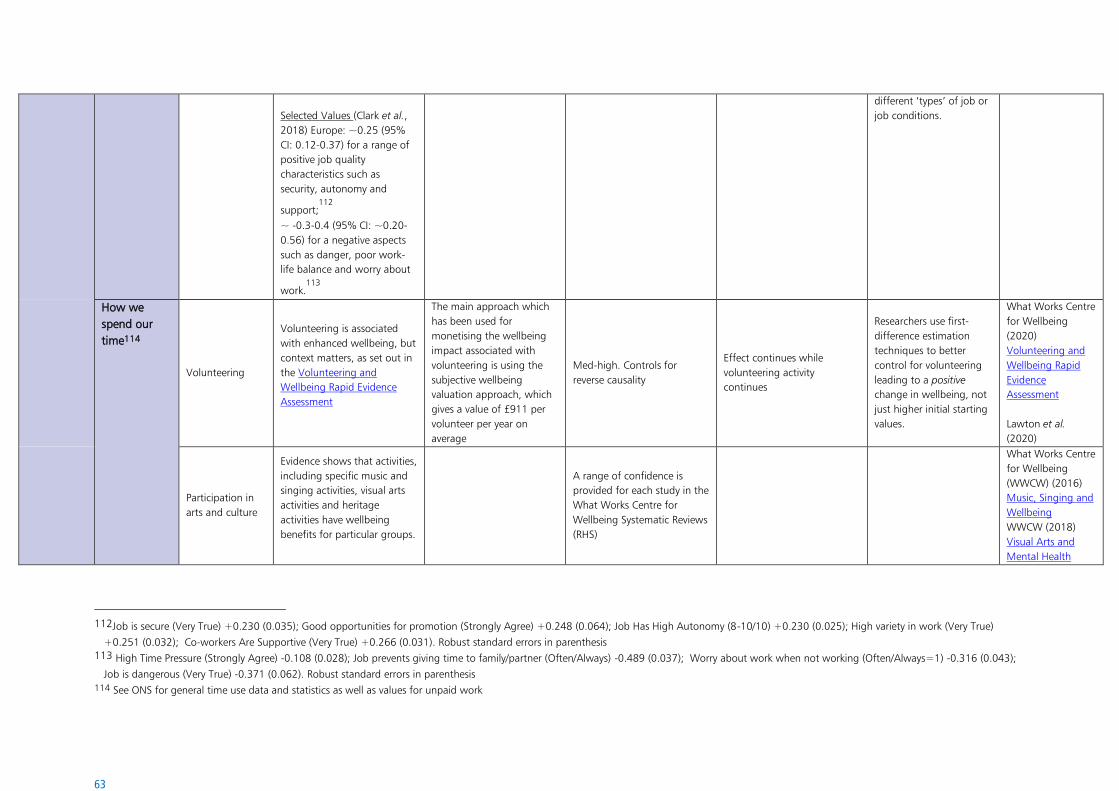
63
Selected Values (Clark et al.,
2018) Europe: ~0.25 (95%
CI: 0.12-0.37) for a range of
positive job quality
characteristics such as
security, autonomy and
support;112
~ -0.3-0.4 (95% CI: ~0.20-
0.56) for a negative aspects
such as danger, poor work-
life balance and worry about
work.113
different ‘types’ of job or
job conditions.
How we
spend our
time114
Volunteering
Volunteering is associated
with enhanced wellbeing, but
context matters, as set out in
the Volunteering and
Wellbeing Rapid Evidence
Assessment
The main approach which
has been used for
monetising the wellbeing
impact associated with
volunteering is using the
subjective wellbeing
valuation approach, which
gives a value of £911 per
volunteer per year on
average
Med-high. Controls for
reverse causality
Effect continues while
volunteering activity
continues
Researchers use first-
difference estimation
techniques to better
control for volunteering
leading to a positive
change in wellbeing, not
just higher initial starting
values.
What Works Centre
for Wellbeing
(2020)
Volunteering and
Wellbeing Rapid
Evidence
Assessment
Lawton et al.
(2020)
Participation in
arts and culture
Evidence shows that activities,
including specific music and
singing activities, visual arts
activities and heritage
activities have wellbeing
benefits for particular groups.
A range of confidence is
provided for each study in the
What Works Centre for
Wellbeing Systematic Reviews
(RHS)
What Works Centre
for Wellbeing
(WWCW) (2016)
Music, Singing and
Wellbeing
WWCW (2018)
Visual Arts and
Mental Health
112Job is secure (Very True) +0.230 (0.035); Good opportunities for promotion (Strongly Agree) +0.248 (0.064); Job Has High Autonomy (8-10/10) +0.230 (0.025); High variety in work (Very True)
+0.251 (0.032); Co-workers Are Supportive (Very True) +0.266 (0.031). Robust standard errors in parenthesis 113 High Time Pressure (Strongly Agree) -0.108 (0.028); Job prevents giving time to family/partner (Often/Always) -0.489 (0.037); Worry about work when not working (Often/Always=1) -0.316 (0.043);
Job is dangerous (Very True) -0.371 (0.062). Robust standard errors in parenthesis 114 See ONS for general time use data and statistics as well as values for unpaid work
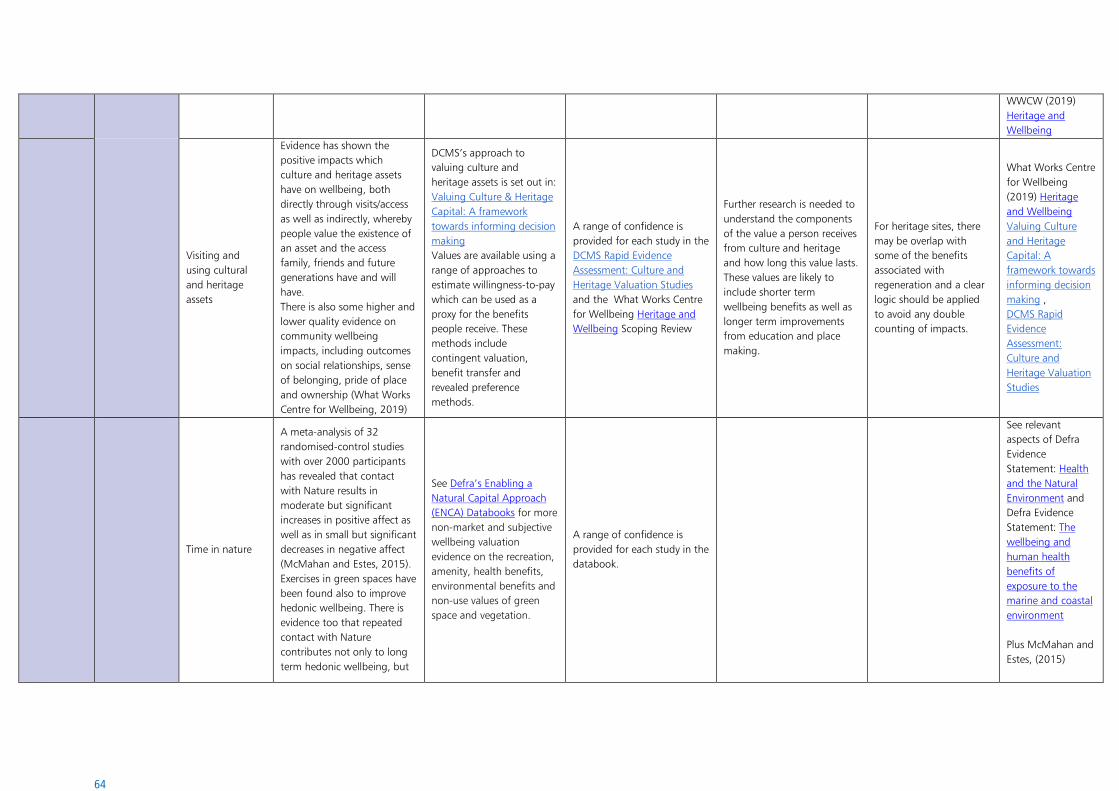
64
WWCW (2019)
Heritage and
Wellbeing
Visiting and
using cultural
and heritage
assets
Evidence has shown the
positive impacts which
culture and heritage assets
have on wellbeing, both
directly through visits/access
as well as indirectly, whereby
people value the existence of
an asset and the access
family, friends and future
generations have and will
have.
There is also some higher and
lower quality evidence on
community wellbeing
impacts, including outcomes
on social relationships, sense
of belonging, pride of place
and ownership (What Works
Centre for Wellbeing, 2019)
DCMS’s approach to
valuing culture and
heritage assets is set out in:
Valuing Culture & Heritage
Capital: A framework
towards informing decision
making
Values are available using a
range of approaches to
estimate willingness-to-pay
which can be used as a
proxy for the benefits
people receive. These
methods include
contingent valuation,
benefit transfer and
revealed preference
methods.
A range of confidence is
provided for each study in the
DCMS Rapid Evidence
Assessment: Culture and
Heritage Valuation Studies
and the What Works Centre
for Wellbeing Heritage and
Wellbeing Scoping Review
Further research is needed to
understand the components
of the value a person receives
from culture and heritage
and how long this value lasts.
These values are likely to
include shorter term
wellbeing benefits as well as
longer term improvements
from education and place
making.
For heritage sites, there
may be overlap with
some of the benefits
associated with
regeneration and a clear
logic should be applied
to avoid any double
counting of impacts.
What Works Centre
for Wellbeing
(2019) Heritage
and Wellbeing
Valuing Culture
and Heritage
Capital: A
framework towards
informing decision
making ,
DCMS Rapid
Evidence
Assessment:
Culture and
Heritage Valuation
Studies
Time in nature
A meta-analysis of 32
randomised-control studies
with over 2000 participants
has revealed that contact
with Nature results in
moderate but significant
increases in positive affect as
well as in small but significant
decreases in negative affect
(McMahan and Estes, 2015).
Exercises in green spaces have
been found also to improve
hedonic wellbeing. There is
evidence too that repeated
contact with Nature
contributes not only to long
term hedonic wellbeing, but
See Defra’s Enabling a
Natural Capital Approach
(ENCA) Databooks for more
non-market and subjective
wellbeing valuation
evidence on the recreation,
amenity, health benefits,
environmental benefits and
non-use values of green
space and vegetation.
A range of confidence is
provided for each study in the
databook.
See relevant
aspects of Defra
Evidence
Statement: Health
and the Natural
Environment and
Defra Evidence
Statement: The
wellbeing and
human health
benefits of
exposure to the
marine and coastal
environment
Plus McMahan and
Estes, (2015)
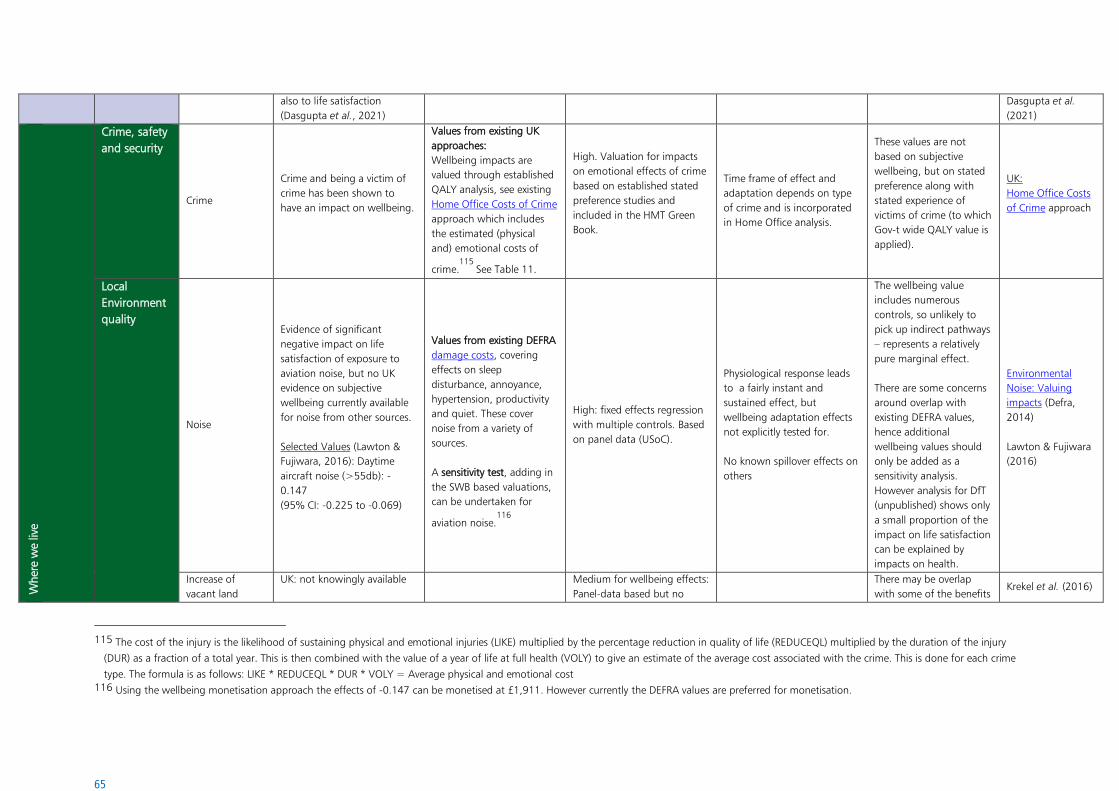
65
also to life satisfaction
(Dasgupta et al., 2021)
Dasgupta et al.
(2021)
Wher
e w
e liv
e
Crime, safety
and security
Crime
Crime and being a victim of
crime has been shown to
have an impact on wellbeing.
Values from existing UK
approaches:
Wellbeing impacts are
valued through established
QALY analysis, see existing
Home Office Costs of Crime
approach which includes
the estimated (physical
and) emotional costs of
crime.115
See Table 11.
High. Valuation for impacts
on emotional effects of crime
based on established stated
preference studies and
included in the HMT Green
Book.
Time frame of effect and
adaptation depends on type
of crime and is incorporated
in Home Office analysis.
These values are not
based on subjective
wellbeing, but on stated
preference along with
stated experience of
victims of crime (to which
Gov-t wide QALY value is
applied).
UK:
Home Office Costs
of Crime approach
Local
Environment
quality
Noise
Evidence of significant
negative impact on life
satisfaction of exposure to
aviation noise, but no UK
evidence on subjective
wellbeing currently available
for noise from other sources.
Selected Values (Lawton &
Fujiwara, 2016): Daytime
aircraft noise (>55db): -
0.147
(95% CI: -0.225 to -0.069)
Values from existing DEFRA
damage costs, covering
effects on sleep
disturbance, annoyance,
hypertension, productivity
and quiet. These cover
noise from a variety of
sources.
A sensitivity test, adding in
the SWB based valuations,
can be undertaken for
aviation noise.116
High: fixed effects regression
with multiple controls. Based
on panel data (USoC).
Physiological response leads
to a fairly instant and
sustained effect, but
wellbeing adaptation effects
not explicitly tested for.
No known spillover effects on
others
The wellbeing value
includes numerous
controls, so unlikely to
pick up indirect pathways
– represents a relatively
pure marginal effect.
There are some concerns
around overlap with
existing DEFRA values,
hence additional
wellbeing values should
only be added as a
sensitivity analysis.
However analysis for DfT
(unpublished) shows only
a small proportion of the
impact on life satisfaction
can be explained by
impacts on health.
Environmental
Noise: Valuing
impacts (Defra,
2014)
Lawton & Fujiwara
(2016)
Increase of
vacant land
UK: not knowingly available
Medium for wellbeing effects:
Panel-data based but no
There may be overlap
with some of the benefits Krekel et al. (2016)
115 The cost of the injury is the likelihood of sustaining physical and emotional injuries (LIKE) multiplied by the percentage reduction in quality of life (REDUCEQL) multiplied by the duration of the injury
(DUR) as a fraction of a total year. This is then combined with the value of a year of life at full health (VOLY) to give an estimate of the average cost associated with the crime. This is done for each crime
type. The formula is as follows: LIKE * REDUCEQL * DUR * VOLY = Average physical and emotional cost 116 Using the wellbeing monetisation approach the effects of -0.147 can be monetised at £1,911. However currently the DEFRA values are preferred for monetisation.
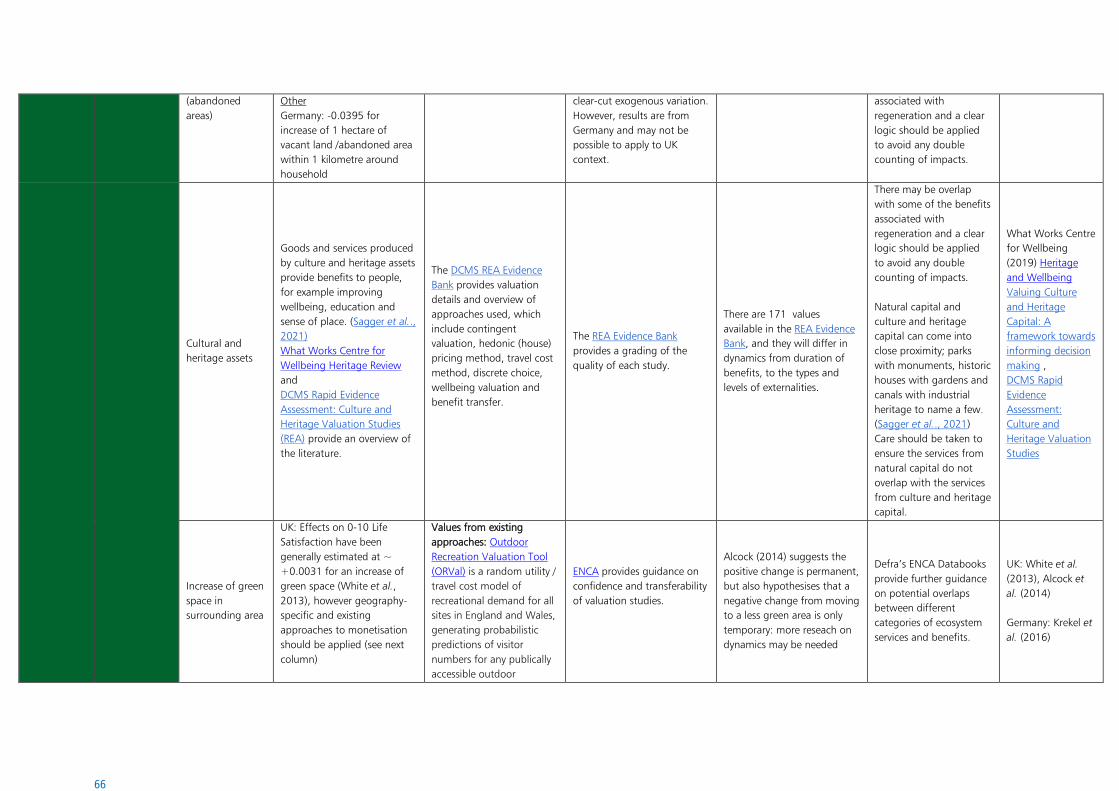
66
(abandoned
areas)
Other
Germany: -0.0395 for
increase of 1 hectare of
vacant land /abandoned area
within 1 kilometre around
household
clear-cut exogenous variation.
However, results are from
Germany and may not be
possible to apply to UK
context.
associated with
regeneration and a clear
logic should be applied
to avoid any double
counting of impacts.
Cultural and
heritage assets
Goods and services produced
by culture and heritage assets
provide benefits to people,
for example improving
wellbeing, education and
sense of place. (Sagger et al..,
2021)
What Works Centre for
Wellbeing Heritage Review
and
DCMS Rapid Evidence
Assessment: Culture and
Heritage Valuation Studies
(REA) provide an overview of
the literature.
The DCMS REA Evidence
Bank provides valuation
details and overview of
approaches used, which
include contingent
valuation, hedonic (house)
pricing method, travel cost
method, discrete choice,
wellbeing valuation and
benefit transfer.
The REA Evidence Bank
provides a grading of the
quality of each study.
There are 171 values
available in the REA Evidence
Bank, and they will differ in
dynamics from duration of
benefits, to the types and
levels of externalities.
There may be overlap
with some of the benefits
associated with
regeneration and a clear
logic should be applied
to avoid any double
counting of impacts.
Natural capital and
culture and heritage
capital can come into
close proximity; parks
with monuments, historic
houses with gardens and
canals with industrial
heritage to name a few.
(Sagger et al.., 2021)
Care should be taken to
ensure the services from
natural capital do not
overlap with the services
from culture and heritage
capital.
What Works Centre
for Wellbeing
(2019) Heritage
and Wellbeing
Valuing Culture
and Heritage
Capital: A
framework towards
informing decision
making ,
DCMS Rapid
Evidence
Assessment:
Culture and
Heritage Valuation
Studies
Increase of green
space in
surrounding area
UK: Effects on 0-10 Life
Satisfaction have been
generally estimated at ~
+0.0031 for an increase of
green space (White et al.,
2013), however geography-
specific and existing
approaches to monetisation
should be applied (see next
column)
Values from existing
approaches: Outdoor
Recreation Valuation Tool
(ORVal) is a random utility /
travel cost model of
recreational demand for all
sites in England and Wales,
generating probabilistic
predictions of visitor
numbers for any publically
accessible outdoor
ENCA provides guidance on
confidence and transferability
of valuation studies.
Alcock (2014) suggests the
positive change is permanent,
but also hypothesises that a
negative change from moving
to a less green area is only
temporary: more reseach on
dynamics may be needed
Defra’s ENCA Databooks
provide further guidance
on potential overlaps
between different
categories of ecosystem
services and benefits.
UK: White et al.
(2013), Alcock et
al. (2014)
Germany: Krekel et
al. (2016)
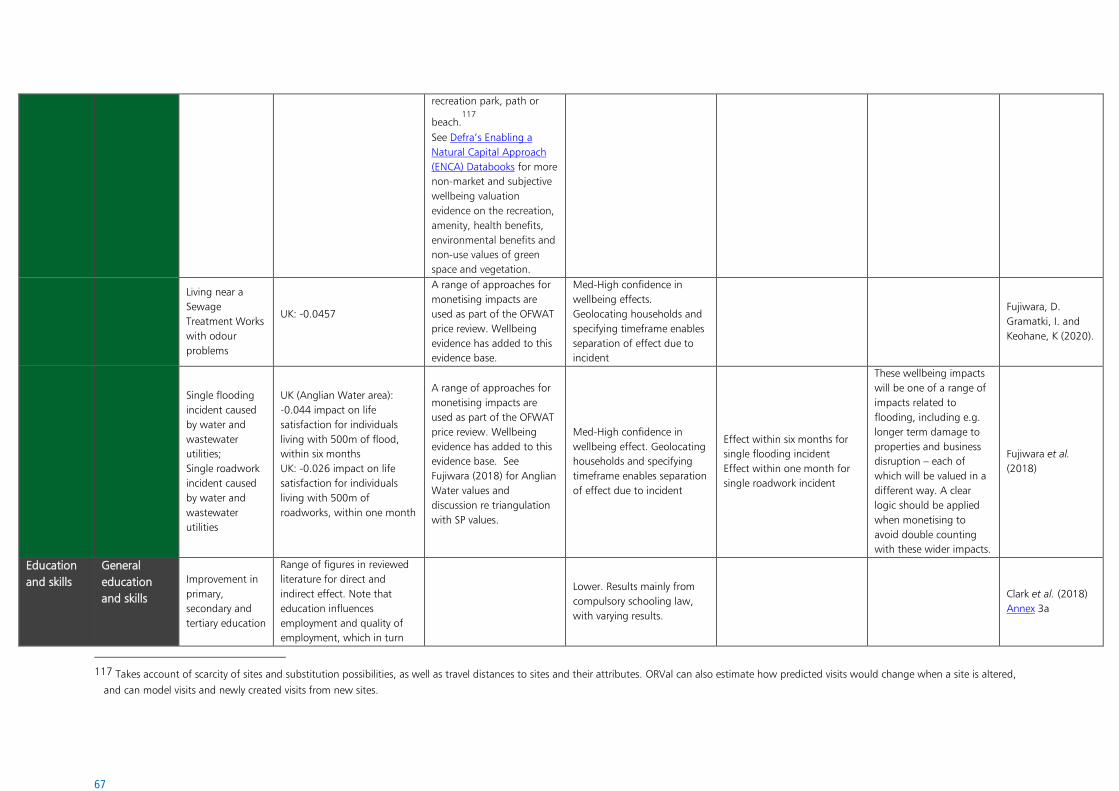
67
recreation park, path or
beach.117
See Defra’s Enabling a
Natural Capital Approach
(ENCA) Databooks for more
non-market and subjective
wellbeing valuation
evidence on the recreation,
amenity, health benefits,
environmental benefits and
non-use values of green
space and vegetation.
Living near a
Sewage
Treatment Works
with odour
problems
UK: -0.0457
A range of approaches for
monetising impacts are
used as part of the OFWAT
price review. Wellbeing
evidence has added to this
evidence base.
Med-High confidence in
wellbeing effects.
Geolocating households and
specifying timeframe enables
separation of effect due to
incident
Fujiwara, D.
Gramatki, I. and
Keohane, K (2020).
Single flooding
incident caused
by water and
wastewater
utilities;
Single roadwork
incident caused
by water and
wastewater
utilities
UK (Anglian Water area):
-0.044 impact on life
satisfaction for individuals
living with 500m of flood,
within six months
UK: -0.026 impact on life
satisfaction for individuals
living with 500m of
roadworks, within one month
A range of approaches for
monetising impacts are
used as part of the OFWAT
price review. Wellbeing
evidence has added to this
evidence base. See
Fujiwara (2018) for Anglian
Water values and
discussion re triangulation
with SP values.
Med-High confidence in
wellbeing effect. Geolocating
households and specifying
timeframe enables separation
of effect due to incident
Effect within six months for
single flooding incident
Effect within one month for
single roadwork incident
These wellbeing impacts
will be one of a range of
impacts related to
flooding, including e.g.
longer term damage to
properties and business
disruption – each of
which will be valued in a
different way. A clear
logic should be applied
when monetising to
avoid double counting
with these wider impacts.
Fujiwara et al.
(2018)
Education
and skills
General
education
and skills
Improvement in
primary,
secondary and
tertiary education
Range of figures in reviewed
literature for direct and
indirect effect. Note that
education influences
employment and quality of
employment, which in turn
Lower. Results mainly from
compulsory schooling law,
with varying results.
Clark et al. (2018)
Annex 3a
117 Takes account of scarcity of sites and substitution possibilities, as well as travel distances to sites and their attributes. ORVal can also estimate how predicted visits would change when a site is altered,
and can model visits and newly created visits from new sites.
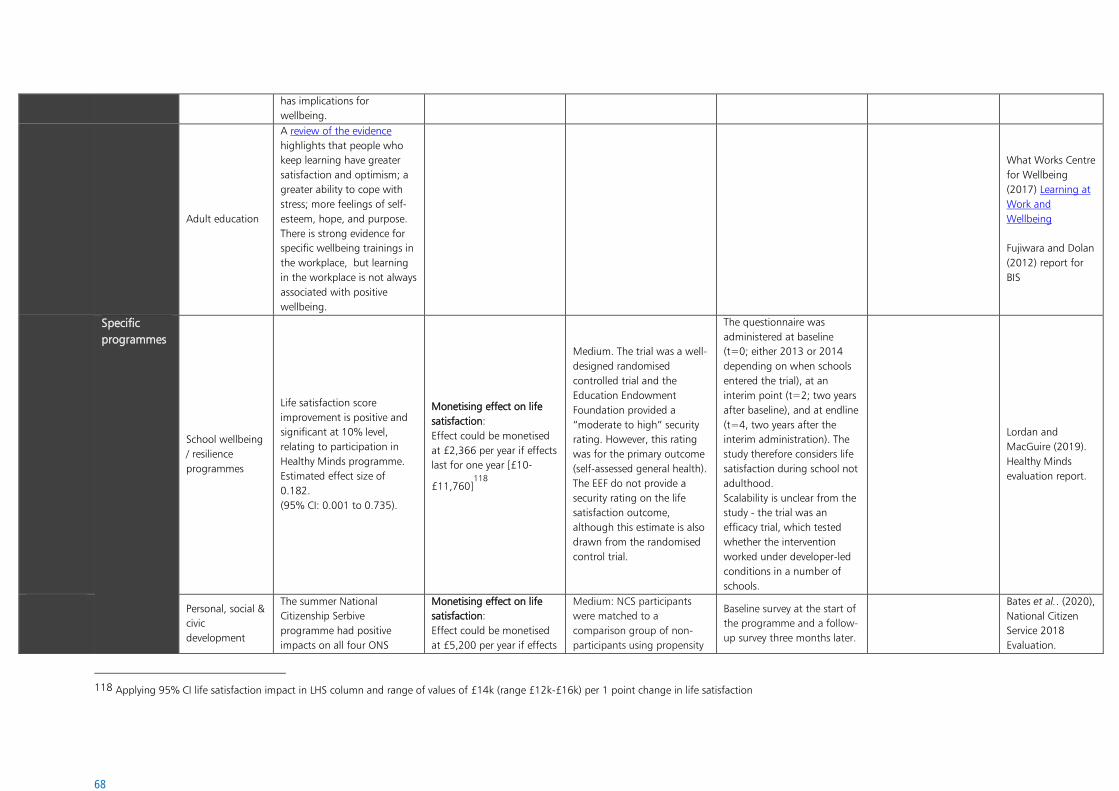
68
has implications for
wellbeing.
Adult education
A review of the evidence
highlights that people who
keep learning have greater
satisfaction and optimism; a
greater ability to cope with
stress; more feelings of self-
esteem, hope, and purpose.
There is strong evidence for
specific wellbeing trainings in
the workplace, but learning
in the workplace is not always
associated with positive
wellbeing.
What Works Centre
for Wellbeing
(2017) Learning at
Work and
Wellbeing
Fujiwara and Dolan
(2012) report for
BIS
Specific
programmes
School wellbeing
/ resilience
programmes
Life satisfaction score
improvement is positive and
significant at 10% level,
relating to participation in
Healthy Minds programme.
Estimated effect size of
0.182.
(95% CI: 0.001 to 0.735).
Monetising effect on life
satisfaction:
Effect could be monetised
at £2,366 per year if effects
last for one year [£10-
£11,760]118
Medium. The trial was a well-
designed randomised
controlled trial and the
Education Endowment
Foundation provided a
“moderate to high” security
rating. However, this rating
was for the primary outcome
(self-assessed general health).
The EEF do not provide a
security rating on the life
satisfaction outcome,
although this estimate is also
drawn from the randomised
control trial.
The questionnaire was
administered at baseline
(t=0; either 2013 or 2014
depending on when schools
entered the trial), at an
interim point (t=2; two years
after baseline), and at endline
(t=4, two years after the
interim administration). The
study therefore considers life
satisfaction during school not
adulthood.
Scalability is unclear from the
study - the trial was an
efficacy trial, which tested
whether the intervention
worked under developer-led
conditions in a number of
schools.
Lordan and
MacGuire (2019).
Healthy Minds
evaluation report.
Personal, social &
civic
development
The summer National
Citizenship Serbive
programme had positive
impacts on all four ONS
Monetising effect on life
satisfaction:
Effect could be monetised
at £5,200 per year if effects
Medium: NCS participants
were matched to a
comparison group of non-
participants using propensity
Baseline survey at the start of
the programme and a follow-
up survey three months later.
Bates et al.. (2020),
National Citizen
Service 2018
Evaluation.
118 Applying 95% CI life satisfaction impact in LHS column and range of values of £14k (range £12k-£16k) per 1 point change in life satisfaction
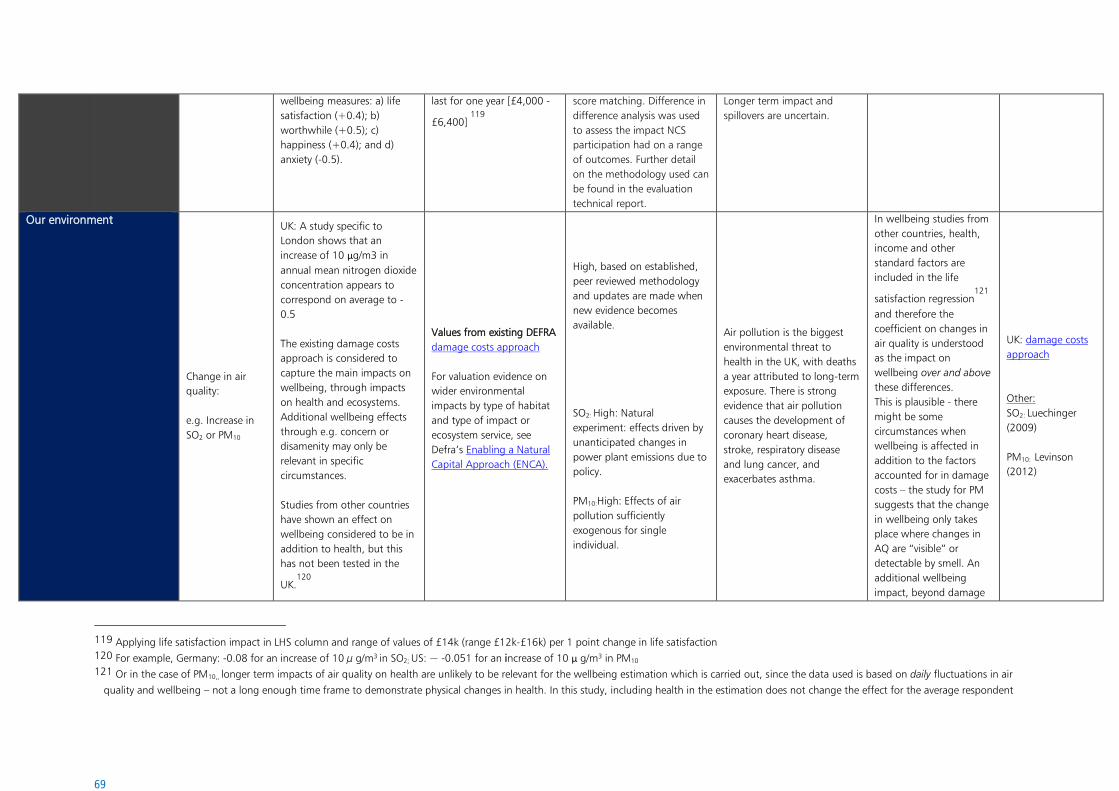
69
wellbeing measures: a) life
satisfaction (+0.4); b)
worthwhile (+0.5); c)
happiness (+0.4); and d)
anxiety (-0.5).
last for one year [£4,000 -
£6,400] 119
score matching. Difference in
difference analysis was used
to assess the impact NCS
participation had on a range
of outcomes. Further detail
on the methodology used can
be found in the evaluation
technical report.
Longer term impact and
spillovers are uncertain.
Our environment
Change in air
quality:
e.g. Increase in
SO2 or PM10
UK: A study specific to
London shows that an
increase of 10 μg/m3 in
annual mean nitrogen dioxide
concentration appears to
correspond on average to -
0.5
The existing damage costs
approach is considered to
capture the main impacts on
wellbeing, through impacts
on health and ecosystems.
Additional wellbeing effects
through e.g. concern or
disamenity may only be
relevant in specific
circumstances.
Studies from other countries
have shown an effect on
wellbeing considered to be in
addition to health, but this
has not been tested in the
UK.120
Values from existing DEFRA
damage costs approach
For valuation evidence on
wider environmental
impacts by type of habitat
and type of impact or
ecosystem service, see
Defra’s Enabling a Natural
Capital Approach (ENCA).
High, based on established,
peer reviewed methodology
and updates are made when
new evidence becomes
available.
SO2: High: Natural
experiment: effects driven by
unanticipated changes in
power plant emissions due to
policy.
PM10:High: Effects of air
pollution sufficiently
exogenous for single
individual.
Air pollution is the biggest
environmental threat to
health in the UK, with deaths
a year attributed to long-term
exposure. There is strong
evidence that air pollution
causes the development of
coronary heart disease,
stroke, respiratory disease
and lung cancer, and
exacerbates asthma.
In wellbeing studies from
other countries, health,
income and other
standard factors are
included in the life
satisfaction regression121
and therefore the
coefficient on changes in
air quality is understood
as the impact on
wellbeing over and above
these differences.
This is plausible - there
might be some
circumstances when
wellbeing is affected in
addition to the factors
accounted for in damage
costs – the study for PM
suggests that the change
in wellbeing only takes
place where changes in
AQ are “visible” or
detectable by smell. An
additional wellbeing
impact, beyond damage
UK: damage costs
approach
Other:
SO2: Luechinger
(2009)
PM10: Levinson
(2012)
119 Applying life satisfaction impact in LHS column and range of values of £14k (range £12k-£16k) per 1 point change in life satisfaction 120 For example, Germany: -0.08 for an increase of 10 µ g/m3 in SO2; US: ~ -0.051 for an increase of 10 μ g/m3 in PM10 121 Or in the case of PM10,, longer term impacts of air quality on health are unlikely to be relevant for the wellbeing estimation which is carried out, since the data used is based on daily fluctuations in air
quality and wellbeing – not a long enough time frame to demonstrate physical changes in health. In this study, including health in the estimation does not change the effect for the average respondent
70
costs, could be worry of
the impact of visible AQ
on health122. Overall,
the damage costs
approach is considered to
capture the main AQ
impacts and this
additional wellbeing
impact is likely to be
relevant only in specific
circumstances.
122 In a sense, this additional wellbeing impact of concern about health may ‘double count’ the health impacts which are already incorporated in the damage costs approach
71
Annex 3 - Determining cause and effect in wellbeing studies123
This is additional, background text and should be read alongside Box 6.
Distinguishing between correlation and causation
Determining whether a given factor that shows an association with wellbeing actually
contributes to the feelings that are reported can be difficult. Part of the difficulty is that much of
the evidence about wellbeing comes from regression analyses of cross-sectional data.
Investigators compare groups that display different levels of wellbeing and seek to understand
how much of the variation between them is explained by factors whose influence on wellbeing
is generally known (for example, age, gender, socioeconomic characteristics, where someone
lives) as well as by an additional factor of interest.
As an illustration, consider that in a hypothetical study the additional factor is commuting time
and that a shorter commute accounts for some of the wellbeing difference between two groups
after all other factors are accounted for. While there is a correlation between commuting time
and wellbeing, it cannot be concluded that a shorter commuting time causes wellbeing to
increase. This is because the true cause could be something unmeasured that happens to result
in a shorter commute. For instance, innate confidence - a factor not explicitly considered in this
hypothetical study - could cause people who want to work from home more often to be more
likely to ask for permission to do so. The result would be less time spent commuting and higher
wellbeing, even though reduced travel time was not itself the source of the increased happiness.
Establishing causation
Nevertheless, cross-sectional regression analyses can be critical for identifying factors that could
potentially affect wellbeing and are often the precursor for research that can help to establish
causality.
Certain econometric techniques, such as individual fixed effects and area-specific fixed effects
analyses, can make it possible to identify causal channels leading from a factor of interest to a
change in wellbeing. Among the research approaches that can help to establish causality are
longitudinal panel studies, which observe changes over long periods of time in the same people.
For instance, using the example above, if the time spent commuting fell in parallel with a rise in
wellbeing, investigators could have more confidence that commuting time, not innate
confidence, contributed to the rise, because the innate trait would be unlikely to change over
time.
Natural experiments can also help to establish causality. In these cases, something occurs that
happens to affect groups differently, such as when those born after a certain date are subject to
a different education or health policy than those born earlier. Because the groups that were
subject to different policies were formed randomly, any overall difference in wellbeing between
the groups is likely to stem from the policy changes rather than from differences in individual
characteristics.
123 Content originally published in Graham & MacLennan (2020)
72
Experiments that randomly assign people to an intervention or a control group are another tool
for helping to establish causality. They are used widely in medical research and are becoming
more common in social science. They are not silver bullets, however. While random allocation
makes it easier to identify what causes a particular change, at the same time it isolates the
effects of that intervention from real-world contextual factors that are often critical to how an
intervention works and why. Investigators who want to replicate the findings from earlier trials
often also have difficulty doing so and in retrospect it is not always possible to discern which
aspect of an intervention was most important in producing differences between a control group
and the volunteers who received an intervention (Deaton and Cartwright, 2018).
There are other approaches to create an appropriate control group or counterfactual, such as
regression discontinuity and propensity score matching.124
The Magenta Book provides guidance
on where these approaches may be most effectively used.
The desired robustness of the wellbeing evidence – and the resulting valuation – will depend
upon the purpose for which it is used. Wellbeing evidence with lower robustness125
can still
provide important scoping information at the research and longlisting stages described above.
124 See section 3.5 of the Magenta Book: https://www.gov.uk/government/publications/the-magenta-book 125 For example, from cross-sectional regressions
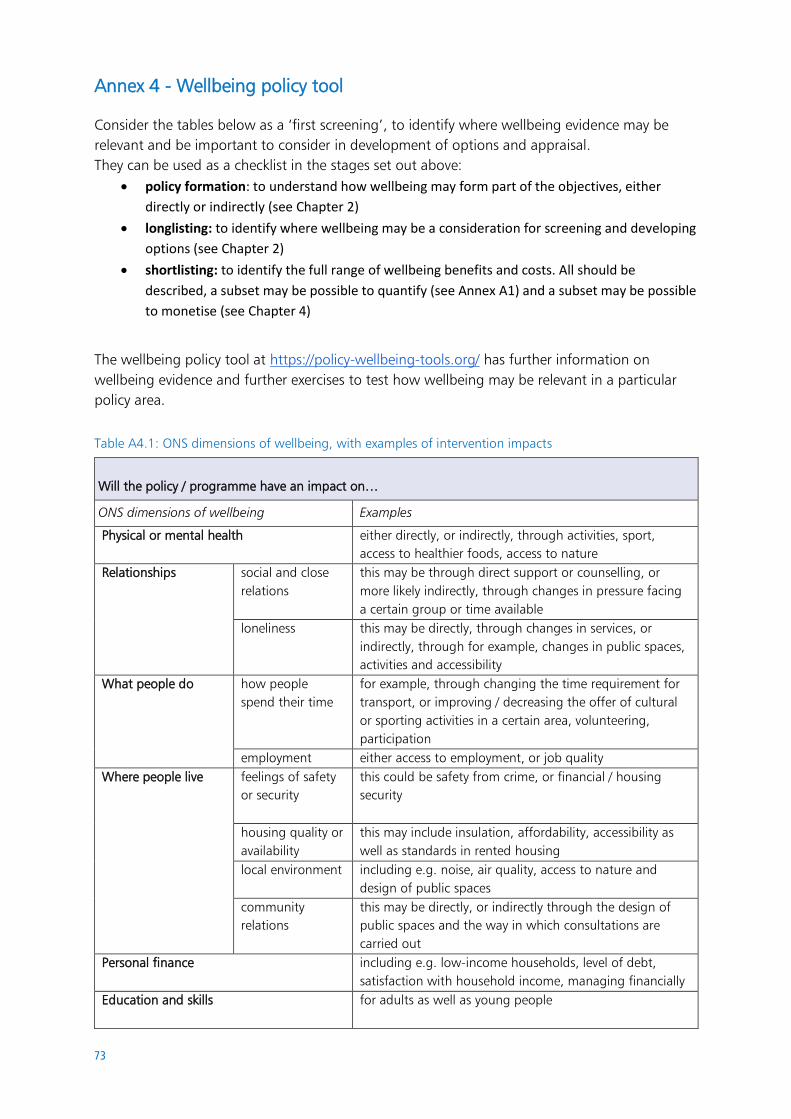
73
Annex 4 - Wellbeing policy tool
Consider the tables below as a ‘first screening’, to identify where wellbeing evidence may be
relevant and be important to consider in development of options and appraisal.
They can be used as a checklist in the stages set out above:
• policy formation: to understand how wellbeing may form part of the objectives, either
directly or indirectly (see Chapter 2)
• longlisting: to identify where wellbeing may be a consideration for screening and developing
options (see Chapter 2)
• shortlisting: to identify the full range of wellbeing benefits and costs. All should be
described, a subset may be possible to quantify (see Annex A1) and a subset may be possible
to monetise (see Chapter 4)
The wellbeing policy tool at https://policy-wellbeing-tools.org/ has further information on
wellbeing evidence and further exercises to test how wellbeing may be relevant in a particular
policy area.
Table A4.1: ONS dimensions of wellbeing, with examples of intervention impacts
Will the policy / programme have an impact on…
ONS dimensions of wellbeing Examples
Physical or mental health either directly, or indirectly, through activities, sport,
access to healthier foods, access to nature
Relationships social and close
relations
this may be through direct support or counselling, or
more likely indirectly, through changes in pressure facing
a certain group or time available
loneliness this may be directly, through changes in services, or
indirectly, through for example, changes in public spaces,
activities and accessibility
What people do
how people
spend their time
for example, through changing the time requirement for
transport, or improving / decreasing the offer of cultural
or sporting activities in a certain area, volunteering,
participation
employment either access to employment, or job quality
Where people live feelings of safety
or security
this could be safety from crime, or financial / housing
security
housing quality or
availability
this may include insulation, affordability, accessibility as
well as standards in rented housing
local environment including e.g. noise, air quality, access to nature and
design of public spaces
community
relations
this may be directly, or indirectly through the design of
public spaces and the way in which consultations are
carried out
Personal finance including e.g. low-income households, level of debt,
satisfaction with household income, managing financially
Education and skills for adults as well as young people
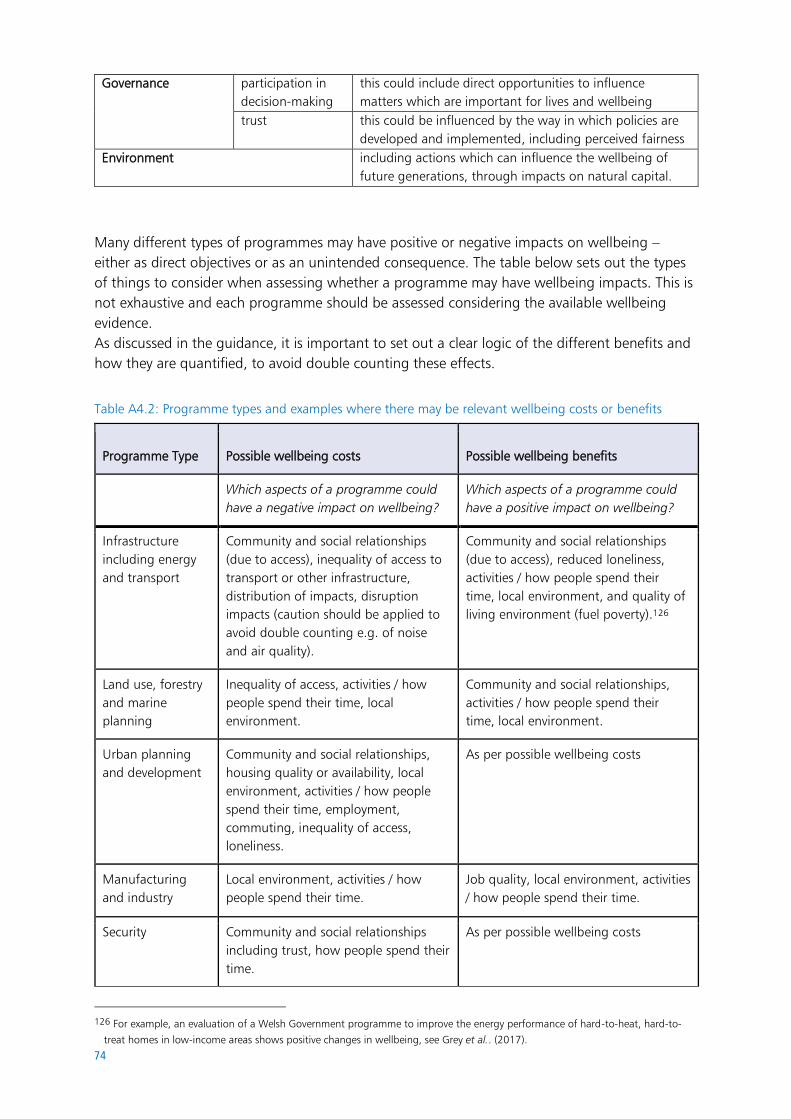
74
Governance
participation in
decision-making
this could include direct opportunities to influence
matters which are important for lives and wellbeing
trust this could be influenced by the way in which policies are
developed and implemented, including perceived fairness
Environment including actions which can influence the wellbeing of
future generations, through impacts on natural capital.
Many different types of programmes may have positive or negative impacts on wellbeing –
either as direct objectives or as an unintended consequence. The table below sets out the types
of things to consider when assessing whether a programme may have wellbeing impacts. This is
not exhaustive and each programme should be assessed considering the available wellbeing
evidence.
As discussed in the guidance, it is important to set out a clear logic of the different benefits and
how they are quantified, to avoid double counting these effects.
Table A4.2: Programme types and examples where there may be relevant wellbeing costs or benefits
Programme Type Possible wellbeing costs Possible wellbeing benefits
Which aspects of a programme could
have a negative impact on wellbeing?
Which aspects of a programme could
have a positive impact on wellbeing?
Infrastructure
including energy
and transport
Community and social relationships
(due to access), inequality of access to
transport or other infrastructure,
distribution of impacts, disruption
impacts (caution should be applied to
avoid double counting e.g. of noise
and air quality).
Community and social relationships
(due to access), reduced loneliness,
activities / how people spend their
time, local environment, and quality of
living environment (fuel poverty).126
Land use, forestry
and marine
planning
Inequality of access, activities / how
people spend their time, local
environment.
Community and social relationships,
activities / how people spend their
time, local environment.
Urban planning
and development
Community and social relationships,
housing quality or availability, local
environment, activities / how people
spend their time, employment,
commuting, inequality of access,
loneliness.
As per possible wellbeing costs
Manufacturing
and industry
Local environment, activities / how
people spend their time.
Job quality, local environment, activities
/ how people spend their time.
Security Community and social relationships
including trust, how people spend their
time.
As per possible wellbeing costs
126 For example, an evaluation of a Welsh Government programme to improve the energy performance of hard-to-heat, hard-to-
treat homes in low-income areas shows positive changes in wellbeing, see Grey et al.. (2017).

75
Education and
skills
Inequality of opportunities. Community and social relationships,
reduced loneliness, activities / how
people spend their time, employment
and job quality.
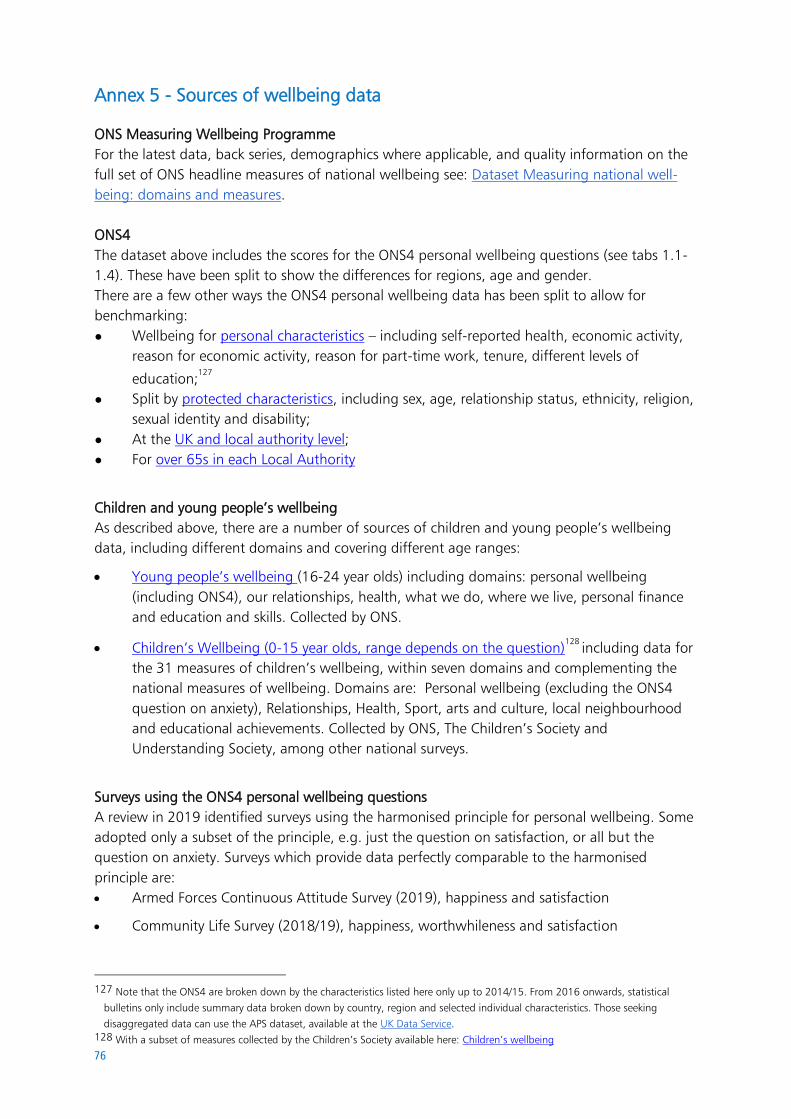
76
Annex 5 - Sources of wellbeing data
ONS Measuring Wellbeing Programme
For the latest data, back series, demographics where applicable, and quality information on the
full set of ONS headline measures of national wellbeing see: Dataset Measuring national well-
being: domains and measures.
ONS4
The dataset above includes the scores for the ONS4 personal wellbeing questions (see tabs 1.1-
1.4). These have been split to show the differences for regions, age and gender.
There are a few other ways the ONS4 personal wellbeing data has been split to allow for
benchmarking:
● Wellbeing for personal characteristics – including self-reported health, economic activity,
reason for economic activity, reason for part-time work, tenure, different levels of
education;127
● Split by protected characteristics, including sex, age, relationship status, ethnicity, religion,
sexual identity and disability;
● At the UK and local authority level;
● For over 65s in each Local Authority
Children and young people’s wellbeing
As described above, there are a number of sources of children and young people’s wellbeing
data, including different domains and covering different age ranges:
• Young people’s wellbeing (16-24 year olds) including domains: personal wellbeing
(including ONS4), our relationships, health, what we do, where we live, personal finance
and education and skills. Collected by ONS.
• Children’s Wellbeing (0-15 year olds, range depends on the question)128 including data for
the 31 measures of children’s wellbeing, within seven domains and complementing the
national measures of wellbeing. Domains are: Personal wellbeing (excluding the ONS4
question on anxiety), Relationships, Health, Sport, arts and culture, local neighbourhood
and educational achievements. Collected by ONS, The Children’s Society and
Understanding Society, among other national surveys.
Surveys using the ONS4 personal wellbeing questions
A review in 2019 identified surveys using the harmonised principle for personal wellbeing. Some
adopted only a subset of the principle, e.g. just the question on satisfaction, or all but the
question on anxiety. Surveys which provide data perfectly comparable to the harmonised
principle are:
• Armed Forces Continuous Attitude Survey (2019), happiness and satisfaction
• Community Life Survey (2018/19), happiness, worthwhileness and satisfaction
127 Note that the ONS4 are broken down by the characteristics listed here only up to 2014/15. From 2016 onwards, statistical
bulletins only include summary data broken down by country, region and selected individual characteristics. Those seeking
disaggregated data can use the APS dataset, available at the UK Data Service. 128 With a subset of measures collected by the Children’s Society available here: Children’s wellbeing
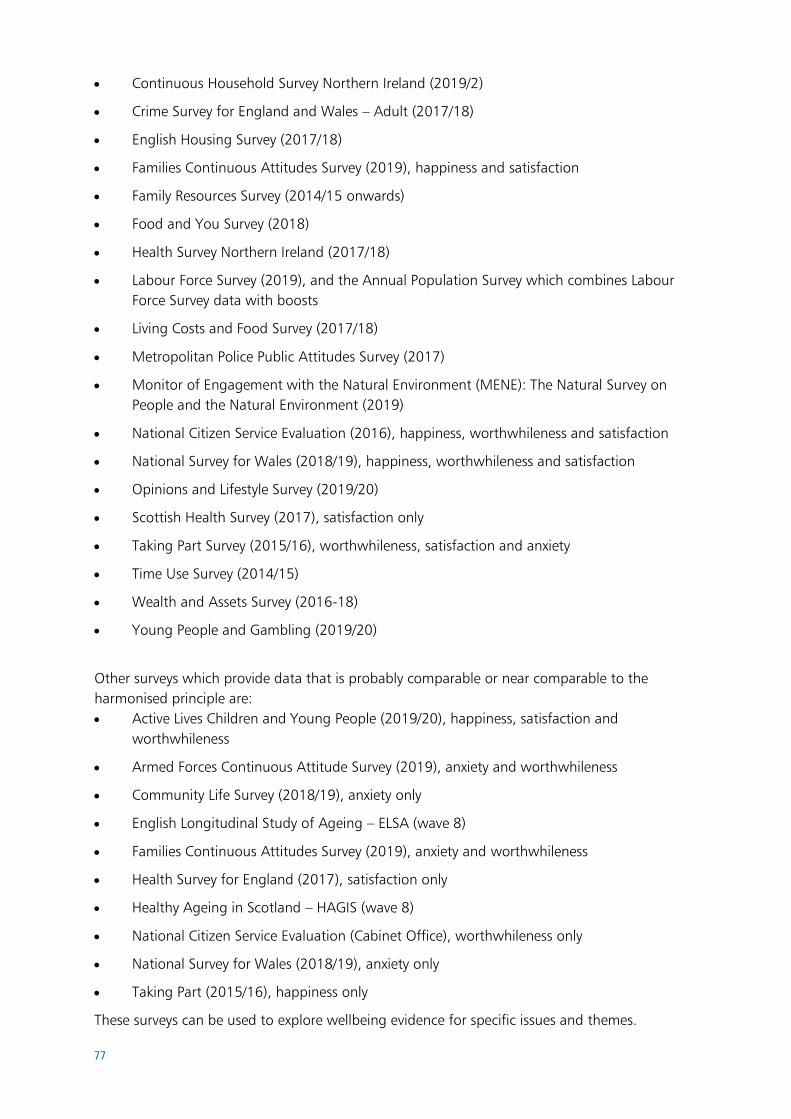
77
• Continuous Household Survey Northern Ireland (2019/2)
• Crime Survey for England and Wales – Adult (2017/18)
• English Housing Survey (2017/18)
• Families Continuous Attitudes Survey (2019), happiness and satisfaction
• Family Resources Survey (2014/15 onwards)
• Food and You Survey (2018)
• Health Survey Northern Ireland (2017/18)
• Labour Force Survey (2019), and the Annual Population Survey which combines Labour
Force Survey data with boosts
• Living Costs and Food Survey (2017/18)
• Metropolitan Police Public Attitudes Survey (2017)
• Monitor of Engagement with the Natural Environment (MENE): The Natural Survey on
People and the Natural Environment (2019)
• National Citizen Service Evaluation (2016), happiness, worthwhileness and satisfaction
• National Survey for Wales (2018/19), happiness, worthwhileness and satisfaction
• Opinions and Lifestyle Survey (2019/20)
• Scottish Health Survey (2017), satisfaction only
• Taking Part Survey (2015/16), worthwhileness, satisfaction and anxiety
• Time Use Survey (2014/15)
• Wealth and Assets Survey (2016-18)
• Young People and Gambling (2019/20)
Other surveys which provide data that is probably comparable or near comparable to the
harmonised principle are:
• Active Lives Children and Young People (2019/20), happiness, satisfaction and
worthwhileness
• Armed Forces Continuous Attitude Survey (2019), anxiety and worthwhileness
• Community Life Survey (2018/19), anxiety only
• English Longitudinal Study of Ageing – ELSA (wave 8)
• Families Continuous Attitudes Survey (2019), anxiety and worthwhileness
• Health Survey for England (2017), satisfaction only
• Healthy Ageing in Scotland – HAGIS (wave 8)
• National Citizen Service Evaluation (Cabinet Office), worthwhileness only
• National Survey for Wales (2018/19), anxiety only
• Taking Part (2015/16), happiness only
These surveys can be used to explore wellbeing evidence for specific issues and themes.

78
Useful websites for accessing data include:
• ONS, Annual Personal Wellbeing Estimates: Estimates of personal wellbeing from the
Annual Population Survey (APS): UK, year ending September 2012 and updated annually.
Quarterly updates are also available.
• ONS, Measuring national wellbeing: domains and measures
• Understanding Society: Longitudinal survey of the members of approximately 40,000
households in the United Kingdom.
Overview / Repository of evidence For a link to wellbeing evidence generated and collated by WWCW
https://whatworkswellbeing.org/resources/
79
Glossary
Affective / experience measures
Affective (or equivalently ‘experience’) measures of wellbeing focus on people’s positive and
negative emotional experiences (or affect) over a short timeframe to measure personal wellbeing
on a day-to-day basis.1
Causality
Causality is the influence by which one event, process, state or object (a cause) contributes to
the production of another event, process, state or object (an effect) where the cause is at least
partly responsible for the effect, and the effect is at least partly dependent on the cause. In
particular, in assessing policy options, we are interested in establishing whether relationships are
causal, i.e. a policy change leads to a certain change in process or state; or merely correlated,
where two changes may take place at the same time, but without one leading to the other.
Community wellbeing
Community wellbeing is the combination of social, economic, environmental, cultural and
political conditions that people and their communities say they need to fulfil their potential.
Compensating Variation and Equivalent Variation
Compensating variation(CV) is the adjustment in income that returns the consumer to their
original utility level after an economic change has occurred. By comparison, Equivalent
variation(EV) is the adjustment in income that changes the consumer’s utility equal to the level
that would occur if the event had happened.
As an illustration, when assessing the impact of a negative economic change, such as a rise in
prices, CV is the minimum increase in income the consumer needs for their utility to be
unchanged after the change. EV would be the amount of income that would be taken away to
lower the consumer’s utility to the level that would happen if the change occurred.
Contingent Valuation
Contingent valuation is a survey-based economic technique for the valuation of non-market
resources. While these resources do give people utility, certain aspects of them do not have a
market price as they are not directly sold – for example, people receive benefit from a beautiful
view of a mountain, but it would be tough to value using price-based models. Contingent
valuation surveys are one technique which is used to measure these aspects. Contingent
valuation is often referred to as a 'stated preference' model, in contrast to a price-based revealed
preference model.
Decision utility
A prediction of the benefit we are likely to get out of something, often measured based on what
people are willing to pay or accept. When used in cost benefit analysis, an underlying
assumption is that what people are willing to pay or accept in advance reflects the benefits they
get.
1https://www.ons.gov.uk/peoplepopulationandcommunity/wellbeing/methodologies/personalwellbeingfrequentlyaskedquestions#w
hat-is-meant-by-evaluative-eudemonic-and-affective-well-being
80
Eudemonic measures
Eudemonic measures of wellbeing, sometimes referred to as the psychological or functioning or
flourishing approach, draws upon self-determination theory and measure such things as
people’s sense of meaning and purpose in life, connections with family and friends, a sense of
control and whether they feel part of something bigger than themselves.2
Evaluative measures
Evaluative measures of wellbeing ask individuals to step back and reflect on their life and make a
cognitive assessment of how their life is going overall, or on specific aspects of their life. This is
commonly measured by a question which asks how satisfied we are with our life overall, as in
the ‘ONS4’3.
Experience utility
The benefits experienced, which may differ from predictions of the benefits which may be
received (‘utility mis-prediction’).
Regression
Regression analysis is a set of statistical processes for estimating the relationships between a
dependent variable (often called the 'outcome variable') and one or more independent variables.
Regression Analysis is used to understand economic relationships through quantitative
estimation. Regression is used to infer causal relationships, estimating the change in the
dependent variable that is due to movement in other independent variables. Additionally,
regression is often used as a method for forecasting, using the relationship between the
dependent variable and the independents.
Social capital
Social capital describes the extent and nature of our connections with others and the collective
attitudes and behaviours between people that support a well-functioning, close-knit society.
Wellbeing measures
See Annex A1: Measuring Wellbeing for an overview of wellbeing measures.
Willingness-to-accept (WTA)
Willingness to accept (WTA) is the minimum monetary amount that а person is willing to accept
to sell a good or service, or to bear a negative externality. WTA is often used within Contingent
Valuation techniques with respondents asked what they would be willing to accept for different
hypothetical scenarios.
Willingness-to-pay (WTP)
Willingness to pay (WTP) is the maximum amount of money a consumer (a buyer) is willing to
sacrifice to purchase a good/service or avoid something undesirable. WTP is often used within
Contingent Valuation techniques with respondents asked what they would be willing to pay for
different hypothetical scenarios.
2 Ibid 3 Ibid
81
Bibliography
Alcock, I., White, M.P., Wheeler, B.W., Fleming, L.E., and Depledge, M.H. (2014). Longitudinal effects on mental health of moving to greener and less green urban areas. Environmental Science and Technology, 48, 1247-1255.
Binder, M., & Freytag, A. (2013). Volunteering, subjective wellbeing and public policy. Journal of
Economic Psychology, 34, 97–119.
Brazier, J., Mukuria, C., Peasgood, T. & Rowen, D. (2016). An empirical comparison of well-
being measures used in UK. EEPRU report funded by the Department of Health.
Butler, A. , Chapman, J. , Forman, E. & Beck, A. (2006). The empirical status of cognitive-
behavioural therapy: A review of metaanalyses. Clinical Psychological Review, 26(1), 17−31.
Clark, A., Layard, R., Flèche, S., Ward, G., & Powdthavee, N. (2018). The origins of happiness:
The science of wellbeing over the life course. Princeton, NJ: Princeton University Press.
Clark, A., & Oswald, A. (1994). Unhappiness and Unemployment. Economic
Journal, 104(424),648-59.
Clark, A., & Oswald, A. (1996). Satisfaction and comparison income. Journal of Public
Economics, 61(3), 359-381. https://doi.org/10.1016/0047-2727(95)01564-7
Clark, A., & Oswald, A. (2002). A simple statistical method for measuring how life events affect
happiness. International Journal of Epidemiology, 31, 1139–1144.
Daniels, K., Gedikli, C., Watson, D., Semkina, A., & Vaughn, O. (2017). Job design, employment
practices and well-being: a systematic review of intervention studies. Ergonomics, 60(9), 1177-
1196. https://doi.org/10.1080/00140139.2017.1303085 and Whatworkswellbeing.org April
2017 briefing, Job Quality and Wellbeing - What Works Wellbeing
Deaton, A., & Cartwright, N. (2018). Understanding and misunderstanding randomized control
trials. Social Science & Medicine, 210, 2–21. https://doi.org/10.1016/j.socscimed.2017.12.005
De Neve, J.-E., Clark, A., Krekel, C., Layard, R. & O’Donnell, G. (2020). Taking a wellbeing years
approach to policy choice. BMJ, 371 https://www.bmj.com/content/371/bmj.m3853
De Neve, J.-E., Diener, E., Tay, L., & Xuereb, C. (2013). The objective benefits of subjective
wellbeing. In: Helliwell, J. , Layard, R. & Sachs, J. (Eds.). World Happiness Report 2013. New
York, NY: United Nations Sustainable Development Solutions Network, 54–79.
De Neve, J-E., and Ward, G. (2017). Happiness at work. In Helliwell, J.F., Layard, R., and Sachs, J. (eds), World Happiness Report. New York: Sustainable Development Solutions Network. https://s3.amazonaws.com/happiness-report/2017/HR17-Ch6_wAppendix.pdf Department for Communities and Local Government (2010). Valuing the Benefits of Regeneration. Economics paper 7, Volume I.
82
Diener, E., & Lucas, R. (1999). Personality and subjective wellbeing. In: Kahneman, D. , Diener, E. , & Schwarz, N. (Eds.). Wellbeing: The foundations of a hedonic psychology. New York, NY: Russell Sage Foundation, 213–229. Di Tella, R., & MacCulloch, R. (2010). Happiness adaptation to income and to status in an
individual panel. Journal of Economic Behavior & Organization, 76, 834–852.
Di Tella, R., & MacCulloch, R. (2010). Happiness Adaptation to Income Beyond “Basic Needs”.
In: Diener, E., Kahneman, D. &Helliwell, J. (Eds.). International Differences in Well-Being. Oxford
University Press, Chapter 8.
Di Tella, R., MacCulloch, R. , & Oswald, A. (2001). Preferences over inflation and
unemployment: Evidence from surveys of happiness. The American Economic Review, 91, 335-
341. https://doi.org/10.1257/aer.91.1.335
Dolan, P. (2014). Happiness by design: Finding pleasure and purpose in everyday life. London,
United Kingdom: Penguin.
Dolan, P., & Fujiwara, D. (2016). Happiness-Based Policy Analysis. In: The Oxford Handbook of
Well-Being and Public Policy. New York, NY: Oxford University Press, 286–317.
Dolan, P. and Fujiwara, D. (2012) Valuing adult learning: comparing wellbeing valuation and
contingent valuation Department for Business, Innovation and Skills research paper number 85
Dolan, P. & Kahneman, D. (2008). Interpretations of Utility and Their Implications for the
Valuation of Health. The Economic Journal, 118 (525), 215–234. https://doi.org/10.1111/j.1468-
0297.2007.02110.x
Dolan P. & Kudrna L. (2016). Sentimental Hedonism: Pleasure, Purpose, and Public Policy. In:
Vittersø, J. (Eds.). Handbook of Eudaimonic Well-Being. International Handbooks of Quality-of-
Life. Springer, Cham. https://doi.org/10.1007/978-3-319-42445-3_29
Dolan, P., Metcalfe, R., (2008). Comparing willingness to pay and subjective wellbeing in the context of non-market goods. Centre for Economic Performance (London School of Economics) Discussion paper 890
Dunn. E., Aknin, L., Norton, M. (2014). Prosocial Spending and Happiness: Using Money to
Benefit Others Pays Off. Current Directions in Psychological Science, 23(1), 41-47.
https://doi.org/10.1177/0963721413512503
Easterlin, R. (1974). Does economic growth improve the human lot? Some empirical evidence.
In: David, P. & Reder, M. (Eds.). Nations and households in economic growth: Essays in honor of
Moses Abramovitz. New York, NY: Academic Press, 89-125.
Frijters, P. (2021). Measuring Subjective Wellbeing. In: Zimmerman, F. (Ed.). The Handbook of
Labor, Human Resources and Population Economic. Springer.
Frijters, P., Clark, A., Krekel, C. & Layard, R. (2020). A Happy Choice: Wellbeing as the Goal of
Government. Behavioural Public Policy, 4(2), 126-165. https://doi.org/10.1017/bpp.2019.39
83
Frijters, P., Haisken-DeNew, J. & Shields, M. (2004). Money does matter! Evidence from
increasing real income and life satisfaction in East Germany following reunification. American
Economic Review, 94(3), 730-740.
Frijters, P. & Krekel, C. (2021). Handbook of Wellbeing Policy for the UK. Oxford University Press
Fujita, F. & Diener, E. (2005). Life satisfaction set point: Stability and change. Journal of
Personality and Social Psychology, 88, 158–164.
Fujiwara, D. (2021). Incorporating Life Satisfaction in to Discrete Choice Experiments to Estimate
Wellbeing Values for Non-Market Goods. Simetrica-Jacobs Research Paper July 2021.
Fujiwara, D. (2013). A General Method for Valuing Non-market Goods Using Wellbeing Data:
Three-Stage Wellbeing Valuation. CEP Discussion Paper No. 1233.
Fujiwara, D. & Campbell, R. (2011). Valuation Techniques for Social Cost-Benefit Analysis: Stated
Preference, Revealed Preference and Subjective Well-Being Approaches. A Discussion of the
Current Issues. HM Treasury and Department for Work and Pensions.
Fujiwara, D. Gramatki, I. and Keohane, K (2020). Measuring the wellbeing and health impacts of
sewage odour. Chapter 12 in Handbook on Wellbeing, Happiness and the Environment, Edward
Elgar Publishing pp. 225-244
Fujiwara, D., Houston, D., Keohane, K., Gramatki, J. & Maxwell, C. (2018). Valuation of the
impact of roadworks and flooding using the Wellbeing Valuation method. Report presented to
Anglian Water.
Gedikli, C., Bryan, M., Connolly, S., Daniels, K., Watson, D., Semkina A., and Vaughn, O.,
(2017). Worklessness, exits from worklessness and wellbeing: a systematic review.
Whatworkswellbeing.org March 2017 briefing, Unemployment, (Re)employment and Wellbeing
- What Works Wellbeing
Gedikli, C., Bryan, M., Connolly, S., Watson, D., Etuknwa A., and Vaughn, O., (2017), The impact of wellbeing upon transitions into and out of work: a systematic review. Whatworkswellbeing.org March 2018 briefing, Finding and Keeping Work: impact of low wellbeing - What Works Wellbeing
Gilbert, D. , Pinel, E. , Wilson, T. , Blumberg, S. & Wheatley, T. (1998). Immune neglect: A
source of durability bias in affective forecasting. Journal of Pers. Soc. Psychol., 75(3), 617−638.
Graham, C. (2011). Adaptation amidst Prosperity and Adversity: Insights from Happiness Studies
from around the World. World Bank Research Observer, 26, 105-137. DOI: 10.2307/41261424.
Graham, C., Eggers, A. & Sukhtankar, S. (2004). Does happiness pay? An exploration based on
panel data from Russia. Journal of Economic Behavior & Organization, 55, 319–342.
Graham, C. & MacLennan, S. (2020). Policy insights from the new science of well-being.
Behavioral Science & Policy, 6(1), 1–20.
Grey, C., Jiang, S., Nascimento, C.,Rodgers, S., Johnson, R., Lyons, R. & Poortinga, W. (2017).
The short-term health and psychological impacts of domestic energy efficiency investments in
84
low-income areas: a controlled before and after study. BMC Public Health, 17, 140.
https://doi.org/10.1186/s12889-017-4075-4 .
Hanslmaier, M. (2013). Crime, fear and subjective wellbeing: How victimization and street crime affect fear and life satisfaction. European Journal of Criminology, 10, 515-533.
Hartig, T., & Mitchell, R., et al. (2014). Nature and health. Annual Review of Public Health, 35,
207-228
Helliwell, J. , & Wang, S. (2013). World Happiness: Trends, Explanations and Distribution. In:
Helliwell, J., Layard, R., & Sachs, J. (Eds.). World Happiness Report 2013.New York, NY: UN
Sustainable Development Solutions Network.
Helliwell, J. F., & Wang, S. (2011). Trust and wellbeing. International Journal of Wellbeing, 1(1),42-78. doi:10.5502/ijw.v1i1.9
Hendriks, M., Burger, M., Ray, J. & Esipova, N. (2018). Do International Migrants Increase Their
Happiness and That of Their Families by Migrating? 2018 World Happiness Report Chapter 3.
Heritage Lottery Fund and BOP consulting (2011). Assessment of the social impact of
volunteering in HLF-funded projects, discussed in
https://www.whatworkswellbeing.org/product/drivers-of-wellbeing-inequality/
HM Treasury (2020). The Green Book - Central Government Guidance on Appraisal and
Evaluation. HM Treasury.
Hollander-Blumoff, R. & Tyler, T. (2008). Procedural justice in negotiation: procedural fairness,
outcome acceptance, and integrative potential. Law Soc Inq, 33(2), 473–500
Jahoda, M (1982). Employment and Unemployment: A Socio-Psychological Analysis. Cambridge: Cambridge University Press. Johnston, D.W., Shields, M.A. and Suziedelyte, A. (2017), Victimisation, wellbeing and compensation: Using panel data to estimate the costs of violent crime. Economic Journal, 128, 1545-1569. Krekel, C., Kolbe, J., and Wuestemann, H. (2016). The greener, the happier? The effect of urban land use on residential wellbeing. Ecological Economics, 121, 117-127. Krekel, C. & MacKerron, G. (2020). How Environmental Quality Affects Our Happiness. 2020 World Happiness Report Chapter 5.https://worldhappiness.report/ed/2020/how-environmental-quality-affects-our-happiness/#fn16 Lawton, R.N. and Fujiwara, D., (2016) Living with aircraft noise: Airport proximity, aviation noise and subjective wellbeing in England. Transportation Research Part D: Transport and Environment, 42, pp.104-118. Lawton, R. N., Gramatki, L., Watt, W., and Fujiwara, D. (2020) Happy Days: Does volunteering make us happier or is it that happier people volunteer, Journal of Happiness Studies: An Interdisciplinary Forum on Subjective Well-Being, https://doi.org/10.1007/s10902-020-00242-8 Levinson, A. (2012). Valuing public goods using happiness data: The case of air quality. Journal
of Public Economics, 96, 869-880.
85
Layard, R., Dolan, P. & Metcalfe, R. (2011). Measuring Subjective Wellbeing for Public Policy: Recommendations on Measures. Report for the ONS. Centre for Economic Performance special papers (CEPSP23). London, United Kingdom: Centre for Economic Performance, London School of Economics and Political Science. Layard, R., Nickell, S., & Mayraz, G. (2008). The marginal utility of income. Journal of Public
Economics, 92, 1846–1857.
Lind, A. & Tyler,T. (1988). The social psychology of procedural fairness. Plenum Press, New York.
Lindqvist, E., Östling, R. & Cesarini, D. (2020). Long-run effects of lottery wealth on
psychological well-being. The Review of Economic Studies, 87(6), 2703-2726.
Longhi, S., Nandi, A., Bryan, M., Connolly, S., Gedikli, C. (2018). Education To Employment: The
Role of Wellbeing. What Works Centre for Wellbeing briefing. Education To Employment: The
Role Of Wellbeing - What Works Wellbeing
Lucas, R. (2005). Time does not heal all wounds: A longitudinal study of reaction and adaptation
to divorce. Psychol. Sci., 16(12), 945−950.
Lucas, R., Clark, A., Georgellis, Y. & Diener, E. (2003). Reexamining adaptation and the set point
model of happiness: Reactions to changes in marital status. J. Pers. Soc. Psychol., 84(3),
527−539.
Luechinger, S. (2009). Valuing Air Quality Using the Life Satisfaction Approach. Economic Journal, 119, 482-515. 11. Luttmer, E. (2005). Neighbors as Negatives: Relative Earnings and Well-Being. Quarterly Journal of Economics, 120, 963-1002.
Marmot, M., Smith, G., Stansfeld, S., Patel, C., North, F., Head, J., White, I., Brunner, E. &
Feeney A. (1991). Health inequalities among British civil servants: the Whitehall II study.
Lancet,337(8754), 1387-93. https://doi.org/10.1016/0140-6736(91)93068-K .
Martin, F., Camfield, L. & Ruta, D. (2010). The Global Person Generated Index. In: Preedy, V. &
Watson, R. (Eds.). Handbook of disease burdens and Quality of Life measures. New York, NY:
Springer, 59-72.
Mervin, M., & Frijters, P. (2014). Is shared misery double misery? Social Science and Medicine,
107, 68–77.
Mitchell, R. and F. Popham. (2008). Effect of exposure to natural environment on health
inequalities: an observational population study. The Lancet, 372(9650), 1655-1660
Office for National Statistics. (2018). 2014-16 Annual Population Survey.
https://www.ons.gov.uk/peoplepopulationandcommunity/wellbeing/articles/understandingwellb
einginequalitieswhohasthepoorestpersonalwellbeing/2018-07-11 [Accessed June 2021]
86
Office for National Statistics. (2020). Office for National Statistics Annual personal wellbeing
estimates.
https://www.ons.gov.uk/peoplepopulationandcommunity/wellbeing/datasets/headlineestimateso
fpersonalwellbeing [Accessed November 2020]
Oswald, O., Proto, E. & Sgroi, D. (2015). ‘Happiness and Productivity’. Journal of Labour
Economics, 33(4),789-822.
Peasgood, T., Mukuria, C., Karimi, M. & Brazier, J. (2018). Eliciting preference weights for life
satisfaction: A feasibility study. CEP Discussion Series.
Peytrignet, S., Garforth-Bles,S. Keohane. K. (2020) Loneliness monetisation report. Analysis for the Department for Digital, Culture, Media & Sport
Riis, J., Loewenstein, G., Baron, J., Jepson, C., Fagerlin, C. & Ubel, P. (2005). Ignorance of
hedonic adaptation to hemodialysis: A study using ecological momentary assessment. J. Exp.
Psychol. Gen., 134(1), 3−9.
Salomon, J. A. et al. (2015). ‘Disability weights for the Global Burden of Disease 2013 study’.
The Lancet Global Health, 3(11),712-723.
Simetrica-Jacobs (2020) Aviation Noise & Subjective Wellbeing, Report for DfT (publication pending)
Stuart, J. et al. (2020). ‘The Impacts of Volunteering on the Subjective Wellbeing of Volunteers:
A Rapid Evidence Assessment’. Whatworkswellbeing.org October 2020 Technical Report.
https://whatworkswellbeing.org/resources/volunteer-wellbeing-what-works-and-who-benefits/
Tregaskis, O. & Nandi, A. (2018). Adult education and life satisfaction. Whatworkswellbeing.org
December 2018 briefing. https://whatworkswellbeing.org/resources/adult-learning-and-life-
satisfaction/
Veenhoven, R. (2010). ‘How Universal is Happiness?’. In: Diener, E., Helliwell, J., and Kahneman,
D. (Eds.). International Differences in Well-Being. Oxford: Oxford University Press.
Weinstein, N. (1982). Community noise problems: Evidence against adaptation. Journal of
Environmental Psychology, 2, 87–97.
White, M.P., Alcock, I., Wheeler, B.W., and Depledge, M.H. (2013). "Would you be happier living in a greener urban area? A fixed-effects analysis of panel data." Psychological Science, 24, 920-928.
Winkelmann, L. & Winkelmann, R. (2003). Why are the Unemployed so Unhappy? Evidence
from Panel Data. Economica, 65(257), 1-15.
87
HM Treasury contacts
This document can be downloaded from www.gov.uk
If you require this information in an alternative format or have general enquiries about
HM Treasury and its work, contact:
Correspondence Team
HM Treasury
1 Horse Guards Road
London
SW1A 2HQ
Tel: 020 7270 5000
Email: [email protected]
Recommended