Embed Size (px)
Citation preview
26 | P a g e
Section 4 DETAILED GUIDANCE ON APPRAISAL TECHNIQUES
This section seeks to give detailed explanations of the types of techniques that should be applied when carrying out a detailed appraisal. The detail of how each of the types of financial, economic and risk analysis are carried out is presented below.
4.1 General Financial Appraisal General Financial Appraisal is a method used to evaluate the viability of a project by assessing the value of net cash flows that result from its implementation. Financial Analysis looks at the impact of the project on the finances of the Sponsoring Agency while the Exchequer Analysis is concerned with the impact of the project on the Exchequer.
As previously stated, there are at least two types of financial analysis which must be carried out for projects over €20m:
A financial analysis from the perspective of the Sponsoring Agency
An Exchequer cashflow analysis
4.1.1 What is Financial Analysis? A financial appraisal is concerned with the financial impact of the project on the finances of the Sponsoring Agency. Financial analysis focuses on cash flows as opposed to economic flows and in particular considers sustainability and profitability. Some of the general objectives associated with this type of analysis are:
Identifying and estimating financial cash flows;
Assessing financial suitability – sustainability occurs if the net flow of cumulated generated cash flow is positive for all years considered;
Calculating performance indicators (e.g. Net Present Value, Internal Rate of Return); and
Assessing funding sources for the project.
4.1.2 When to carry out a Financial Analysis? A financial analysis incorporating an analysis of cash flows, even at a simple level, should be carried out for all spending proposals regardless of scale because an understanding and quantification of financial flows is critical to the approval decision. The level of detail involved should be commensurate with the scale of expenditure.
The financial analysis should be carried out as one of the first steps in the overall appraisal stage because an understanding of the pattern of the cashflows is a critical building block for the overall business case as well as the CBA.
4.1.3 Main Steps in carrying out a Financial Analysis The main steps for carrying out a financial analysis are set out below:
Step 1: Identify the time horizon
Identify the time horizon (often the same as a cost-benefit analysis time horizon) based on the useful economic life of the asset.
27 | P a g e
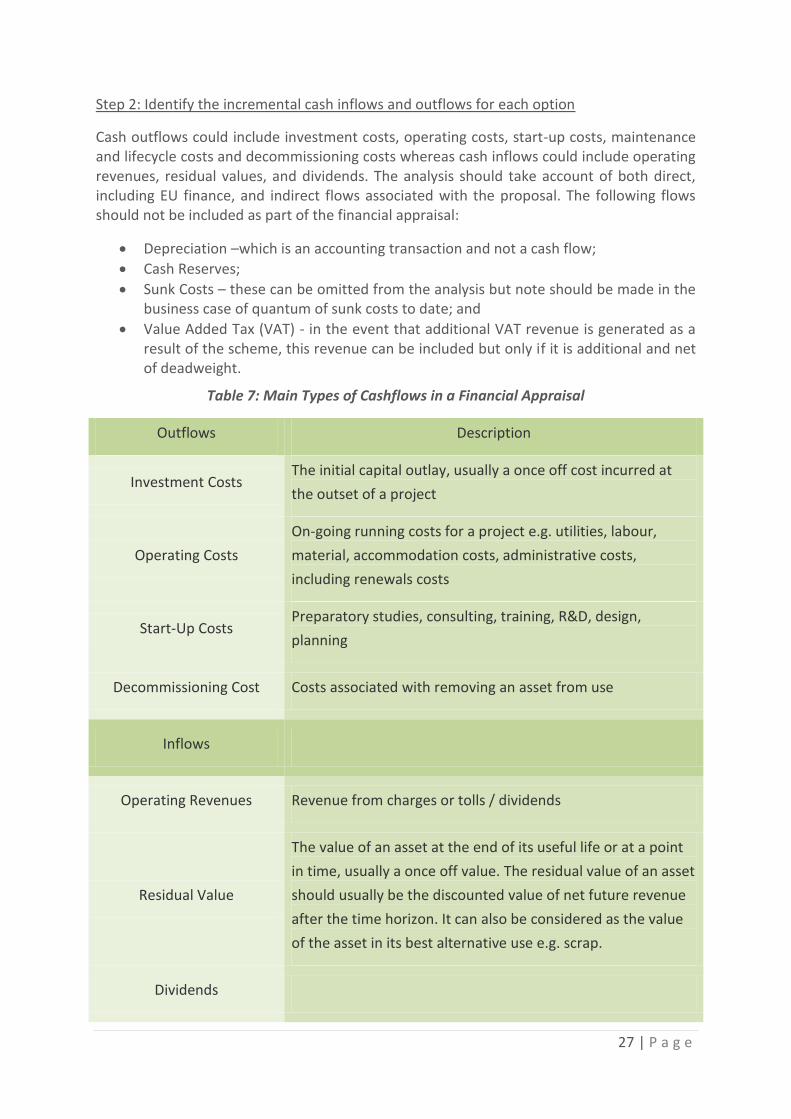
Step 2: Identify the incremental cash inflows and outflows for each option
Cash outflows could include investment costs, operating costs, start-up costs, maintenance and lifecycle costs and decommissioning costs whereas cash inflows could include operating revenues, residual values, and dividends. The analysis should take account of both direct, including EU finance, and indirect flows associated with the proposal. The following flows should not be included as part of the financial appraisal:
Depreciation –which is an accounting transaction and not a cash flow;
Cash Reserves;
Sunk Costs – these can be omitted from the analysis but note should be made in the business case of quantum of sunk costs to date; and
Value Added Tax (VAT) - in the event that additional VAT revenue is generated as a result of the scheme, this revenue can be included but only if it is additional and net of deadweight.
Table 7: Main Types of Cashflows in a Financial Appraisal
Outflows Description
Investment Costs The initial capital outlay, usually a once off cost incurred at
the outset of a project
Operating Costs
On-going running costs for a project e.g. utilities, labour,
material, accommodation costs, administrative costs,
including renewals costs
Start-Up Costs Preparatory studies, consulting, training, R&D, design,
planning
Decommissioning Cost Costs associated with removing an asset from use
Inflows
Operating Revenues Revenue from charges or tolls / dividends
Residual Value
The value of an asset at the end of its useful life or at a point
in time, usually a once off value. The residual value of an asset
should usually be the discounted value of net future revenue
after the time horizon. It can also be considered as the value
of the asset in its best alternative use e.g. scrap.
Dividends
28 | P a g e
Step 3: Quantify the Costs
This process often requires accountants, economists, engineers and other specialists to accurately estimate the costs. Estimates should be as realistic as possible and presented in constant or current prices, allowing for sector specific price changes.
Step 4: Identify the pattern and discount the cash flows
The real discount rate for economic appraisals is set by the Department of Public Expenditure and Reform and is available in the Annex to this document or alternatively it is available in Section E of the Public Spending Code.
Step 5: Sensitivity Analysis
Carry out sensitivity analysis of the most critical cost and revenue variables.
Step 6: Reporting
The results of the analysis should be reported in General Financial Analysis tables highlighting any areas that are likely to cause cash flow or financial difficulty at any stage during the projects/programme life cycle.
As per the requirements of the Public Spending Code, appraisers should seek to use values in real terms and numbers in the first instance.
4.1.4 General Financial Appraisal: Exchequer Analysis The Exchequer flows appraisal is concerned with the financial impact of the project on the Exchequer. It is thus concerned with the implications of the project for capital and maintenance spending, public transport subsidies and taxation. For projects or programmes exceeding the capital or current thresholds of €20 million or €5 million respectively, an exchequer appraisal should be carried out. This is a more detailed financial appraisal. In the context of transport projects, an Exchequer Analysis should follow the steps above for financial analysis and include the following elements:
Capital costs of the project to the public sector (net of VAT);
Change in operating costs for State or State-supported undertakings;
Change in user charges in excess of changes in user charge collection costs (where these user revenues accrue to the public sector);
Change in development levies in excess of changes in costs of collecting such levies;
Changes in excise duties on fuels in excess of changes in the costs of collection; and
Changes in VAT receipts on fuels.
In the case of public transport, the second and third items listed above, when combined, indicate the impact of the project on operating subsidies.
4.1.5 General Financial Appraisal: Analysis of sources of funds An analysis of sources of funding should outline each of the different types of financial funding and instruments that are used to financially support the project. A summary of the sources of finance for the preferred option(s) should be outlined. The analysis should focus on funding over the duration of the project and programme. When finalising this analysis it is important that the percentage of public funding for the project is clearly identified and the exchequer budgetary impacts clearly outlined.
29 | P a g e
4.2 Economic Appraisal
This section gives detailed guidance of economic appraisal in two broad areas; quantitative and qualitative. A detailed explanation of the acceptable quantitative appraisal tools is provided below. These include: Cost-Benefit Analysis, Cost-Effective Analysis and Multi-Criteria Analysis.
4.2.1 Economic Appraisal: Cost-Benefit Analysis
What is a Cost-Benefit Analysis?
Cost-benefit analysis is the main technique for public sector project appraisal. It quantifies in monetary terms, the social costs and benefits of particular projects or programmes to all affected groups. The basic rationale behind cost-benefit analysis is the idea of maximising economic efficiency for the spending of public money which has competing alternative uses. At the centre of cost benefit analysis is the concept of opportunity cost which gives the real cost of withdrawing resources from other uses.
When to use a Cost-Benefit Analysis?
Cost-benefit analysis is generally used before projects are undertaken (ex-ante) but can also be used to evaluate the costs and benefits of particular projects after the money has been invested (ex-post). As cost-benefit analysis values costs and benefits using a common monetary value, it can help with the ranking of different alternatives for projects within sectors, once the public money has been sectorally distributed. The results of a cost-benefit analysis should at a minimum be presented in the Economic Efficiency of the Transport System Table and the Summary of Costs and Benefits Table. Templates and explanations for each of these tables are contained in Section 7.
What information is needed to carry out a Cost-Benefit Analysis?
Generally the information needed to carry out a cost-benefit analysis includes:
A monetary value of each benefit/cost (i.e. value of time, air quality, collisions, etc.);
The monetary value of all discounted costs and the profile of costs over the lifetime of the programme;
o Inclusive of both capital costs (i.e. construction costs, capital maintenance and renewals) and current costs (i.e. maintenance and operation); and
o The monetary value of discounted benefits (including residual values) and the profile of benefits over the lifetime of the programme.
Steps involved in carrying out a Cost-Benefit Analysis
The CBA is one part of the overall appraisal process for a programme, project or scheme. Document B01 of the Public Spending Code sets out the standard appraisal steps for a project or programme. These are:
(i) Define the objective
30 | P a g e
(ii) Explore options taking account of constraints (see pre-appraisal)1
(iii) Quantify the costs of viable options and specify sources of funding
(iv) Analyse the main options
(v) Identify the risks associated with each viable option
(vi) Decide on a preferred option
(vii) Make a recommendation to the Sanctioning Authority
This section focuses mainly on steps (iii) to (vii) which comprise the key tasks in a CBA. Prior to undertaking the CBA, the objective of the proposals should be clearly outlined and they should be Specific, Measurable, Accurate, Realistic and Timely (SMART), i.e. what needs are to be met and what is the planned scale on which those needs will be met and measured. The realistic alternative ways in which the objective can be achieved should also be listed. This should include the option of doing nothing or a consideration of whether an objective could be achieved by ways other than expenditure by the State. In general, at least 3 realistic Do-Something options should be included at the detailed appraisal stage.
Step iii: Quantify the Costs of Viable Options and Specify Sources of Funding
A comprehensive approach should be taken to ensure that all relevant costs and benefits are included. It can be useful to consider the different costs and benefits arising by considering the impacts on different stakeholders affected by the project being appraised.
The costs of a project should reflect the best alternative uses to which resources can be put or opportunity costs. Opportunity costs should usually be reflected in market prices. It can be useful to categorise the various types of incremental costs which arise in a project. One approach to identifying costs involves the distinction between fixed, variable and semi variable costs:
Fixed costs which remain static over a given level of activity or output e.g. rent.
Variable costs which change in line with changes to the volume of activity or output e.g. operating costs.
Semi variable costs which can include a fixed and a variable component e.g. maintenance costs.
It is also important that costs are calculated on a marginal instead of an average basis, i.e. the costs which apply specifically to the incremental project outputs. For example, the marginal cost for road maintenance on a particular stretch of road included in a project proposal may be lower than the average costs applying to an entire route. Capital and operating costs should be included in the analysis. Capital costs will tend to arise in the earlier time periods whereas operating costs arise on an on-going basis throughout the project.
In respect of each chosen alternative, the following should be provided:
1 Development and sifting of realistic options should be clearly documented and form part of the business case
process.
31 | P a g e
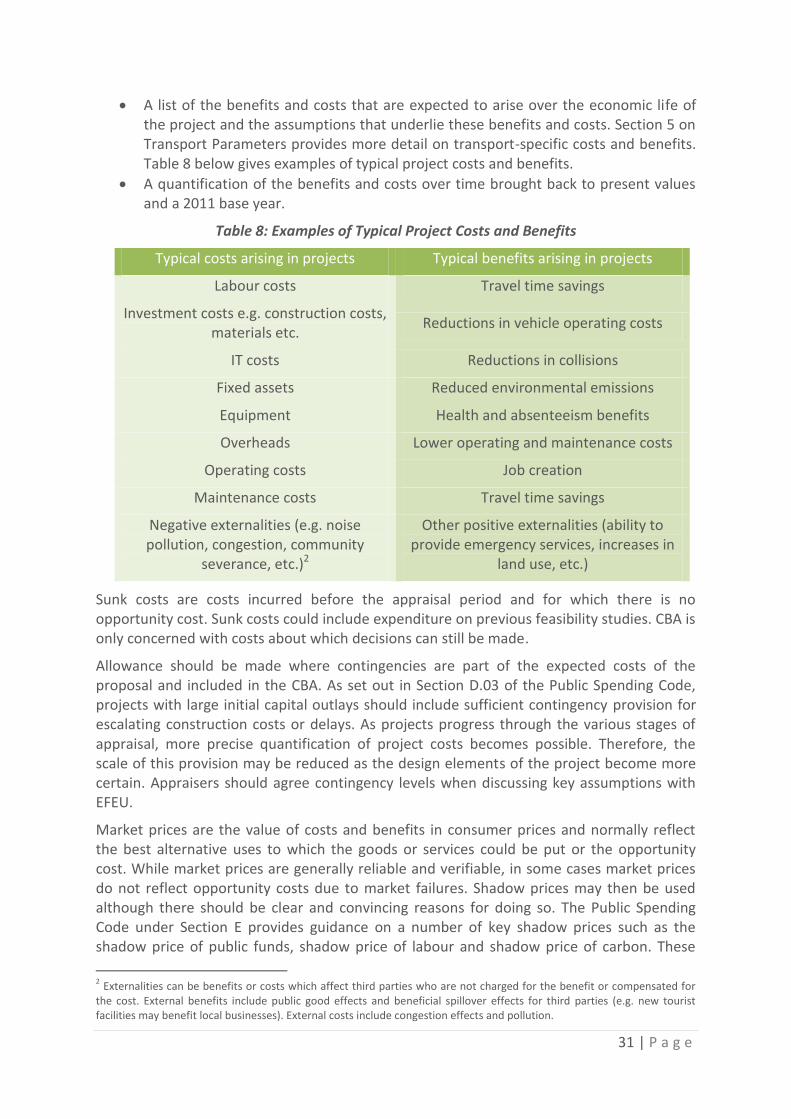
A list of the benefits and costs that are expected to arise over the economic life of the project and the assumptions that underlie these benefits and costs. Section 5 on Transport Parameters provides more detail on transport-specific costs and benefits. Table 8 below gives examples of typical project costs and benefits.
A quantification of the benefits and costs over time brought back to present values and a 2011 base year.
Table 8: Examples of Typical Project Costs and Benefits
Typical costs arising in projects Typical benefits arising in projects
Labour costs Travel time savings
Investment costs e.g. construction costs, materials etc.
Reductions in vehicle operating costs
IT costs Reductions in collisions
Fixed assets Reduced environmental emissions
Equipment Health and absenteeism benefits
Overheads Lower operating and maintenance costs
Operating costs Job creation
Maintenance costs Travel time savings
Negative externalities (e.g. noise pollution, congestion, community
severance, etc.)2
Other positive externalities (ability to provide emergency services, increases in
land use, etc.)
Sunk costs are costs incurred before the appraisal period and for which there is no opportunity cost. Sunk costs could include expenditure on previous feasibility studies. CBA is only concerned with costs about which decisions can still be made.
Allowance should be made where contingencies are part of the expected costs of the proposal and included in the CBA. As set out in Section D.03 of the Public Spending Code, projects with large initial capital outlays should include sufficient contingency provision for escalating construction costs or delays. As projects progress through the various stages of appraisal, more precise quantification of project costs becomes possible. Therefore, the scale of this provision may be reduced as the design elements of the project become more certain. Appraisers should agree contingency levels when discussing key assumptions with EFEU.
Market prices are the value of costs and benefits in consumer prices and normally reflect the best alternative uses to which the goods or services could be put or the opportunity cost. While market prices are generally reliable and verifiable, in some cases market prices do not reflect opportunity costs due to market failures. Shadow prices may then be used although there should be clear and convincing reasons for doing so. The Public Spending Code under Section E provides guidance on a number of key shadow prices such as the shadow price of public funds, shadow price of labour and shadow price of carbon. These
2 Externalities can be benefits or costs which affect third parties who are not charged for the benefit or compensated for
the cost. External benefits include public good effects and beneficial spillover effects for third parties (e.g. new tourist facilities may benefit local businesses). External costs include congestion effects and pollution.
32 | P a g e
parameters must be included alongside transport parameters when carrying out economic appraisal.
Benefits should always be valued based on willingness to pay. Where market values are not available (e.g. value of life, value of time), other techniques can be used. These include stated preference techniques such as contingent valuation as well as revealed preference techniques such as hedonic pricing and travel cost analysis. Ideally, revealed preference techniques should be used because this reflects real behaviour whereas stated preference techniques reflect hypothetical choices in response to questionnaires and surveys.
An important driver of the quality of a cost-benefit analysis is the rigour of demand estimates. The projections of demand for a proposal must be based on reliable evidence and subject to independent, expert validation. The project analyst should carry out a demand analysis which takes into account the role of determinants such as price and non-price factors like income levels, expectations etc. Demand forecasting techniques include, among others, extrapolation methods, consultation with experts and econometric analysis.
The appraisal timeframe should be the economically useful life of the project. In line with Section E of the Public Spending Code, transport infrastructure projects such as road and rail should be appraised over a thirty year period whereas shorter-lived projects should be appraised over the life time of the asset. Appraisers should agree the appropriate time period when discussing key assumptions with EFEU. If the project has capital assets that have a useful life exceeding the time period of the CBA, the residual values of the assets should be calculated and included as a benefit. It is important that residual values are accurately estimated and include any offsetting costs such as decommissioning or remediation costs. Residual value should be understood as the market value for the fixed assets (or liquidation value of assets in the case they are sold out at end year) and includes the appraisal of the net revenues the project can generate beyond the time horizon. Section 5 provides more detail on how to calculate residual values.
Deadweight occurs when public expenditure is incurred to achieve benefits which would have been achieved in the absence of the project scheme being funded. Deadweight is closely linked to additionality. Additionality takes place when the funded project achieves benefits which otherwise would not have been achieved and these benefits can be attributed to the intervention. Benefits should be valued net of deadweight and should reflect the best estimate of additionality accruing to a project.
In general, transfer payments should be excluded because from society’s perspective such payments have no effect on real resources and benefits are merely transferred from one part of society to another e.g. unemployment benefits. However, to the extent that the economic activity arising from the project will be additional (i.e. not displaced), the tax revenues arising, including PRSI, should be included as a benefit. Care should be taken to avoid double-counting in this regard; taxation is a portion of the total value-added (benefit) generated by the project, it is not a benefit in addition to the total value-added generated. Grant-aid and subsidies to the project should be included as a cost. Exchequer cash flows (taxes and grants) should be shown separately from other cash flows.
A common error made in CBA analysis relates to the double counting of the same benefits. Any type of benefit that is not deemed to be additional should not be included in a CBA. Examples of double counting which should be avoided include:
33 | P a g e
Applying both commercial revenue from usage charges and economic benefits to users e.g. including total toll revenue and total time savings for a transport project;
Value of time savings for a road project and benefits for local shops;
The monetary value of costs and benefits should be expressed in real terms and through applying sector specific values where available so that the effects of inflation do not distort future cost and benefit streams.
People generally prefer to receive benefits as early as possible while paying costs as late as possible. Costs and benefits occur at different points in the life of the project so the valuation of costs and benefits must take into account the time at which they occur. This concept of time preference is fundamental to CBA and so it is necessary to calculate the present values of all costs and benefits. To assist in discounting costs and benefits, the Public Spending Code provides that a common discount rate should be used for appraising public expenditure.
Step iv: Analyse the Main Options
Having identified and quantified the costs and benefits there are a number of methods/performance metrics which can be used to differentiate between options. These include:
Net Present Value Method (NPV): The Net Present Value (NPV) is the sum of the discounted cash flows over the period. This criterion is simply based on whether the sum of discounted benefits exceeds the sum of discounted costs.
Benefit Cost Ratio (BCR): This is the ratio of discounted benefits to discounted costs. If the benefit cost ratio is greater than one the project may be accepted as there are more benefits than costs. Unfortunately however this method does not take the size of the project into account so the results can be misleading. Generally a BCR of greater than 1:1 is an indicator that a proposal’s benefits exceed the costs. As with the other performance indicators, a positive BCR does not automatically mean a proposal is accepted as other issues are relevant such as affordability constraints and qualitative factors.
Internal Rate of Return (IRR): The internal rate of return is the maximum rate of interest that a project can afford to pay for the resources used which allows the project to cover the initial capital outlay and on-going costs and still break even. It can also be described as the discount rate that equates the present value of benefits and costs. The IRR is generally compared to a hurdle rate of return (normally the test discount rate for public investment appraisal) which corresponds to the opportunity cost of funds. If project appraisers have difficulty calculating the IRR in some cases, they should contact the EFEU to discuss.
Templates for the presentation of these values are provided in Section 7.
Step V: Identify the Risks Associated with Each Viable Option
Project appraisal involves forecasting the values of costs and benefits using the best information available. An inherent problem with the CBA approach is the difficulty in predicting these values. The estimated values of costs and benefits may not materialise as expected due to uncertainty and risk. There may also be biases in the analysis. The risks of adverse conditions and the potential uncertainty associated with each option should be identified and factored in to the decision making process. Realistic assumptions should be
34 | P a g e
made which reduce the element of uncertainty and risk minimisation strategies should be put in place.
It is important that steps are taken to manage risk and uncertainty as part of the appraisal process. The assessment of risk and uncertainty is one the most important components of a CBA and should be given significant attention. There are a number of key steps which should be taken:
1. Ensuring the data and assumptions underlying the estimation of costs and benefits are reliable and realistic
2. Identifying risks e.g. examining each variable to assess the level of uncertainty involved
3. Using risk assessment techniques to assess the level of risk and the impact of risk on project performance including such techniques as:
a. Sensitivity analysis b. Scenario analysis c. Expected values d. Monte Carlo analysis
4. Devising a risk management strategy, including measures to contain, avoid and mitigate risks, as appropriate
5. Communicating the risk management strategy to relevant stakeholders
More detail on dealing with Risk and Uncertainty is presented in Section 4.4 of this Section.
Step vi: Decide on a Preferred Option
Decide on the preferred option, specify it and a clear and detailed time profile for actions (including time for planning and decision making) and for expenditure. Excessively high quality and cost specifications should be avoided. A balance must be struck between specifications which are excessive relative to needs and low quality specifications which may generate short-term economies but which lead to greater costs in the long-run.
Step vii: Make a Recommendation to the Sanctioning Authority
The rationale for recommending the preferred option should be clear and sufficient evidence presented to decision makers to check the evidence and assumptions leading up to the selection of that option. It may be that the preferred option is not the proposal with the highest NPV due to some critical non-quantifiable or qualitative factors. If this is the case, the specific reasons for disagreeing with the quantitative analysis should be explicitly stated. If there is a budget constraint, the proposal which maximises the benefits within the spending constraint should be chosen as the preferred option.
The results of the Cost-Benefit Analysis should be presented appropriately and summarised in the Monetised Cost and Benefits Tables (Section 7) through the calculation of the Present Value of Benefits (PVB), Present Value of Costs (PVC), and Net Present Value of Costs and Benefits (NPV).
An indication of value-for-money should be given through calculation of a Benefit-Cost Ratio (BCR) and Internal Rate of Return (IRR). This should compare the present value of the project benefits to the present value of the sum of the capital, operating and maintenance costs of the project.
35 | P a g e
Where other significant costs and benefit exist but are not monetisable, the analyst should insert a comment below the BCR result to indicate that other qualitative benefits and costs are available and that the BCR result does NOT provide a good measure of value for money and should not be used as the sole basis for decisions.
4.2.2 Economic Appraisal: Cost-Effectiveness Analysis Cost-effectiveness analysis (CEA) compares alternative policies, programmes or projects with a common effect. It presents alternatives in order to identify the most appropriate option to achieve the most effective result at least cost. The aim of the analysis is to select the project that for a given output level, minimises the net present value of the costs or alternatively for a given cost, maximises the output level.
The tool can compare different measures with identical objectives, can establish a visibility of the intervention effectiveness and can be used as a communication tool which summarises outcomes using a single quantifiable indicator. A limitation of this tool is that it focuses on the primary expected impact of intervention, while other secondary or tertiary impacts may be ignored thus making the use of a cost-effectiveness analysis counterproductive.
When to use a Cost-Effectiveness Analysis? This type of analysis is particularly useful when considering programmes or projects whose benefits are very difficult to monetise. A single unit of output is required in order to compare options. This type of analysis lends itself to assessment of projects with high environmental aspects. For these types of projects simple CEA ratios are used such as the cost per unit of emission reduction. CBA is more useful than CEA when a money value can be given to both costs and benefits. Generally, CEA solves a problem of resource optimisation that usually presents itself in two ways:
Given a fixed budget and a number of alternative projects, how can project promoters maximise the outcomes, measured in effectiveness;
Given a target level of effectiveness, how can project promoters minimise costs.
What information is needed to carry out Cost-Effectiveness Analysis?
In broad terms the information needed to effectively derive a CEA is:
Primary objective of the intervention;
An indicator that measures the objective; and
Comparable estimates of costs of each intervention under consideration.
Steps involved in carrying out a Cost-Effectiveness Analysis
Step 1: Define the conditions for its use - in cases where a priority outcome or quantifiable outputs can be determined, the use of Cost-Effectiveness Analysis should be employed. The method is adapted for projects or programmes for which expected outcomes are clearly identified and whose costs are easily measurable. Identifying the relevant data at this stage is very important. Where data is not available, either directly or through appropriate proxies, Cost-Effectiveness Analysis should be avoided.
Step 2: Determine the effectiveness criteria and develop the relevant indicator - the choice of effectiveness criteria depends on the main objective of the intervention. Where there is a clear primary objective, the identification of effectiveness criteria is straight forward. For example, where an intervention is to reduce emissions, the indicator could be the reduction
36 | P a g e
in emissions per user. But where the intervention’s main objective is broad or unclear, the identification of this objective should be determined through stakeholder consultation.
Step 3: Evaluate the total cost of the programme. - both indirect and direct costs should be included in this calculation as well as any other costs that may result as an impact of the programme. Direct costs could include financial transfers, decreases in taxes, costs for financing the project and activities, staff costs, etc. Indirect costs could include the cost monitoring the programme or effects on other transport users as a result of the programme or project. Other types of costs such as opportunity costs may also be factored into the analysis.
Step 4: Measure the impacts of the project/programme - depending on the intervention, data availability and the stage (i.e. ex-ante, ex-post or interim), the appraiser may have to forecast the quantitative results of the programme. This information could be gathered from other counties and micro simulation techniques may be required. When this tool is employed for evaluation either at the end or during a programme, the appraiser should use primary data to estimate the impacts.
Step 5: Establishing a Cost-Effectiveness Ratio - when deriving the Cost-Effectiveness Ratio (CER), the interventions that are being compared have to have a common unit of comparison, applying the same realistic assumptions and ensuring all costs are included for all interventions. When for the same objective the analysis compares different types of interventions with identical costs, it is supported by qualitative elements.
What information is needed to carry out a Cost-Effectiveness Analysis? Where costs are the same as the costs in the financial analysis, the measurement of effectiveness depends on the chosen outcome. In the case of transport, the measures of effectiveness could be number of hours saved per user, collisions avoided, etc. The box below briefly explains the methodology of CEA. This approach allows appraisers to rank and select the option with the lowest Cost-Effectiveness Ratio or a combination of the strategies that use the budget in the most efficient way.
COST-EFFECTIVENESS ANALYSIS
When the alternative projects are competitors and mutually exclusive, an incremental analysis is required in order to rank the projects and single out the one that is most cost-effective. Generally cost-effectiveness analysis is pursued to test the null hypothesis that the mean cost-effectiveness of one project (a) is different from the mean cost-effectiveness of some competing intervention (b). Where C is cost and E is effectiveness. It is calculated as the ratio (R): R = (Ca – Cb) / (Ea – Eb) = ΔC / ΔE defining the incremental cost per unit of additional outcome.
When a strategy is both more effective and less costly than the alternative (Ca – Cb < 0 and Ea – Eb > 0), it is said to ‘dominate’ the alternative. In this situation there is no need to calculate cost-effectiveness ratios, because the decision on the strategy to choose is obvious.
However, in most circumstances, the project under examination is contemporaneously more (or less) costly and more (or less) effective than the alternative(s) (Ca–Cb > 0 and Ea – Eb > 0 or, alternatively, Ca – Cb < 0 and Ea – Eb < 0). In this situation, the incremental cost-effectiveness ratios allow appraisers to rank the projects under examination and to identify, and then eliminate, cases of ‘extended dominance’. This can be defined as the state when a strategy is both less effective and more costly than a linear combination of two other strategies with which it is mutually exclusive. More operationally, extended dominance is where the incremental Cost-Effectiveness Ratio for a given project is higher than that of the next more effective alternative.
Source: Guide to Cost-Benefit Analysis of Investment Projects, European Commission, 2014
37 | P a g e
4.2.3 Economic Appraisal: Multi-Criteria Analysis Multi-Criteria Analysis (MCA) is an appraisal tool used to evaluate alternatives based on identified criteria and ranked on the basis of an aggregation procedure. The criteria would normally reflect policy, programme or project objectives and other considerations as appropriate, such as value for money, environment, social inclusion, etc. Scores achieved do not necessarily need to be conveyed in quantitative monetary terms, but can simply be expressed in physical units or in qualitative terms.
While MCA can be expressed in either qualitative or quantitative terms, it is common to apply numerical analysis to a performance matrix in two stages:
Scoring: the expected consequences of each option are assigned a numerical score on a strength of preference scale for each option for each criterion. More preferred options score higher on the scale, and less preferred options score lower. In practice, scales extending from 0 to 100 are often used.
Weighting: numerical weights are assigned to define, for each criterion, the relative valuations of a shift between the top and bottom of the chosen scale.
When to use a Multi-Criteria Analysis?
The Public Spending Code determines that Multi-Criteria Analysis (MCA) should be carried out at a minimum for projects between €5 million and €20 million.
MCA can be used as an alternative or complementarily to appraisal techniques which primarily use monetary valuations (Financial Analysis, Cost-Effectiveness Analysis and Cost-Benefit Analysis) when there are different impacts that may be quantified but not monetarily valued, such as social impacts or environmental impacts (for example, impacts on landscape). In this way, it can provide a useful framework to evaluate different transport options with several criteria. MCA can complement a CBA if certain important parameters are not monetiseable.
MCA enables projects to be assessed against more than one objective. It is also worth noting that the application of MCA is not restricted to situations where the aim is to find only the single most appropriate option to follow through. MCA is particularly useful when it can offer a quick and cost effective way of short listing projects and comparing them against strategic objectives in a structured way.
What information is needed to carry out a Multi-Criteria Analysis?
In general terms, the information necessary to perform a multi-criteria analysis are:
The options, alternatives, scenarios, policy measures or strategies that have to be compared to each other;
The evaluation criteria that will be used to assess these options;
The importance of these criteria (that is, the weights); and
The evaluation of the options on the different criteria. These evaluations can be given a numerical or ordinal (comparative) scale.
Steps Involved in carrying out a Multi-Criteria Analysis
Step 1: Establish decision context - a first step is always to establish the decision context. Central to this are the objectives of the decision making body, the administrative and historical context, identification of the people who may be affected by the decision and an
38 | P a g e
identification of those responsible for the decision. In applying MCA it is important to identify a single high level objective, for which there will usually be sub-objectives. A common component of this step can be to refer to underlying policy statements.
Step 2: Identify the options - having established the decision context, the next step is to list the set of alternative options to be considered. Sometimes the problem will be a very wide range of possible options and it will be the role of the MCA in the first instance to provide a structured sifting of alternatives to identify a shortlist, using basic data and quick procedures. It is sometimes worth carrying out some informal sifting against established constraints (e.g. legal, structural, environmental, etc.). It is not worth considering and putting effort into gathering data about clearly infeasible propositions. This step may have to be repeated, particularly in cases where there is a lack of acceptable alternatives.
At this stage, engagement with a mix of stakeholders and key players is often used to identify the most important options. Options are important only for the value they create by achieving objectives. It is better to consider objectives first, particularly when the options are not given and have to be developed.
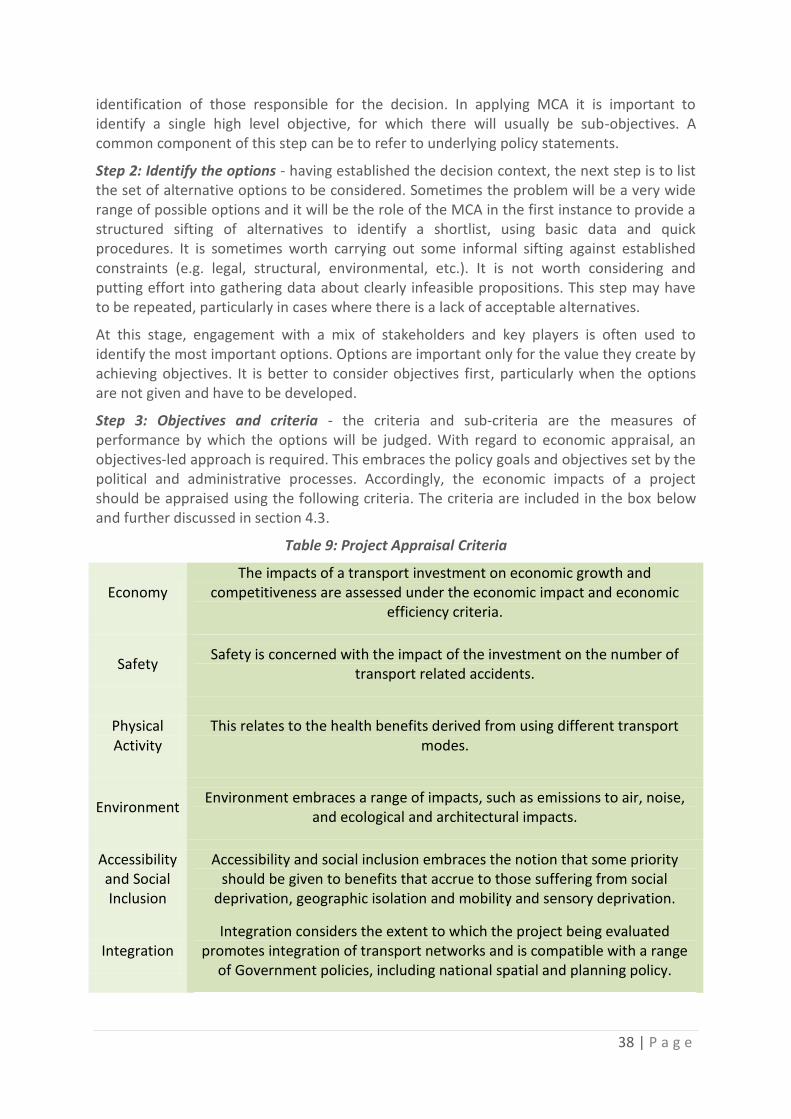
Step 3: Objectives and criteria - the criteria and sub-criteria are the measures of performance by which the options will be judged. With regard to economic appraisal, an objectives-led approach is required. This embraces the policy goals and objectives set by the political and administrative processes. Accordingly, the economic impacts of a project should be appraised using the following criteria. The criteria are included in the box below and further discussed in section 4.3.
Table 9: Project Appraisal Criteria
Economy The impacts of a transport investment on economic growth and
competitiveness are assessed under the economic impact and economic efficiency criteria.
Safety Safety is concerned with the impact of the investment on the number of
transport related accidents.
Physical Activity
This relates to the health benefits derived from using different transport modes.
Environment Environment embraces a range of impacts, such as emissions to air, noise,
and ecological and architectural impacts.
Accessibility and Social Inclusion
Accessibility and social inclusion embraces the notion that some priority should be given to benefits that accrue to those suffering from social
deprivation, geographic isolation and mobility and sensory deprivation.
Integration Integration considers the extent to which the project being evaluated
promotes integration of transport networks and is compatible with a range of Government policies, including national spatial and planning policy.
39 | P a g e
Step 4: “Scoring” - describe the expected performance of each option against the criteria - A basic MCA will present the decision maker with the performance matrix itself. A performance matrix presents how each alternative option performs on each of the criteria that form part of the analysis. The task for the decision maker is then to study the matrix, and come to a view on the ranking of the options – probably assisted by some supplementary advice from those who constructed the matrix on their views of how the information should be interpreted.
The measures used in performance matrices of this kind can be qualitative or quantitative. Often qualitative descriptions are used (e.g. scaling statement) or natural units (e.g. price or length), or sometimes a crude numerical scale (e.g. number of stars), or even a scale of 0 to 100. When a qualitative approach is to be used, analysts should refer to section 4.4. on qualitative appraisal techniques.
When assessing the project with performance levels the first consideration in setting up consistent numerical scales for the assessment of criteria is to ensure that the sense of direction is the same in all cases, so that (usually) better levels of performance lead to higher value scores. This may mean a reversal of the natural units. For example, access to a facility might be recorded in terms of distance to the nearest public transport, where the natural scale of measurement (distance) associates a low number with a good performance. The thresholds at which a project “passes” each criterion should be agreed in advance of scoring. If no weighting is proposed, analysts should proceed to Step 7.
Step 5 (Optional): “weighting” - assign weights for each of the criteria to reflect their relative importance to the decision - Multi-criteria analysis sometimes encompasses a ranking or weighting of these criteria. A standard weighting or ranking is not proposed. Neither is a mandatory project specific weighting or ranking proposed. However, it is, of course, open to project evaluators to suggest and to policy-makers to adopt weightings or rankings with regard to projects in particular transport sectors. The weightings being adopted should be fully documented to ensure the transparency of the assessment process. They should also be consistently applied across similar projects.
The weighting of alternative criteria can be used to clarify the relative importance of each of the individual criteria in the overall decision. While all criteria can be given equal weighting, different weightings can be applied to different criteria reflecting their importance in the objectives.
The use of weightings between factors is not mandatory, but where weightings are to be used, they should be proportionate. In particular, where “Economy” is used as a criterion, it would be expected that criterion, or criteria category, would have a high proportion of the weighting. If no weighting is given, then all criteria are weighted equally.
Where weighting is used, the key idea is to construct numerical scales. It is conventional to allocate a value score to each criterion between 0 and 100 on an interval scale. The advantage of an interval scale is that differences in scores have consistency within each criterion. When combined with appropriately derived importance weights for the criteria, the use of an interval scale measurement allows weighted averages to be calculated across the preference scale and a full MCA to be carried out.
40 | P a g e
Step 6 (Linked to Step 5): Combine the weights and scores for each of the options to derive an overall value - if weighting is applied, the weighted scores for each option are then calculated. Normally this process is carried out in a spread sheet analysis or computer model. The method for calculating the overall preference score for each option is simply the weighted average of its scores on all the criteria. Basically one can multiply an option’s score on a criterion by the assigned weight for that criterion, do this for all criteria, and then sum the products to give the overall preference for that option.
Step 7: Examine the results and make recommendations - the top-level ordering of options is given by the average of all the preference scores. The ranking of the various alternatives gives an indication of how much better one option is over another and also the strong and weak points of the proposed alternatives. Another useful display of overall results is to move down a level. If costs and benefits constitute the next level down, then a graph of benefits versus costs can be instructive, for it essentially shows a relative value-for-money picture. The outer surface of the plot gives the most cost-effective options. Options appearing on the outer surface are said to ‘dominate’ options inside because they are both more beneficial and less costly.
Step 8: Conduct a sensitivity analysis of the results to changes in scores or weights - the stability of the ranking can be assessed through a sensitivity analysis. Sensitivity analysis provides a means for examining the extent to which vagueness about the inputs or disagreements between people makes any difference to the final overall results. Especially for appraisal of schemes or projects that attract public interest, the choice of weights may be contentious.
41 | P a g e
4.3 Qualitative Guidance As mentioned above, not all impacts of a programme can be captured in a quantitative appraisal, and for these impacts a qualitative appraisal will be necessary.
The topics considered in a qualitative appraisal are:
Economy
Safety
Environment
Accessibility and Social Inclusion
Integration
Other Government Policies
Non-quantifiable economic impacts
4.3.1 Economy The measurement of economic impacts within the Project Appraisal Balance Sheet (PABS) aims to determine the relative welfare gain from implementation of the proposed project. At the Business Case stage of project delivery, more detailed costings for the preferred option will be available and economic analysis will be completed. The appraisal of economic impacts therefore utilises a summary of both qualitative and quantitative data from these assessments.
In a perfectly competitive economy with prices reflecting full marginal social costs, the efficiency and effectiveness benefits would encompass the full economic impact of the transport investment. As markets are far from perfect, it is certain that other economic impacts occur that although not always quantifiable, are still important. Examples of market imperfections are transport investments that give rise to spill-over effects that are not charged for, or that facilitate economic market restructuring that yield greater competition or economies of scale. Another means by which the transport efficiency and effectiveness measure falls short is when the method of computing these benefits (rather than their scope) does not encompass the full effects. There are a number of specific impacts that need consideration in this regard:
Transport Quality
Transport Reliability
Re-organisation impacts
Agglomeration effects
Increased competition in the economy
Increased output of firms
Tax benefits arising from increased labour supply
Employment impacts
Inward investment impacts
For example, agglomeration effects arise because firms may derive productivity benefits from being close to each other. If the transport investment influences the decision of firms to locate in a cluster, then agglomeration benefits could arise that are not included in transport user benefits. Greater productivity in agglomerations arises from the fact that, in such locations, firms have access to larger product, input and labour markets. Knowledge and technology spillovers are also important. Similarly, lower transport costs increase competition by extending the geographical reach of a firm and also increasing the level of
42 | P a g e
competition that it faces. This economic impact is most likely to occur where new transport links are being created or significantly improved by providing a step change in accessibility.
4.3.2 Safety Transport sector proposals often have a significant impact in terms of improving the safety record of transport infrastructure. Transport policy has a specific focus on the reduction of collisions, and project design in roads and public transport emphasises accident reduction. Higher capacity roads, and especially motorways, tend to be safer as a result of the segregation of traffic flows and a reduction in the number of road accesses. Where, as a result of a public transport investment, car users switch to the public transport mode, there will tend to be a collision reduction benefit.
A qualitative assessment can be used to highlight matters including, but not limited to:
The user groups affected by safety improvements, for example car occupants, pedestrians and cyclists;
A change in the balance of accidents; for example, fewer fatalities or serious injury accidents, but an increase in slight injury accidents; and
Any uncertainties in the assessment.
4.3.3 Environment Impacts Air Quality
Transport is a significant contributor to Ireland’s greenhouse gas emissions. Any transport appraisal should therefore take account of contributions to greenhouse gas reductions, and in particular to emissions of CO2, the most important greenhouse gas. Methane (CH4) also has substantial greenhouse impacts.
With regard to local air quality, NOx, together with CO, NMVOC, SO2, lead and PM, which are emitted from transport, can cause local air quality problems, and associated health impacts, particularly when they occur at high concentrations. High levels of such pollutants also have potential to lead to secondary effects on water quality (e.g. through acid rain), nature conservation resources and the built heritage.
Noise and Vibration
Transport can be a major source of noise, which in turn can affect quality of life and in extreme circumstances can result in health impacts. However, noise impacts are likely to be route specific for two reasons:
Infrastructure design may include measures to reduce noise propagation; and
The size of the population impacted by noise depends on the settlement pattern close to the infrastructure.
Accordingly, it is not proposed to estimate noise impacts at the preliminary appraisal stage of projects, or in respect of the appraisal of programmes. However, once detailed design including route choice analysis has been conducted it is possible to assess noise impacts.
Landscape and Visual Quality
Transport infrastructure has the potential to impact on both the intrinsic character of the landscape or townscape and the quality of views experienced by people in their homes, workplaces, recreational and outdoor areas. Such effects can occur through the
43 | P a g e
introduction, removal or alteration of infrastructure or natural landscape features, such as landforms, trees, and hedges as well as from changes in numbers of traffic movements. The presence of lighting in previously dark areas can also contribute to the level of impact. Qualitative information detailing the key landscape characteristics affected or effects on key views may be presented in the PABS.
Biodiversity
At the top of the hierarchy, and forming the cornerstone of Europe's nature conservation policy, are the EU Birds Directive and EU Habitats Directive. Together they give effect to the Natura 2000 network of protected sites and a strict system of species protection. The Natura 2000 network provides an ecological infrastructure for the protection of sites that are of particular importance for rare, endangered or vulnerable habitats and species within the EU and include both Special Areas of Conservation (SAC) and Special Protection Areas (SPA).
These directives have been transposed into Irish law through the European Communities (Birds and Natural Habitats) Regulations 2011, which consolidates the European Communities (Natural Habitats) Regulations 1997 to 2005 and the European Communities (Birds and Natural Habitats)(Control of Recreational Activities) Regulations 2010.
Effects on biodiversity are generally considered in terms of impacts on specific flora or fauna, or on defined habitats. The EU Habitats Directive (94/43/EEC) on the conservation of natural habitats and of wild fauna and flora should be considered if the construction, presence and operation of transport infrastructure can impact on nature conservation resources through direct loss or damage to habitat or specific species, creation of barriers to population movement or indirect effects resulting from, for example, changes in water quality of levels, air quality or noise and light levels. If this is likely to be the case, an Appropriate Assessment of the projects implications may be necessary. It should also be noted that requirements for Appropriate Assessment are becoming more stringent, reflected in the growing case law in this area, and there is a risk to the delivery of projects if provision is not made at the outset of investment decisions to ensure that transport projects are compliant with biodiversity and ecology obligations.
Qualitative statements that detail the potential impact on biodiversity objectives such as the direct and indirect impact on protected species or designated sites should be included in the PABS.
Cultural Heritage
Effects on cultural heritage can be considered in terms of impacts on below ground archaeological remains, historic buildings (individual and areas), and historic landscapes and parks. The construction, presence and operation of transport infrastructure can impact directly on such cultural heritage resources through physical impacts resulting from direct loss or damage, or indirectly through changes in setting, noise and vibration levels, air quality, and water levels. For example, the project appraiser may include the percentage of such sites that directly impacted by the scheme.
44 | P a g e
Land Use
In addition to the indirect effects on land use (air, noise, visual etc.) identified above, the construction and presence of transport infrastructure can result in temporary or permanent effects on land use through land-take, severance or reduction of viability, which prevents or reduces its value for intended use. Such uses include residential, commercial, recreational, open space, agriculture, minerals and public facilities (hospitals, schools, and religious institutions). Soils in areas close to transport routes and particularly roads may be affected by pollution from run-off. Similarly, soils may be used or degraded during construction. These impacts should also be considered under this heading. For example, the area/volume of the soils affected by pollution or use could be reported along with the overall impact on property, soils and geology.
Water Resources
Water resources comprise surface waters, ground waters and coastal waters. The construction, presence and operation of transport infrastructure can impact directly on flows, levels and quality of such waters and through this can result on effects on people, biodiversity, agriculture, and soils. For example, pollution or increased sediment loads can increase pollution of littoral environments or of aquifers used for drinking water supply, while new structures could affect the capacity of flood plains.
The most common pollutants arising from road runoffs are Polycyclic Aromatic Hydrocarbons (PAHs), metals, and chloride. Metal emission rates are primarily dependant on traffic volumes, PAH emission rates on traffic volumes and road type and chlorides on the severity of the winter, due to the application of de-icing salts during winter conditions.
Because these pollutants are traffic dependant, they will not generally increase where a new road is being built, because traffic volumes will largely transfer from existing roads. Additionally, new roads may incorporate pollution control systems such drainage, filtration and sedimentation systems that mitigate the impact of the environment. The implications are that new roads that do not result in significant generated traffic are likely to yield positive benefits in terms of reductions in water pollution associated with run-offs. In determining the scale and direction of these effects, the analyst should consider:
The extent of diverted and generated traffic that will be associated with the new road;
The mitigation measures in place on existing competing roads;
The mitigation measures to be put in place in respect of the new road; and
The sensitivity of the local environment to pollution through run-offs.
Where public transport or other investments cause a transfer from road to public transport modes, there will be positive benefits for water quality. The scale of such benefit will be related to:
The degree of road traffic diversion to public transport;
The mitigation measures in place on existing competing roads; and
The sensitivity of the local environment to pollution through run-offs.
The analyst is referred to the following source for guidance on the scale and nature of these impacts: Pollution from Roads and Vehicles and Dispersal to the Local Environment Final Report and Handbook. POLMIT Project, European Union, 2002.
45 | P a g e
Environmental Impacts and the Project Appraisal Stage
It is recognised that some environmental impacts are route specific and may not be assessable at the Preliminary Appraisal stage. It is also recognised that some choices between investment options would be better exposed by highlighting sub-criteria that fall within the overall criteria set out above. Flexibility in implementing this guidance in respect of environmental criteria is permitted in this regard.
4.3.4 Accessibility and Social Inclusion Government policy in respect of the socially excluded is articulated through the National Action Plan for Social Inclusion (NAPSI). The Strategy has the objective of reducing and, ideally, eliminating poverty and social exclusion particularly as it affects vulnerable groups such as vulnerable women, children and young people, older people, people with disabilities and ethnic minorities.
Transport investment, by its nature, has a particularly strong role to play in respect of people living in rural areas with poor access, people who suffer from mobility and sensory deprivation, connecting young people, particularly those who live in disadvantaged areas, to services education and work opportunities and improving women’s access to a number of services in line the National Women’s Strategy.
Because of data and resource issues, a comprehensive analysis of the impact of a transport proposal on the NAPSI objectives will not generally be feasible. In practice, therefore, there are a number of steps that the analyst should take. These centre on the impacts on:
Vulnerable groups; and
Deprived geographic areas.
Vulnerable Groups
The appraisal framework requires the following steps to be undertaken by the project appraisal analyst:
Consider the distribution of impacts by income group, and the vulnerable groups identified above, such as people with disabilities;
Consider whether the project improves access to jobs, key facilities (such as town centres and schools) and social and recreational opportunities for such groups;
If suitable data from the core cost-benefit analysis are available, analyse the distribution of user benefits by income group and other characteristics;
As lower income groups have low levels of car ownership, consider the impact on car owners and non-car owners; and
Consider, in particular, the impacts on people with mobility and sensory impairment.
The output for vulnerable groups in the PABS detail the impact on groups such as non-car owners, people with a disability or those on low incomes. Appraisers should try to quantify the change in service levels to these groups and/or the distribution of consumer surplus.
Deprived Geographic Areas
Establish whether the proposal improves accessibility for people in socially deprived areas, particularly those areas covered by the Area Based Childhood programme, Rural Social Scheme and/or for those with a disability. Again, assessment of these impacts should be undertaken through Qualitative, Quantitative and Scaling statements.
46 | P a g e
4.3.5 Integration A number of aspects of integration need to be considered in the qualitative assessment of the project options:
An Integrated Transport Policy - the planning for each transport infrastructure and mode needs to take account of other elements of transport infrastructure and services. Thus, for example, the development of roads and railways needs to take account of the requirements of seaports and airports.
Integration of Transport Policies with Other Government Policies - transport policies should complement and reinforce other Government policies. In particular, they should take account of Government policies on land use, balanced regional development, social inclusion, climate change and sustainable development. For example:
Modal Integration: This is concerned with integration across and within transport modes with the objective of creating a seamless transport policy.
Geographical Integration: This refers to integration of transport networks across geographical and juridical boundaries.
The Integration Criterion has been subdivided into a number of elements to aid the analysis process. The elements reflect the Department’s integration goals and concerns. However, integration with social inclusion and environmental sustainability polices is considered in two separate criteria viz. the Environment Criterion and the Accessibility and Social Inclusion Criterion. The proposed elements of the Integration Criterion are as follows:
Land Use Integration
Transport Integration
Geographical Integration
Other Government Policy Integration
Land Use Integration
The integration of transport and land use is the single most important element of the Integration criterion. This is because the distribution of land uses plays an important part in determining travel demands and the viability of public transport and non-vehicular modes. These modes, which are an alternative to the use of the private car, have an important contribution to make to reducing transport energy use and environmental and greenhouse gas emissions. Land use integration needs to be considered at two levels:
Integration with land use policies and objectives; and
Integration with regional and local land use plans.
The reason why these aspects require separate consideration is that while regional and local policies may promote integration of transport and land use at the local level, they may run counter to national goals by, for example, promoting long distance commuting.
National land use policies promote the vitality of urban centres, seek to focus development on public transport nodes and corridors and advise against land use development that promotes long distance commuting, especially by car. Projects should be assessed as to whether they support such national land use and transport objectives. Some land use factors that should be taken into account include the extent to which the proposed project:
47 | P a g e
Provides opportunities for high density development, particularly at public transport nodes;
Promotes the development of mixed land use neighbourhoods;
Supports infill development;
Supports the location of housing within existing urban areas rather than in greenfield locations;
Provides opportunities for use of non-vehicular modes, such as walking and cycling.
Separate consideration should then be given to compatibility with statutory planning documents, such as the Regional Planning Guidelines and the local authority development plans.
Transport Integration Transport integration addresses the promotion of the integration of transport infrastructure and services through the development of missing transport links, and improving opportunities for interchange and through ticketing.
This element may constitute double counting where all of these benefits may be captured in the core cost-benefit analysis, which may consider, for example, the time and money cost savings arising from better integration of modes and the resultant lower transfer penalties.
However, a core cost-benefit analysis may not be undertaken in all cases and this element is needed to ensure that these benefits are captured in such circumstances. Moreover, the sophistication of the demand modelling exercise that underpins the core cost-benefit may vary, so that network integration effects may not be fully captured.
Accordingly, this element should be assessed in all evaluations. However, the analyst should also note whether any aspect of transport integration has already been captured in the core cost-benefit analysis, and provide quantification of those effects.
Consideration of transport integration effects is likely to centre on both the improved services made possible and the infrastructure provided. Transport service integration may lead to the following benefits and indicators:
Reduced in-vehicle journey times (for both passenger and freight);
Reduced walking and waiting times associated with interchanges;
Greater reliability and frequency in interchange; and
Simpler fare systems and reduced fare costs and ticket purchasing time associated with ticketing (including fares integration).
This analysis should also assess the potential dis-benefits to other transport users such as increased journey time due to rerouting or rescheduling of services caused by the establishment or operation of the proposed project. Transport infrastructure integration may include the following benefits and indicators:
Improved capacity of interchange infrastructure and reduced overcrowding;
Improved quality of interchange infrastructure such as physical layout, services provided, amenities and environment;
Improved integration with non-mechanised modes, such as walk and cycle;
Improved traveller information.
These are unlikely to be captured in the core cost-benefit.
48 | P a g e
Potential dis-benefits to other transport infrastructure projects should also be identified, such as disruption of services during a lengthy construction phase, delay in construction of a project which is in proximity or is linked in some way to the project under construction and attraction of passengers from another mode e.g. rail to road for outer urban commuters.
Geographical Integration
The Department of Transport, Tourism and Sport’s Statement of Strategy highlights three aspects of geographical integration:
Improve integration of rural and local services;
Improved internal transport links with Northern Ireland; and
Access transport links with Europe and the rest of the world.
The National Development Plan recognised the benefits that could accrue to the whole of the island through closer economic co-operation with Northern Ireland. Efficient and competitive integrated public and private transport services were identified as critical to the development of trade. Inward investment and tourism and the provision of equality of access to employment opportunities through improved labour market mobility are also important considerations.
Cross border infrastructure and service improvements and internal improvements on key north-south corridors will contribute to geographical integration with Northern Ireland.
Trans-European Networks of Transport (TEN-T) is the building block of the European transport network, this policy aims to close the gaps between Member States' transport networks, remove bottlenecks that still hamper the smooth functioning of the internal market and overcome technical barriers such as incompatible standards for railway traffic. It provides the underlying framework for the "quick-start" list of priority projects which are to give new impetus to the European Economy.
The TEN-T programme under the Connecting Europe Facility will co-fund investments that qualify under the rules for this type of funding. For Ireland, pre-identified priority projects include the Cork-Dublin-Belfast Rail line, and the Dublin- Cork-Southampton Port and Rail link. Transport projects within the TENs-T programme should rank highly in terms of the Integration Criterion.
4.3.6 Other Government Policy Integration
Regional Balance
The major Government policy to which transport investments could potentially contribute is the successor to the National Spatial Strategy (NSS) which was published by the Government in 2002. A new national spatial planning framework will set a strategic, national context for the proposed new regional, spatial and economic strategies to be prepared by the three new regional assemblies as replacements for the current regional planning guidelines (RPGs), which expire at the end of 2016.
It is likely that the regional, spatial and economic strategies will, as with the previous Regional Planning Guidelines, play an important part in translating the broad national level spatial planning objectives into more actionable development objectives and requirements at the level of the local authority statutory development plan.
49 | P a g e
It is also probable that the focus of the successor to the NSS will at least in part be on balanced regional development. Inherent in this concept is the notion that some regions are lagging behind and that measures are required to “support a better balance of activity and development between areas experiencing rapid development and congestion and areas that are economically underutilised”. This suggests that, within the appraisal framework, the Integration criterion should assess the extent to which the transport investment project that is being appraised promotes regional balance.
From an infrastructure perspective, based on a review of economic theory and the spatial distribution of economic activity in Ireland, the following types of transport projects are regarded as positive to regional balance:
In large towns and cities or giving local access to large towns and cities in the peripheral regions;
Between large towns and cities in the peripheral regions;
On routes accessing international ports and airports; and
On radial routes to the East region, where such routes improve access to international ports and airports.
In contrast, the following transport projects are regarded as at best neutral to regional balance:
Those that link the peripheral and East regions without enhancing access to international gateways; and
Transport improvements within the East region that are aimed primarily at improving mobility within that region could be regarded as less beneficial to regional balance than the other types of infrastructure identified above.
As well as increasing accessibility, transport infrastructure has the potential to promote regional balance through enhancing regional income. The most obvious example of this is in terms of infrastructure such as ports and airports, where their expansion may lead to on-going employment and income through direct employment and increased tourism in the region. While these impacts are not important from a national viewpoint, they are important in regions where average earnings are particularly low. This impact may thus arise in a minority of infrastructure investments.
This benefit category should be considered only for projects in regions with relatively low average earnings. Quantification of this benefit involves estimating the direct and indirect incomes and employment demand arising from the project. Regional and national input-output models are the most appropriate means of measuring this impact.
Again, assessment of Integration impacts should be undertaken through Qualitative, Quantitative and Scaling statements.
50 | P a g e
4.4 Risk and Uncertainty
Risk assessment involves the consideration of the sources of risk, and an evaluation of the probabilities of those risks arising and their impact on project costs and benefits. While it is recognised that such risk assessments are often difficult, such a process would at least identify where risks arise, and facilitate measures to counter optimism bias in relation to these risks, where they are not otherwise quantified. A further danger in applying standard optimism bias factors would be that of engendering complacency with regard to a real assessment of risk.
The preparation of a risk register in project development is standard engineering practice. By applying these processes to the transport planning assessment, the risks of a proposal can be more fully understood by decision makers.
A number of potential steps involved in evaluating risk and uncertainty are set out below. The effort applied at each step should be proportionate to the funds involved, outcomes at stake and the stage of the appraisal.
4.4.1 Steps Involved in Evaluating Risk and Uncertainty
Step 1: Risk identification A risk register lists all the identified risks and the results of their analysis and evaluation. Information on the status of the risk should also be included. The register should be continuously updated throughout the course of a project. The types of risk that may be encountered could include policy risk, risk on delivering the asset (i.e. construction risk), risk on operating the asset (i.e. operating costs may increase), risks on demand and/or revenue, or other type of risks (i.e. Reputation risk, Technology Risk, etc.).
Developing a risk register is a useful tool to identify, quantify and value the extent of risk and uncertainty relating to proposal. This tool can be used to identify the bearer of risk and uncertainty associated with the project being appraised, provide an assessment of the likelihood of each risk occurring, and estimate the impact on project outcomes.
To identify the main areas of risk and the bearer of each risk it could be useful to organise expert workshops that bring all the relevant experts who understand the risks associated with the project together. Where the private sector has clear ownership, responsibility and control, it should be encouraged to take all of those risks it can manage more effectively than the procuring authority. If the public body seeks to reserve many of the responsibilities and controls that go hand-in-hand with service delivery and yet still seek to transfer significant risk, there is a danger that the private sector will increase its prices. Catastrophic risk such as natural disasters is one of the factors that make up the discount rate so it not necessary to identify such risks as part of the assessment.
Step 2: Assessing the impacts of risks and estimating likelihood of outcomes occurring Having identified risks, the next process is to assess the impact of each risk, or combination of risks, should they be realised, in terms of the cost outcomes of the risk. This could be through modelled sensitivity analysis or evidence from similar schemes. The range of outcomes should consider both the upper and lower extremes of the possible range, taking into account any reasonable constraints.
The best methods for quantifying the impact of risk will depend upon the information sources available. The best approach is to use empirical evidence whenever it is available,
51 | P a g e
and empirical evidence should be gathered when possible. When it is not, common-sense approximations should be used, rather than aiming for unrealistic or spurious levels of accuracy. What this means in practice depends on the nature of the risk. The objective is always to obtain an unbiased estimate of the impacts of the risk on the costs of the scheme.
When assessing the consequences of any risk, analysis should not be restricted to only the direct effects but should be extended to ensure all knock-on effects are included. This requires care, as there could be interaction between different risk events. Some risks will affect the costs of either the construction or operation of the project.
Once the risk impact on the cost outcomes are identified, the analysis should focus on the likelihood for each of the possible outcomes, the likelihood should be based on experience of past events, foreseeable changes rather than spurious estimates.
Estimating probabilities is not an exact science and inevitably assumptions have to be made. There is nothing wrong with this, but it is important that the assumptions in the assessment are reasonable and fully documented, as they are open to question when submitted to the Department.
Step 3: Deriving the probability distribution for the costs of the scheme The aim of the risk assessment is to derive a probability distribution around the costs of the scheme which enables the expected risk adjusted costs estimate to be obtained. The expected outcome is often referred to as the unbiased outcome which is basically the weighted average of all potential outcomes and associated probabilities.
Many risks are linked so if one risk occurs another risk is likely to occur. Where a detailed analysis of the preferred option is to be undertaken, modelling software such as Monte Carlo simulation can assist the project team in establishing a range of costs. The aim is to create a probability distribution or an S curve which gives the probability of the scheme cost estimate being less than or equal to any specific value.
Step 4: Risk Mitigation Once risks have been identified, project/programme promoters should prepare risk mitigation plans and provide evidence of the approach to responding to risks. Responding to risks will involve:
Tolerating risks: Tolerating risks should occur when the cost of the taking any action exceeds the potential benefits gained or there are no alternative courses of action available.
Treating or transferring risks: The purpose of this is to affect the likelihood of the risk while continuing with the activity giving rise to the risk. The type of actions that can be employed to treat risk in this case are Preventive Controls limit the likelihood of an adverse risk occurring; Corrective Controls minimise the impact of adverse outcomes; Directive Controls ensure that a particular outcome is achieved; and Detective Controls identify adverse outcomes once realised to minimise their impact.
Transferring risks can occur when for example insurance is used to control the risk as it facilitates financial recovery against the realisation of a risk.
Termination: Some risks will only be treatable or containable to acceptable levels by terminating particular activities. This option is important if it is clear that undertaking certain activities jeopardises the value for money of the scheme.
52 | P a g e
Step 5: Identify Potential Contingencies Even where an evaluation of risks and their impacts is undertaken, some risks will remain unanticipated. Additionally, as proposals progress through the various stages of appraisal, more precise quantification of costs becomes possible. Because of these factors, the total cost should include a provision for contingencies. The scale of this provision may be reduced as the design elements become more certain.
Sensitivity Analysis Sensitivity analysis should always form a part of appraisal. This involves evaluating proposals for a range of scenarios that reflect the elements that are uncertain.
At a minimum, sensitivity to the costing, transport demand, benefit modelling and impact of significant complementary proposals should be tested. This should preferably be implemented by identifying the factors giving rise to risks and testing sensitivity to these factors. Alternatively, a standard sensitivity test should be undertaken along the following lines:
Table 10: Overview of Standard Sensitivity Test
Project costing Test sensitivity to plus or minus 20 per cent change in costs at
preliminary appraisal stage and plus or minus 10 per cent at final appraisal stage.
Transport demand Test Sensitivity to plus or minus 10 and 20 per cent of demand
estimate
Quantification of benefit elements
Where the modelling of benefits, e.g. decongestion benefits, is regarded as subject to error, test sensitivity to plus or minus 10 and
20 per cent change in such benefits
Complementary and substitute proposals
Normally, proposals that are already fully committed form part of the Do-Nothing or Do-Minimum scenario against which the proposal in hand is evaluated. Where there are other such proposals that have not commenced, but have the capacity to enhance or reduce the
economic return, an evaluation of the sensitivity of the rate or return to such complementary or substitute proposals should be presented.
The above sensitivity tests represent a minimum. The agencies should ensure that sensitivity to other major uncertainties is tested. A useful approach to sensitivity analysis is to determine the level to which a risk factor would have to fall or rise in order to make the proposal not worthwhile. This is often referred to as the “switching value” which is usually presented as a % i.e. a 20% increase in investment costs reduces project NPV to 0.
Sensitivity analyses should not be used as a substitute for careful analysis. That is, the fact that sensitivity analysis is carried out should not be used to justify a simpler analysis than is warranted. Scenario analysis involves using a range of different scenarios (or variations on the option under examination) where all of the various factors can be reviewed and adjusted within a consistent framework. A number of scenarios are formulated, such as best case, worst case, etc. and for each scenario identified, a range of potential values is assigned for each cost and benefit variable. When formulating these scenarios, it is important that appropriate consideration is given to the sources of uncertainty about the future (i.e.
53 | P a g e
technical, political, etc). Once the values within each scenario have been reviewed, the NPV of each scenario can then be recalculated.
4.5 Project Appraisal Balance Sheet The output of the above analysis should be included in a Project Appraisal Balance Sheet. A PABS contains three elements:
A Qualitative Statement summarising the impact of the project in qualitative terms;
A Quantitative Statement that sets out quantified; and monetised indicators of the impact; and
A Scaling Statement that ranks the project on a seven point scale in terms of each criterion.
The Qualitative Statement should be backed up with research that allows for a justification of the summary comments made to be justified. This may be in the form of environmental assessments where undertaken, benchmarking against previous experiences where appropriate, or review of policy documentation as required.
While the quantitative indicators used will often be specific to the type of proposal being appraised, the PABS, as set out, includes some indicators of a general nature.
With regard to the Scaling Statement, this should be based on impacts relative to the scale of the project. Where impacts are monetised a Scaling Statement is not required.
For some proposals, some of the impact criteria may not be relevant. For example, rolling stock investments may have no impact on cultural heritage. In such circumstances, a “not applicable” rating may be entered in the PABS. Additionally, some impacts, such as environmental impacts, may not be assessable at the Preliminary Appraisal stage. In these circumstances, a “not assessable” rating may be entered.
More Detail on the PABS is provided in Section 7.