Wat
er
JAM
20
10N
C-A
WW
A_
WE
20
13
Sustainable Supplemental Carbon Sources
Hunter Long1, Katya Bilyk1, Wendell Khunjar1 Jeff Nicholson2, Bill Balzer2, Charles Bott2 James Grandstaff3 Steven Chiesa4
Jared Alder5
1Hazen and Sawyer 2HRSD3Henrico County DPU4Santa Clara University5OpenCEL
93rd Annual Fall ConferenceEmbassy Suites Charlotte | Concord, NC | November 10-13 | 2013
Wat
er
JAM
20
10N
C A
WW
A W
EA
20
11
OutlineOutline
Nansemond TP Overview Co-Fermentation Pilot Results and Discussion Future Work
Henrico County WRF Overview OpenCEL Pilot Results and Discussion Future Work
Conclusions and Lessons Learned
Nansemond TP Overview Co-Fermentation Pilot Results and Discussion Future Work
Henrico County WRF Overview OpenCEL Pilot Results and Discussion Future Work
Conclusions and Lessons Learned
Wat
er
JAM
20
10N
C A
WW
A W
EA
20
11
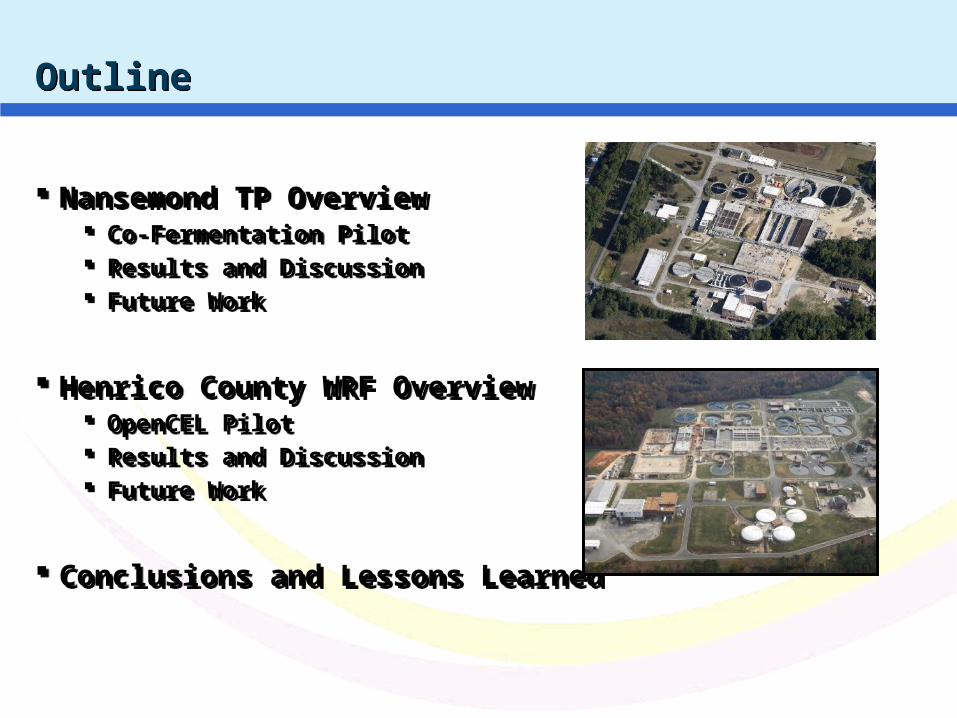
Nansemond Treatment PlantSuffolk, VANansemond Treatment PlantSuffolk, VA
• 30 mgd Design Flow• 5-Stage Bardenpho• Annual Average TN (5.0 mg/L) and P (1.0 mg/L) goals
Wat
er
JAM
20
10N
C A
WW
A W
EA
20
11
Local ConditionsLocal Conditions
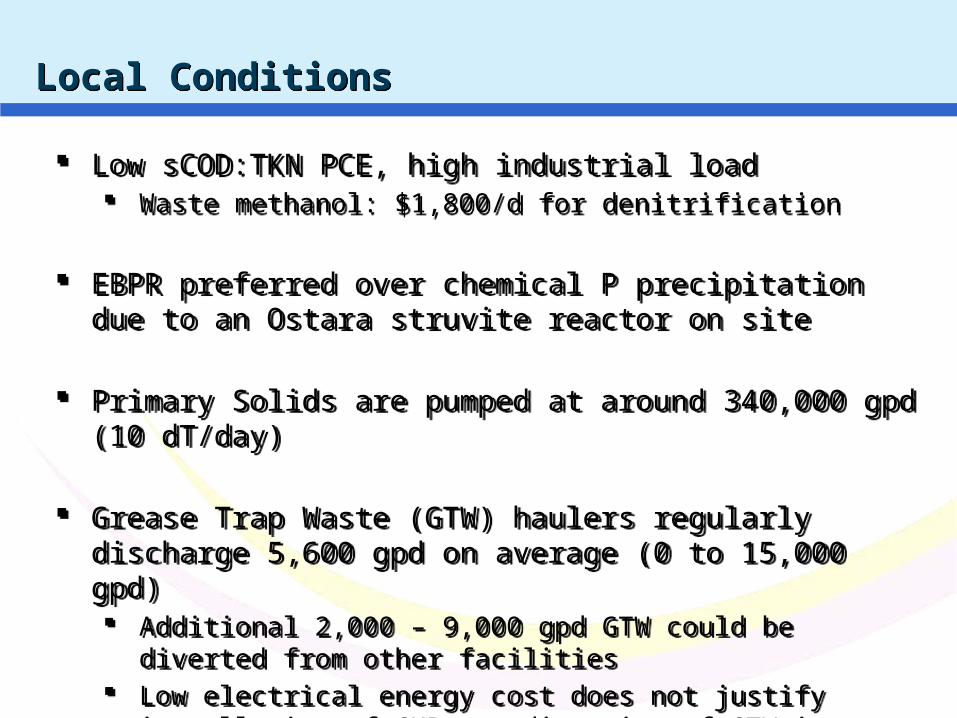
Low sCOD:TKN PCE, high industrial load Waste methanol: $1,800/d for denitrification
EBPR preferred over chemical P precipitation due to an Ostara struvite reactor on site
Primary Solids are pumped at around 340,000 gpd (10 dT/day)
Grease Trap Waste (GTW) haulers regularly discharge 5,600 gpd on average (0 to 15,000 gpd) Additional 2,000 – 9,000 gpd GTW could be diverted from other
facilities Low electrical energy cost does not justify installation of CHP, co-
digestion of GTW is not needed

Wat
er
JAM
20
10N
C A
WW
A W
EA
20
11
Study OverviewStudy Overview
PS and GTW Fermentation: Produce onsite carbon for denitrification Offset supplemental carbon purchase Remove GTW from NTP’s mainstream process Enhance biological phosphorus removal
Pilot Objectives: Determine VFA and rbCOD production from GTW and PS Determine optimal ratio of GTW:PS (fermenter) and GTW:ADS (blend
tank) Evaluate effect of temperature and SRT on fermentation
Wat
er
JAM
20
10N
C A
WW
A W
EA
20
11
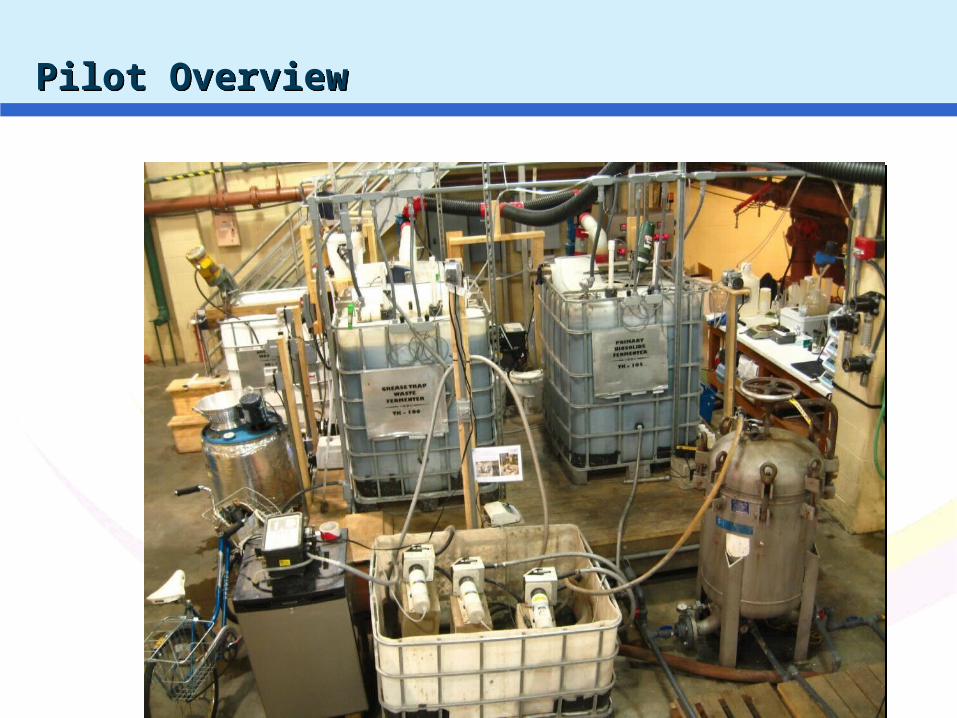
Pilot OverviewPilot Overview
Wat
er
JAM
20
10N
C A
WW
A W
EA
20
11
Pilot OverviewPilot Overview
Wat
er
JAM
20
10N
C A
WW
A W
EA
20
11
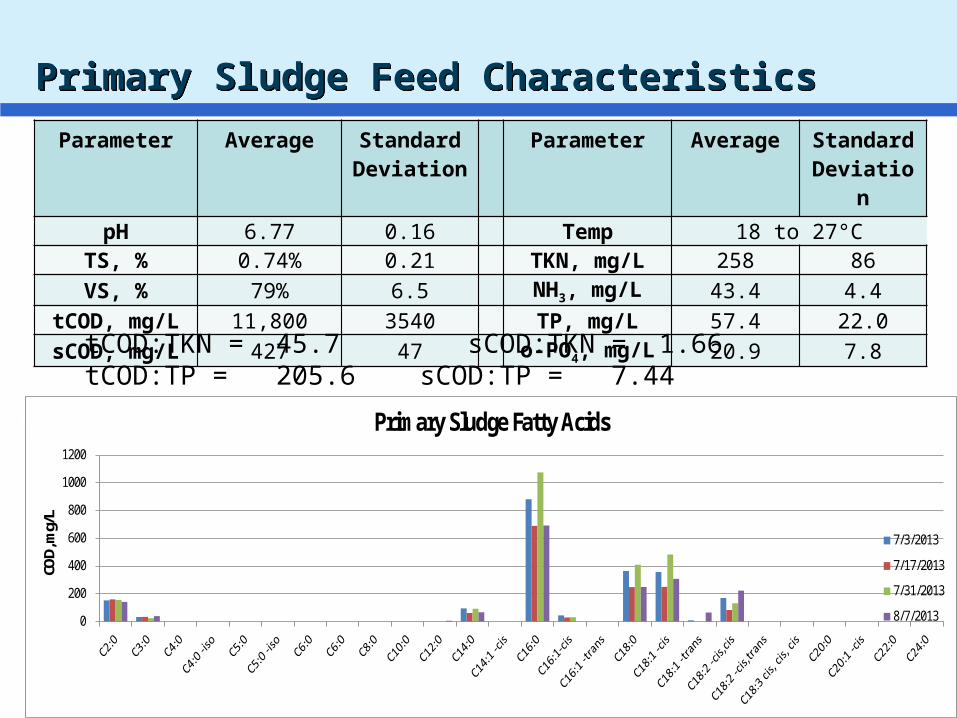
Primary Sludge Feed CharacteristicsPrimary Sludge Feed Characteristics
Parameter Average Standard Deviation
Parameter Average Standard Deviation
pH 6.77 0.16 Temp 18 to 27°CTS, % 0.74% 0.21 TKN, mg/L 258 86VS, % 79% 6.5 NH3, mg/L 43.4 4.4
tCOD, mg/L 11,800 3540 TP, mg/L 57.4 22.0sCOD, mg/L 427 47 o-PO4, mg/L 20.9 7.8
0
200
400
600
800
1000
1200
COD,
mg/
L
Primary Sludge Fatty Acids
7/3/2013
7/17/2013
7/31/2013
8/7/2013
tCOD:TKN = 45.7 sCOD:TKN = 1.66tCOD:TP = 205.6 sCOD:TP = 7.44
Wat
er
JAM
20
10N
C A
WW
A W
EA
20
11
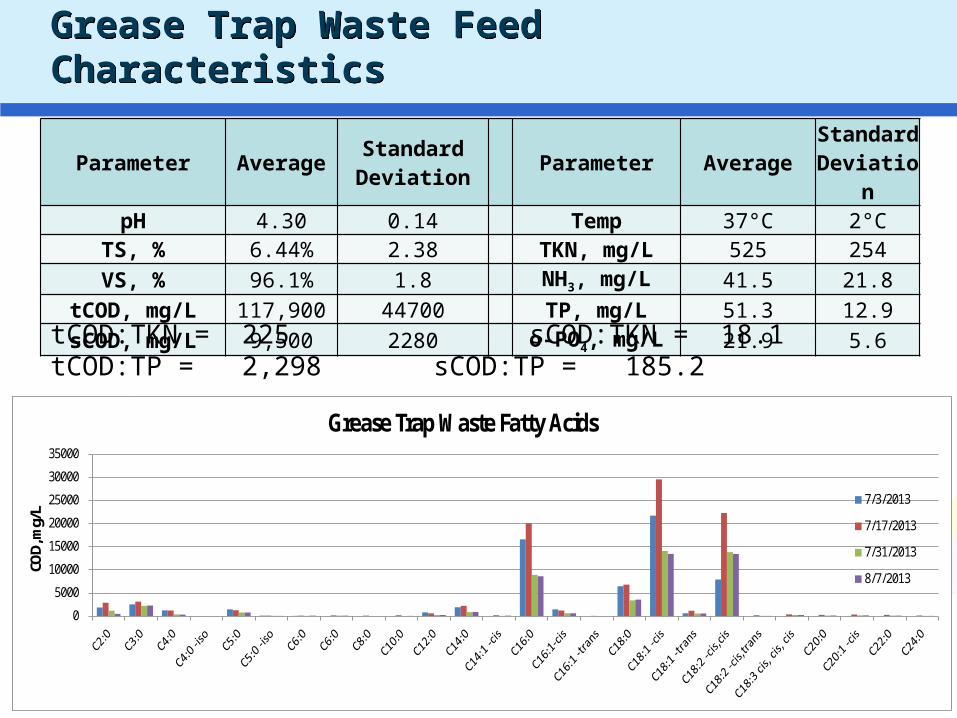
Grease Trap Waste Feed CharacteristicsGrease Trap Waste Feed Characteristics
Parameter AverageStandard Deviation Parameter Average Standard
DeviationpH 4.30 0.14 Temp 37°C 2°C
TS, % 6.44% 2.38 TKN, mg/L 525 254VS, % 96.1% 1.8 NH3, mg/L 41.5 21.8
tCOD, mg/L 117,900 44700 TP, mg/L 51.3 12.9sCOD, mg/L 9,500 2280 o-PO4, mg/L 21.9 5.6
0
5000
10000
15000
20000
25000
30000
35000
COD,
mg/
L
Grease Trap Waste Fatty Acids
7/3/2013
7/17/2013
7/31/2013
8/7/2013
tCOD:TKN = 225 sCOD:TKN = 18.1tCOD:TP = 2,298 sCOD:TP = 185.2
Wat
er
JAM
20
10N
C A
WW
A W
EA
20
11
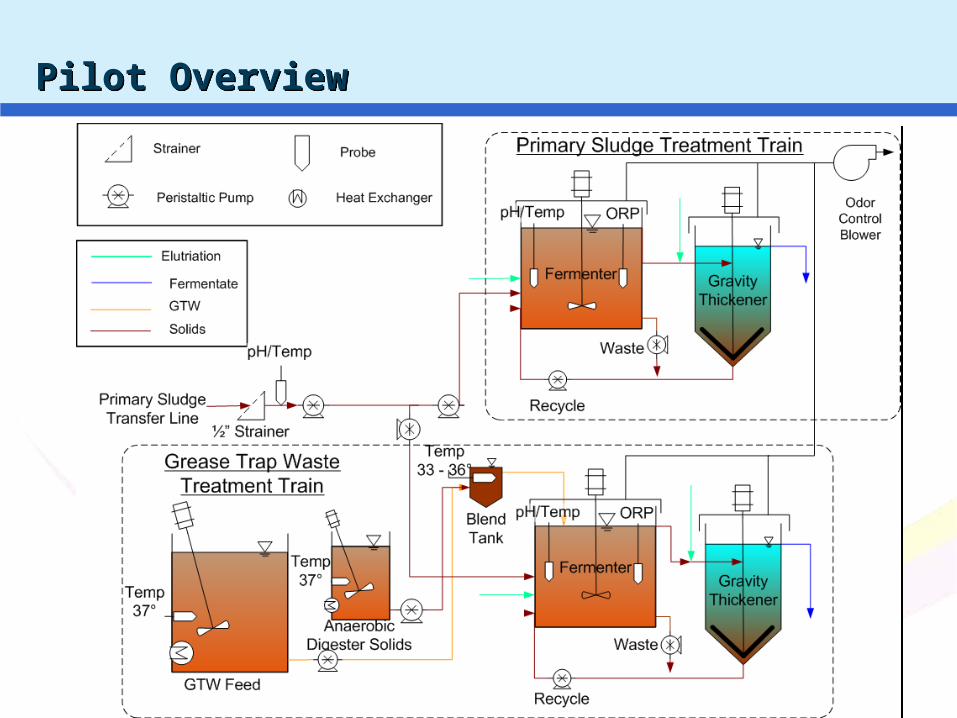
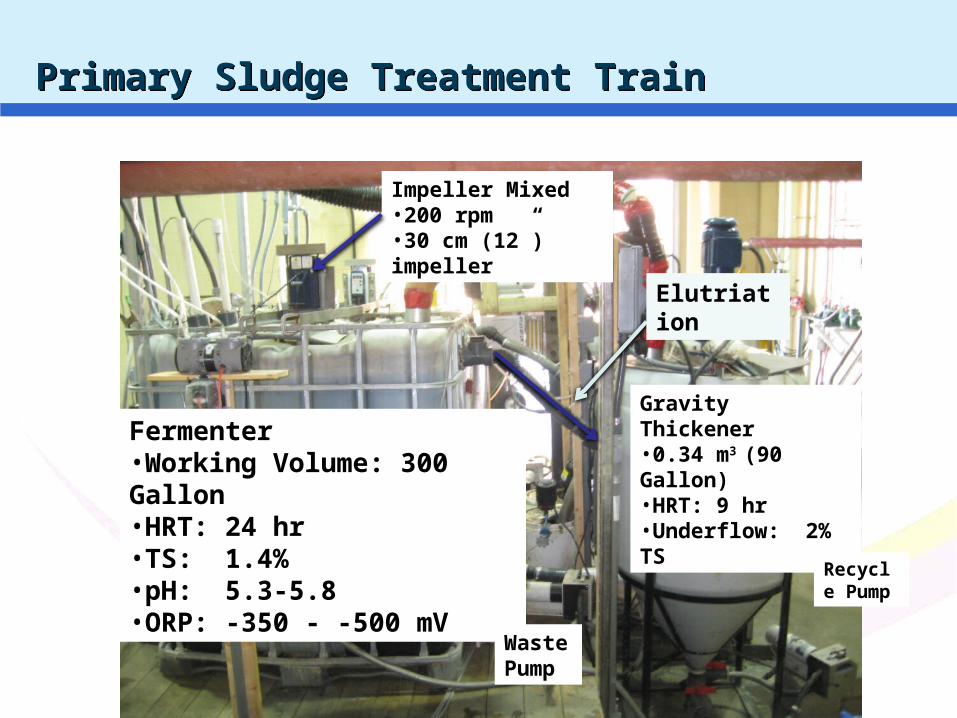
Primary Sludge Treatment TrainPrimary Sludge Treatment Train
Fermenter•Working Volume: 300 Gallon•HRT: 24 hr•TS: 1.4% •pH: 5.3-5.8•ORP: -350 - -500 mV
Gravity Thickener•0.34 m3 (90 Gallon)•HRT: 9 hr•Underflow: 2% TS
Waste Pump
Recycle Pump
Impeller Mixed•200 rpm•30 cm (12”) impeller
Elutriation
Wat
er
JAM
20
10N
C A
WW
A W
EA
20
11
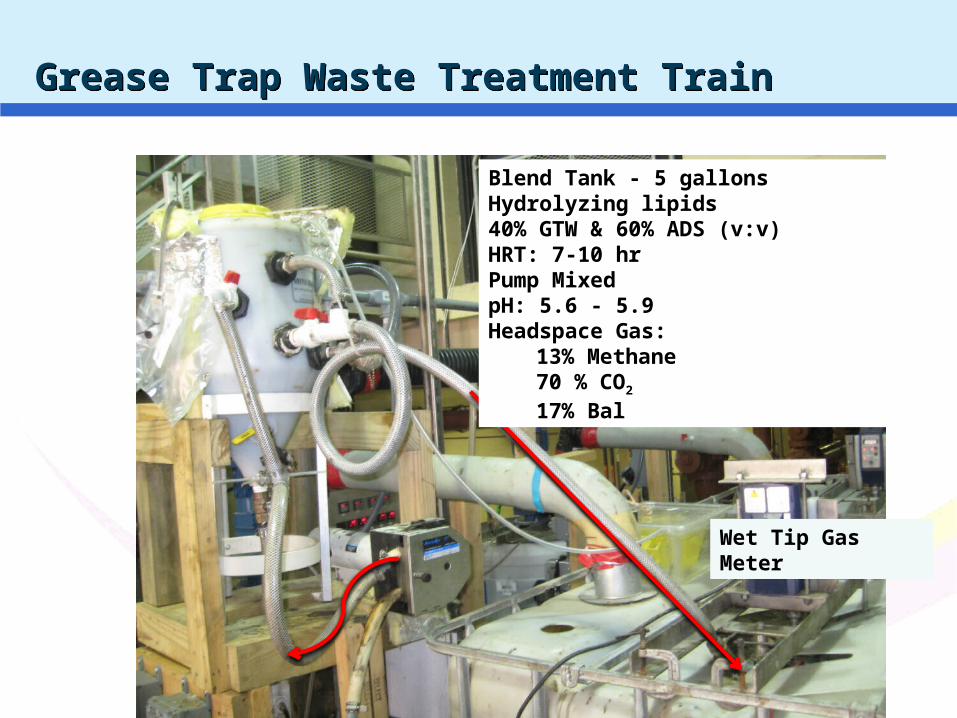
Grease Trap Waste Treatment TrainGrease Trap Waste Treatment Train
Wet Tip Gas Meter
Blend Tank - 5 gallonsHydrolyzing lipids40% GTW & 60% ADS (v:v)HRT: 7-10 hrPump MixedpH: 5.6 - 5.9Headspace Gas:
13% Methane 70 % CO2
17% Bal
Wat
er
JAM
20
10N
C A
WW
A W
EA
20
11
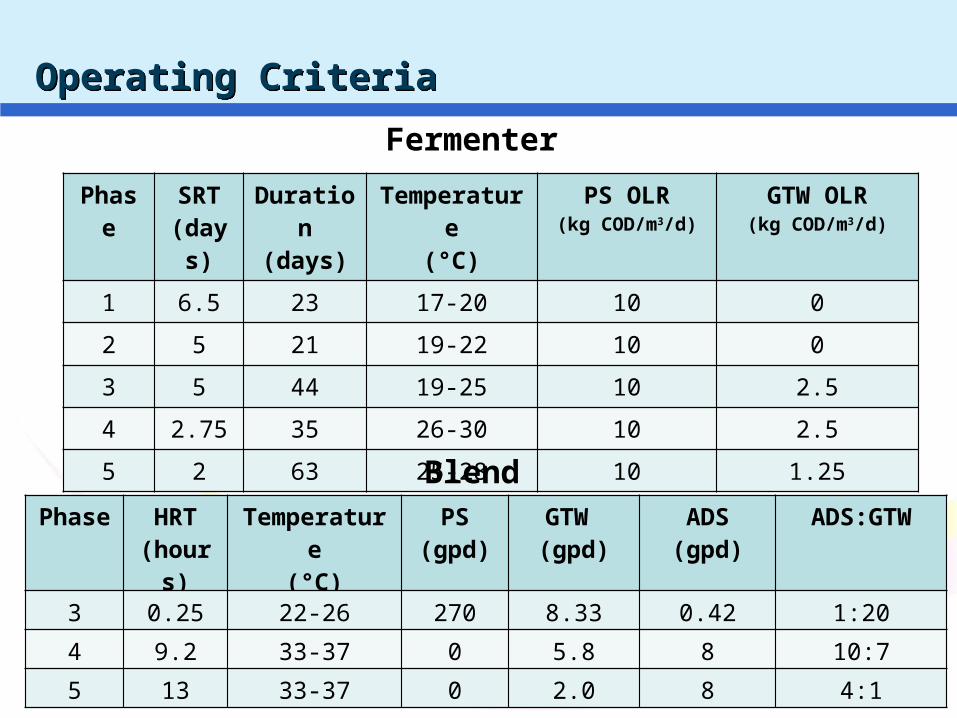
Operating CriteriaOperating Criteria
Phase SRT(days)
Duration(days)
Temperature(°C)
PS OLR(kg COD/m3/d)
GTW OLR(kg COD/m3/d)
1 6.5 23 17-20 10 0
2 5 21 19-22 10 0
3 5 44 19-25 10 2.5
4 2.75 35 26-30 10 2.5
5 2 63 25-28 10 1.25
Fermenter
Blend TankPhase HRT
(hours)Temperature
(°C)PS
(gpd)GTW (gpd)
ADS(gpd)
ADS:GTW
3 0.25 22-26 270 8.33 0.42 1:20
4 9.2 33-37 0 5.8 8 10:7
5 13 33-37 0 2.0 8 4:1
Wat
er
JAM
20
10N
C A
WW
A W
EA
20
11
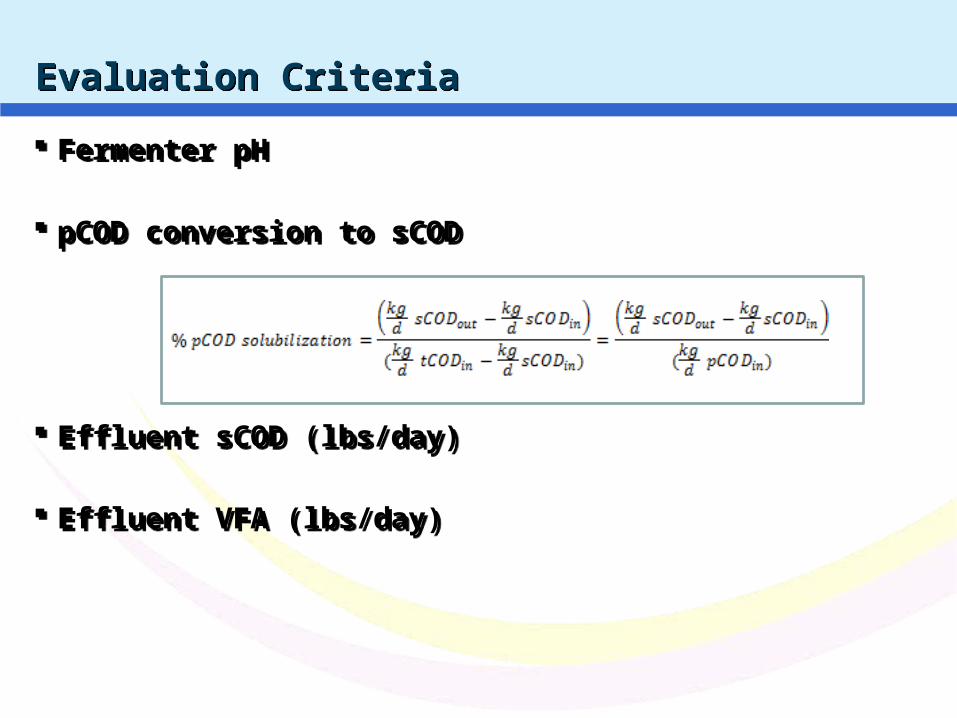
Fermenter pH
pCOD conversion to sCOD
Effluent sCOD (lbs/day)
Effluent VFA (lbs/day)
Fermenter pH
pCOD conversion to sCOD
Effluent sCOD (lbs/day)
Effluent VFA (lbs/day)
Evaluation CriteriaEvaluation Criteria
Wat
er
JAM
20
10N
C A
WW
A W
EA
20
11
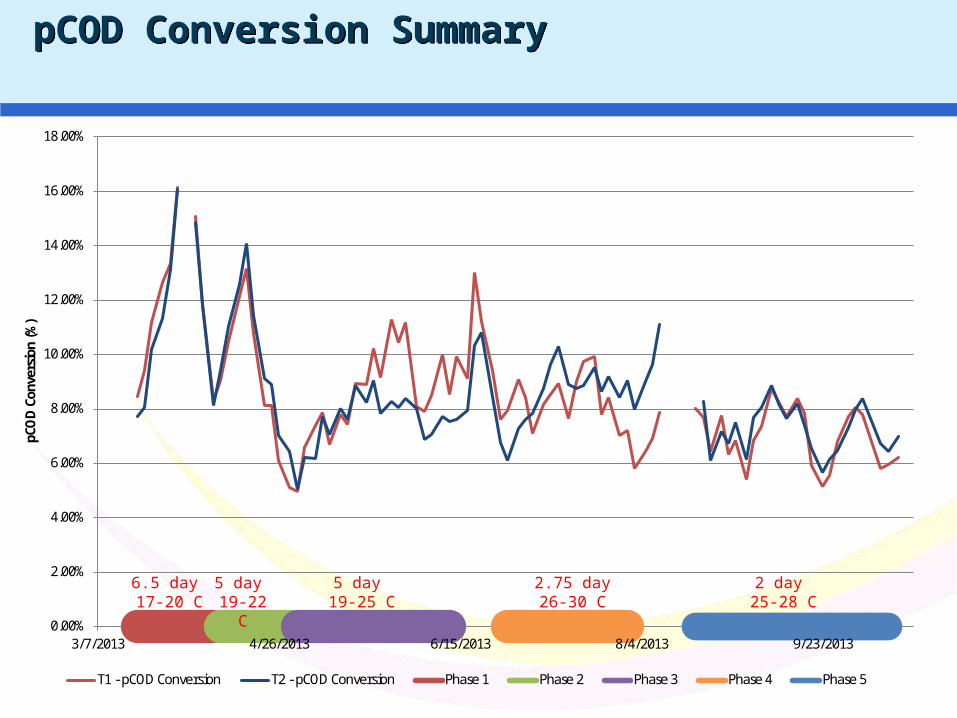
pCOD Conversion SummarypCOD Conversion Summary
0.00%
2.00%
4.00%
6.00%
8.00%
10.00%
12.00%
14.00%
16.00%
18.00%
3/7/2013 4/26/2013 6/15/2013 8/4/2013 9/23/2013
pCO
D C
onve
rsio
n (%
)
T1 - pCOD Conversion T2 - pCOD Conversion Phase 1 Phase 2 Phase 3 Phase 4 Phase 5
6.5 day 17-20 C
5 day 19-22 C
5 day 19-25 C
2.75 day 26-30 C
2 day 25-28 C
Wat
er
JAM
20
10N
C A
WW
A W
EA
20
11
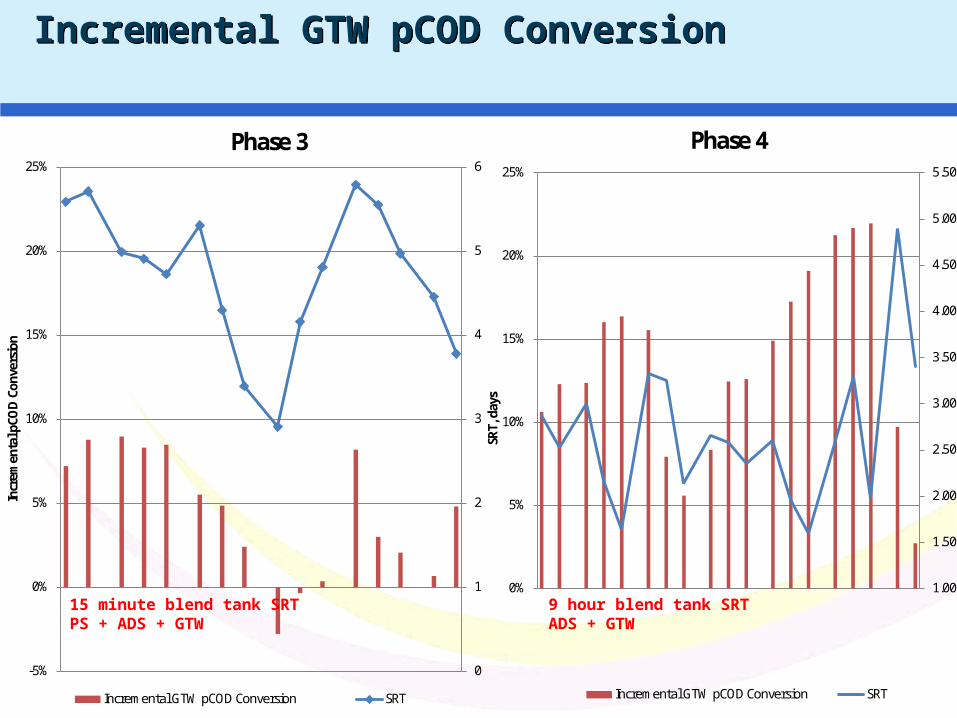
Incremental GTW pCOD ConversionIncremental GTW pCOD Conversion
-5%
0%
5%
10%
15%
20%
25%
0
1
2
3
4
5
6
Incr
emen
tal p
COD
Con
vers
ion
SRT,
day
s
Phase 3
Incremental GTW pCOD Conversion SRT
1.00
1.50
2.00
2.50
3.00
3.50
4.00
4.50
5.00
5.50
0%
5%
10%
15%
20%
25%
Phase 4
Incremental GTW pCOD Conversion SRT
15 minute blend tank SRTPS + ADS + GTW
9 hour blend tank SRTADS + GTW
Wat
er
JAM
20
10N
C A
WW
A W
EA
20
11
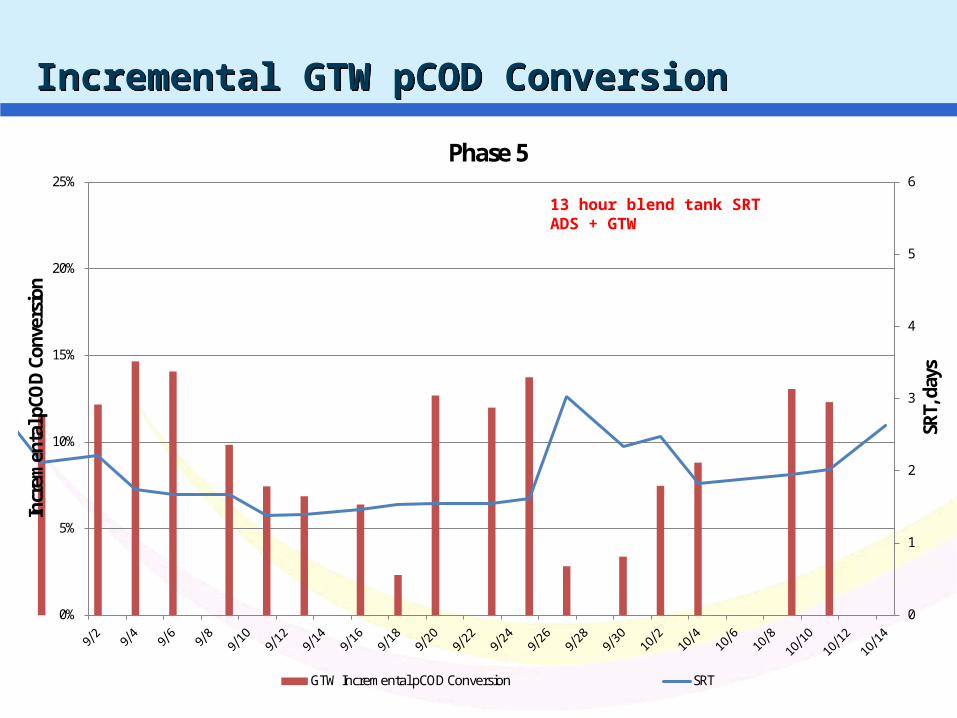
Incremental GTW pCOD ConversionIncremental GTW pCOD Conversion
0
1
2
3
4
5
6
0%
5%
10%
15%
20%
25%
SRT,
day
s
Incr
emen
tal p
COD
Con
vers
ion
Phase 5
GTW Incremental pCOD Conversion SRT
13 hour blend tank SRTADS + GTW
Wat
er
JAM
20
10N
C A
WW
A W
EA
20
11
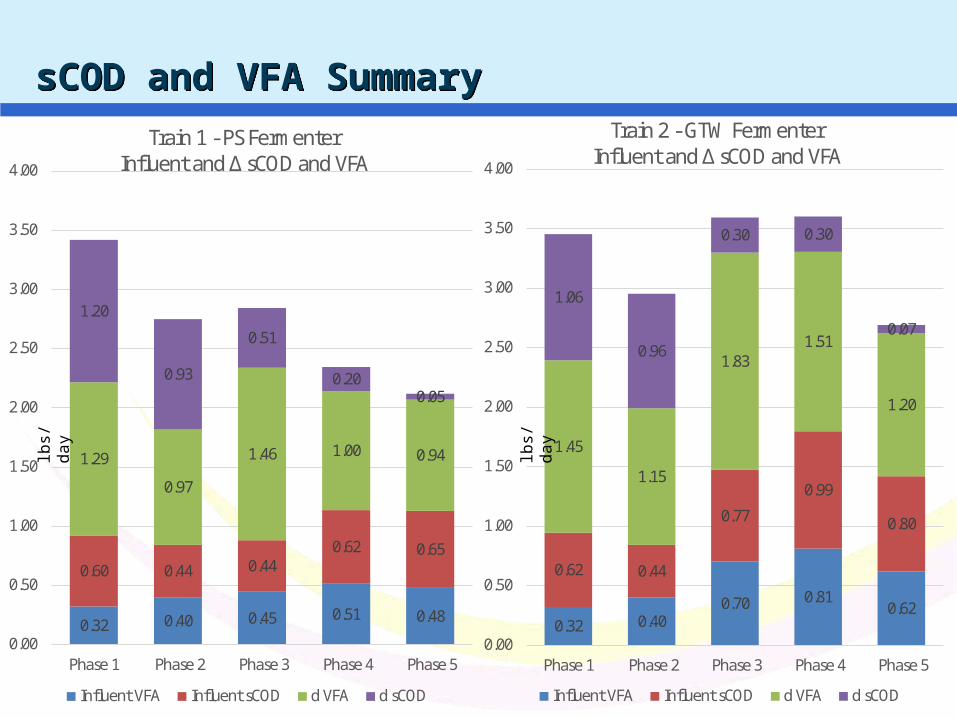
sCOD and VFA SummarysCOD and VFA Summary
0.32 0.40 0.45 0.51 0.48
0.60 0.44 0.440.62 0.65
1.29
0.97
1.46 1.00 0.94
1.20
0.93
0.51
0.200.05
0.00
0.50
1.00
1.50
2.00
2.50
3.00
3.50
4.00
Phase 1 Phase 2 Phase 3 Phase 4 Phase 5
Train 1 - PS FermenterInfluent and ∆ sCOD and VFA
Influent VFA Influent sCOD d VFA d sCOD
0.32 0.400.70 0.81
0.62
0.62 0.44
0.77
0.99
0.80
1.45
1.15
1.831.51
1.20
1.06
0.96
0.30 0.30
0.07
0.00
0.50
1.00
1.50
2.00
2.50
3.00
3.50
4.00
Phase 1 Phase 2 Phase 3 Phase 4 Phase 5
Train 2 - GTW FermenterInfluent and ∆ sCOD and VFA
Influent VFA Influent sCOD d VFA d sCOD
lbs/
da
y
lbs/
da
y
Wat
er
JAM
20
10N
C A
WW
A W
EA
20
11
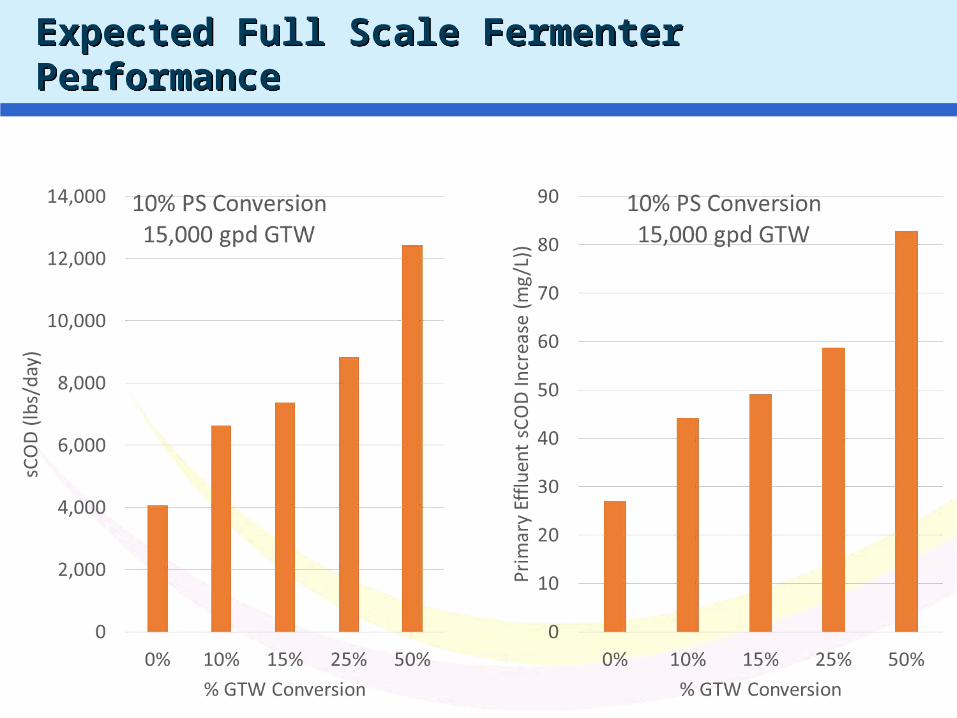
Expected Full Scale Fermenter PerformanceExpected Full Scale Fermenter Performance
Wat
er
JAM
20
10N
C A
WW
A W
EA
20
11
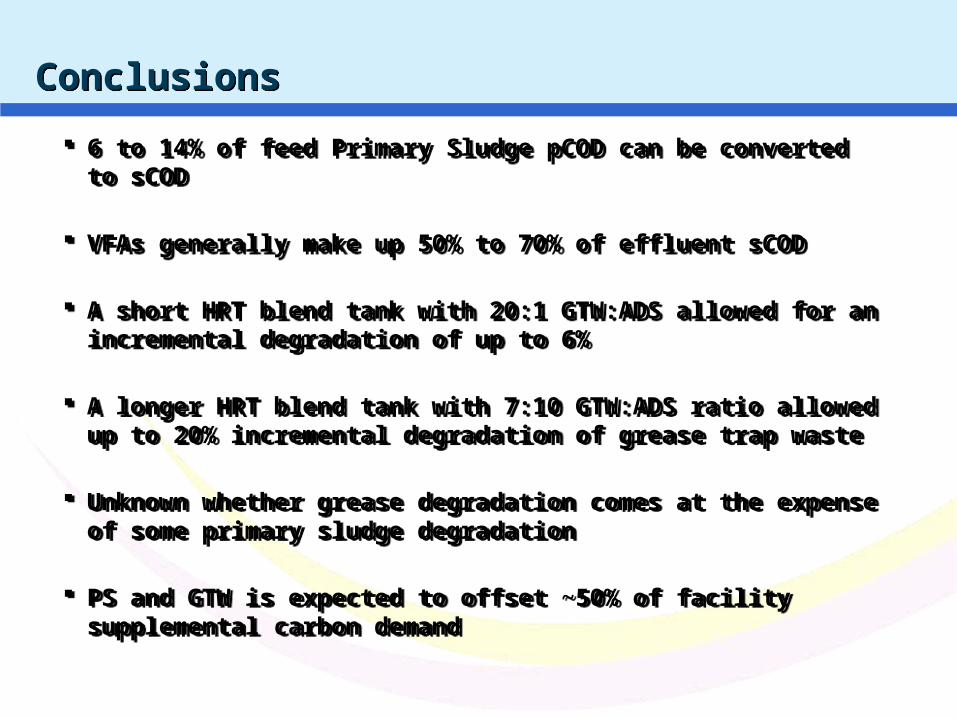
ConclusionsConclusions
6 to 14% of feed Primary Sludge pCOD can be converted to sCOD
VFAs generally make up 50% to 70% of effluent sCOD
A short HRT blend tank with 20:1 GTW:ADS allowed for an incremental degradation of up to 6%
A longer HRT blend tank with 7:10 GTW:ADS ratio allowed up to 20% incremental degradation of grease trap waste
Unknown whether grease degradation comes at the expense of some primary sludge degradation
PS and GTW is expected to offset ~50% of facility supplemental carbon demand

Wat
er
JAM
20
10N
C A
WW
A W
EA
20
11
Next StepsNext Steps
Continue blend tank modifications to determine effect on LCFA degradation
Possible staged fermentation
Bench Scale SBRs to determine fermentate value as supplemental carbon source
Denitrification Biological Phosphorus Removal
Business Case Evaluation
Continue blend tank modifications to determine effect on LCFA degradation
Possible staged fermentation
Bench Scale SBRs to determine fermentate value as supplemental carbon source
Denitrification Biological Phosphorus Removal
Business Case Evaluation

Wat
er
JAM
20
10N
C A
WW
A W
EA
20
11
Henrico County Water Reclamation FacilityHenrico County Water Reclamation Facility
75 mgd Facility
Low TN and TP Limits
Wat
er
JAM
20
10N
C A
WW
A W
EA
20
11
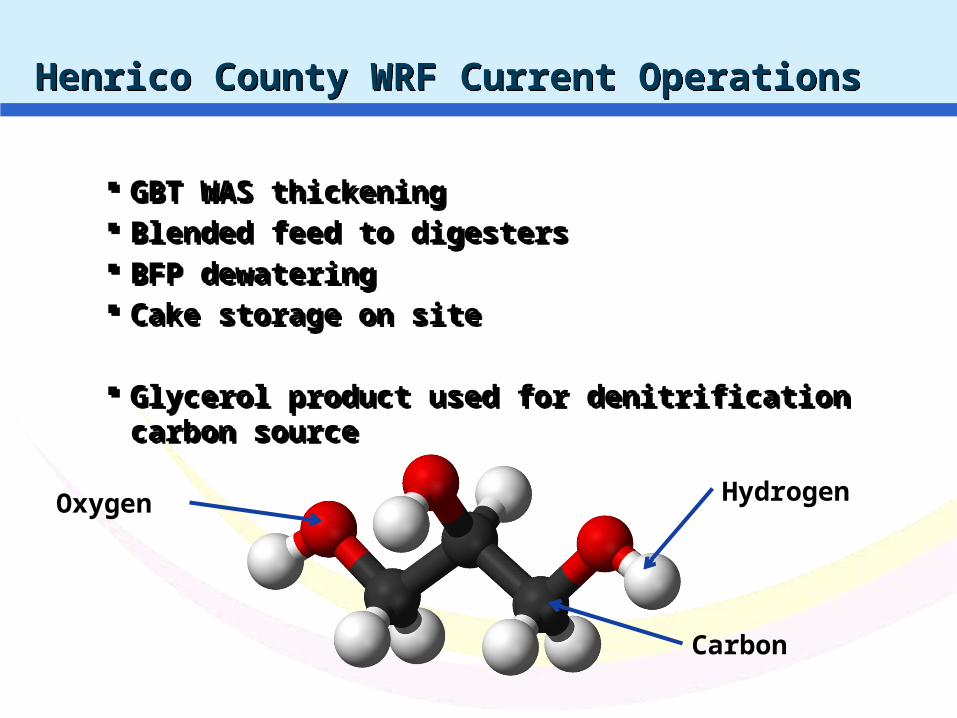
Henrico County WRF Current OperationsHenrico County WRF Current Operations
GBT WAS thickening Blended feed to digesters BFP dewatering Cake storage on site
Glycerol product used for denitrification carbon source
GBT WAS thickening Blended feed to digesters BFP dewatering Cake storage on site
Glycerol product used for denitrification carbon source
Carbon
Oxygen Hydrogen

Wat
er
JAM
20
10W
ate
r JA
M 2
011
What is OpenCEL?What is OpenCEL?
Wat
er
JAM
20
10N
C A
WW
A W
EA
20
11
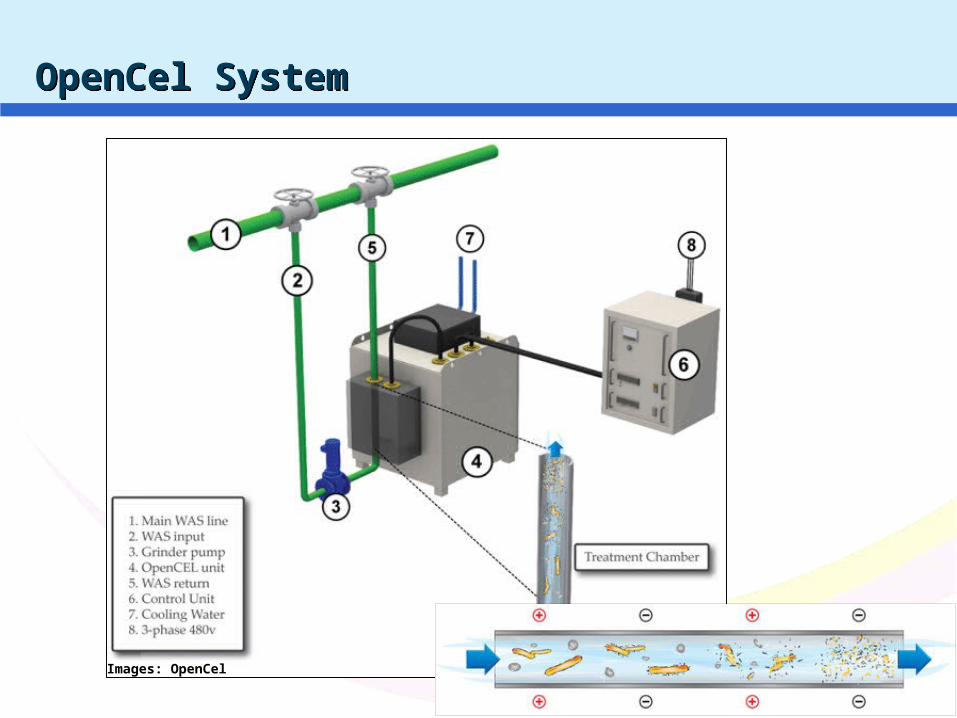
OpenCel SystemOpenCel System
Images: OpenCel
Wat
er
JAM
20
10N
C A
WW
A W
EA
20
11
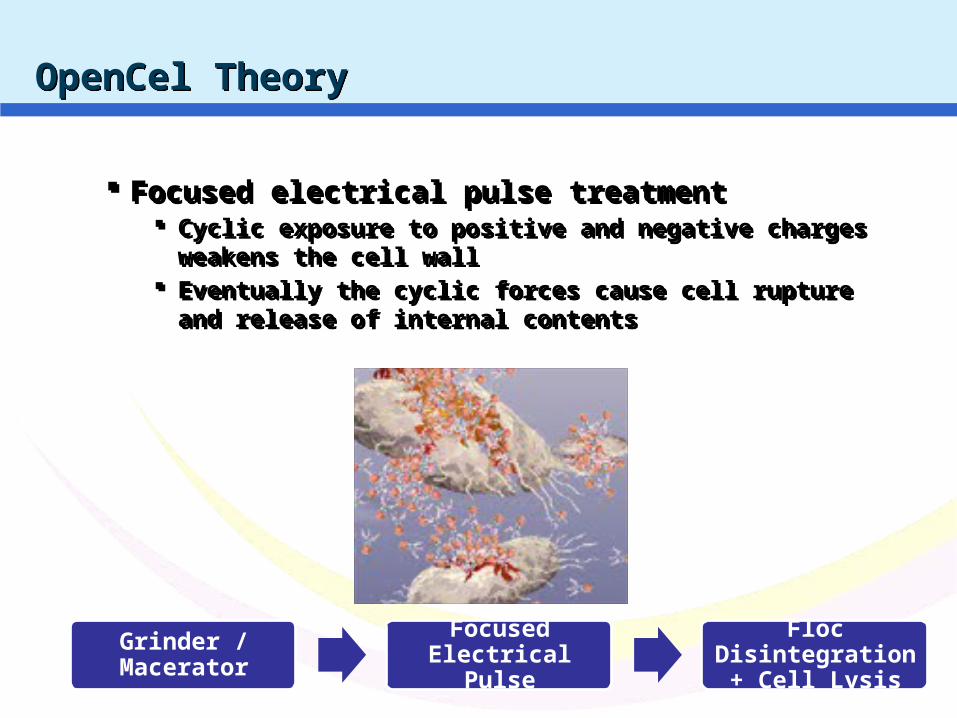
OpenCel TheoryOpenCel Theory
Focused electrical pulse treatment Cyclic exposure to positive and negative charges weakens the
cell wall Eventually the cyclic forces cause cell rupture and release of
internal contents
Focused electrical pulse treatment Cyclic exposure to positive and negative charges weakens the
cell wall Eventually the cyclic forces cause cell rupture and release of
internal contents
Grinder / Macerator
Focused Electrical Pulse
Floc Disintegration +
Cell Lysis
Wat
er
JAM
20
10N
C A
WW
A W
EA
20
11
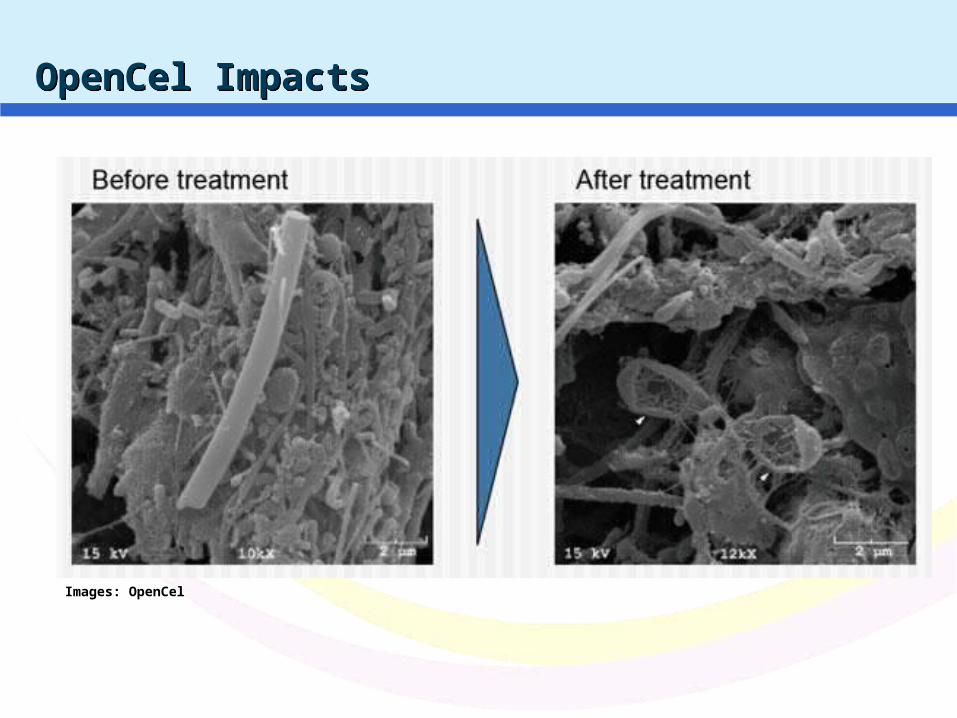
OpenCel ImpactsOpenCel Impacts
Images: OpenCel
Wat
er
JAM
20
10N
C A
WW
A W
EA
20
11
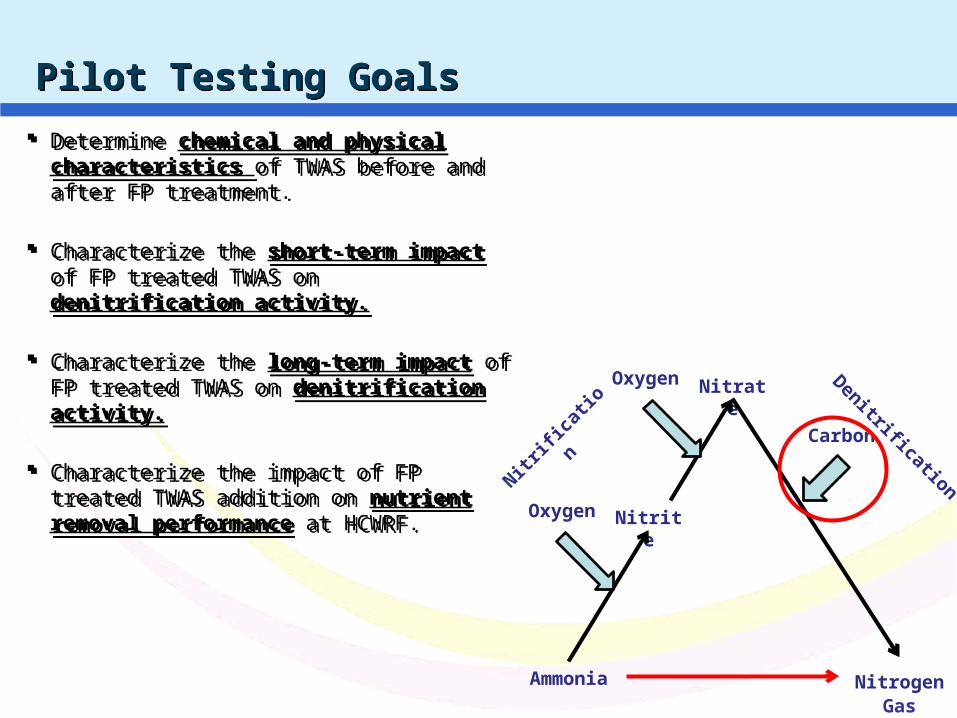
Pilot Testing GoalsPilot Testing Goals
Determine chemical and physical characteristics of TWAS before and after FP treatment.
Characterize the short-term impact of FP treated TWAS on denitrification activity.
Characterize the long-term impact of FP treated TWAS on denitrification activity.
Characterize the impact of FP treated TWAS addition on nutrient removal performance at HCWRF.
Ammonia
Nitrite
Nitrate
Nitrogen Gas
Oxygen
Oxygen
Carbon
Nitrifi
catio
nDenitrification

Wat
er
JAM
20
10N
C A
WW
A W
EA
20
11
Experimental ConfigurationExperimental Configuration
Indicates composite sampling point
Glycerin storage
GlycerinPE
RAS
Indicates profile sampling point
Glycerin storage
Treated TWAS
Test Basin
Glycerin
Glycerin storage
Control Basin
TB1
TB2 TB3TB4 TB5 TB6 TB7
TBC1
TBC2
CBC1
CB1
CB2CB3 CB4 CB5 CB6
Wat
er
JAM
20
10N
C A
WW
A W
EA
20
11
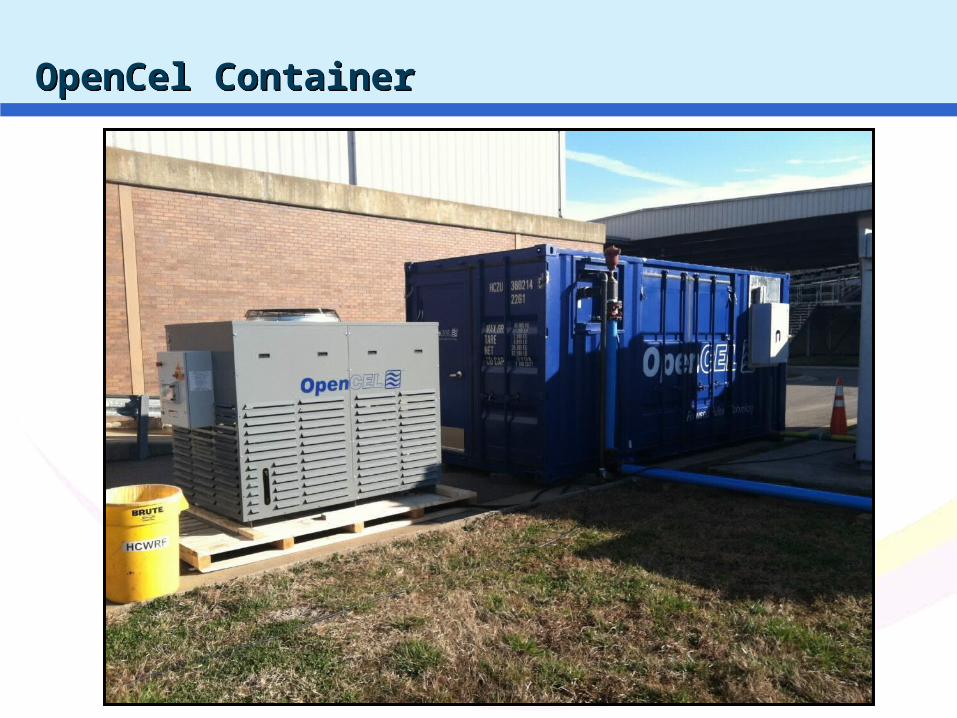
OpenCel ContainerOpenCel Container
Wat
er
JAM
20
10N
C A
WW
A W
EA
20
11
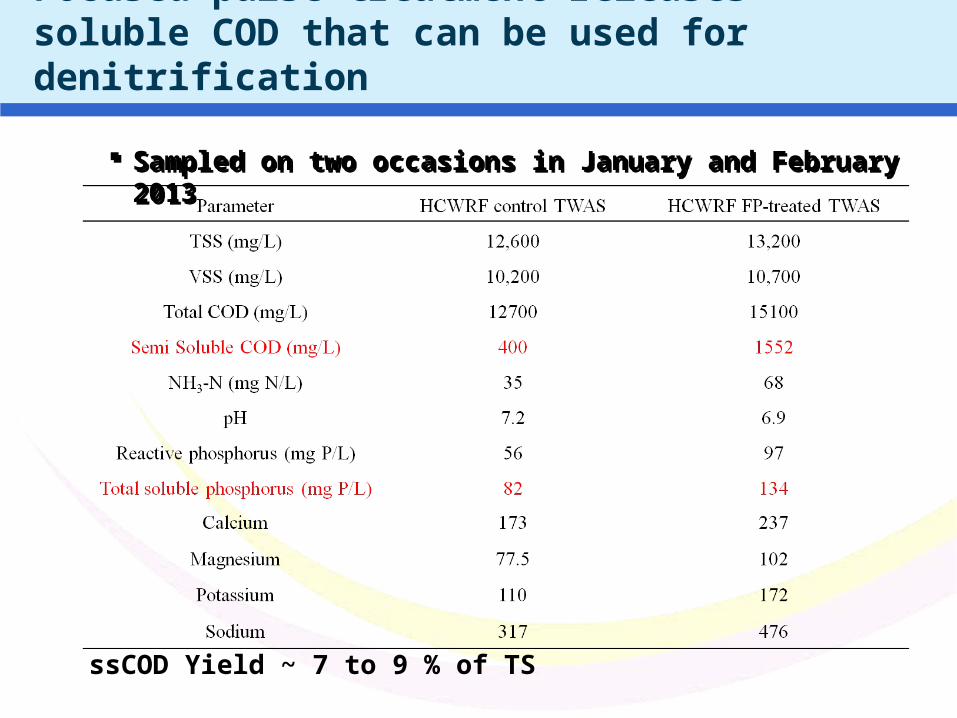
Sampled on two occasions in January and February 2013 Sampled on two occasions in January and February 2013
ssCOD Yield ~ 7 to 9 % of TS
Focused pulse treatment releases soluble COD that can be used for denitrification
Wat
er
JAM
20
10N
C A
WW
A W
EA
20
11
0.00
0.10
0.20
0.30
0.40
0.50
0.60
0.70
0.80
Non-treated TWAS
OpenCel treated TWAS
OpenCel treated TWAS Centrate
Glycerol
Sp
ecif
ic n
itra
te r
edu
ctio
n r
ate
(mg
NO
3-N
/g V
SS
-hr)
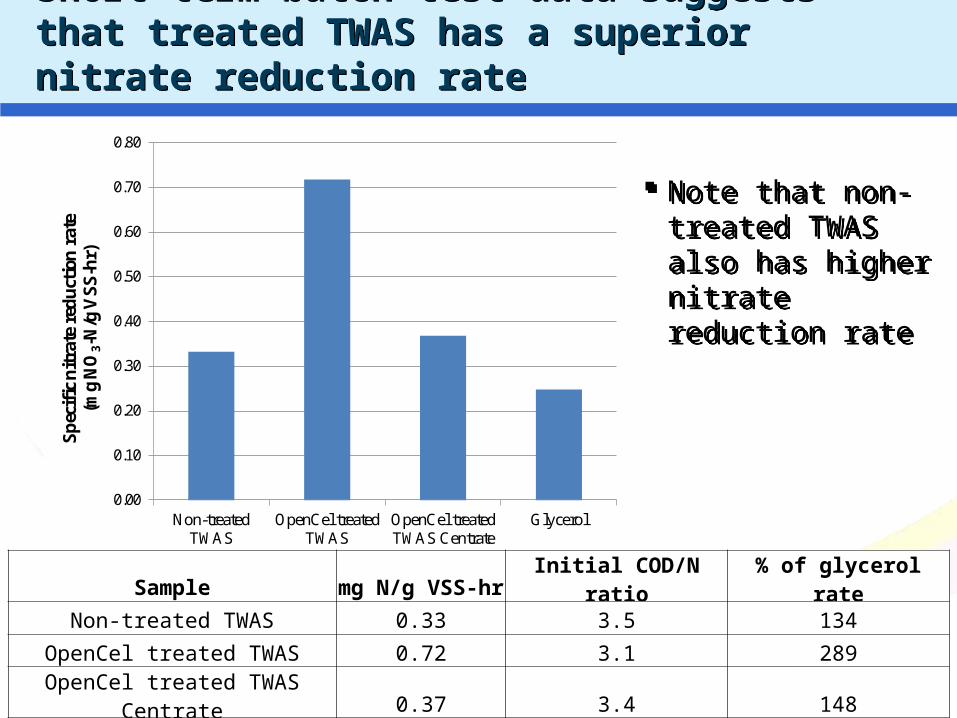
Short term batch test data suggests that treated TWAS has a superior nitrate reduction rateShort term batch test data suggests that treated TWAS has a superior nitrate reduction rate
Note that non-treated TWAS also has higher nitrate reduction rate
Note that non-treated TWAS also has higher nitrate reduction rate
3131
Sample mg N/g VSS-hr Initial COD/N ratio % of glycerol rate
Non-treated TWAS 0.33 3.5 134
OpenCel treated TWAS 0.72 3.1 289
OpenCel treated TWAS Centrate 0.37 3.4 148
Glycerol 0.25 3.4 -
Wat
er
JAM
20
10N
C A
WW
A W
EA
20
11
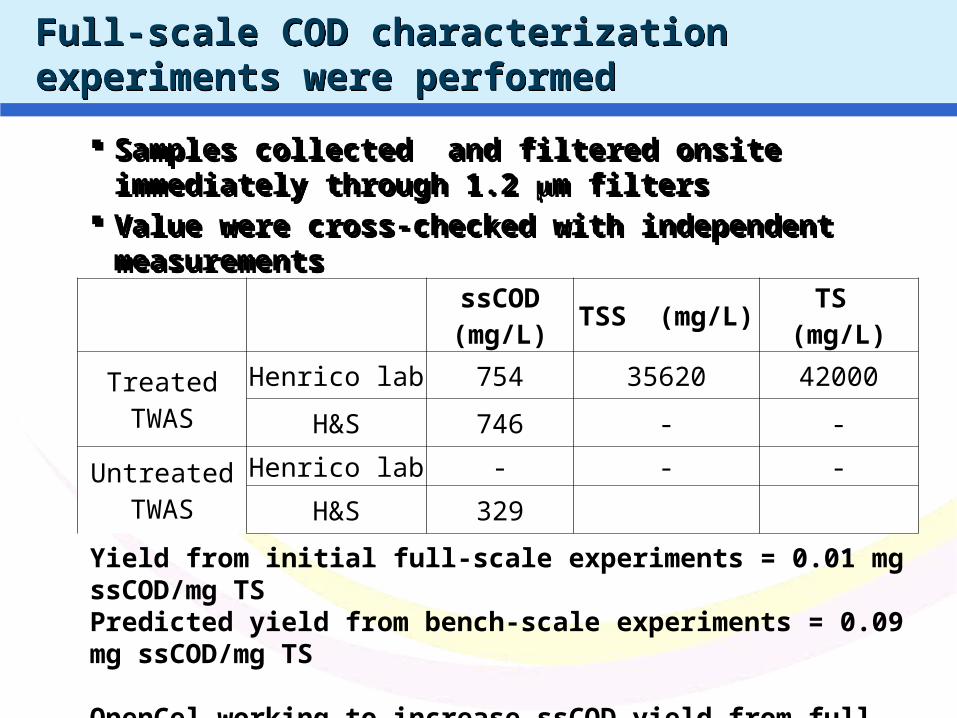
Full-scale COD characterization experiments were performedFull-scale COD characterization experiments were performed
Samples collected and filtered onsite immediately through 1.2 mm filters
Value were cross-checked with independent measurements
Samples collected and filtered onsite immediately through 1.2 mm filters
Value were cross-checked with independent measurements
ssCOD (mg/L) TSS (mg/L) TS (mg/L)
Treated TWASHenrico lab 754 35620 42000
H&S 746 - -
Untreated TWAS
Henrico lab - - -
H&S 329
Yield from initial full-scale experiments = 0.01 mg ssCOD/mg TSPredicted yield from bench-scale experiments = 0.09 mg ssCOD/mg TS
OpenCel working to increase ssCOD yield from full-scale pilot
Wat
er
JAM
20
10N
C A
WW
A W
EA
20
11
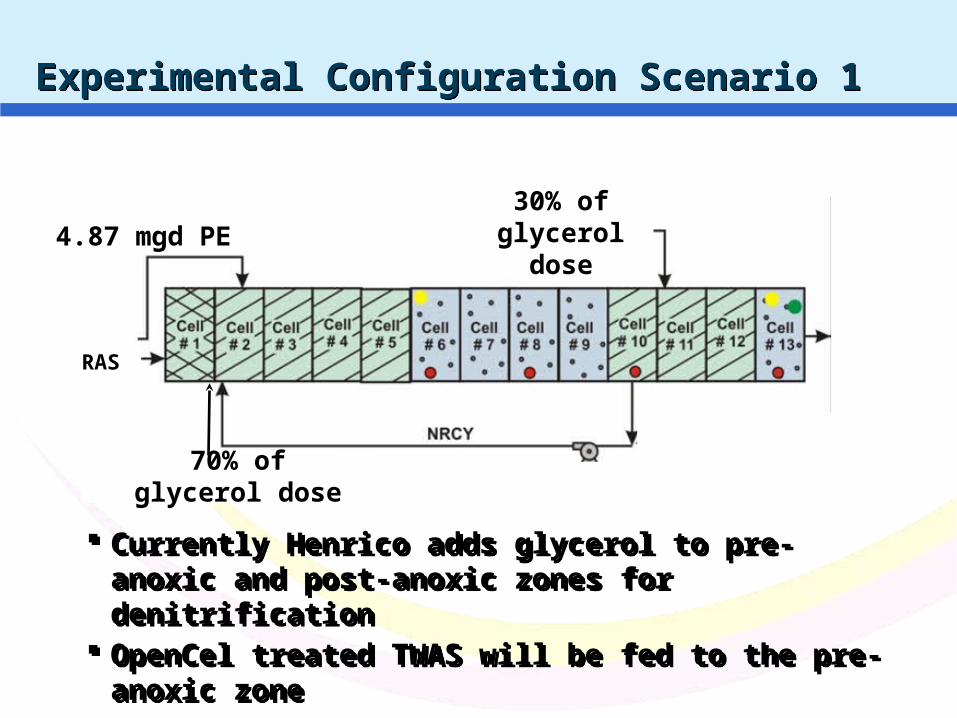
Experimental Configuration Scenario 1Experimental Configuration Scenario 1
Currently Henrico adds glycerol to pre-anoxic and post-anoxic zones for denitrification
OpenCel treated TWAS will be fed to the pre-anoxic zone
Currently Henrico adds glycerol to pre-anoxic and post-anoxic zones for denitrification
OpenCel treated TWAS will be fed to the pre-anoxic zone
30% of glycerol
dose
70% of glycerol dose
4.87 mgd PE
RAS
Wat
er
JAM
20
10N
C A
WW
A W
EA
20
11
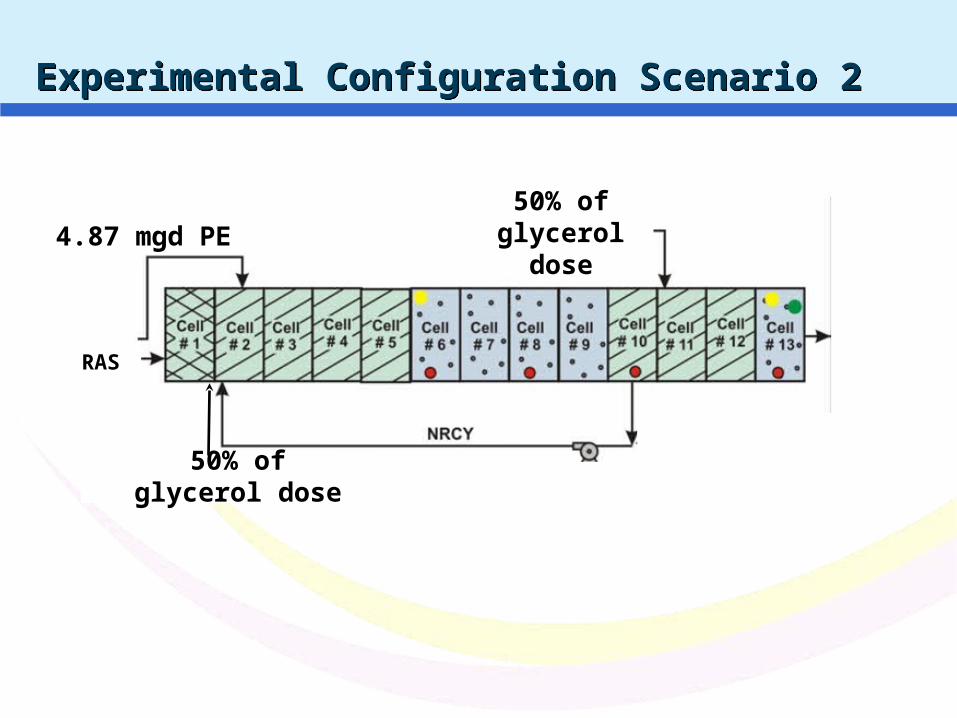
Experimental Configuration Scenario 2Experimental Configuration Scenario 2
50% of glycerol
dose
50% of glycerol dose
4.87 mgd PE
RAS
Wat
er
JAM
20
10N
C A
WW
A W
EA
20
11
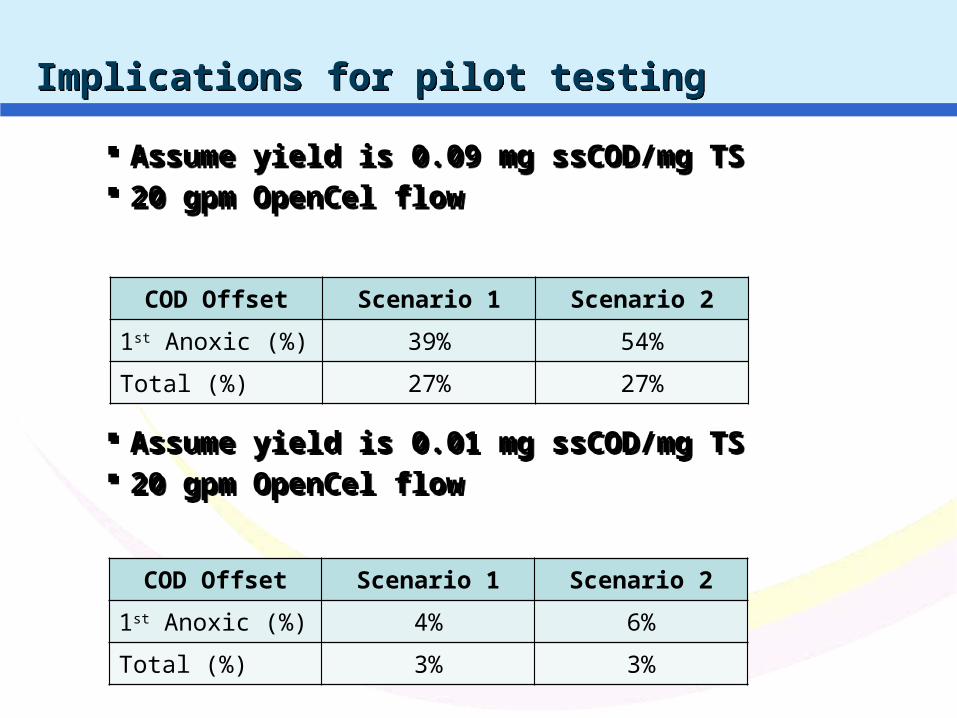
Implications for pilot testingImplications for pilot testing
Assume yield is 0.09 mg ssCOD/mg TS 20 gpm OpenCel flow
Assume yield is 0.01 mg ssCOD/mg TS 20 gpm OpenCel flow
Assume yield is 0.09 mg ssCOD/mg TS 20 gpm OpenCel flow
Assume yield is 0.01 mg ssCOD/mg TS 20 gpm OpenCel flow
COD Offset Scenario 1 Scenario 2
1st Anoxic (%) 39% 54%
Total (%) 27% 27%
COD Offset Scenario 1 Scenario 2
1st Anoxic (%) 4% 6%
Total (%) 3% 3%
Wat
er
JAM
20
10N
C A
WW
A W
EA
20
11
Additional ConsiderationsAdditional Considerations
FP treated TWAS will return significant TSS
MLSS will increase if wasting is not increased
Increased wasting will reduce cell residence time May impact nitrification
TWAS recycle can act as bioaugmentation if cells are not inactivated
FP treated TWAS will return significant TSS
MLSS will increase if wasting is not increased
Increased wasting will reduce cell residence time May impact nitrification
TWAS recycle can act as bioaugmentation if cells are not inactivated
Wat
er
JAM
20
10N
C A
WW
A W
EA
20
11
Insights from Process ModelingInsights from Process Modeling
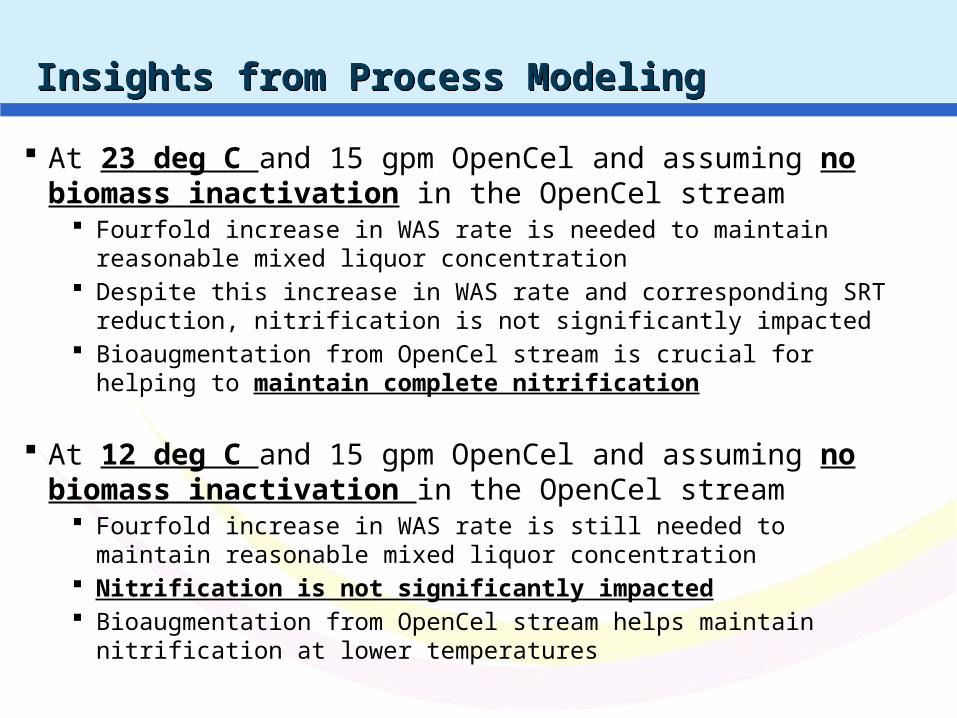
At 23 deg C and 15 gpm OpenCel and assuming no biomass inactivation in the OpenCel stream
Fourfold increase in WAS rate is needed to maintain reasonable mixed liquor concentration
Despite this increase in WAS rate and corresponding SRT reduction, nitrification is not significantly impacted
Bioaugmentation from OpenCel stream is crucial for helping to maintain complete nitrification
At 12 deg C and 15 gpm OpenCel and assuming no biomass inactivation in the OpenCel stream
Fourfold increase in WAS rate is still needed to maintain reasonable mixed liquor concentration
Nitrification is not significantly impacted Bioaugmentation from OpenCel stream helps maintain nitrification at lower
temperatures
Wat
er
JAM
20
10N
C A
WW
A W
EA
20
11
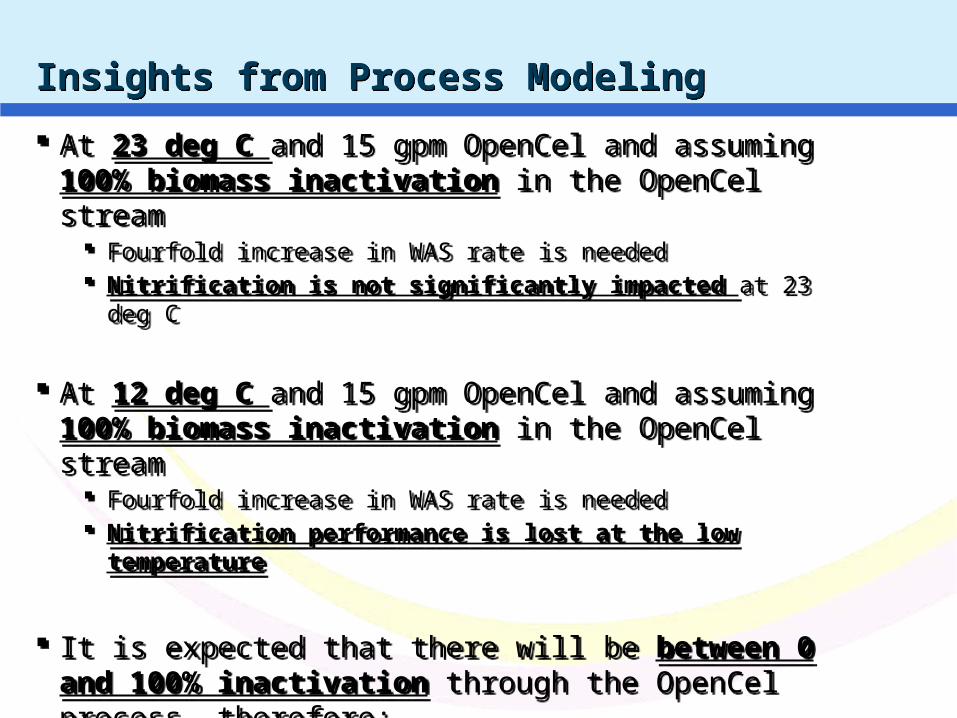
At 23 deg C and 15 gpm OpenCel and assuming 100% biomass inactivation in the OpenCel stream
Fourfold increase in WAS rate is needed Nitrification is not significantly impacted at 23 deg C
At 12 deg C and 15 gpm OpenCel and assuming 100% biomass inactivation in the OpenCel stream
Fourfold increase in WAS rate is needed Nitrification performance is lost at the low temperature
It is expected that there will be between 0 and 100% inactivation through the OpenCel process, therefore:
Actual impact on nitrification will closely depend on the degree of inactivation as well as the mass of solids that will be recycled
Insights from Process ModelingInsights from Process Modeling
Wat
er
JAM
20
10N
C A
WW
A W
EA
20
11
Next StepsNext Steps
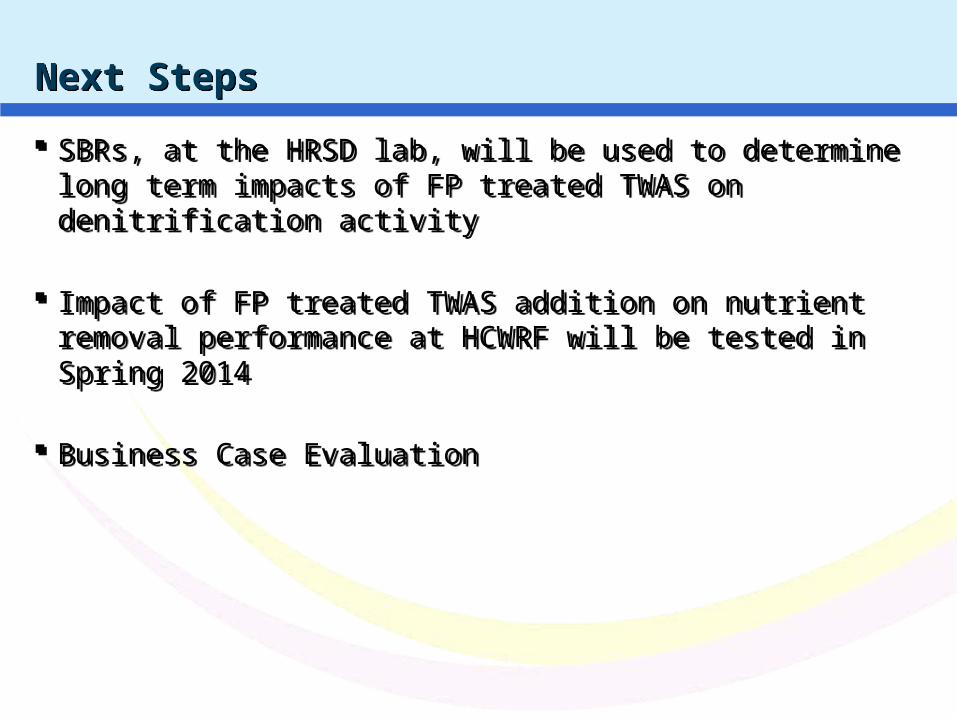
SBRs, at the HRSD lab, will be used to determine long term impacts of FP treated TWAS on denitrification activity
Impact of FP treated TWAS addition on nutrient removal performance at HCWRF will be tested in Spring 2014
Business Case Evaluation
SBRs, at the HRSD lab, will be used to determine long term impacts of FP treated TWAS on denitrification activity
Impact of FP treated TWAS addition on nutrient removal performance at HCWRF will be tested in Spring 2014
Business Case Evaluation
Wat
er
JAM
20
10N
C A
WW
A W
EA
20
11
Conclusions and Lessons LearnedConclusions and Lessons Learned
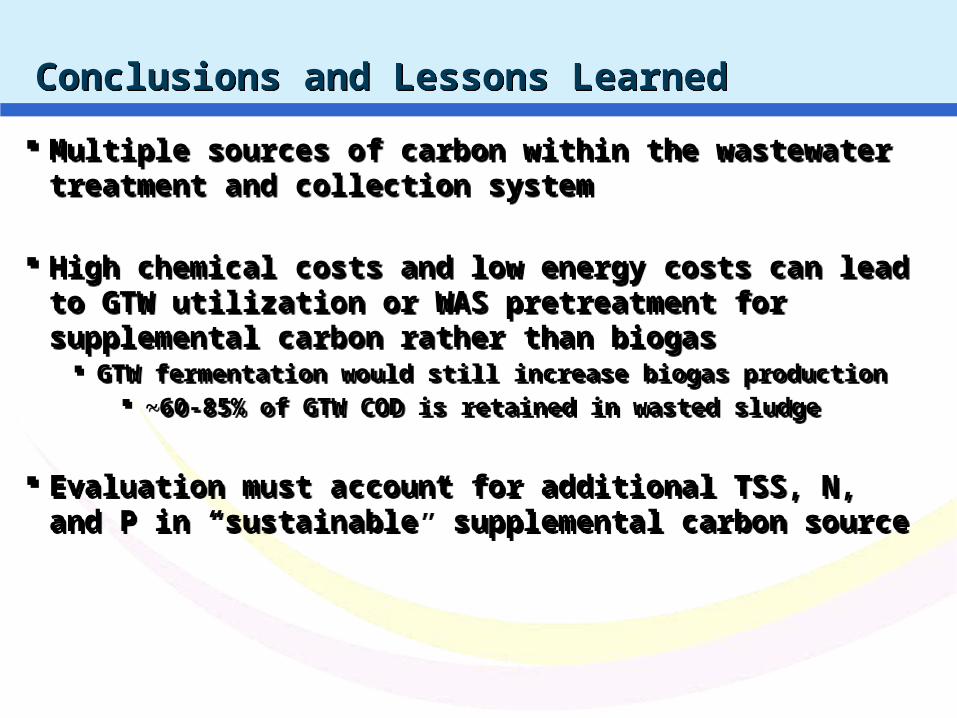
Multiple sources of carbon within the wastewater treatment and collection system
High chemical costs and low energy costs can lead to GTW utilization or WAS pretreatment for supplemental carbon rather than biogas
GTW fermentation would still increase biogas production ~60-85% of GTW COD is retained in wasted sludge
Evaluation must account for additional TSS, N, and P in “sustainable” supplemental carbon source
Wat
er
JAM
20
10N
C A
WW
A W
EA
20
11
AcknowledgmentsAcknowledgments

Wat
er
JAM
20
10N
C A
WW
A W
EA
20
11
QuestionsQuestions
Hunter Long
(919) 833-7152
?
Hunter Long
(919) 833-7152
?
Recommended
![Curriculum Vitae Lars Balzer [31.05.2019] ...lars-balzer.info/CV_lars-balzer.pdf · Curriculum Vitae Prof. Dr. Lars Balzer [31.05.2019] 3/32 Professional Experience / Beruflicher](https://img.pdfslide.us/doc/110x75/5d59923488c9933b318bbfcc/curriculum-vitae-lars-balzer-31052019-lars-curriculum-vitae-prof-dr.jpg)