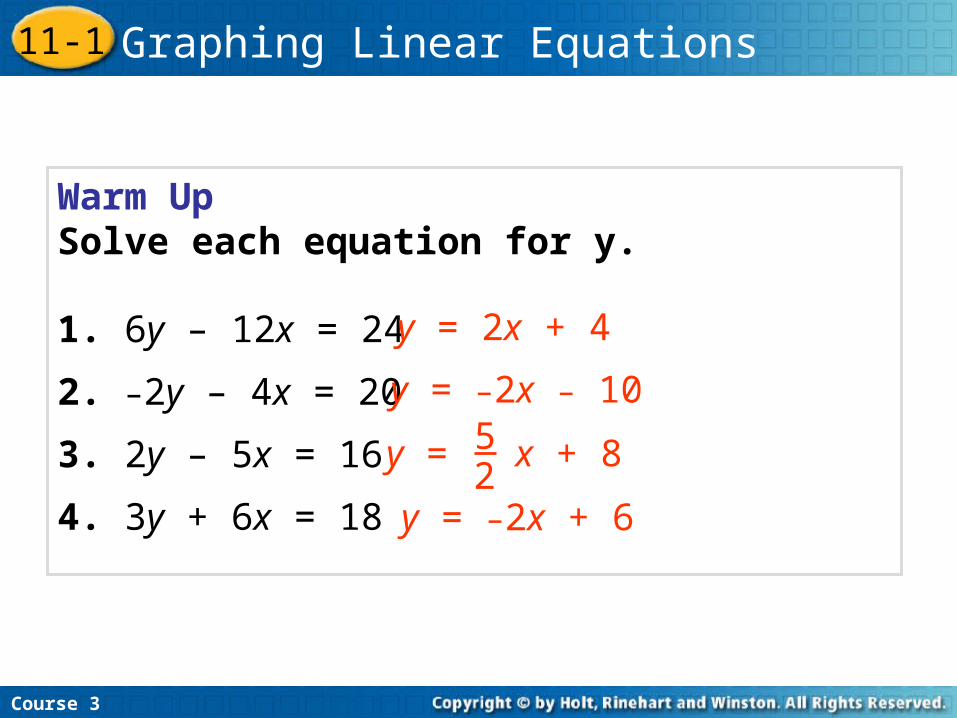
Warm UpSolve each equation for y.
1. 6y – 12x = 24
2. –2y – 4x = 20
3. 2y – 5x = 16
4. 3y + 6x = 18
y = 2x + 4
y = –2x – 10
Course 3
11-1 Graphing Linear Equations
y = –2x + 6
y = x + 852
2
Review Skills For Chapter 11
Operations with Integers (to include fractions)
Solving Multistep Equations and Inequalities i.e. solve 4m-5(m+2)=1
Solve Equations for One Variable (i.e. solve 5y-x = 4 for y)
Solve Inequalities for One Variable
3
Learn to identify and graph linear equations.
Course 3
11-1 Graphing Linear Equations
Essential Question: Explain whether an equation is linear if three ordered pair solutions lie on a straight line but a fourth does not.
Objective: 5.01a, 5.01b, 5.03Develop an understanding of function with algebraic representations and identify relations as linear or nonlinear.
4
A linear equation is an equation whose solutions fall on a line on the coordinate plane. All solutions of a particular linear equation fall on the line, and all the points on the line are solutions of the equation. To find a solution that lies between two points (x1, y1) and (x2, y2), choose an x-value between x1 and x2 and find the corresponding y-value.
Course 3
11-1 Graphing Linear Equations
Vocabulary (Add to vocabulary folder)
5
Insert Lesson Title Here
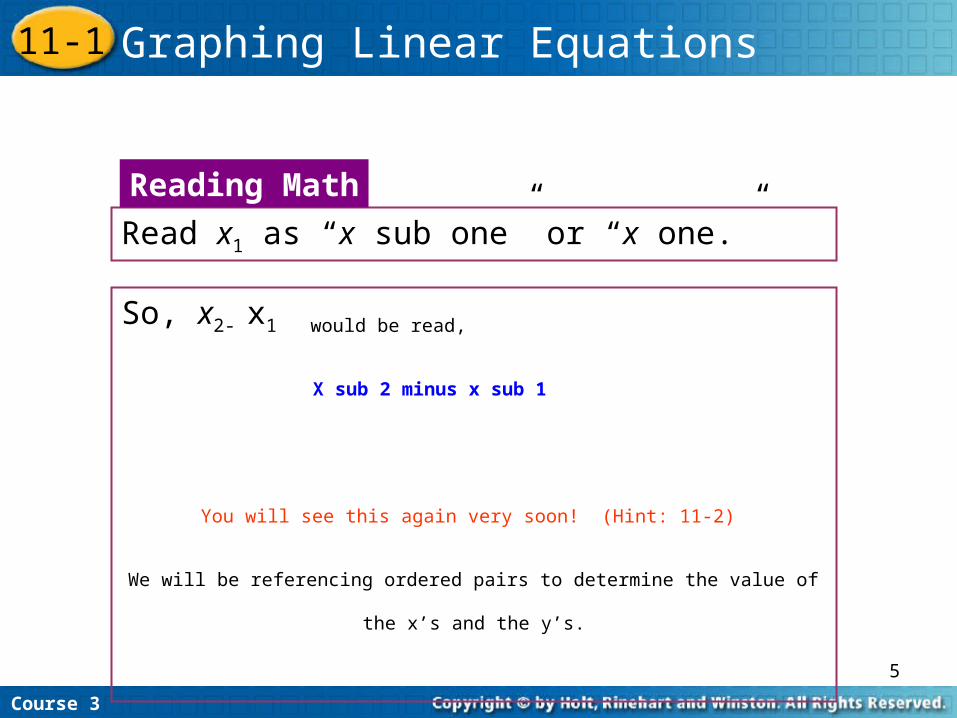
Read x1 as “x sub one” or “x one.”
Reading Math
Course 3
11-1 Graphing Linear Equations
So, x2- x1 would be read,
X sub 2 minus x sub 1
You will see this again very soon! (Hint: 11-2)
We will be referencing ordered pairs to determine the value of the x’s and
the y’s.
6
Common Error Alert!
Students may incorrectly graph a point so that it is not collinear with the others. Encourage students to double check any points that are not collinear.
(Collinear – points lying on the same line)
In short, if you graph a point and it is NOT on the line, double check your work to ensure that you have not made a mistake!
7
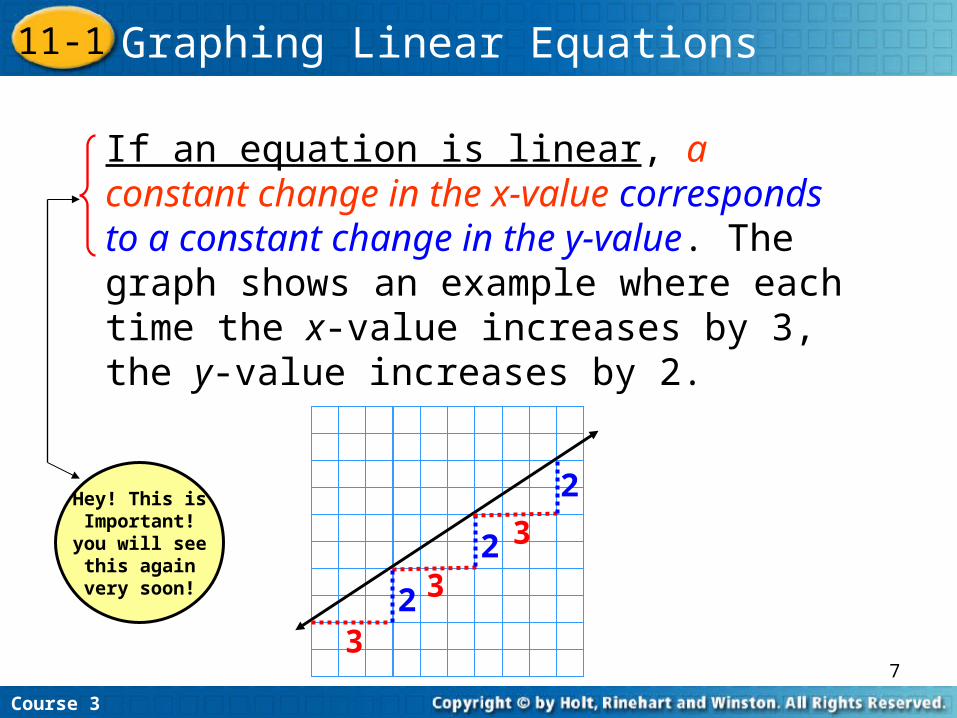
If an equation is linear, a constant change in the x-value corresponds to a constant change in the y-value. The graph shows an example where each time the x-value increases by 3, the y-value increases by 2.
3
3
3
2
2
2
Course 3
11-1 Graphing Linear Equations
Hey! This isImportant!you will seethis againvery soon!
8
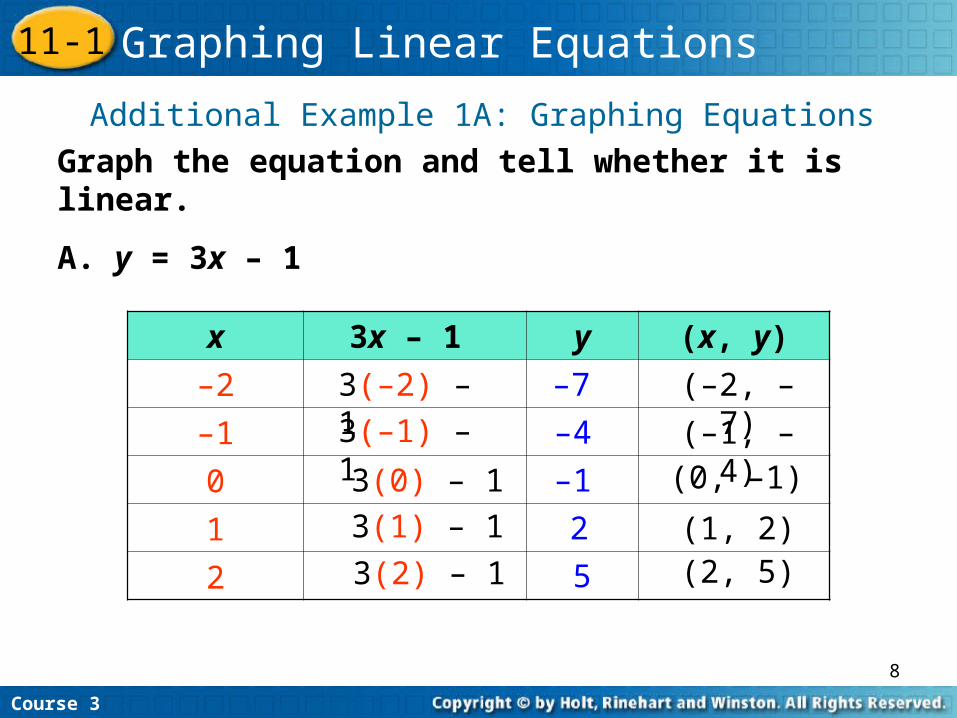
Graph the equation and tell whether it is linear.
A. y = 3x – 1
Additional Example 1A: Graphing Equations
x 3x – 1 y (x, y)
–2
–1
0
1
2
–73(–2) – 13(–1) – 1
3(0) – 13(1) – 1
3(2) – 1
–4
–1
2
5
(–2, –7)
(–1, –4)(0, –1)
(1, 2)(2, 5)
Course 3
11-1 Graphing Linear Equations
9
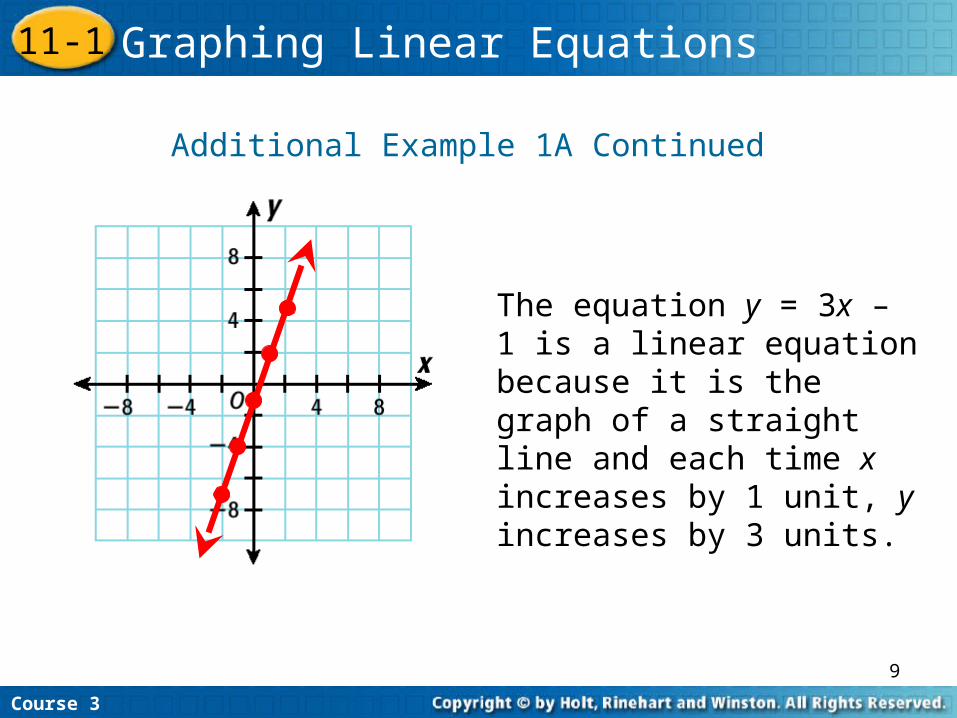
Additional Example 1A Continued
The equation y = 3x – 1 is a linear equation because it is the graph of a straight line and each time x increases by 1 unit, y increases by 3 units.
Course 3
11-1 Graphing Linear Equations
10
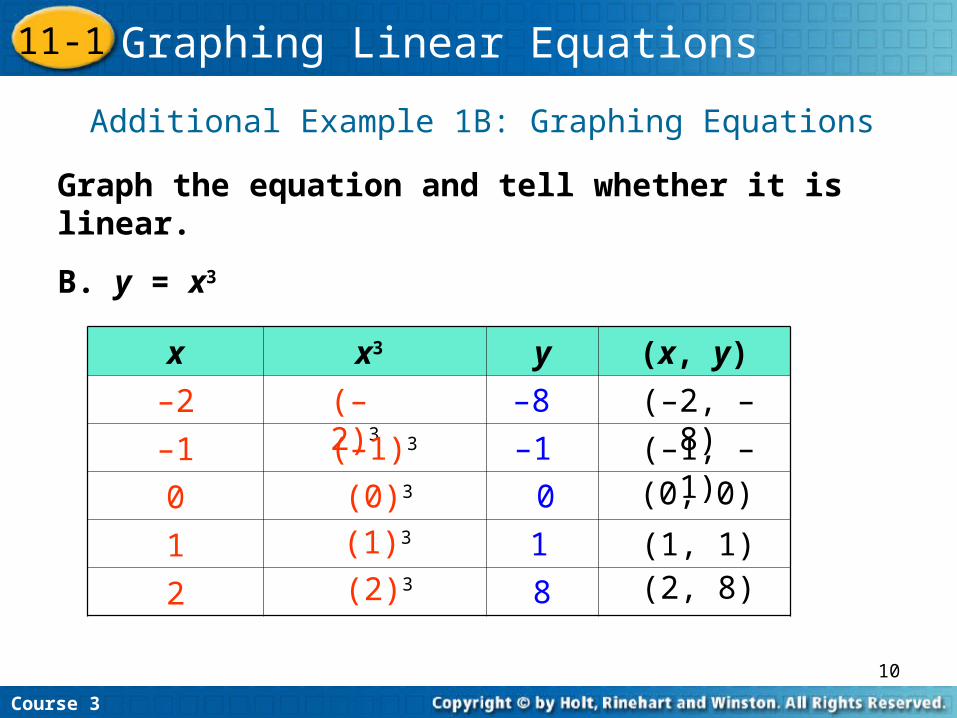
Graph the equation and tell whether it is linear.
B. y = x3
Additional Example 1B: Graphing Equations
x x3 y (x, y)
–2
–1
0
1
2
–8(–2)3
(–1)3
(0)3
(1)3
(2)3
–1
0
1
8
(–2, –8)
(–1, –1)(0, 0)
(1, 1)(2, 8)
Course 3
11-1 Graphing Linear Equations
11
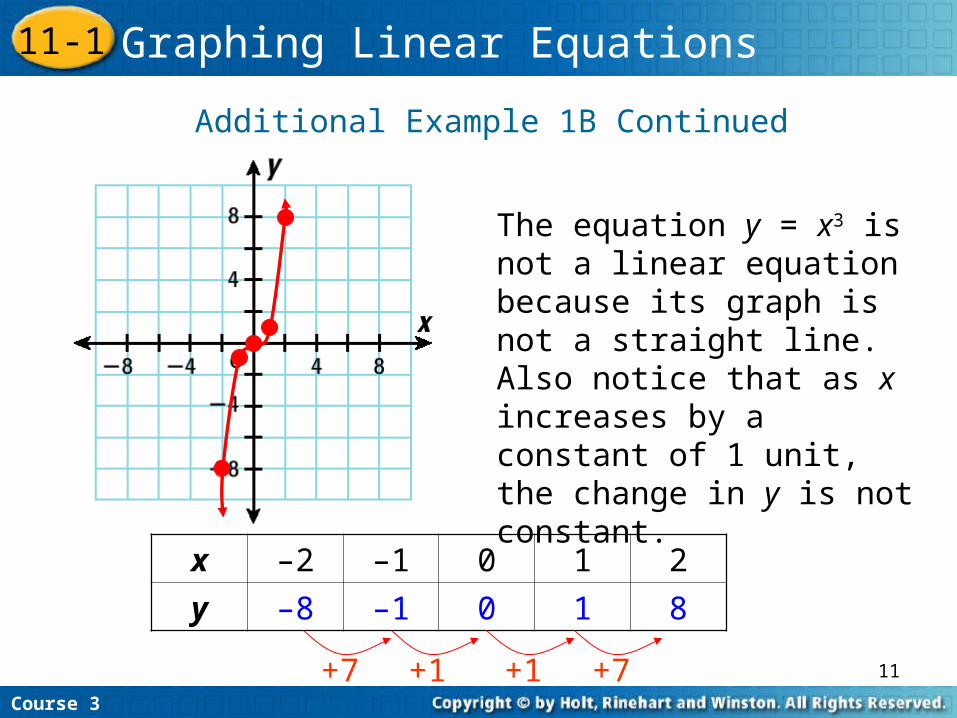
Additional Example 1B Continued
The equation y = x3 is not a linear equation because its graph is not a straight line. Also notice that as x increases by a constant of 1 unit, the change in y is not constant.
x –2 –1 0 1 2
y –8 –1 0 1 8
+7 +1 +1 +7Course 3
11-1 Graphing Linear Equations
12
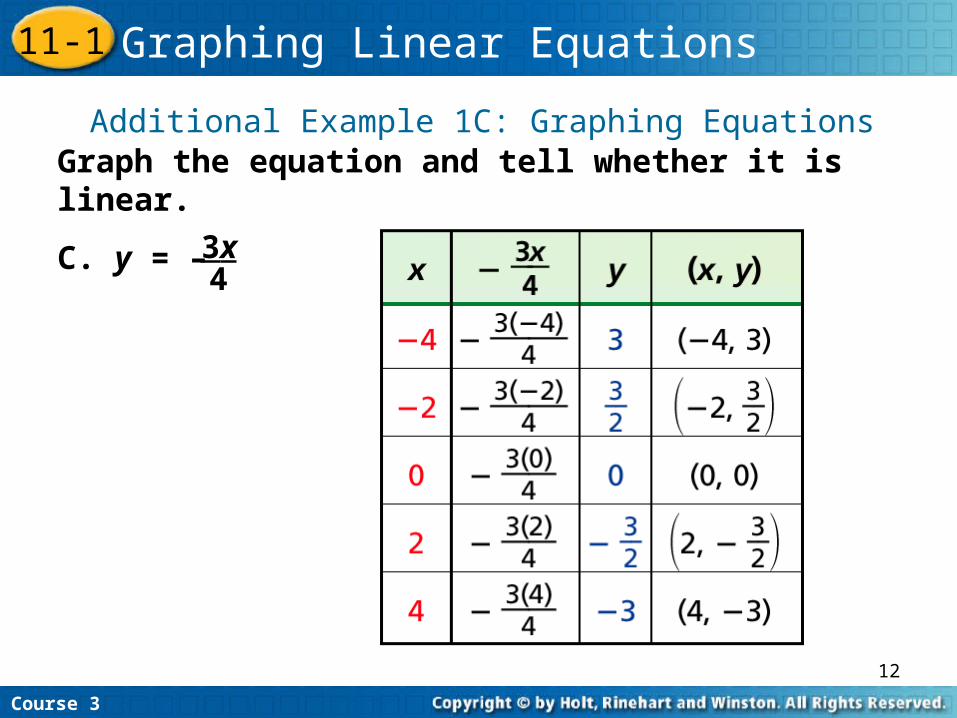
Additional Example 1C: Graphing EquationsGraph the equation and tell whether it is linear.
C. y = – 3x4
Course 3
11-1 Graphing Linear Equations
13
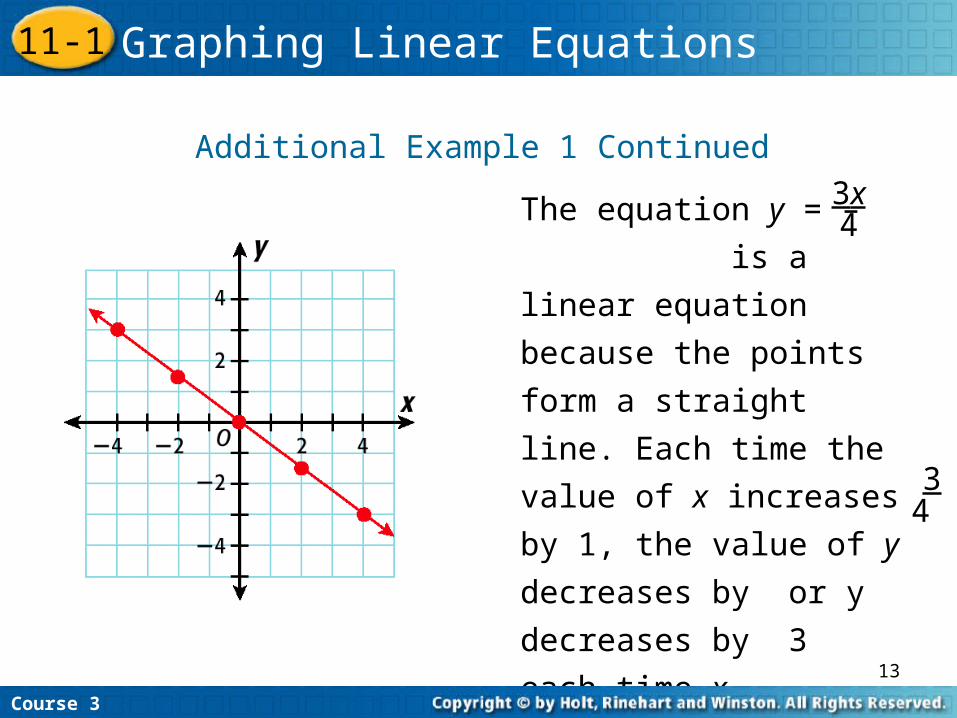
Additional Example 1 Continued
The equation y = –
is a linear equation
because the points
form a straight line.
Each time the value of
x increases by 1, the
value of y decreases by
or y decreases by 3
each time x increases
by 4.
3x4
34
Course 3
11-1 Graphing Linear Equations
14
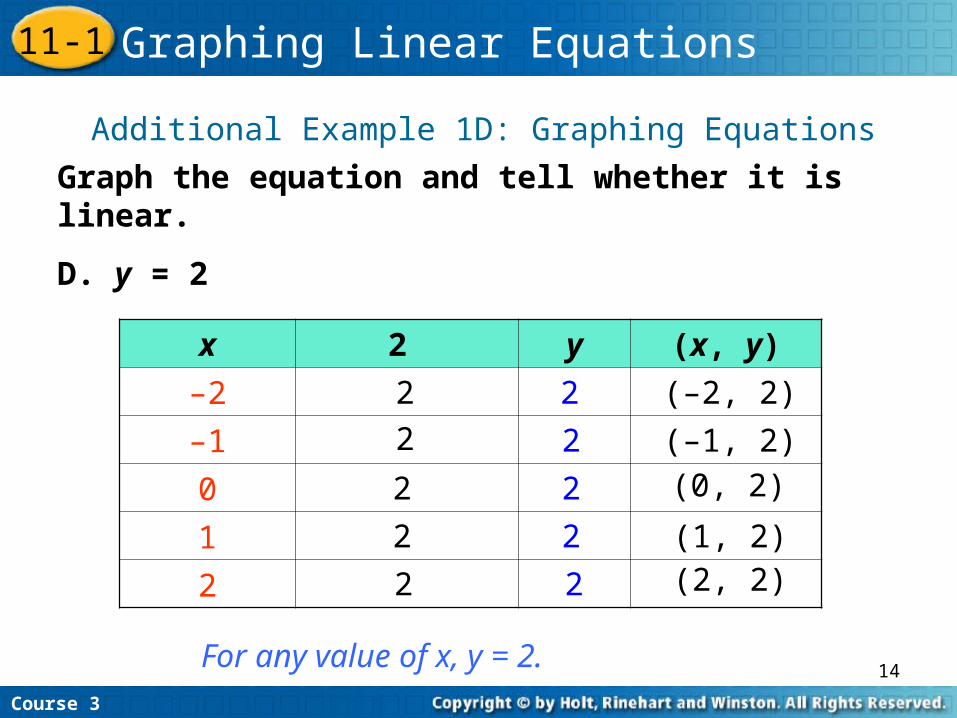
Graph the equation and tell whether it is linear.
D. y = 2
Additional Example 1D: Graphing Equations
For any value of x, y = 2.
x 2 y (x, y)
–2
–1
0
1
2
222
2
2
2
2
2
2
2
(–2, 2)
(–1, 2)(0, 2)
(1, 2)(2, 2)
Course 3
11-1 Graphing Linear Equations
15
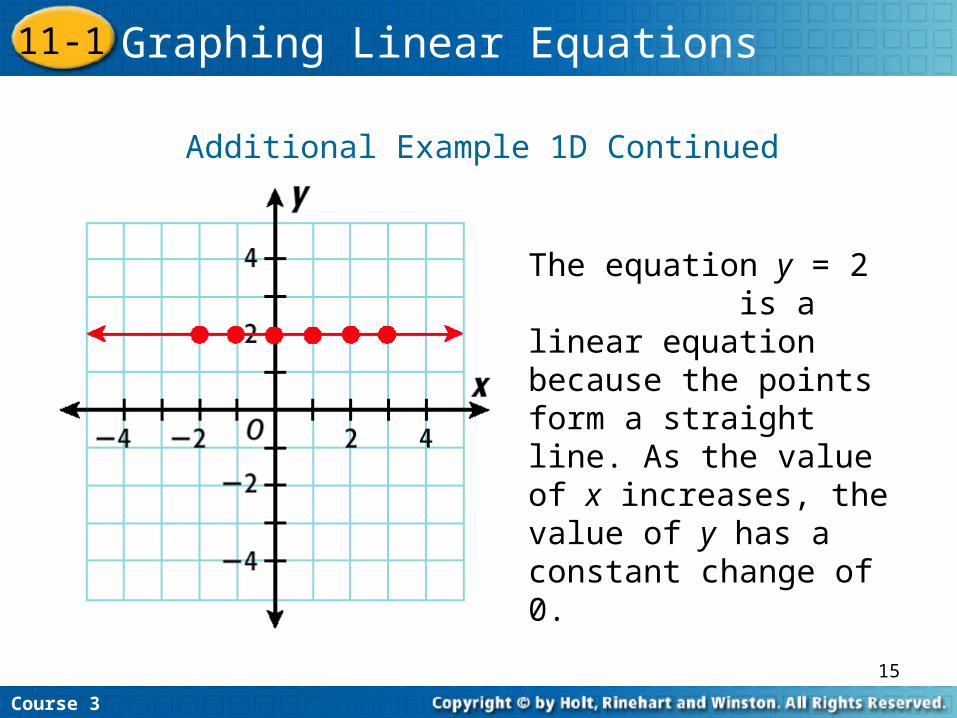
Additional Example 1D Continued
The equation y = 2 is a linear equation because the points form a straight line. As the value of x increases, the value of y has a constant change of 0.
Course 3
11-1 Graphing Linear Equations
16
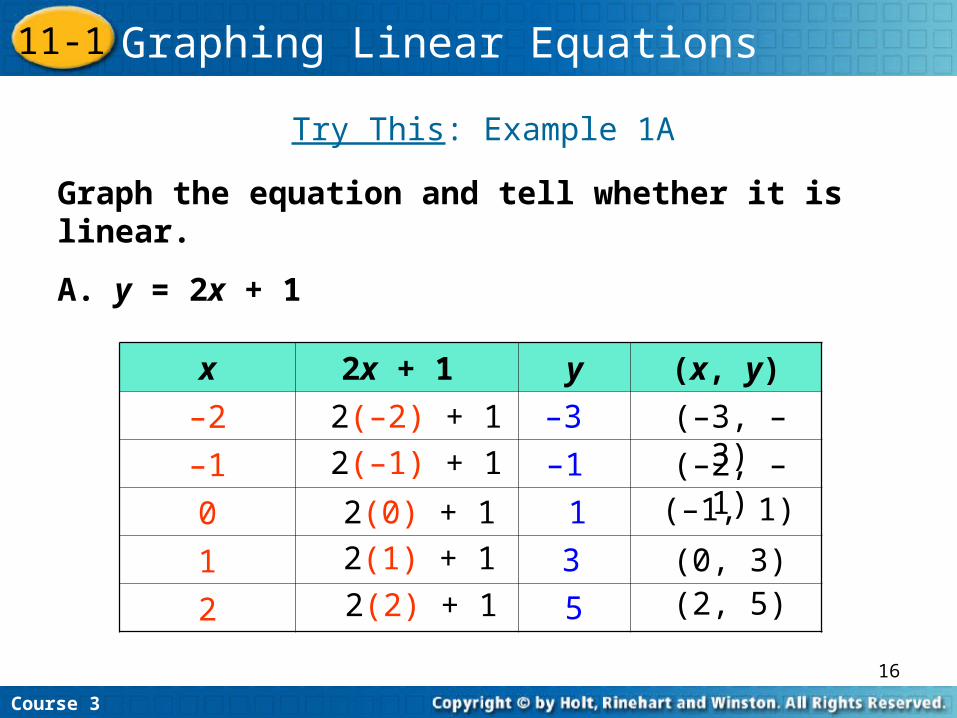
Graph the equation and tell whether it is linear.
A. y = 2x + 1
Try This: Example 1A
x 2x + 1 y (x, y)
–2
–1
0
1
2
–32(–2) + 12(–1) + 1
2(0) + 12(1) + 1
2(2) + 1
–1
1
3
5
(–3, –3)
(–2, –1)(–1, 1)
(0, 3)(2, 5)
Course 3
11-1 Graphing Linear Equations
17
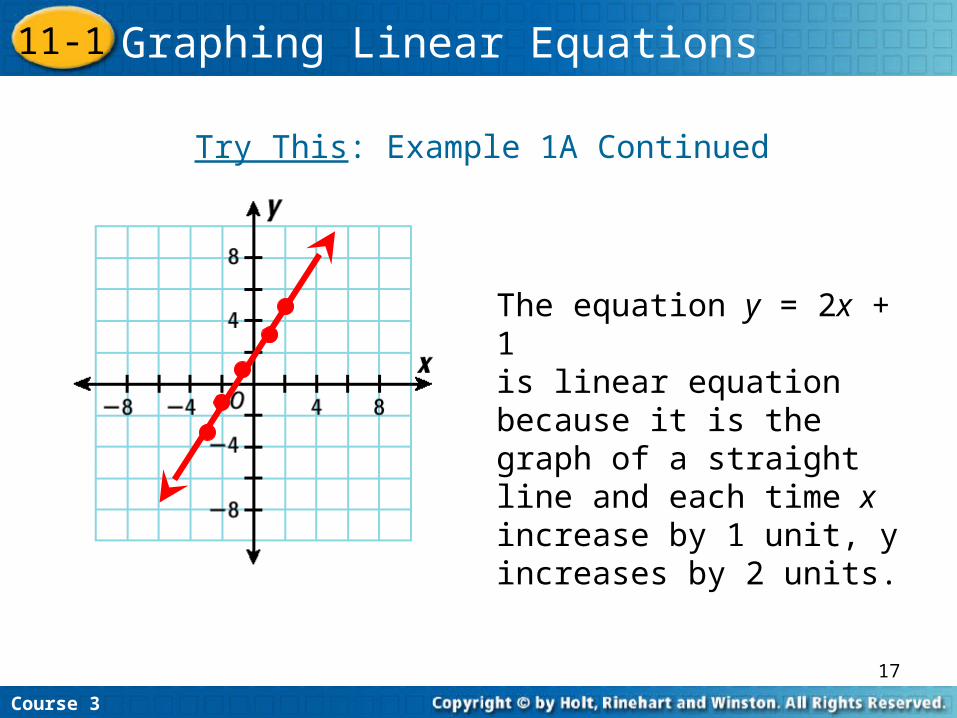
Try This: Example 1A Continued
The equation y = 2x + 1is linear equation because it is the graph of a straight line and each time x increase by 1 unit, y increases by 2 units.
Course 3
11-1 Graphing Linear Equations

18
Group Work The next 5 problems (3 equations &
2 word problems) will be done in groups of 2.
Each group will write and graph their answers on the handout provided.
A classroom participation grade will be given on this group work.
The groups are….
19
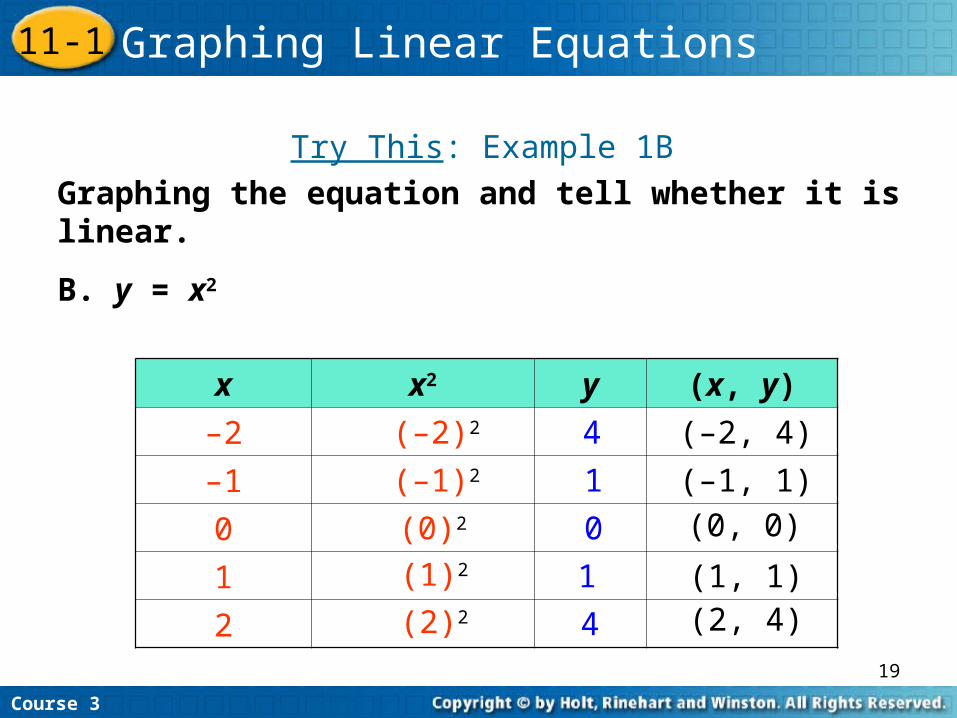
Graphing the equation and tell whether it is linear.
B. y = x2
Try This: Example 1B
x x2 y (x, y)
–2
–1
0
1
2
4(–2)2
1
0
1
4
(–2, 4)
(–1, 1)(0, 0)
(1, 1)(2, 4)
(–1)2
(0)2
(1)2
(2)2
Course 3
11-1 Graphing Linear Equations
20
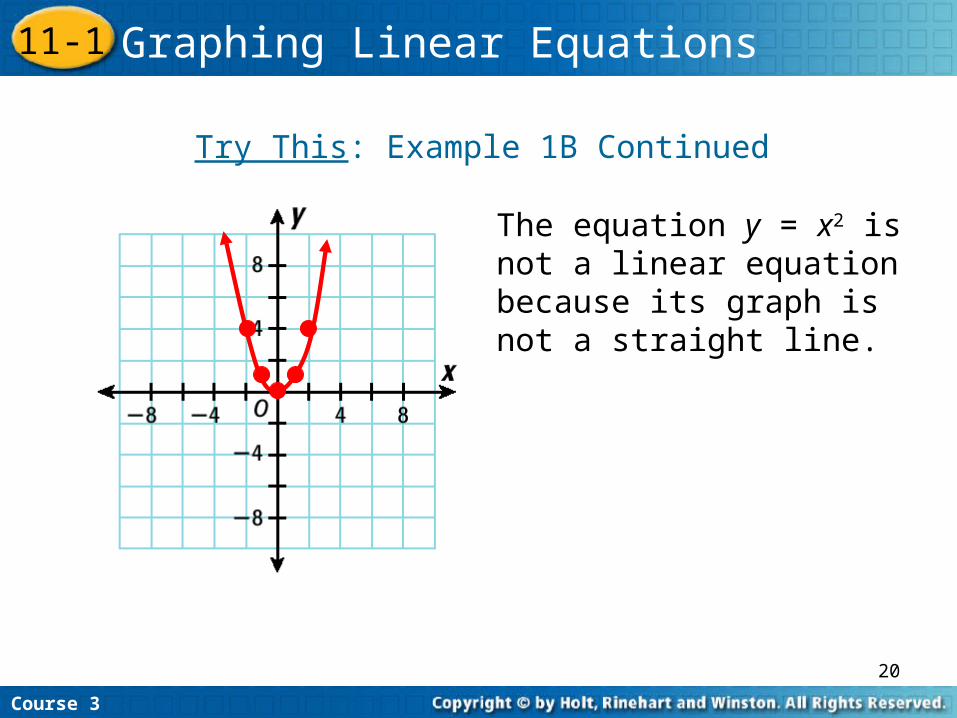
Try This: Example 1B Continued
The equation y = x2 is not a linear equation because its graph is not a straight line.
Course 3
11-1 Graphing Linear Equations
21
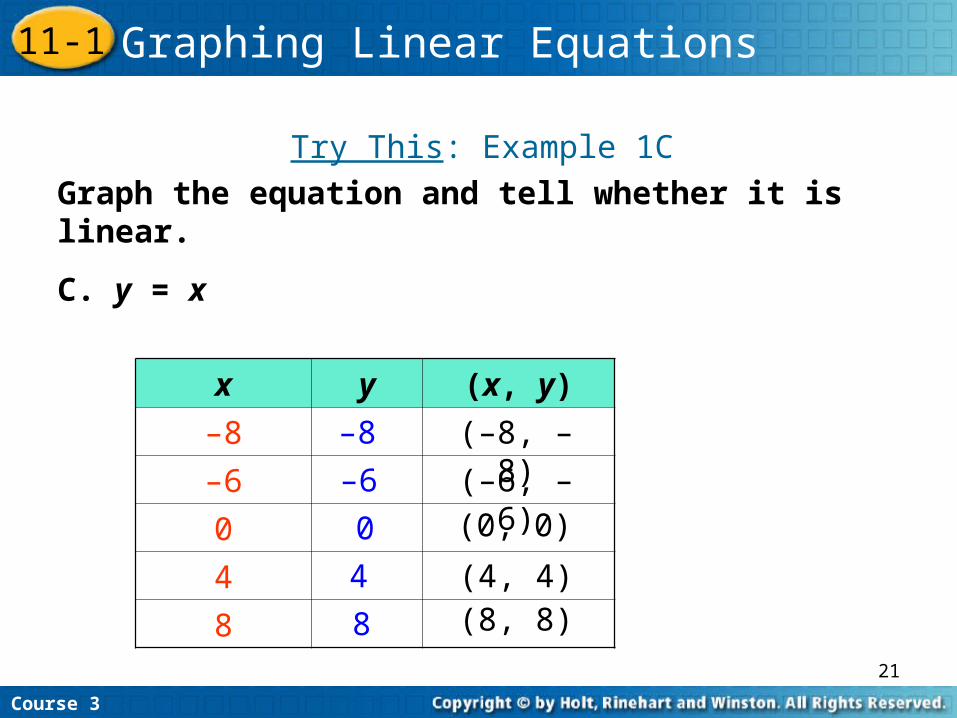
Try This: Example 1CGraph the equation and tell whether it is linear.
C. y = x
x y (x, y)
–8
–6
0
4
8
–8
–6
0
4
8
(–8, –8)
(–6, –6)(0, 0)
(4, 4)(8, 8)
Course 3
11-1 Graphing Linear Equations
22
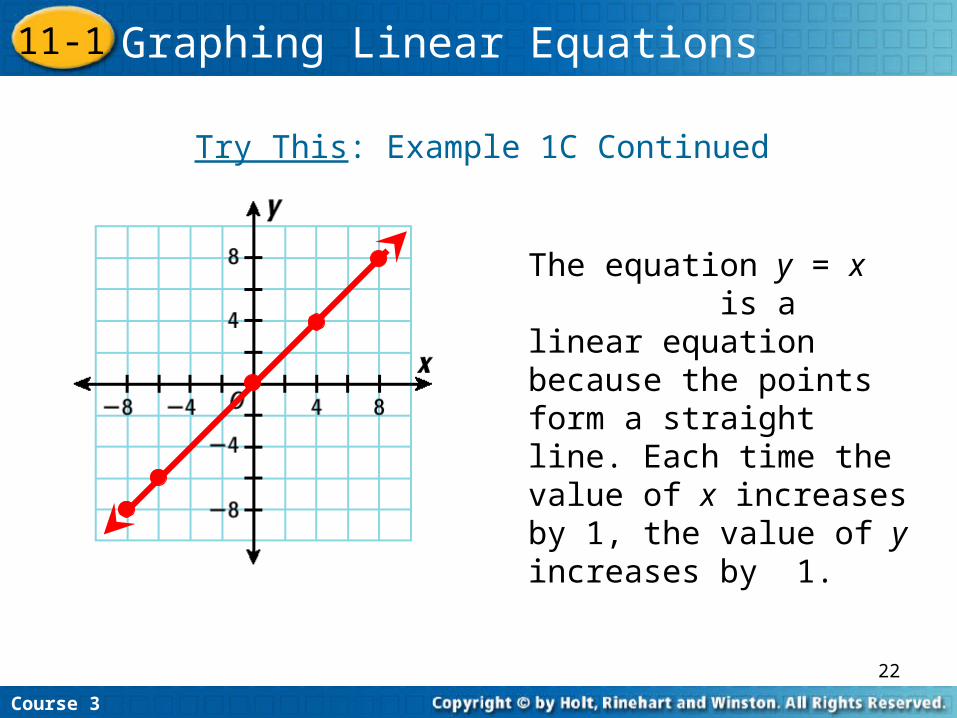
Try This: Example 1C Continued
The equation y = x is a linear equation because the points form a straight line. Each time the value of x increases by 1, the value of y increases by 1.
Course 3
11-1 Graphing Linear Equations
23
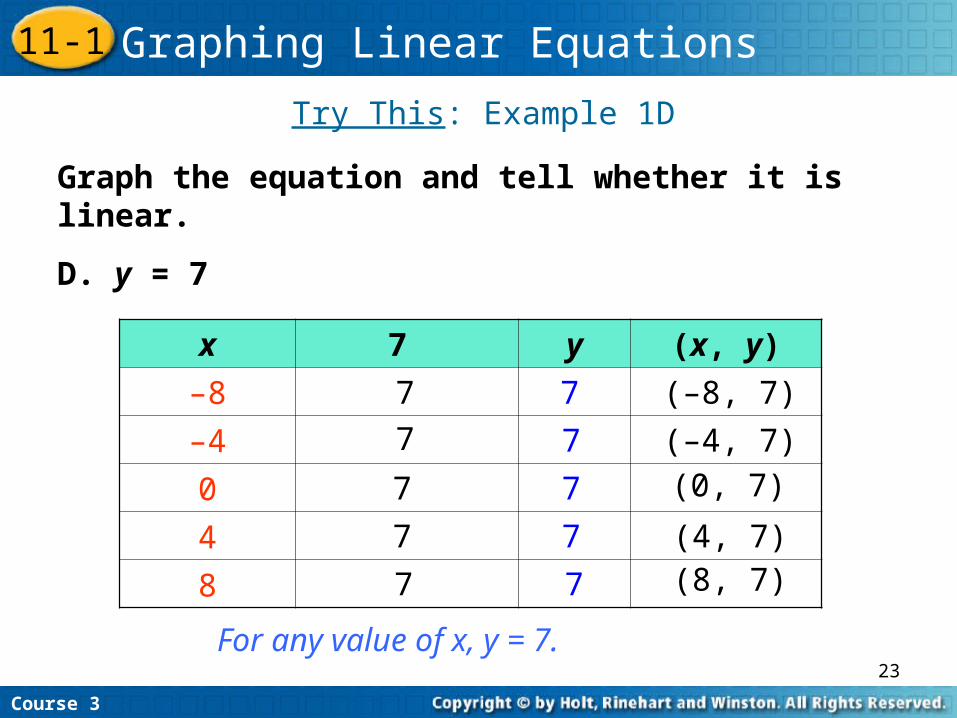
Try This: Example 1D
For any value of x, y = 7.
Graph the equation and tell whether it is linear.
D. y = 7
x 7 y (x, y)
–8
–4
0
4
8
777
7
7
7
7
7
7
7
(–8, 7)
(–4, 7)(0, 7)
(4, 7)(8, 7)
Course 3
11-1 Graphing Linear Equations
24
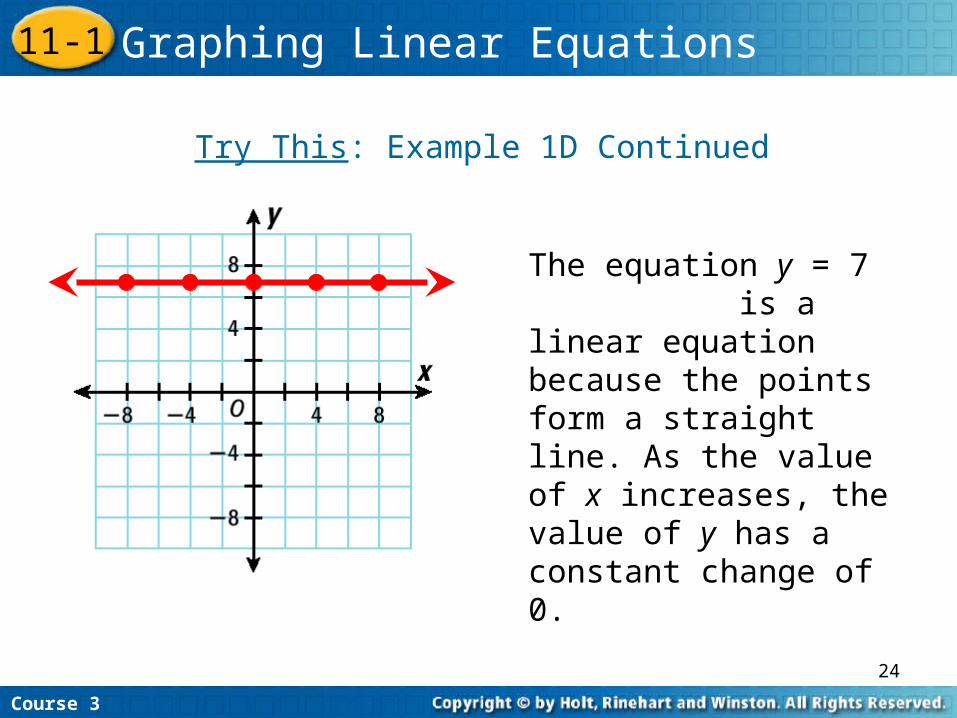
Try This: Example 1D Continued
The equation y = 7 is a linear equation because the points form a straight line. As the value of x increases, the value of y has a constant change of 0.
Course 3
11-1 Graphing Linear Equations
25
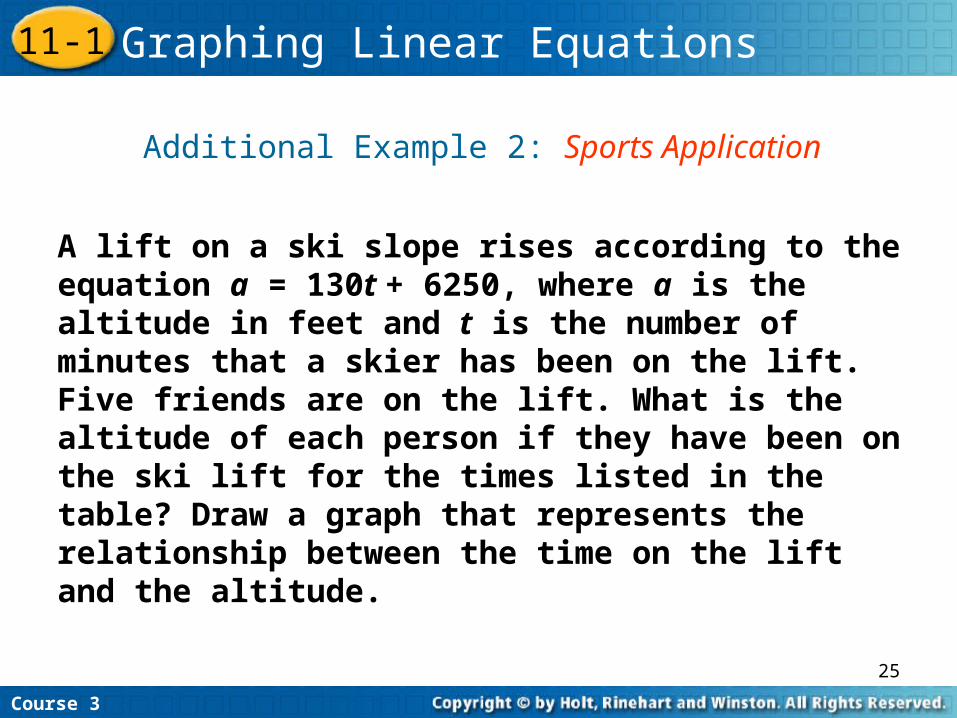
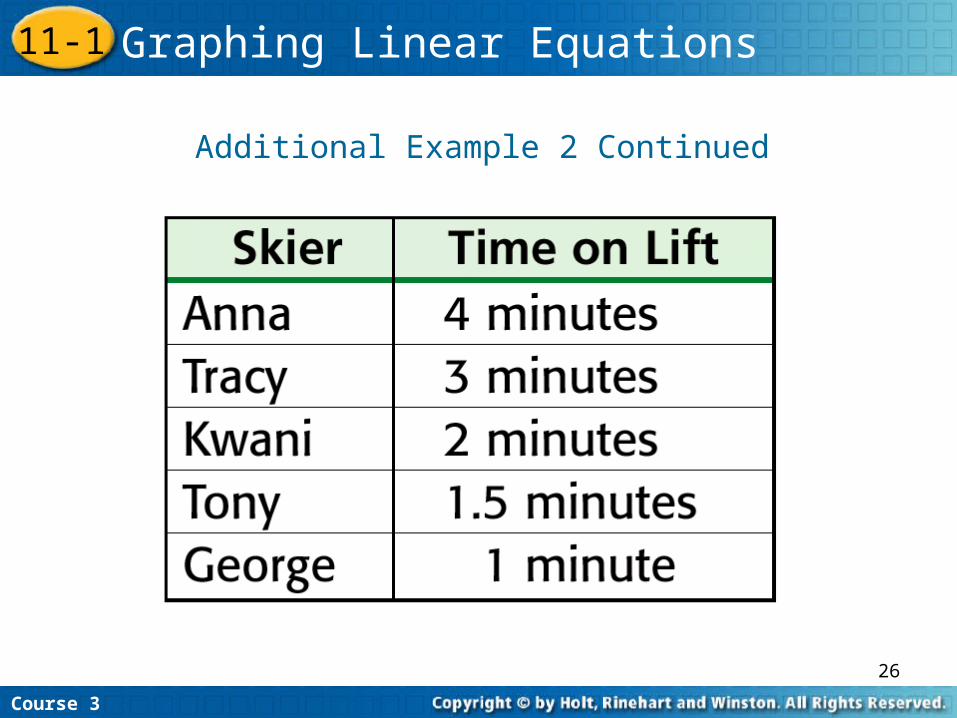
Additional Example 2: Sports Application
A lift on a ski slope rises according to the equation a = 130t + 6250, where a is the altitude in feet and t is the number of minutes that a skier has been on the lift. Five friends are on the lift. What is the altitude of each person if they have been on the ski lift for the times listed in the table? Draw a graph that represents the relationship between the time on the lift and the altitude.
Course 3
11-1 Graphing Linear Equations
26
Additional Example 2 Continued
Course 3
11-1 Graphing Linear Equations
27
Additional Example 2 Continued
Course 3
11-1 Graphing Linear Equations
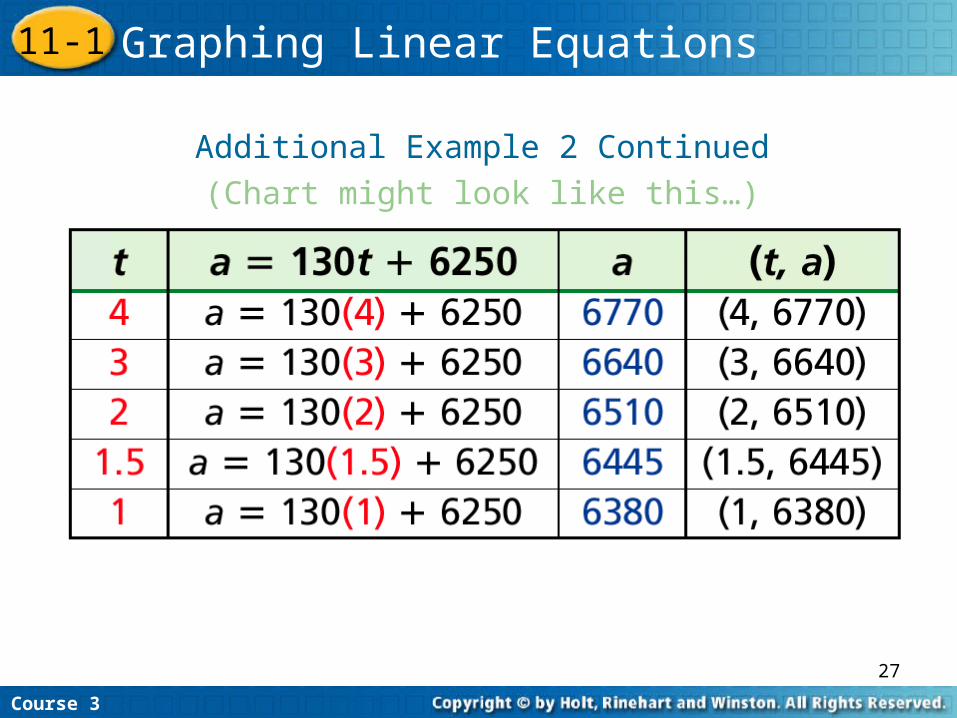
(Chart might look like this…)
28
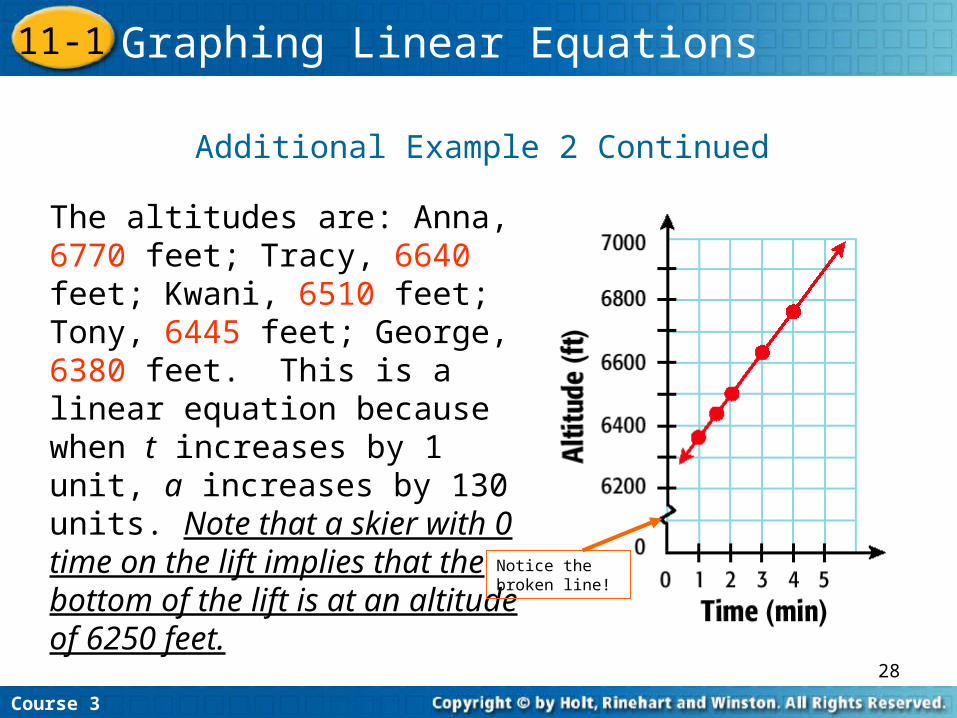
The altitudes are: Anna, 6770 feet; Tracy, 6640 feet; Kwani, 6510 feet; Tony, 6445 feet; George, 6380 feet. This is a linear equation because when t increases by 1 unit, a increases by 130 units. Note that a skier with 0 time on the lift implies that the bottom of the lift is at an altitude of 6250 feet.
Additional Example 2 Continued
Course 3
11-1 Graphing Linear Equations
Notice the broken line!
29
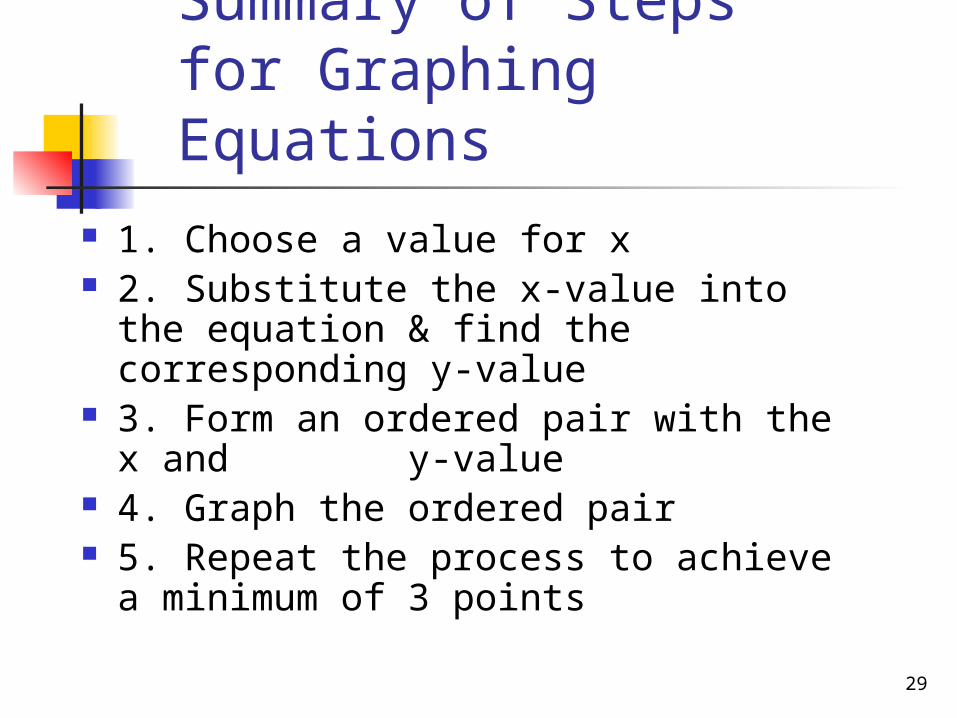
Summary of Stepsfor Graphing Equations
1. Choose a value for x 2. Substitute the x-value into the
equation & find the corresponding y-value
3. Form an ordered pair with the x and y-value
4. Graph the ordered pair 5. Repeat the process to achieve a
minimum of 3 points
30
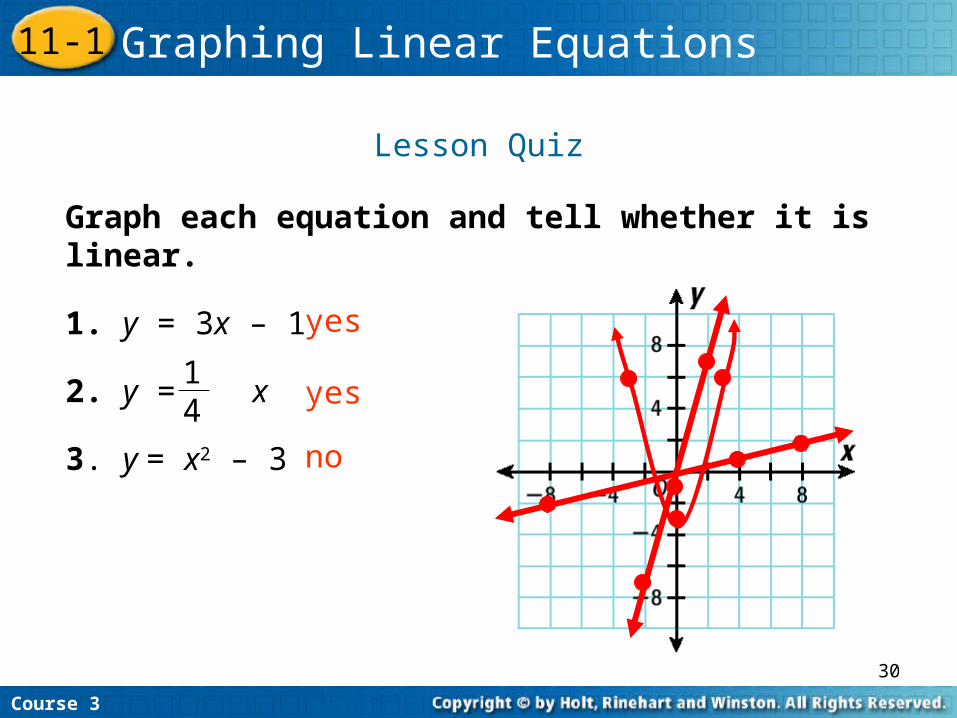
Lesson Quiz
Graph each equation and tell whether it is linear.
1. y = 3x – 1
2. y = x
3. y = x2 – 3
yes
yes
Insert Lesson Title Here
no
14
Course 3
11-1 Graphing Linear Equations
31
Homework for 12-10-07!
Answer the Essential Question on your homework paper for tonight
Homework workbook section 11-1
Recommended