Are psyllid numbers lower in CHMAs vs. non-CHMA areas?
Just because a CHMA has been named doesn’t mean the CHMA is actually functioning…
– Some CHMAs were mapped out without much grower input (or commitment)
– Need a dedicated grower leader to help motivate the process
– Much variation in grower participation throughout the state


7.3
?


Central Highlands 17/27 CHMA (TRS Map)

Central Highlands 17/27 CHMA (Cycle 4: Oct. 3 – 21, 2011)
27.25
17.1
0.8 2.25 3
0.2 0.5 0.6
0.2
1.8 1.0
0.3
5 10.5
3
1.5
0 psyllids <1 psyllid 1-5 psyllids 6-10 psyllids >10 psyllids
Category
0 psyllids for two consecutive cycles Psyllids decreased to lower category Psyllids decrease but remained in same category Psyllids increased but remained in same category Psyllids increased to a higher category
Trends Cycle 3-4
• Average ACP per block = 5.3 • Numbers presented are mean number psyllids per
block scouted within each TRS
No change
No Data
No data from previous cycle

Central Highlands 17/27 CHMA
• Total blocks in CHMA = 423 – Blocks sampled = 87 – 20.5% of CHMA scouted
• Overall mean psyllids per block = 5.3
• Analysis of blocks participating vs. non-participation in CHMA – Non-participants = blocks
with psyllids consistently > 5 over 4 scouting cycles
– Participants = evidence of reduction in psyllid number over course of 4 cycles
– In 62% (54/87) of the blocks sampled, no psyllids were found

Central Highlands 17/27 CHMA (Cycle 4: Oct. 3 – 21, 2011)
• Average ACP per block = 5.3 • Numbers presented are mean number psyllids per
block scouted within each TRS
27.25
17.1
0.8 2.25 3
0.2 0.5 0.6
0.2
1.8 1.0
0.3
5 10.5
3
1.5
0 psyllids <1 psyllid 1-5 psyllids 6-10 psyllids >10 psyllids
Category
0 psyllids for two consecutive cycles Psyllids decreased to lower category Psyllids decrease but remained in same category Psyllids increased but remained in same category Psyllids increased to a higher category
Trends Cycle 3-4
No change
No Data
No data from previous cycle
TRS contains at least 1 block with no psyllid control evident

Central Highlands 17/27 CHMA
• Effect of non-participant on neighboring groves?
1.5
Example: CREC Lease (Lake Placid) • All blocks on same intensive psyllid
control program • No psyllids found in blocks in upper TRS • Low numbers of psyllids found in two
blocks in lower TRS…adjacent to abandoned grove
Central Highlands 17/27 CHMA
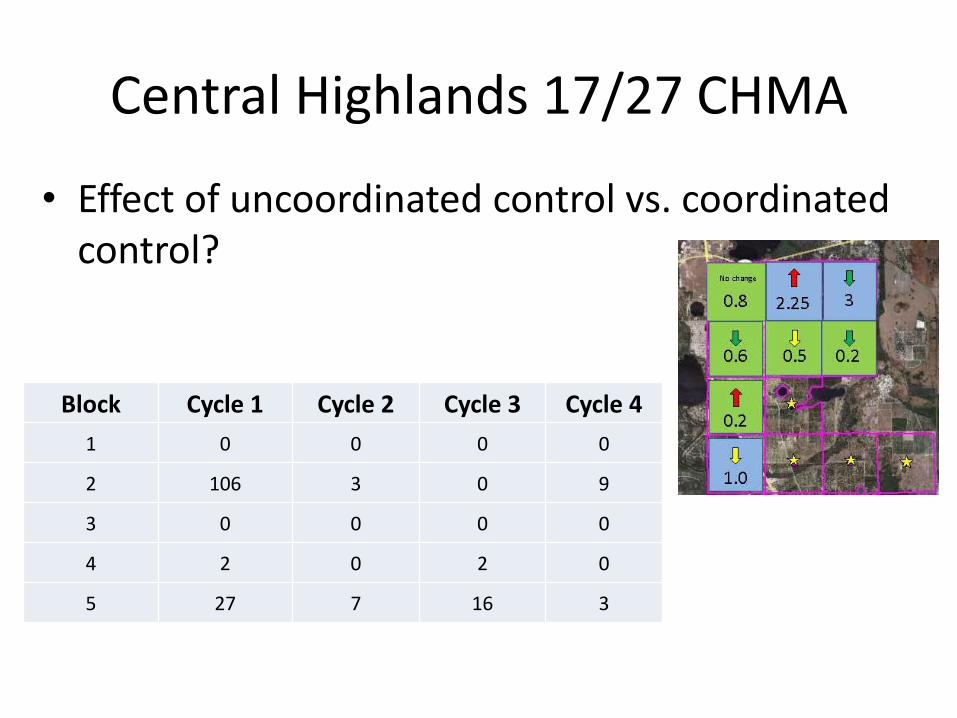
• Effect of uncoordinated control vs. coordinated control?
Block Cycle 1 Cycle 2 Cycle 3 Cycle 4
1 0 0 0 0
2 106 3 0 9
3 0 0 0 0
4 2 0 2 0
5 27 7 16 3

Bereah/South Frostproof CHMA (Cycle 4: Oct. 3 – 21, 2011)
• Average ACP per block = 2.8 • Numbers presented are mean number psyllids per
block scouted within each TRS
4 8
1.0
2.5
72 2
13
3 0.5
0.7 4 0.2
0.9 3.5
12
3.8 3
8 3.5
NA
NA
0 psyllids <1 psyllid 1-5 psyllids 6-10 psyllids >10 psyllids
Category Trends Cycle 3-4 0 psyllids for two consecutive cycles Psyllids decreased to lower category Psyllids decrease but remained in same category Psyllids increased but remained in same category Psyllids increased to a higher category

CHMAs as a tool
• Real-world situation
• Large scale applications
• Area-wide monitoring
• Data from CHMA program can be used to learn more about managing psyllids
• Example…

NE Desoto CHMA (Cycle 3: Sept. 12 – 30, 2011)
• Average ACP per block scouted = 0.8571 • Numbers presented are mean number
psyllids per block scouted within each TRS
0 psyllids <1 psyllid 1-5 psyllids 6-10 psyllids >10 psyllids
Category
Trends Cycle 2-3
0 psyllids for two consecutive cycles Psyllids decreased to lower category Psyllids decrease but remained in same category Psyllids increased but remained in same category Psyllids increased to a higher category
NA
0.6
4.2 0.3 0.5
NA NA
2.0
8.7
NA
0.5
0.4
2.8 0.7 0.3
2.0 2.8 0.2
5.0 1.0
0.3 0.2 0.3
0.4 0.2 0.1 1.0
NPD NPD
NPD
NPD
NPD
NPD
NPD
NPD No previous data
NA Not Available (no counts)
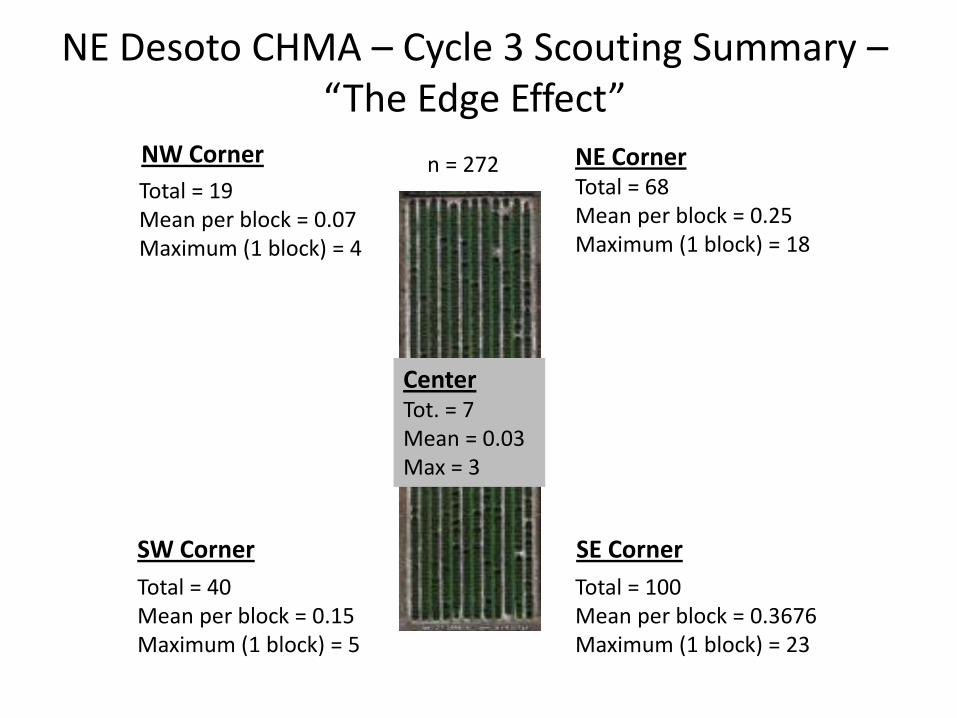
Total = 19 Mean per block = 0.07 Maximum (1 block) = 4
Center Tot. = 7 Mean = 0.03 Max = 3
Total = 68 Mean per block = 0.25 Maximum (1 block) = 18
Total = 40 Mean per block = 0.15 Maximum (1 block) = 5
Total = 100 Mean per block = 0.3676 Maximum (1 block) = 23
NE Corner NW Corner
SE Corner SW Corner
NE Desoto CHMA – Cycle 3 Scouting Summary – “The Edge Effect”
n = 272

Border Sprays Utilized
• Danitol (fenpropathrin) applied as a border spray to all blocks and then around the entire perimeter of the Joshua grove (and some hotspots) following Cycle 3 scouting (Sept.).
• Next application is a coordinated aerial application with an OP insecticide (beginning Oct 20).

NE Desoto CHMA (Cycle 3: Sept. 12 – 30, 2011)
• Average ACP per block scouted = 0.8571 • Numbers presented are mean number
psyllids per block scouted within each TRS
0 psyllids <1 psyllid 1-5 psyllids 6-10 psyllids >10 psyllids
Category
Trends Cycle 2-3
0 psyllids for two consecutive cycles Psyllids decreased to lower category Psyllids decrease but remained in same category Psyllids increased but remained in same category Psyllids increased to a higher category
NA
0.6
4.2 0.3 0.5
NA NA
2.0
8.7
NA
0.5
0.4
2.8 0.7 0.3
2.0 2.8 0.2
5.0 1.0
0.3 0.2 0.3
0.4 0.2 0.1 1.0
NPD NPD
NPD
NPD
NPD
NPD
NPD
NPD No previous data
NA Not Available (no counts)

NE Desoto CHMA (Cycle 4: Oct. 3 – 21, 2011)
• Average ACP per block scouted = 0.1744 • Numbers presented are mean number
psyllids per block scouted within each TRS
0 psyllids <1 psyllid 1-5 psyllids 6-10 psyllids >10 psyllids
Category
Trends Cycle 3-4
0 psyllids for two consecutive cycles Psyllids decreased to lower category Psyllids decrease but remained in same category Psyllids increased but remained in same category Psyllids increased to a higher category
NA
4 7
NA
NA NA
NA
0.6
0.6
No change
1.4
0.6 0.8 0.3
0.3
0.5
1.0
Cycle 3 (Sept 12-30) = 0.8571 Cycle 4 (Oct 3-21) = 0.1744
79.6% reduction in ACP from Cycle 3 to Cycle 4
Psyllids per scouted block
NPD No previous data
NA Not Available (no counts)
NPD NPD

Total = 9 (19) Mean per block = 0.04 (0.07) Maximum (1 block) = 3 (4)
Center Tot. = 9 (7) Mean = 0.04 (0.03) Max = 6 (3)
Total = 14 (68) Mean per block = 0.05 (0.25) Maximum (1 block) = 5 (18)
Total = 5 (40) Mean per block = 0.02 (0.15) Maximum (1 block) = 3 (5)
Total = 8 (100) Mean per block = 0.03 (0.3676) Maximum (1 block) = 4 (23)
NE Corner NW Corner
SE Corner SW Corner
NE Desoto CHMA – Cycle 4 Scouting Summary – “The Edge Effect”
Numbers in ( ) are data from Cycle 3
F = 4.73; P = 0.0301 F = 1.52, P = 0.2186
F = 6.26; P = 0.0126 F = 10.3; P = 0.0014
F = 0.16; P = 0.6919

Potential use of border sprays?
• Data from NE Desoto CHMA support the idea that border sprays may be a useful tool
• Not a stand-alone approach
• Potential supplemental approach where good control programs already in place
– Save time and money
• Should be followed by a more thorough (complete) coordinated spray
– No change in ACP numbers in center of blocks

Next steps
• Need to get more grower feedback on what is happening in their CHMAs – Spray schedules, participating and non-
participating blocks (can be kept confidential) • Effects of participants vs. non-participants
• Effects of coordinated vs. uncoordinated control
– Any unique approaches that could be analyzed more in-depth • NE Desoto example with border spraying
– Feedback on maps shown today…how do you want the data summaries presented???
Email questions/comments: [email protected]
Recommended