Pattern Recognition Letters 26 (2005) 1985–1994
www.elsevier.com/locate/patrec
Using phase information for symmetry detection
Zhitao Xiao a,b,*, Zhengxin Hou b, Changyun Miao a, Jianming Wang a
a School of Information and Communication Engineering, Tianjin Polytechnic University, No. 63 Chenglinzhuang Road,
Hedong District, Tianjin 300160, PR Chinab School of Electronic Information Engineering, Tianjin University, Tianjin 300072, PR China
Received 14 April 2004; received in revised form 3 September 2004
Available online 7 April 2005
Communicated by L. Goldfarb
Abstract
Symmetry exists widely in the real world and plays a remarkable role in perception problems. The existing symmetry
detection algorithms are mainly based on luminance or gradient information. Upon analyzing the relationship between
symmetry and phase, based on phase congruency, we propose a phase-based symmetry detection (PSD) algorithm. PSD
is calculated based on log Gabor wavelet. The symmetric points of objects are obtained by inspecting the phase infor-
mation. The feasibility analysis, phase-based symmetry detection definition, and rationality demonstrations established
the theoretic foundation for this algorithm. The experiments show that this algorithm can be applied directly to original
images without segmentation—it is invariant to rotation, luminance and contrast—and it can detect several types of
symmetries at the same time and it is compared with several other methods.
� 2005 Elsevier B.V. All rights reserved.
Keywords: Phase congruency; Symmetry detection; Phase information; Invariance
1. Introduction
Symmetry plays a remarkable role in perception
problems. For example, peaks of brain activity are
0167-8655/$ - see front matter � 2005 Elsevier B.V. All rights reserv
doi:10.1016/j.patrec.2005.02.003
* Corresponding author. Address: School of Information and
Communication Engineering, Tianjin Polytechnic University,
No. 63 Chenglinzhuang Road, Hedong District, Tianjin
300160, PR China. Tel.: +86 22 8129 5069; fax: +86 22 2452
8164.
E-mail address: [email protected] (Z. Xiao).
measured correspondence with visual patternshowing symmetry. Symmetry is one of the shape
features that are often used in object recognition.
Symmetry is so important to our perception that
most of the man-made objects are symmetric. Psy-
chologists think that symmetry is the fundamental
elements of perception. Since its ubiquity, the
symmetry detection is of obvious significance for
understanding and interpreting the natural images.Symmetry detection and application have become
the important part of computer vision.
ed.
1986 Z. Xiao et al. / Pattern Recognition Letters 26 (2005) 1985–1994
The more symmetric a piece of region is, the
more easily it is recognized as a figure (Zhang,
2000). Symmetry is essentially a kind of formula.
An application of this formula is, in martial dis-
guise, using various colors and shapes to changethe object�s original pattern.
Two familiar symmetry types are bilateral sym-
metry and rotational symmetry. There is another
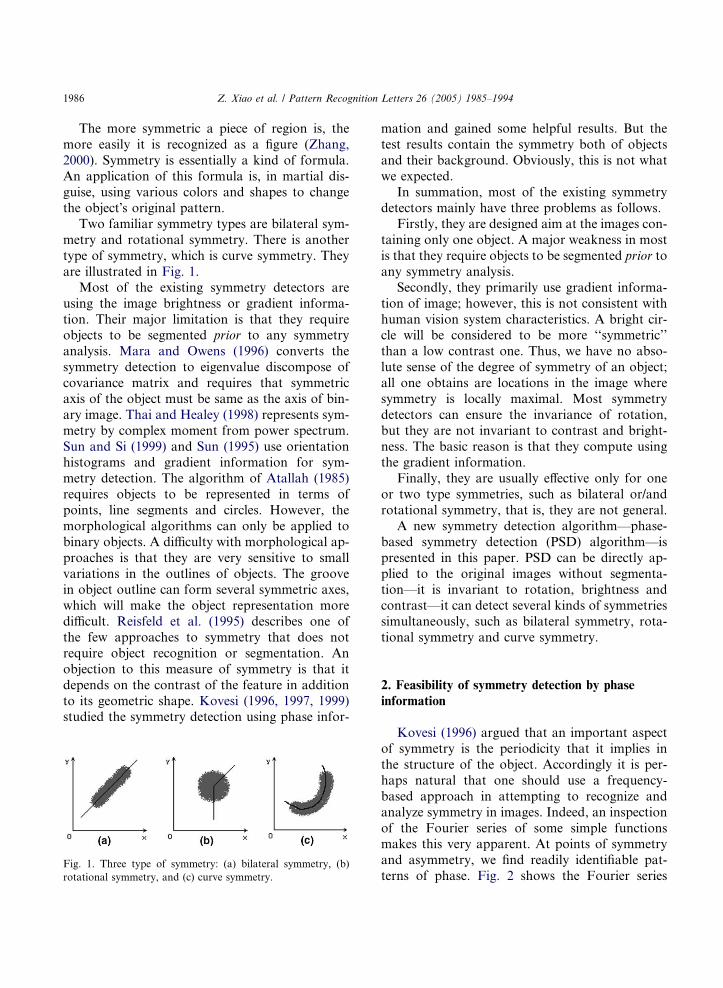
type of symmetry, which is curve symmetry. They
are illustrated in Fig. 1.
Most of the existing symmetry detectors are
using the image brightness or gradient informa-
tion. Their major limitation is that they requireobjects to be segmented prior to any symmetry
analysis. Mara and Owens (1996) converts the
symmetry detection to eigenvalue discompose of
covariance matrix and requires that symmetric
axis of the object must be same as the axis of bin-
ary image. Thai and Healey (1998) represents sym-
metry by complex moment from power spectrum.
Sun and Si (1999) and Sun (1995) use orientationhistograms and gradient information for sym-
metry detection. The algorithm of Atallah (1985)
requires objects to be represented in terms of
points, line segments and circles. However, the
morphological algorithms can only be applied to
binary objects. A difficulty with morphological ap-
proaches is that they are very sensitive to small
variations in the outlines of objects. The groovein object outline can form several symmetric axes,
which will make the object representation more
difficult. Reisfeld et al. (1995) describes one of
the few approaches to symmetry that does not
require object recognition or segmentation. An
objection to this measure of symmetry is that it
depends on the contrast of the feature in addition
to its geometric shape. Kovesi (1996, 1997, 1999)studied the symmetry detection using phase infor-
Fig. 1. Three type of symmetry: (a) bilateral symmetry, (b)
rotational symmetry, and (c) curve symmetry.
mation and gained some helpful results. But the
test results contain the symmetry both of objects
and their background. Obviously, this is not what
we expected.
In summation, most of the existing symmetrydetectors mainly have three problems as follows.
Firstly, they are designed aim at the images con-
taining only one object. A major weakness in most
is that they require objects to be segmented prior to
any symmetry analysis.
Secondly, they primarily use gradient informa-
tion of image; however, this is not consistent with
human vision system characteristics. A bright cir-cle will be considered to be more ‘‘symmetric’’
than a low contrast one. Thus, we have no abso-
lute sense of the degree of symmetry of an object;
all one obtains are locations in the image where
symmetry is locally maximal. Most symmetry
detectors can ensure the invariance of rotation,
but they are not invariant to contrast and bright-
ness. The basic reason is that they compute usingthe gradient information.
Finally, they are usually effective only for one
or two type symmetries, such as bilateral or/and
rotational symmetry, that is, they are not general.
A new symmetry detection algorithm—phase-
based symmetry detection (PSD) algorithm—is
presented in this paper. PSD can be directly ap-
plied to the original images without segmenta-tion—it is invariant to rotation, brightness and
contrast—it can detect several kinds of symmetries
simultaneously, such as bilateral symmetry, rota-
tional symmetry and curve symmetry.
2. Feasibility of symmetry detection by phase
information
Kovesi (1996) argued that an important aspect
of symmetry is the periodicity that it implies in
the structure of the object. Accordingly it is per-
haps natural that one should use a frequency-
based approach in attempting to recognize and
analyze symmetry in images. Indeed, an inspection
of the Fourier series of some simple functionsmakes this very apparent. At points of symmetry
and asymmetry, we find readily identifiable pat-
terns of phase. Fig. 2 shows the Fourier series
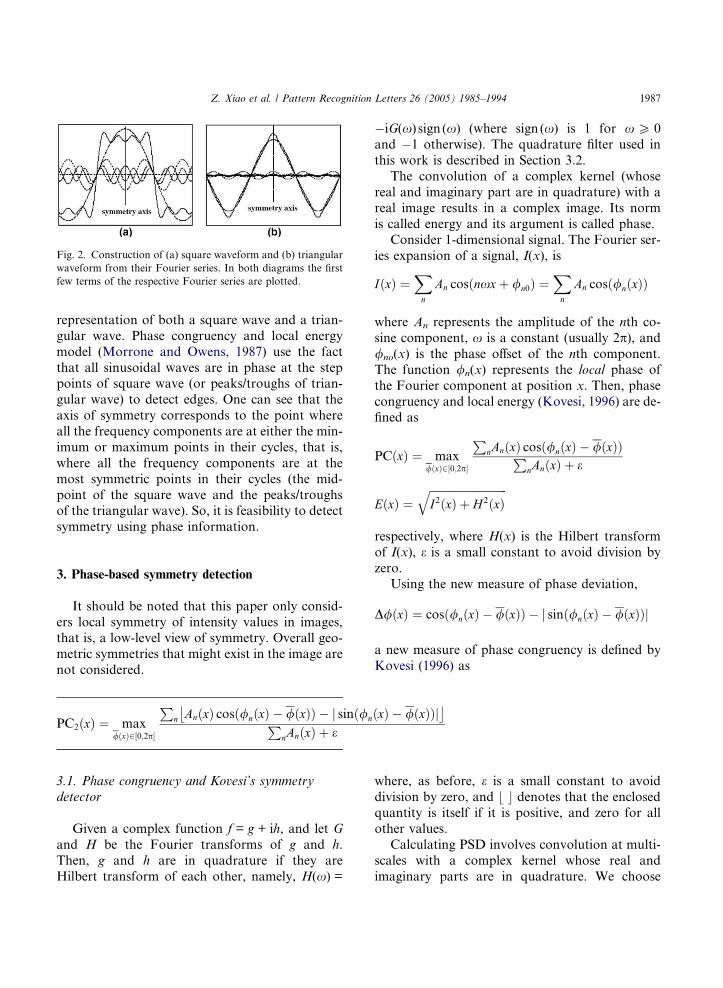
Fig. 2. Construction of (a) square waveform and (b) triangular
waveform from their Fourier series. In both diagrams the first
few terms of the respective Fourier series are plotted.
Z. Xiao et al. / Pattern Recognition Letters 26 (2005) 1985–1994 1987
representation of both a square wave and a trian-
gular wave. Phase congruency and local energy
model (Morrone and Owens, 1987) use the fact
that all sinusoidal waves are in phase at the steppoints of square wave (or peaks/troughs of trian-
gular wave) to detect edges. One can see that the
axis of symmetry corresponds to the point where
all the frequency components are at either the min-
imum or maximum points in their cycles, that is,
where all the frequency components are at the
most symmetric points in their cycles (the mid-
point of the square wave and the peaks/troughsof the triangular wave). So, it is feasibility to detect
symmetry using phase information.
3. Phase-based symmetry detection
It should be noted that this paper only consid-
ers local symmetry of intensity values in images,that is, a low-level view of symmetry. Overall geo-
metric symmetries that might exist in the image are
not considered.
PC2ðxÞ ¼ max/ðxÞ2½0;2p�
Pn AnðxÞ cosð/nðxÞ � /ðxÞÞ � j sinð/nðxÞ � /ðxÞÞj� �
PnAnðxÞ þ e
3.1. Phase congruency and Kovesi’s symmetry
detector
Given a complex function f = g + ih, and let G
and H be the Fourier transforms of g and h.
Then, g and h are in quadrature if they are
Hilbert transform of each other, namely, H(x) =
�iG(x) sign (x) (where sign (x) is 1 for xP 0
and �1 otherwise). The quadrature filter used in
this work is described in Section 3.2.
The convolution of a complex kernel (whose
real and imaginary part are in quadrature) with areal image results in a complex image. Its norm
is called energy and its argument is called phase.
Consider 1-dimensional signal. The Fourier ser-
ies expansion of a signal, I(x), is
IðxÞ ¼Xn
An cosðnxxþ /n0Þ ¼Xn
An cosð/nðxÞÞ
where An represents the amplitude of the nth co-
sine component, x is a constant (usually 2p), and/no(x) is the phase offset of the nth component.
The function /n(x) represents the local phase of
the Fourier component at position x. Then, phase
congruency and local energy (Kovesi, 1996) are de-fined as
PCðxÞ ¼ max/ðxÞ2½0;2p�
PnAnðxÞ cosð/nðxÞ � /ðxÞÞP
nAnðxÞ þ e
EðxÞ ¼ffiffiffiffiffiffiffiffiffiffiffiffiffiffiffiffiffiffiffiffiffiffiffiffiffiffiffiffiI2ðxÞ þ H 2ðxÞ
q
respectively, where H(x) is the Hilbert transform
of I(x), e is a small constant to avoid division by
zero.
Using the new measure of phase deviation,
D/ðxÞ ¼ cosð/nðxÞ � /ðxÞÞ � j sinð/nðxÞ � /ðxÞÞj
a new measure of phase congruency is defined by
Kovesi (1996) as
where, as before, e is a small constant to avoid
division by zero, and b c denotes that the enclosedquantity is itself if it is positive, and zero for all
other values.
Calculating PSD involves convolution at multi-
scales with a complex kernel whose real and
imaginary parts are in quadrature. We choose
1988 Z. Xiao et al. / Pattern Recognition Letters 26 (2005) 1985–1994
log Gabor wavelet (Xiao et al., 2002) to cal-
culate PSD. On the linear frequency scale, the
transfer function of log Gabor function has the
form
gðxÞ ¼ e�ðlogðx=x0ÞÞ2
2ðlogðb=x0ÞÞ2
where x0 is the filter�s center frequency. To obtain
constant shape ratio filter, the term b/x0 must also
be held constant for varying x0.Log Gabor wavelet has some important attri-
butes. Log Gabor wavelet, by definition, has no
DC component. The transfer function of the log
Gabor has extended tails at the high frequency
end. Thus it should be able to encode natural
images more efficiently than ordinary Gabor func-
tions, which would over-represent the low fre-
quency components and under-represent the highfrequency components in any encoding process.
And it is consistent with measurements on human
visual system that indicates we have cells response
that are symmetric on the log frequency scale
(Kovesi, 1996).
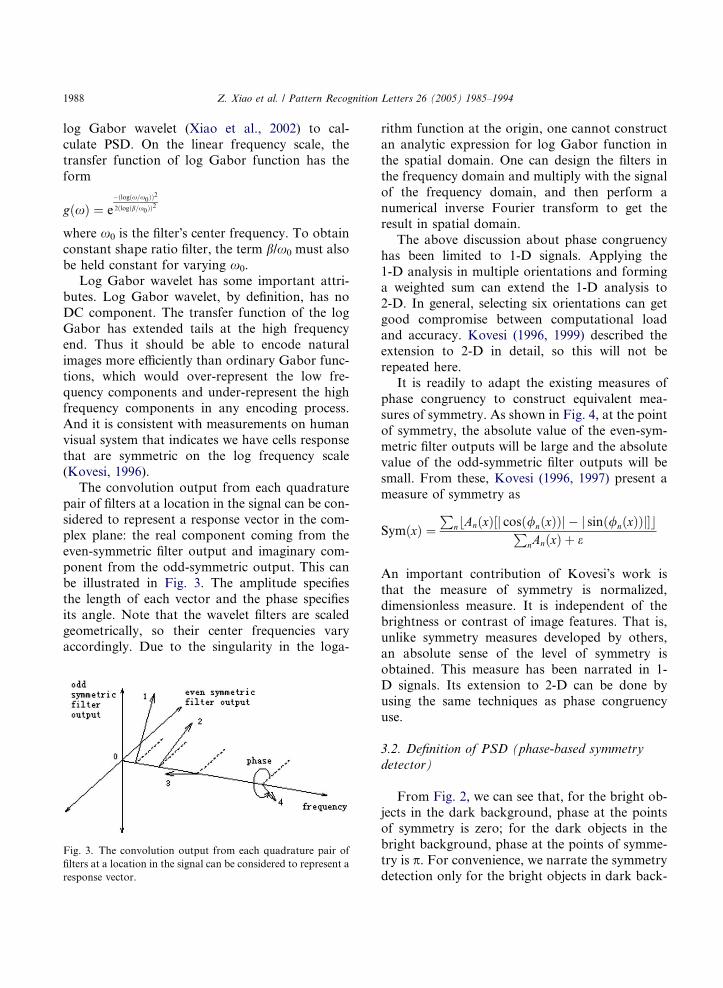
The convolution output from each quadrature
pair of filters at a location in the signal can be con-
sidered to represent a response vector in the com-plex plane: the real component coming from the
even-symmetric filter output and imaginary com-
ponent from the odd-symmetric output. This can
be illustrated in Fig. 3. The amplitude specifies
the length of each vector and the phase specifies
its angle. Note that the wavelet filters are scaled
geometrically, so their center frequencies vary
accordingly. Due to the singularity in the loga-
Fig. 3. The convolution output from each quadrature pair of
filters at a location in the signal can be considered to represent a
response vector.
rithm function at the origin, one cannot construct
an analytic expression for log Gabor function in
the spatial domain. One can design the filters in
the frequency domain and multiply with the signal
of the frequency domain, and then perform anumerical inverse Fourier transform to get the
result in spatial domain.
The above discussion about phase congruency
has been limited to 1-D signals. Applying the
1-D analysis in multiple orientations and forming
a weighted sum can extend the 1-D analysis to
2-D. In general, selecting six orientations can get
good compromise between computational loadand accuracy. Kovesi (1996, 1999) described the
extension to 2-D in detail, so this will not be
repeated here.
It is readily to adapt the existing measures of
phase congruency to construct equivalent mea-
sures of symmetry. As shown in Fig. 4, at the point
of symmetry, the absolute value of the even-sym-
metric filter outputs will be large and the absolutevalue of the odd-symmetric filter outputs will be
small. From these, Kovesi (1996, 1997) present a
measure of symmetry as
SymðxÞ ¼P
n AnðxÞ½j cosð/nðxÞÞj � j sinð/nðxÞÞj�b cPnAnðxÞ þ e
An important contribution of Kovesi�s work is
that the measure of symmetry is normalized,
dimensionless measure. It is independent of the
brightness or contrast of image features. That is,
unlike symmetry measures developed by others,
an absolute sense of the level of symmetry is
obtained. This measure has been narrated in 1-
D signals. Its extension to 2-D can be done byusing the same techniques as phase congruency
use.
3.2. Definition of PSD (phase-based symmetry
detector)
From Fig. 2, we can see that, for the bright ob-
jects in the dark background, phase at the pointsof symmetry is zero; for the dark objects in the
bright background, phase at the points of symme-
try is p. For convenience, we narrate the symmetry
detection only for the bright objects in dark back-
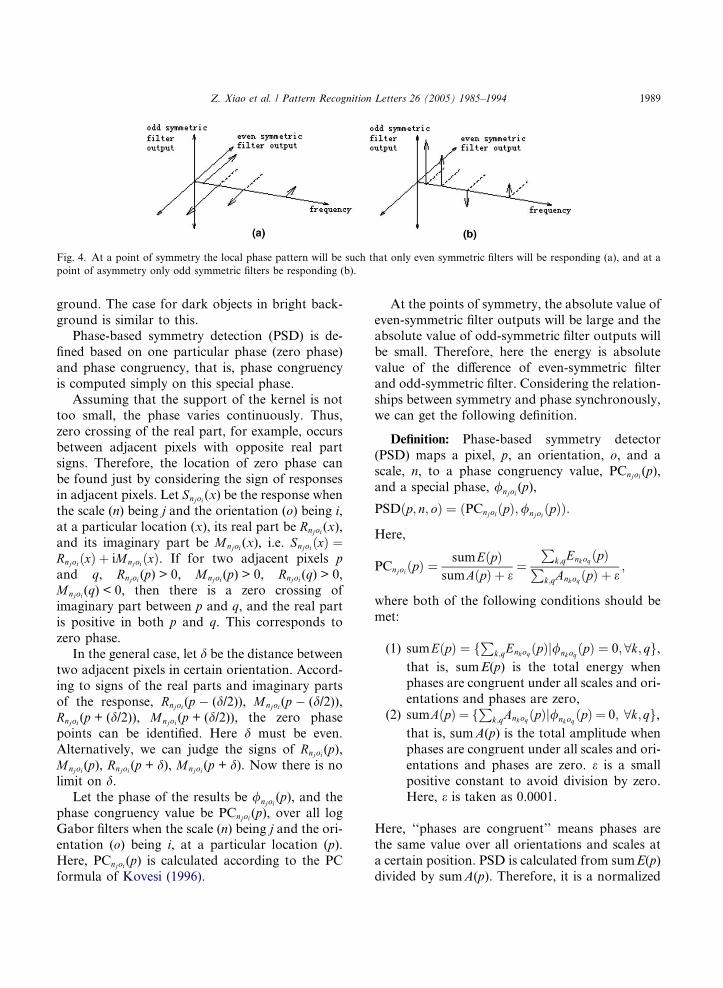
Fig. 4. At a point of symmetry the local phase pattern will be such that only even symmetric filters will be responding (a), and at a
point of asymmetry only odd symmetric filters be responding (b).
Z. Xiao et al. / Pattern Recognition Letters 26 (2005) 1985–1994 1989
ground. The case for dark objects in bright back-
ground is similar to this.Phase-based symmetry detection (PSD) is de-
fined based on one particular phase (zero phase)
and phase congruency, that is, phase congruency
is computed simply on this special phase.
Assuming that the support of the kernel is not
too small, the phase varies continuously. Thus,
zero crossing of the real part, for example, occurs
between adjacent pixels with opposite real partsigns. Therefore, the location of zero phase can
be found just by considering the sign of responses
in adjacent pixels. Let Snjoi(x) be the response when
the scale (n) being j and the orientation (o) being i,
at a particular location (x), its real part be Rnjoi (x),
and its imaginary part be Mnjoi(x), i.e. SnjoiðxÞ ¼RnjoiðxÞ þ iMnjoiðxÞ. If for two adjacent pixels p
and q, Rnjoi (p) > 0, Mnjoi(p) > 0, Rnjoi(q) > 0,Mnjoi(q) < 0, then there is a zero crossing of
imaginary part between p and q, and the real part
is positive in both p and q. This corresponds to
zero phase.
In the general case, let d be the distance betweentwo adjacent pixels in certain orientation. Accord-
ing to signs of the real parts and imaginary parts
of the response, Rnjoi(p � (d/2)), Mnjoi(p � (d/2)),Rnjoi (p + (d/2)), Mnjoi(p + (d/2)), the zero phase
points can be identified. Here d must be even.
Alternatively, we can judge the signs of Rnjoi (p),
Mnjoi(p), Rnjoi(p + d), Mnjoi(p + d). Now there is no
limit on d.Let the phase of the results be /njoi(p), and the
phase congruency value be PCnjoi(p), over all log
Gabor filters when the scale (n) being j and the ori-entation (o) being i, at a particular location (p).
Here, PCnjoi(p) is calculated according to the PC
formula of Kovesi (1996).
At the points of symmetry, the absolute value of
even-symmetric filter outputs will be large and theabsolute value of odd-symmetric filter outputs will
be small. Therefore, here the energy is absolute
value of the difference of even-symmetric filter
and odd-symmetric filter. Considering the relation-
ships between symmetry and phase synchronously,
we can get the following definition.
Definition: Phase-based symmetry detector
(PSD) maps a pixel, p, an orientation, o, and a
scale, n, to a phase congruency value, PCnjoi(p),
and a special phase, /njoi (p),
PSDðp; n; oÞ ¼ ðPCnjoiðpÞ;/njoiðpÞÞ:
Here,
PCnjoiðpÞ ¼sumEðpÞ
sumAðpÞ þ e¼
Pk;qEnkoqðpÞP
k;qAnkoqðpÞ þ e;
where both of the following conditions should be
met:
(1) sumEðpÞ ¼ fP
k;qEnkoqðpÞj/nkoqðpÞ ¼ 0;8k; qg,that is, sumE(p) is the total energy when
phases are congruent under all scales and ori-
entations and phases are zero,
(2) sumAðpÞ ¼ fP
k;qAnkoqðpÞj/nkoqðpÞ ¼ 0; 8k;qg,that is, sumA(p) is the total amplitude when
phases are congruent under all scales and ori-
entations and phases are zero. e is a small
positive constant to avoid division by zero.Here, e is taken as 0.0001.
Here, ‘‘phases are congruent’’ means phases are
the same value over all orientations and scales at
a certain position. PSD is calculated from sumE(p)
divided by sumA(p). Therefore, it is a normalized
1990 Z. Xiao et al. / Pattern Recognition Letters 26 (2005) 1985–1994
quantity, which can ensure the value of PSD is
invariant to brightness and contrast.
Note that the energy sumE(p) is calculated
according to Kovesi (1996).
3.3. Computational complexity of PSD
From the definition of PSD, it can be seen that
the computational load of PSD is fairly high. It
needs FFT, IFFT, and matrix multiplication dur-
ing its implementation. If the image size involved
is N · N, it will need about N2 real multiplications,
2N2 log2N complex multiplications, and 4N2 log2Ncomplex additions. Here the radix-2 FFT and
IFFT are assumed.
4. Rationality of PSD
Let the signal be I(x), the quadrature filter ker-
nel is kno, where n represents scale, and o repre-sents orientation. Thus, when the scale is n and
orientation is o, the local energy is
EnoðxÞ ¼ IðxÞ � knok k ¼ InoðxÞk kBecause log Gabor wavelet (Xiao et al., 2002) does
not exist analytic expression in spatial domain, we
show the rationality of PSD using Mexico waveletby two examples. In spatial domain, this wavelet
has the form
gnðxÞ ¼1
n1� x2
n2
� �e� x2
2n2
Firstly, consider a delta function located at 0,
which is the ideal symmetric object with scale zero.The result of the convolution is just the filter ker-
nel itself. Given a scale n, at the origin, the convo-
lution result is In(0) = 1/n + 0i. Therefore, the local
phase is /n(0) = 0, and local energy is En(0) = 1/n2.
According to the definition of PSD, the symmetric
phase is 0.
Next example is a rectangle function,
hðxÞ ¼1; jxj 6 t
0; jxj > t
�
This is a symmetric object located at 0 with scale t.
Given a scale n, the convolution result at 0 is
Inð0Þ ¼Z t
�tgnðxÞdx
� �þ 0i
Therefore, the local phase at 0 is /n(0) = 0. This is
again consistent with the definition of PSD.
5. Experimental results
To demonstrate the performance of PSD, PSD
is applied to several kinds of images and comparedwith other methods. In this paper, three different
resolutions (scales) and six different orientations
for each resolution are chosen. The minimum scale
used is 20 pixels. Increasing the number of resolu-
tions and/or orientations can improve the accu-
racy of the results, but the improved effect is not
clearly, and the computation load will increase
rapidly. The experiments show that the parame-ters used here can get good compromise between
computational load and accuracy. It should be
emphasized that the same parameters of PSD are
used in all of the experiment results given in this
paper except in Section 5.3, in which the scale
parameter�s influence on detection results are
tested.
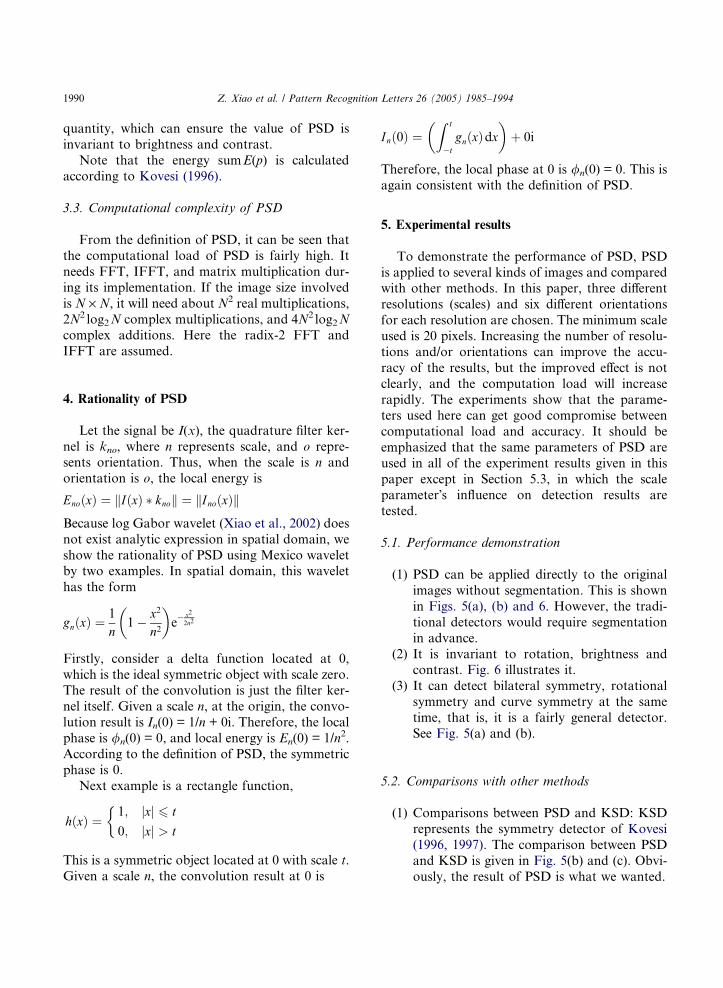
5.1. Performance demonstration
(1) PSD can be applied directly to the original
images without segmentation. This is shown
in Figs. 5(a), (b) and 6. However, the tradi-
tional detectors would require segmentation
in advance.
(2) It is invariant to rotation, brightness andcontrast. Fig. 6 illustrates it.
(3) It can detect bilateral symmetry, rotational
symmetry and curve symmetry at the same
time, that is, it is a fairly general detector.
See Fig. 5(a) and (b).
5.2. Comparisons with other methods
(1) Comparisons between PSD and KSD: KSD
represents the symmetry detector of Kovesi
(1996, 1997). The comparison between PSD
and KSD is given in Fig. 5(b) and (c). Obvi-
ously, the result of PSD is what we wanted.
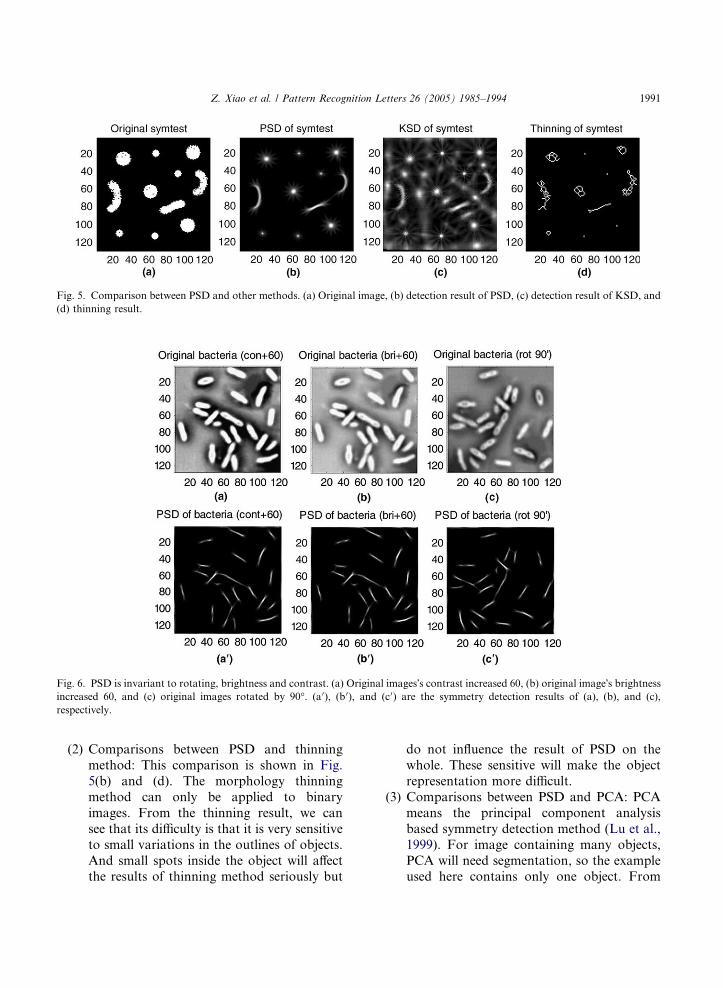
Fig. 5. Comparison between PSD and other methods. (a) Original image, (b) detection result of PSD, (c) detection result of KSD, and
(d) thinning result.
Fig. 6. PSD is invariant to rotating, brightness and contrast. (a) Original images�s contrast increased 60, (b) original image�s brightnessincreased 60, and (c) original images rotated by 90�. (a 0), (b 0), and (c 0) are the symmetry detection results of (a), (b), and (c),
respectively.
Z. Xiao et al. / Pattern Recognition Letters 26 (2005) 1985–1994 1991
(2) Comparisons between PSD and thinning
method: This comparison is shown in Fig.
5(b) and (d). The morphology thinning
method can only be applied to binary
images. From the thinning result, we can
see that its difficulty is that it is very sensitive
to small variations in the outlines of objects.
And small spots inside the object will affectthe results of thinning method seriously but
do not influence the result of PSD on the
whole. These sensitive will make the object
representation more difficult.
(3) Comparisons between PSD and PCA: PCA
means the principal component analysis
based symmetry detection method (Lu et al.,
1999). For image containing many objects,
PCA will need segmentation, so the exampleused here contains only one object. From
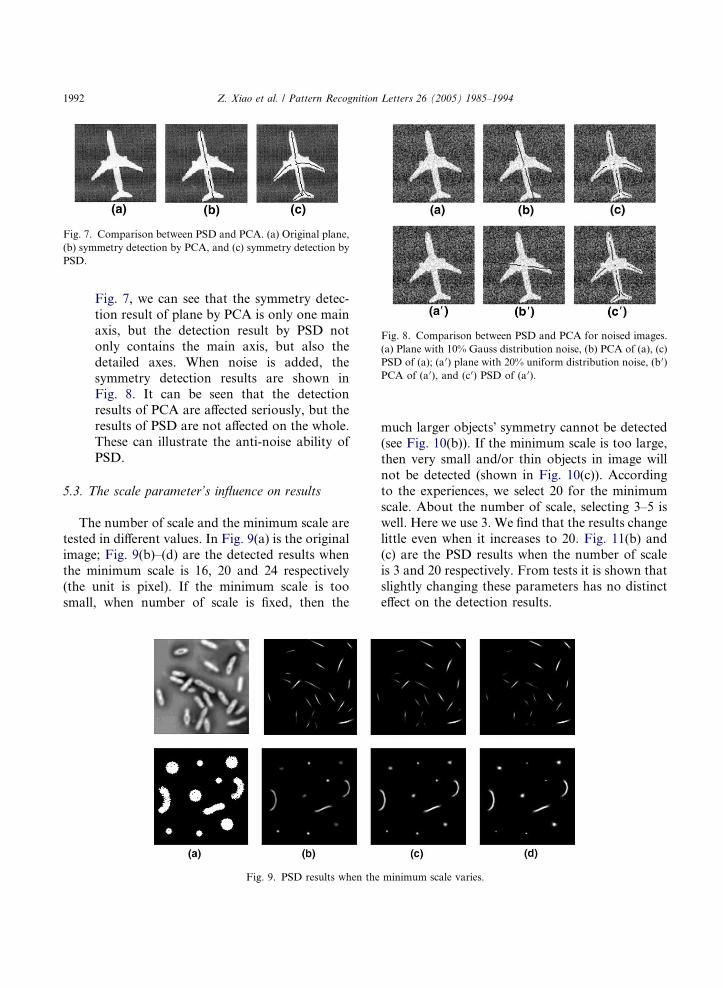
Fig. 7. Comparison between PSD and PCA. (a) Original plane,
(b) symmetry detection by PCA, and (c) symmetry detection by
PSD.
Fig. 8. Comparison between PSD and PCA for noised images.
(a) Plane with 10% Gauss distribution noise, (b) PCA of (a), (c)
PSD of (a); (a 0) plane with 20% uniform distribution noise, (b 0)
PCA of (a 0), and (c 0) PSD of (a 0).
1992 Z. Xiao et al. / Pattern Recognition Letters 26 (2005) 1985–1994
Fig. 7, we can see that the symmetry detec-
tion result of plane by PCA is only one main
axis, but the detection result by PSD not
only contains the main axis, but also the
detailed axes. When noise is added, the
symmetry detection results are shown inFig. 8. It can be seen that the detection
results of PCA are affected seriously, but the
results of PSD are not affected on the whole.
These can illustrate the anti-noise ability of
PSD.
5.3. The scale parameter’s influence on results
The number of scale and the minimum scale are
tested in different values. In Fig. 9(a) is the original
image; Fig. 9(b)–(d) are the detected results when
the minimum scale is 16, 20 and 24 respectively
(the unit is pixel). If the minimum scale is too
small, when number of scale is fixed, then the
Fig. 9. PSD results when the
much larger objects� symmetry cannot be detected(see Fig. 10(b)). If the minimum scale is too large,
then very small and/or thin objects in image will
not be detected (shown in Fig. 10(c)). According
to the experiences, we select 20 for the minimum
scale. About the number of scale, selecting 3–5 is
well. Here we use 3. We find that the results change
little even when it increases to 20. Fig. 11(b) and
(c) are the PSD results when the number of scaleis 3 and 20 respectively. From tests it is shown that
slightly changing these parameters has no distinct
effect on the detection results.
minimum scale varies.
Fig. 11. PSD results when the number of scale is changed.
Fig. 10. PSD results when the minimum scale is too small and too large.
Z. Xiao et al. / Pattern Recognition Letters 26 (2005) 1985–1994 1993
6. Conclusions
The main limitations of most existing symmetry
detection algorithms are discussed. The feasibility
of using phase information for symmetry detection
is analyzed. Then, based on phase congruency and
Kovesi�s symmetry detector, a novel phase-basedsymmetry detection algorithm (PSD) is given and
its rationality is demonstrated. And its computa-
tional complexity is analyzed simply. Finally, the
PSD performance is illustrated by experiments
and is compared with other techniques, such as
Kovesi�s symmetry detector, principal component
analysis based symmetry detector and thinning
method. The test results show that this algorithmcan be applied directly to original images without
segmentation—it is invariant to rotation, bright-
ness and contrast—it can detect bilateral symme-
try, rotational symmetry and curve symmetry at
the same time.
Acknowledgement
Sponsored by Tianjin Higher Education Science
and Technology Development Foundation under
grant 20041304, and China Postdoctoral Science
Foundation under grant 2003034328.
References
Atallah, J.R., 1985. On symmetry detection. IEEE Trans.
Comput. C-34, 663–666.
Kovesi, P., 1996. Invariant measures of image features from
phase information. Ph.D. thesis, University of Western
Australia. Available from: <http://www.csse.uwa.edu.au/
pub/robvis/theses/peterkovesi>.
Kovesi, P., 1997. Symmetry and asymmetry from local phase.
AI�97, Tenth Australian Joint Conference on Artificial
Intelligence, December 1997. pp. 185–190. Available from:
<http://www.cs.uwa.edu.au/pub/robvis/papers/pk/ai97.
ps.gz>.
Kovesi, P., 1999. Image features from phase congruency.
Videre: A Journal of Computer Vision Research. MIT
Press, 1(3). Available from: http://mitpress.mit.edu/e-jour-
nals/videre/001/v13.html.
Lu, C.Y., et al., 1999. Principal component analysis based
symmetry detection. Acta Electronic Sinica 27 (5), 25–28.
Mara, D.O., Owens, R., 1996. Measuring bilateral symmetry in
digital images. IEEE TENCON—Digital Signal Process.
Appl., 151–156.
Morrone, M.C., Owens, R.A., 1987. Feature detection from
local energy. Pattern Recognit. Lett. 6, 303–313.
Reisfeld, D., Wolfson, H., Yeshurun, Y., 1995. Context free
attentional operators: The generalized symmetry transform.
J. Comput. Vision 14, 119–130.

1994 Z. Xiao et al. / Pattern Recognition Letters 26 (2005) 1985–1994
Sun, C., 1995. Symmetry detection using gradient information.
Pattern Recognit. Lett. 16 (9), 987–996.
Sun, C., Si, D., 1999. Fast reflectional symmetry detection using
orientation histogram. Real-Time Imaging 5 (1), 63–74.
Thai, B., Healey, G., 1998. Modeling and classifying symme-
tries using a multiscale opponent color representation. IEEE
Trans. Pattern Anal. Mach. Intell. 20 (11), 1224–1235.
Xiao, Z.T. et al., 2002. Research on log Gabor wavelet and its
application in image edge detection. In: Proc. 6th Int. Conf.
on Signal Processing. Beijing, 2002, pp. 592–595.
Zhang, Y.J., 2000. Image Comprehension and Computer
Vision (image Engineering). Tsinghua University Press,
Beijing.
Recommended


![2017 ICCV Challenge: Detecting Symmetry in the Wildopenaccess.thecvf.com/content_ICCV_2017_workshops/papers/...symmetry [24] are still lagging behind [13, 25]. Our Symmetry Detection](https://img.pdfslide.us/doc/110x75/60ba2521db2bec2604179ed7/2017-iccv-challenge-detecting-symmetry-in-the-symmetry-24-are-still-lagging.jpg)