Embed Size (px)
Citation preview
The Gradient Product Transform forSymmetry Detection and Blood Vessel Extraction
Christoph Dalitz1, Regina Pohle-Frohlich1, Fabian Schmitt1 and Manuel Jeltsch1
1Institute for Pattern Recognition, Niederrhein Univerity of Applied Sciences, Reinarzstr. 49, 47805 Krefeld, Germanychristoph.dalitz, [email protected]
Keywords: symmetry detection, image filtering, blood vessels, vesselness filter, angiography
Abstract: The “gradient product transform” is a recently proposed image filter for assigning each image point a symmetryscore based on scalar products of gradients. In this article, we show that the originally suggested method forfinding the radius of the symmetry region is unreliable, and a more robust method is presented. Moreover, weextend the symmetry transform to rectangular symmetry regions so that it is more robust with respect to skew,and the transform is generalised to also work with three dimensional image data. We apply the transformto two different problems: detection of objects with rotational symmetry, and blood vessel extraction frommedical images. In an experimental comparison with other solutions for these problems, the gradient producttransform performs comparable to the best known algorithm for rotational symmetry detection, and better thanthe vesselness filter for blood vessel extraction.
1 Introduction
A symmetry is a geometric transformation underwhich a subset of an image is invariant. Formally,when f (~x) is the pixel value at position ~x, then a re-gion Ω is symmetric under the transformation σ if
f (σ(~x)) = f (~x) for all~x ∈Ω (1)
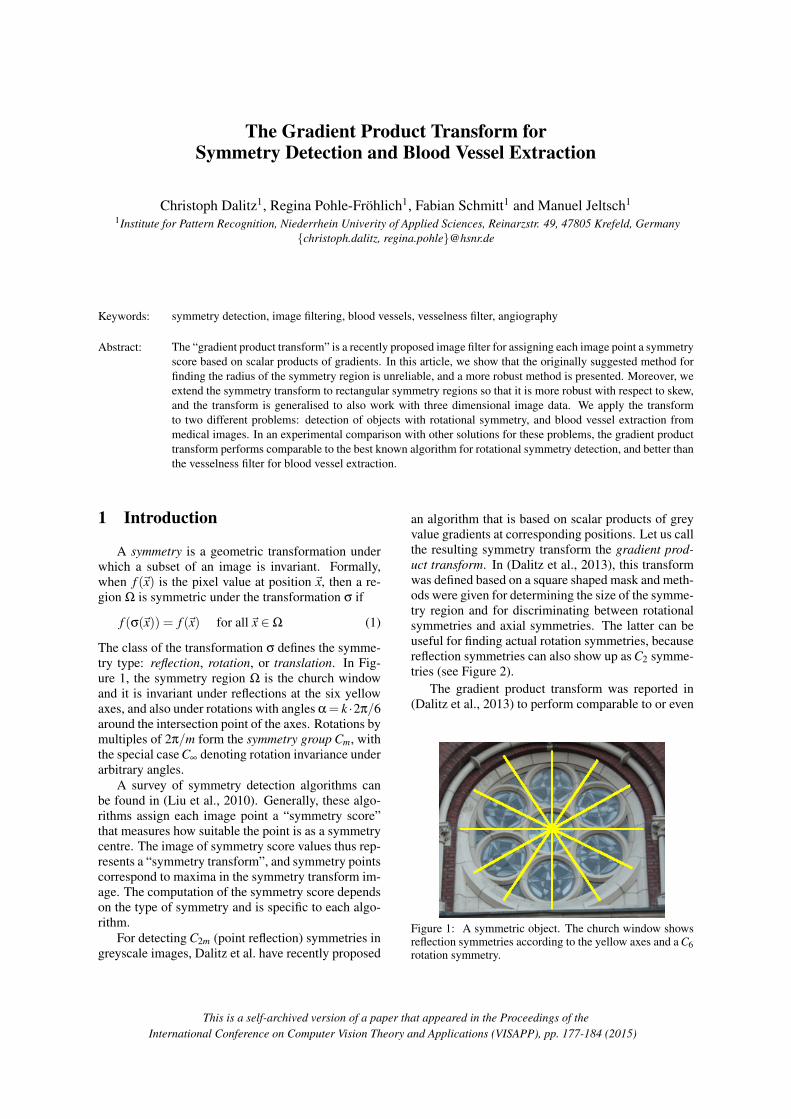
The class of the transformation σ defines the symme-try type: reflection, rotation, or translation. In Fig-ure 1, the symmetry region Ω is the church windowand it is invariant under reflections at the six yellowaxes, and also under rotations with angles α= k ·2π/6around the intersection point of the axes. Rotations bymultiples of 2π/m form the symmetry group Cm, withthe special case C∞ denoting rotation invariance underarbitrary angles.
A survey of symmetry detection algorithms canbe found in (Liu et al., 2010). Generally, these algo-rithms assign each image point a “symmetry score”that measures how suitable the point is as a symmetrycentre. The image of symmetry score values thus rep-resents a “symmetry transform”, and symmetry pointscorrespond to maxima in the symmetry transform im-age. The computation of the symmetry score dependson the type of symmetry and is specific to each algo-rithm.
For detecting C2m (point reflection) symmetries ingreyscale images, Dalitz et al. have recently proposed
an algorithm that is based on scalar products of greyvalue gradients at corresponding positions. Let us callthe resulting symmetry transform the gradient prod-uct transform. In (Dalitz et al., 2013), this transformwas defined based on a square shaped mask and meth-ods were given for determining the size of the symme-try region and for discriminating between rotationalsymmetries and axial symmetries. The latter can beuseful for finding actual rotation symmetries, becausereflection symmetries can also show up as C2 symme-tries (see Figure 2).
The gradient product transform was reported in(Dalitz et al., 2013) to perform comparable to or even
Figure 1: A symmetric object. The church window showsreflection symmetries according to the yellow axes and a C6rotation symmetry.
This is a self-archived version of a paper that appeared in the Proceedings of theInternational Conference on Computer Vision Theory and Applications (VISAPP), pp. 177-184 (2015)
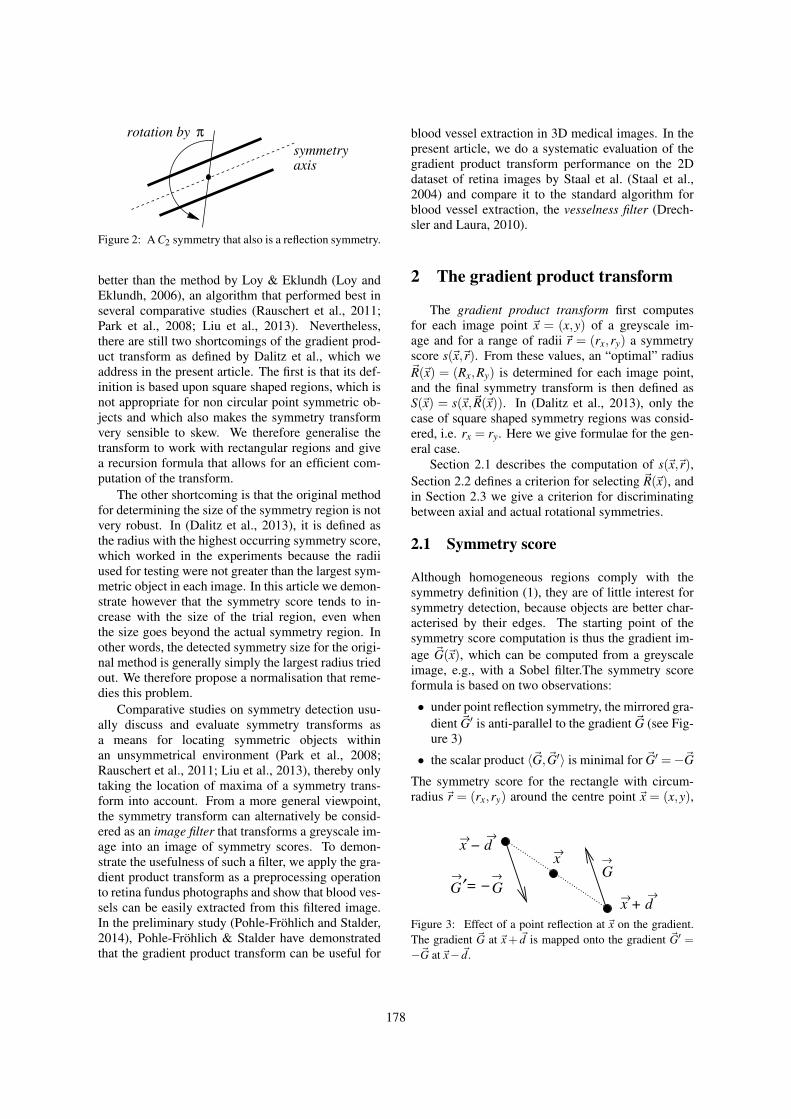
π
axis
rotation by
symmetry
Figure 2: A C2 symmetry that also is a reflection symmetry.
better than the method by Loy & Eklundh (Loy andEklundh, 2006), an algorithm that performed best inseveral comparative studies (Rauschert et al., 2011;Park et al., 2008; Liu et al., 2013). Nevertheless,there are still two shortcomings of the gradient prod-uct transform as defined by Dalitz et al., which weaddress in the present article. The first is that its def-inition is based upon square shaped regions, which isnot appropriate for non circular point symmetric ob-jects and which also makes the symmetry transformvery sensible to skew. We therefore generalise thetransform to work with rectangular regions and givea recursion formula that allows for an efficient com-putation of the transform.
The other shortcoming is that the original methodfor determining the size of the symmetry region is notvery robust. In (Dalitz et al., 2013), it is defined asthe radius with the highest occurring symmetry score,which worked in the experiments because the radiiused for testing were not greater than the largest sym-metric object in each image. In this article we demon-strate however that the symmetry score tends to in-crease with the size of the trial region, even whenthe size goes beyond the actual symmetry region. Inother words, the detected symmetry size for the origi-nal method is generally simply the largest radius triedout. We therefore propose a normalisation that reme-dies this problem.
Comparative studies on symmetry detection usu-ally discuss and evaluate symmetry transforms asa means for locating symmetric objects withinan unsymmetrical environment (Park et al., 2008;Rauschert et al., 2011; Liu et al., 2013), thereby onlytaking the location of maxima of a symmetry trans-form into account. From a more general viewpoint,the symmetry transform can alternatively be consid-ered as an image filter that transforms a greyscale im-age into an image of symmetry scores. To demon-strate the usefulness of such a filter, we apply the gra-dient product transform as a preprocessing operationto retina fundus photographs and show that blood ves-sels can be easily extracted from this filtered image.In the preliminary study (Pohle-Frohlich and Stalder,2014), Pohle-Frohlich & Stalder have demonstratedthat the gradient product transform can be useful for
blood vessel extraction in 3D medical images. In thepresent article, we do a systematic evaluation of thegradient product transform performance on the 2Ddataset of retina images by Staal et al. (Staal et al.,2004) and compare it to the standard algorithm forblood vessel extraction, the vesselness filter (Drech-sler and Laura, 2010).
2 The gradient product transform
The gradient product transform first computesfor each image point ~x = (x,y) of a greyscale im-age and for a range of radii ~r = (rx,ry) a symmetryscore s(~x,~r). From these values, an “optimal” radius~R(~x) = (Rx,Ry) is determined for each image point,and the final symmetry transform is then defined asS(~x) = s(~x,~R(~x)). In (Dalitz et al., 2013), only thecase of square shaped symmetry regions was consid-ered, i.e. rx = ry. Here we give formulae for the gen-eral case.
Section 2.1 describes the computation of s(~x,~r),Section 2.2 defines a criterion for selecting ~R(~x), andin Section 2.3 we give a criterion for discriminatingbetween axial and actual rotational symmetries.
2.1 Symmetry score
Although homogeneous regions comply with thesymmetry definition (1), they are of little interest forsymmetry detection, because objects are better char-acterised by their edges. The starting point of thesymmetry score computation is thus the gradient im-age ~G(~x), which can be computed from a greyscaleimage, e.g., with a Sobel filter.The symmetry scoreformula is based on two observations:
• under point reflection symmetry, the mirrored gra-dient ~G′ is anti-parallel to the gradient ~G (see Fig-ure 3)
• the scalar product 〈~G, ~G′〉 is minimal for ~G′ =−~GThe symmetry score for the rectangle with circum-radius ~r = (rx,ry) around the centre point ~x = (x,y),
x + d
G
= −G
→
→→
G ′
x→
→
→ →
x − d→
Figure 3: Effect of a point reflection at ~x on the gradient.The gradient ~G at ~x+ ~d is mapped onto the gradient ~G′ =−~G at~x− ~d.
178
i.e., the rectangle with upper left~x−~r and lower right~x+~r, is therefore defined as
s(~x,~r) =−rx
∑dx=1
⟨~G(dx,0), ~G(−dx,0)
⟩−
ry
∑dy=1
rx
∑dx=−rx
⟨~G(dx,dy), ~G(−dx,−dy)
⟩(2)
where ~G(dx,dy) denotes the gradient at position (x+dx,y+dy). The sum is split up so that each point paironly occurs once, and the minus sign is added for con-venience so that a higher symmetry corresponds to ahigher score value, not vice versa. As the size of thesymmetry region is not known in advance, the score(2) must be computed for all radii 1 ≤ rx,ry ≤ rmax.All scores s(~x,~r) can be computed in a single run overthe symmetry region with the following recursion for-mula for rx,ry > 1:
s(~x,(rx,ry)
)= s
(~x,(rx−1,ry)
)(3)
+s(~x,(rx,ry−1)
)−s(~x,(rx−1,ry−1)
)−〈~G(rx,ry), ~G(−rx,−ry)〉−〈~G(rx,−ry), ~G(−rx,ry)〉
The computation of all scores up to a radius rmaxthus only requires O(r2
max) additions, not O(r4max) that
would be required by a naıve application of Eq. (2).To generalise Eq. (2) to more than two dimensions, itis more convenient to notate the formula in a compactvector notation:
s(~x,~r) =−12 ∑
~d∈Ω(−~r,~r)~d 6=~0
⟨~G(~d), ~G(−~d)
⟩(4)
where ~G(~d) denotes the greyscale gradient at position~x+~d, and Ω(−~r,~r) denotes the region of the rectangleor cuboid with corners−~r and~r. The factor 1/2 com-pensates for the fact that each pair of correspondingmirror points occurs twice in the sum. Eq. (4) holdsfor any dimension.
2.2 Symmetry size
When the symmetry score (2) is computed for a rangeof circumradii ~r, the question arises which of theseradii represents the size of the symmetry region. In(Dalitz et al., 2013), Dalitz et al. suggested to simplytake the radius with the highest score, which would befor our generalised case of rectangular regions
~R = arg~r maxs(~x,~r) |max(rx,ry)≤ rmax (5)
−α(r/r )
0 s(r) / s(r )0
r / r0
0
0.2
0.4
0.6
0.8
1
1.2
1.4
0 0.5 1 1.5 2
α = 0.0
α = 0.5
α = 1.0
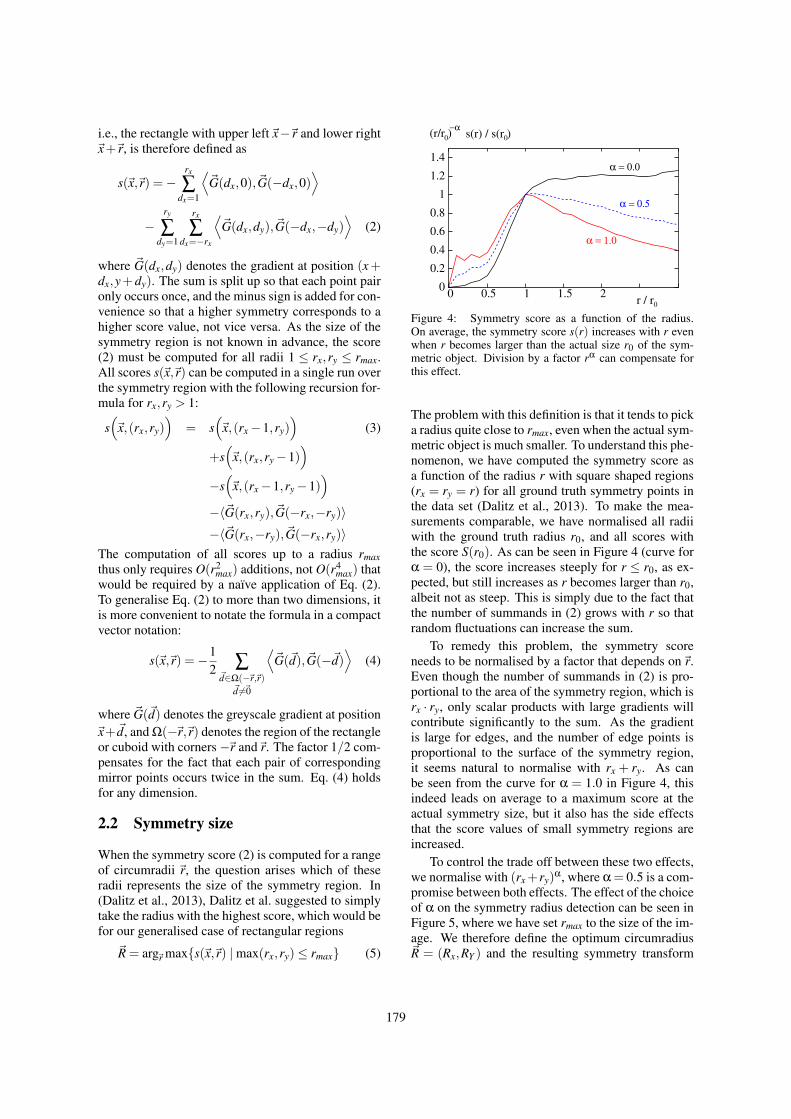
Figure 4: Symmetry score as a function of the radius.On average, the symmetry score s(r) increases with r evenwhen r becomes larger than the actual size r0 of the sym-metric object. Division by a factor rα can compensate forthis effect.
The problem with this definition is that it tends to picka radius quite close to rmax, even when the actual sym-metric object is much smaller. To understand this phe-nomenon, we have computed the symmetry score asa function of the radius r with square shaped regions(rx = ry = r) for all ground truth symmetry points inthe data set (Dalitz et al., 2013). To make the mea-surements comparable, we have normalised all radiiwith the ground truth radius r0, and all scores withthe score S(r0). As can be seen in Figure 4 (curve forα = 0), the score increases steeply for r ≤ r0, as ex-pected, but still increases as r becomes larger than r0,albeit not as steep. This is simply due to the fact thatthe number of summands in (2) grows with r so thatrandom fluctuations can increase the sum.
To remedy this problem, the symmetry scoreneeds to be normalised by a factor that depends on~r.Even though the number of summands in (2) is pro-portional to the area of the symmetry region, which isrx · ry, only scalar products with large gradients willcontribute significantly to the sum. As the gradientis large for edges, and the number of edge points isproportional to the surface of the symmetry region,it seems natural to normalise with rx + ry. As canbe seen from the curve for α = 1.0 in Figure 4, thisindeed leads on average to a maximum score at theactual symmetry size, but it also has the side effectsthat the score values of small symmetry regions areincreased.
To control the trade off between these two effects,we normalise with (rx+ry)
α, where α = 0.5 is a com-promise between both effects. The effect of the choiceof α on the symmetry radius detection can be seen inFigure 5, where we have set rmax to the size of the im-age. We therefore define the optimum circumradius~R = (Rx,RY ) and the resulting symmetry transform
179
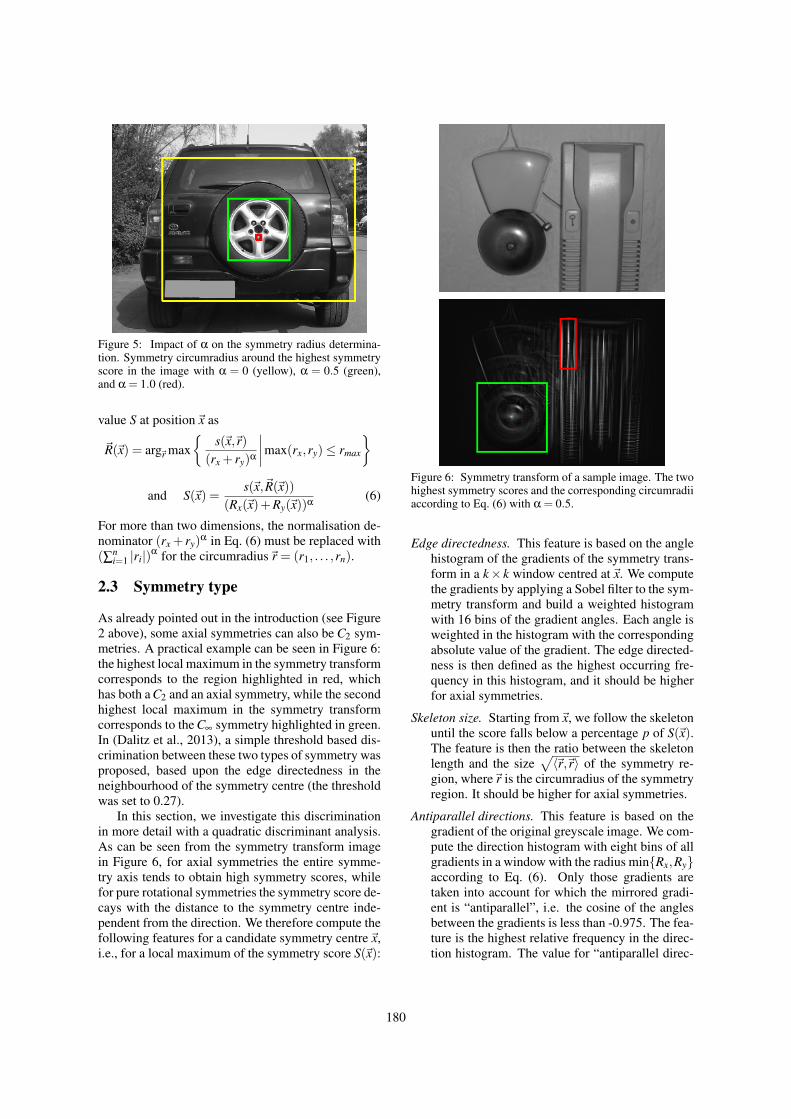
Figure 5: Impact of α on the symmetry radius determina-tion. Symmetry circumradius around the highest symmetryscore in the image with α = 0 (yellow), α = 0.5 (green),and α = 1.0 (red).
value S at position~x as
~R(~x) = arg~r max
s(~x,~r)(rx + ry)α
∣∣∣∣max(rx,ry)≤ rmax
and S(~x) =s(~x,~R(~x))
(Rx(~x)+Ry(~x))α(6)
For more than two dimensions, the normalisation de-nominator (rx + ry)
α in Eq. (6) must be replaced with(∑n
i=1 |ri|)α for the circumradius~r = (r1, . . . ,rn).
2.3 Symmetry type
As already pointed out in the introduction (see Figure2 above), some axial symmetries can also be C2 sym-metries. A practical example can be seen in Figure 6:the highest local maximum in the symmetry transformcorresponds to the region highlighted in red, whichhas both a C2 and an axial symmetry, while the secondhighest local maximum in the symmetry transformcorresponds to the C∞ symmetry highlighted in green.In (Dalitz et al., 2013), a simple threshold based dis-crimination between these two types of symmetry wasproposed, based upon the edge directedness in theneighbourhood of the symmetry centre (the thresholdwas set to 0.27).
In this section, we investigate this discriminationin more detail with a quadratic discriminant analysis.As can be seen from the symmetry transform imagein Figure 6, for axial symmetries the entire symme-try axis tends to obtain high symmetry scores, whilefor pure rotational symmetries the symmetry score de-cays with the distance to the symmetry centre inde-pendent from the direction. We therefore compute thefollowing features for a candidate symmetry centre~x,i.e., for a local maximum of the symmetry score S(~x):
Figure 6: Symmetry transform of a sample image. The twohighest symmetry scores and the corresponding circumradiiaccording to Eq. (6) with α = 0.5.
Edge directedness. This feature is based on the anglehistogram of the gradients of the symmetry trans-form in a k× k window centred at~x. We computethe gradients by applying a Sobel filter to the sym-metry transform and build a weighted histogramwith 16 bins of the gradient angles. Each angle isweighted in the histogram with the correspondingabsolute value of the gradient. The edge directed-ness is then defined as the highest occurring fre-quency in this histogram, and it should be higherfor axial symmetries.
Skeleton size. Starting from~x, we follow the skeletonuntil the score falls below a percentage p of S(~x).The feature is then the ratio between the skeletonlength and the size
√〈~r,~r〉 of the symmetry re-
gion, where~r is the circumradius of the symmetryregion. It should be higher for axial symmetries.
Antiparallel directions. This feature is based on thegradient of the original greyscale image. We com-pute the direction histogram with eight bins of allgradients in a window with the radius minRx,Ryaccording to Eq. (6). Only those gradients aretaken into account for which the mirrored gradi-ent is “antiparallel”, i.e. the cosine of the anglesbetween the gradients is less than -0.975. The fea-ture is the highest relative frequency in the direc-tion histogram. The value for “antiparallel direc-
180
Scatter Plot Matrix
edge_dir0.4
0.5
0.6
0.7 0.4 0.5 0.6 0.7
0.1
0.2
0.3
0.4
0.1 0.2 0.3 0.4
skel_size0.6
0.8
1.00.6 0.8 1.0
0.0
0.2
0.4
0.0 0.2 0.4
anti_par
0.4
0.50.4 0.5
0.2
0.3
0.2 0.3
cov_ratio0.6
0.8
1.00.6 0.8 1.0
0.0
0.2
0.4
0.0 0.2 0.4
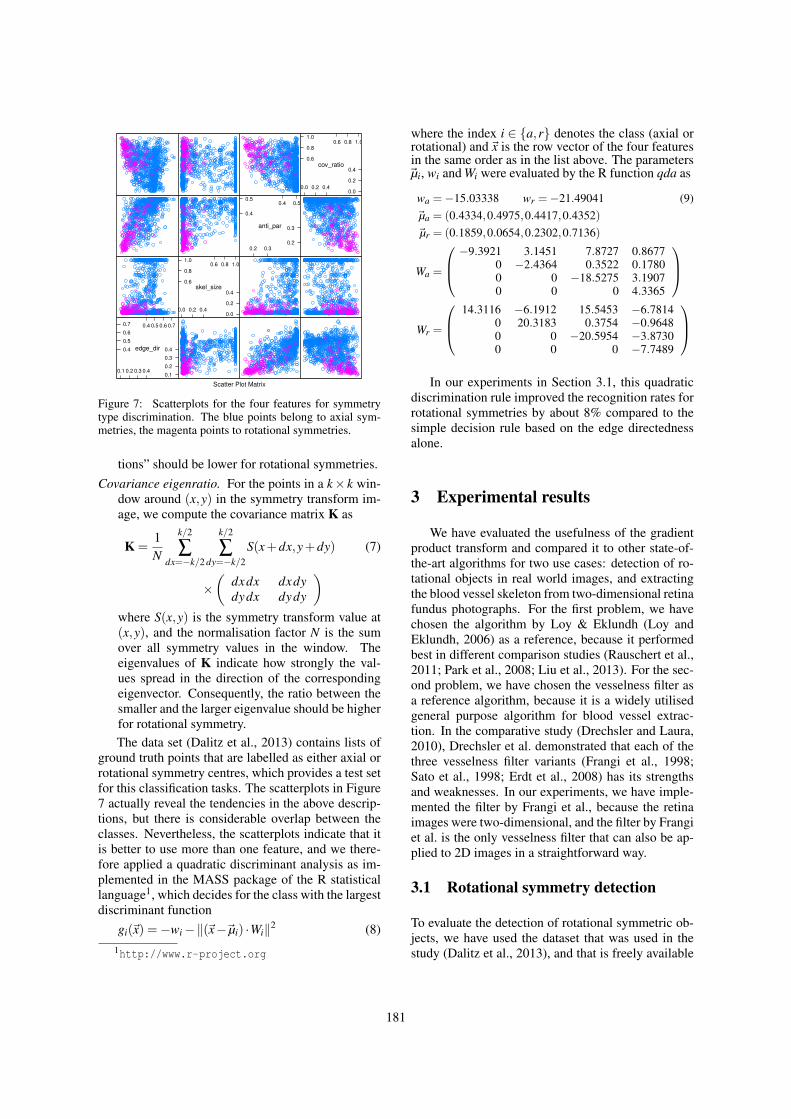
Figure 7: Scatterplots for the four features for symmetrytype discrimination. The blue points belong to axial sym-metries, the magenta points to rotational symmetries.
tions” should be lower for rotational symmetries.Covariance eigenratio. For the points in a k× k win-
dow around (x,y) in the symmetry transform im-age, we compute the covariance matrix K as
K =1N
k/2
∑dx=−k/2
k/2
∑dy=−k/2
S(x+dx,y+dy) (7)
×(
dxdx dxdydydx dydy
)where S(x,y) is the symmetry transform value at(x,y), and the normalisation factor N is the sumover all symmetry values in the window. Theeigenvalues of K indicate how strongly the val-ues spread in the direction of the correspondingeigenvector. Consequently, the ratio between thesmaller and the larger eigenvalue should be higherfor rotational symmetry.The data set (Dalitz et al., 2013) contains lists of
ground truth points that are labelled as either axial orrotational symmetry centres, which provides a test setfor this classification tasks. The scatterplots in Figure7 actually reveal the tendencies in the above descrip-tions, but there is considerable overlap between theclasses. Nevertheless, the scatterplots indicate that itis better to use more than one feature, and we there-fore applied a quadratic discriminant analysis as im-plemented in the MASS package of the R statisticallanguage1, which decides for the class with the largestdiscriminant function
gi(~x) =−wi−‖(~x−~µi) ·Wi‖2 (8)1http://www.r-project.org
where the index i ∈ a,r denotes the class (axial orrotational) and~x is the row vector of the four featuresin the same order as in the list above. The parameters~µi, wi and Wi were evaluated by the R function qda as
wa =−15.03338 wr =−21.49041 (9)~µa = (0.4334,0.4975,0.4417,0.4352)~µr = (0.1859,0.0654,0.2302,0.7136)
Wa =
−9.3921 3.1451 7.8727 0.86770 −2.4364 0.3522 0.17800 0 −18.5275 3.19070 0 0 4.3365
Wr =
14.3116 −6.1912 15.5453 −6.78140 20.3183 0.3754 −0.96480 0 −20.5954 −3.87300 0 0 −7.7489
In our experiments in Section 3.1, this quadratic
discrimination rule improved the recognition rates forrotational symmetries by about 8% compared to thesimple decision rule based on the edge directednessalone.
3 Experimental results
We have evaluated the usefulness of the gradientproduct transform and compared it to other state-of-the-art algorithms for two use cases: detection of ro-tational objects in real world images, and extractingthe blood vessel skeleton from two-dimensional retinafundus photographs. For the first problem, we havechosen the algorithm by Loy & Eklundh (Loy andEklundh, 2006) as a reference, because it performedbest in different comparison studies (Rauschert et al.,2011; Park et al., 2008; Liu et al., 2013). For the sec-ond problem, we have chosen the vesselness filter asa reference algorithm, because it is a widely utilisedgeneral purpose algorithm for blood vessel extrac-tion. In the comparative study (Drechsler and Laura,2010), Drechsler et al. demonstrated that each of thethree vesselness filter variants (Frangi et al., 1998;Sato et al., 1998; Erdt et al., 2008) has its strengthsand weaknesses. In our experiments, we have imple-mented the filter by Frangi et al., because the retinaimages were two-dimensional, and the filter by Frangiet al. is the only vesselness filter that can also be ap-plied to 2D images in a straightforward way.
3.1 Rotational symmetry detection
To evaluate the detection of rotational symmetric ob-jects, we have used the dataset that was used in thestudy (Dalitz et al., 2013), and that is freely available
181
square rectangular Loy &Count α = 0 α = 0.5 α = 0 α = 0.5 Eklundh
Detail 83 0.58 0.60 0.59 0.58 0.37Context 76 0.16 0.30 0.22 0.32 0.37Front 43 0.51 0.63 0.56 0.53 0.70Light skew 57 0.39 0.51 0.46 0.53 0.39Strong skew 59 0.27 0.29 0.27 0.32 0.12Total 159 0.38 0.46 0.42 0.45 0.37Area precision 0.39 0.70 0.37 0.80
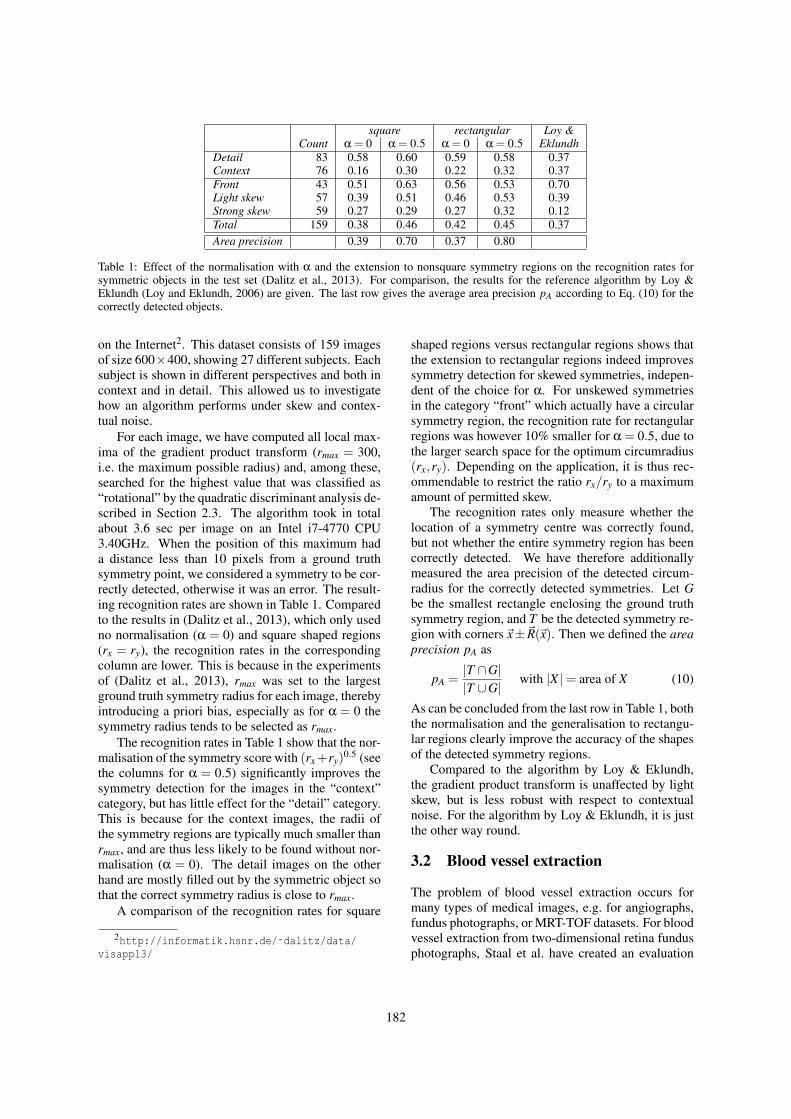
Table 1: Effect of the normalisation with α and the extension to nonsquare symmetry regions on the recognition rates forsymmetric objects in the test set (Dalitz et al., 2013). For comparison, the results for the reference algorithm by Loy &Eklundh (Loy and Eklundh, 2006) are given. The last row gives the average area precision pA according to Eq. (10) for thecorrectly detected objects.
on the Internet2. This dataset consists of 159 imagesof size 600×400, showing 27 different subjects. Eachsubject is shown in different perspectives and both incontext and in detail. This allowed us to investigatehow an algorithm performs under skew and contex-tual noise.
For each image, we have computed all local max-ima of the gradient product transform (rmax = 300,i.e. the maximum possible radius) and, among these,searched for the highest value that was classified as“rotational” by the quadratic discriminant analysis de-scribed in Section 2.3. The algorithm took in totalabout 3.6 sec per image on an Intel i7-4770 CPU3.40GHz. When the position of this maximum hada distance less than 10 pixels from a ground truthsymmetry point, we considered a symmetry to be cor-rectly detected, otherwise it was an error. The result-ing recognition rates are shown in Table 1. Comparedto the results in (Dalitz et al., 2013), which only usedno normalisation (α = 0) and square shaped regions(rx = ry), the recognition rates in the correspondingcolumn are lower. This is because in the experimentsof (Dalitz et al., 2013), rmax was set to the largestground truth symmetry radius for each image, therebyintroducing a priori bias, especially as for α = 0 thesymmetry radius tends to be selected as rmax.
The recognition rates in Table 1 show that the nor-malisation of the symmetry score with (rx+ry)
0.5 (seethe columns for α = 0.5) significantly improves thesymmetry detection for the images in the “context”category, but has little effect for the “detail” category.This is because for the context images, the radii ofthe symmetry regions are typically much smaller thanrmax, and are thus less likely to be found without nor-malisation (α = 0). The detail images on the otherhand are mostly filled out by the symmetric object sothat the correct symmetry radius is close to rmax.
A comparison of the recognition rates for square
2http://informatik.hsnr.de/˜dalitz/data/visapp13/
shaped regions versus rectangular regions shows thatthe extension to rectangular regions indeed improvessymmetry detection for skewed symmetries, indepen-dent of the choice for α. For unskewed symmetriesin the category “front” which actually have a circularsymmetry region, the recognition rate for rectangularregions was however 10% smaller for α = 0.5, due tothe larger search space for the optimum circumradius(rx,ry). Depending on the application, it is thus rec-ommendable to restrict the ratio rx/ry to a maximumamount of permitted skew.
The recognition rates only measure whether thelocation of a symmetry centre was correctly found,but not whether the entire symmetry region has beencorrectly detected. We have therefore additionallymeasured the area precision of the detected circum-radius for the correctly detected symmetries. Let Gbe the smallest rectangle enclosing the ground truthsymmetry region, and T be the detected symmetry re-gion with corners~x±~R(~x). Then we defined the areaprecision pA as
pA =|T ∩G||T ∪G|
with |X |= area of X (10)
As can be concluded from the last row in Table 1, boththe normalisation and the generalisation to rectangu-lar regions clearly improve the accuracy of the shapesof the detected symmetry regions.
Compared to the algorithm by Loy & Eklundh,the gradient product transform is unaffected by lightskew, but is less robust with respect to contextualnoise. For the algorithm by Loy & Eklundh, it is justthe other way round.
3.2 Blood vessel extraction
The problem of blood vessel extraction occurs formany types of medical images, e.g. for angiographs,fundus photographs, or MRT-TOF datasets. For bloodvessel extraction from two-dimensional retina fundusphotographs, Staal et al. have created an evaluation
182
dataset known as the DRIVE database (“Digital Reti-nal Images for Vessel Extraction”) (Staal et al., 2004).In consists of 40 colour images, divided into 20 train-ing and 20 test images, with ground truth data manu-ally extracted by medical experts (see Figure 8).
From the colour images, we have used the greenchannel as input to both our symmetry transform andthe vesselness filter, because this channel had thehighest contrast. It should be noted that Shahbeigrecently suggested sophisticated preprocessing oper-ations on these particular images which strongly en-hance the visibility of the blood vessels (Shahbeig,2013). As we were less concerned with the specificproblem of retina photographs, but wanted to evaluatethe vessel extraction on typical medical images, werestricted ourselves to a Gaussian blur with windowsize k = 3 and variance σ2 = 1.0 as the only prepro-cessing operation on the green channel images; thispreprocessing operation was only applied before thesymmetry transform, but not before the vesselness fil-ter because the latter does a Gaussian blurring any-way.
When applying the gradient product transform toblood vessel extraction, there are two issues:1) Depending on the imaging technique, blood ves-
sels are either darker or lighter than the surround-ing tissue, but the gradient product transform in-variably detects symmetries in both dark and lightobjects.
2) The gradient product transform results in a floatimage of symmetry scores and not in a skeletonimage. The same holds for the vesselness filter.To solve the the first issue, we have modified the
symmetry score from Eq. (4) to
s(~x,~r) =−12 ∑
~d∈Ω(−~r,~r)~d 6=~0
⟨~G(~d), ~G(−~d)
⟩(11)
×H(±⟨~d, ~G(~d)
⟩)where H denotes Heavyside’s step function (zero fornegative arguments, and one for positive arguments),and the sign in its arguments controls which type of
Figure 8: Sample image from the DRIVE dataset and itscorresponding ground truth.
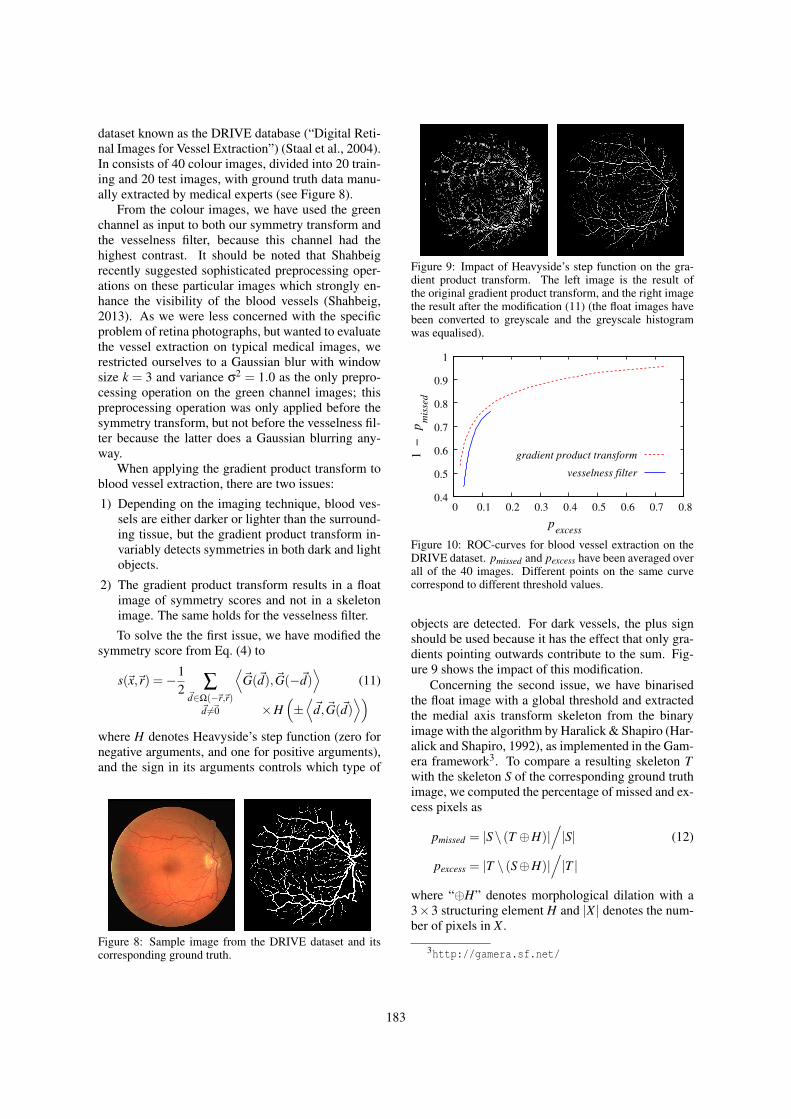
Figure 9: Impact of Heavyside’s step function on the gra-dient product transform. The left image is the result ofthe original gradient product transform, and the right imagethe result after the modification (11) (the float images havebeen converted to greyscale and the greyscale histogramwas equalised).
pexcess
pm
isse
d1
−
gradient product transform
vesselness filter
0 0.1 0.2 0.3 0.4 0.5 0.6 0.7 0.8 0.4
0.5
0.6
0.7
0.8
0.9
1
Figure 10: ROC-curves for blood vessel extraction on theDRIVE dataset. pmissed and pexcess have been averaged overall of the 40 images. Different points on the same curvecorrespond to different threshold values.
objects are detected. For dark vessels, the plus signshould be used because it has the effect that only gra-dients pointing outwards contribute to the sum. Fig-ure 9 shows the impact of this modification.
Concerning the second issue, we have binarisedthe float image with a global threshold and extractedthe medial axis transform skeleton from the binaryimage with the algorithm by Haralick & Shapiro (Har-alick and Shapiro, 1992), as implemented in the Gam-era framework3. To compare a resulting skeleton Twith the skeleton S of the corresponding ground truthimage, we computed the percentage of missed and ex-cess pixels as
pmissed = |S\ (T ⊕H)|/|S| (12)
pexcess = |T \ (S⊕H)|/|T |
where “⊕H” denotes morphological dilation with a3×3 structuring element H and |X | denotes the num-ber of pixels in X .
3http://gamera.sf.net/
183
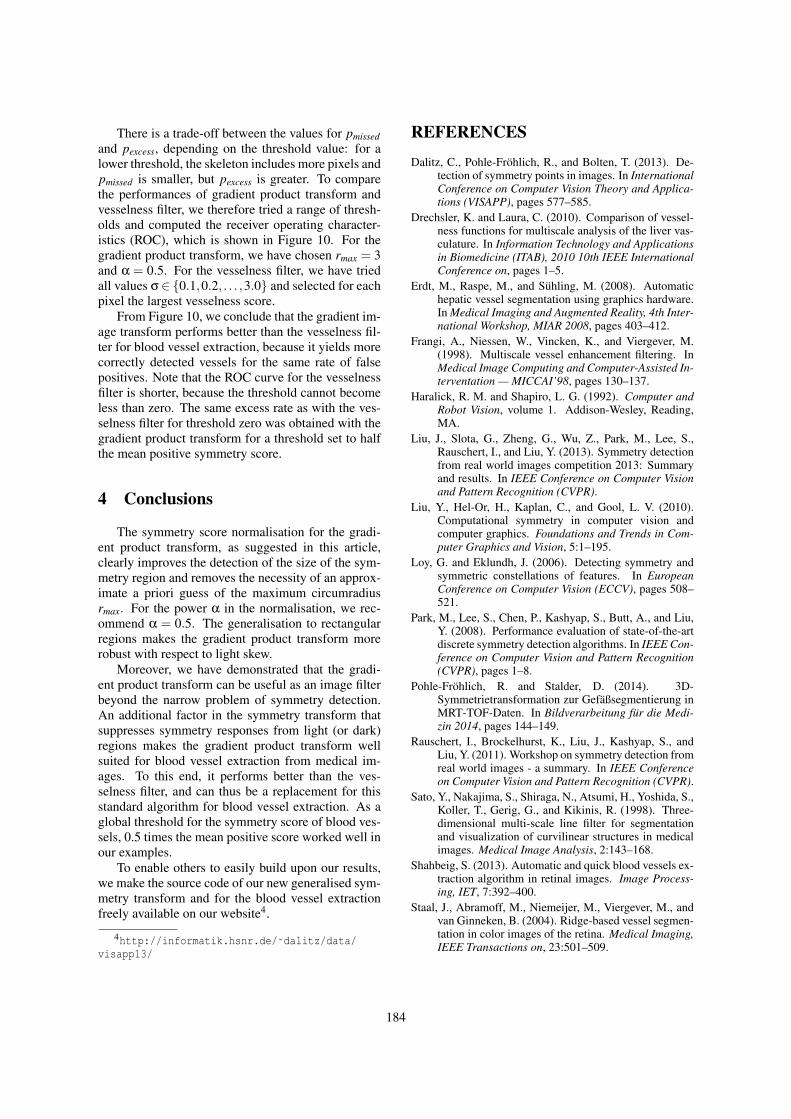
There is a trade-off between the values for pmissedand pexcess, depending on the threshold value: for alower threshold, the skeleton includes more pixels andpmissed is smaller, but pexcess is greater. To comparethe performances of gradient product transform andvesselness filter, we therefore tried a range of thresh-olds and computed the receiver operating character-istics (ROC), which is shown in Figure 10. For thegradient product transform, we have chosen rmax = 3and α = 0.5. For the vesselness filter, we have triedall values σ∈ 0.1,0.2, . . . ,3.0 and selected for eachpixel the largest vesselness score.
From Figure 10, we conclude that the gradient im-age transform performs better than the vesselness fil-ter for blood vessel extraction, because it yields morecorrectly detected vessels for the same rate of falsepositives. Note that the ROC curve for the vesselnessfilter is shorter, because the threshold cannot becomeless than zero. The same excess rate as with the ves-selness filter for threshold zero was obtained with thegradient product transform for a threshold set to halfthe mean positive symmetry score.
4 Conclusions
The symmetry score normalisation for the gradi-ent product transform, as suggested in this article,clearly improves the detection of the size of the sym-metry region and removes the necessity of an approx-imate a priori guess of the maximum circumradiusrmax. For the power α in the normalisation, we rec-ommend α = 0.5. The generalisation to rectangularregions makes the gradient product transform morerobust with respect to light skew.
Moreover, we have demonstrated that the gradi-ent product transform can be useful as an image filterbeyond the narrow problem of symmetry detection.An additional factor in the symmetry transform thatsuppresses symmetry responses from light (or dark)regions makes the gradient product transform wellsuited for blood vessel extraction from medical im-ages. To this end, it performs better than the ves-selness filter, and can thus be a replacement for thisstandard algorithm for blood vessel extraction. As aglobal threshold for the symmetry score of blood ves-sels, 0.5 times the mean positive score worked well inour examples.
To enable others to easily build upon our results,we make the source code of our new generalised sym-metry transform and for the blood vessel extractionfreely available on our website4.
4http://informatik.hsnr.de/˜dalitz/data/visapp13/
REFERENCES
Dalitz, C., Pohle-Frohlich, R., and Bolten, T. (2013). De-tection of symmetry points in images. In InternationalConference on Computer Vision Theory and Applica-tions (VISAPP), pages 577–585.
Drechsler, K. and Laura, C. (2010). Comparison of vessel-ness functions for multiscale analysis of the liver vas-culature. In Information Technology and Applicationsin Biomedicine (ITAB), 2010 10th IEEE InternationalConference on, pages 1–5.
Erdt, M., Raspe, M., and Suhling, M. (2008). Automatichepatic vessel segmentation using graphics hardware.In Medical Imaging and Augmented Reality, 4th Inter-national Workshop, MIAR 2008, pages 403–412.
Frangi, A., Niessen, W., Vincken, K., and Viergever, M.(1998). Multiscale vessel enhancement filtering. InMedical Image Computing and Computer-Assisted In-terventation — MICCAI’98, pages 130–137.
Haralick, R. M. and Shapiro, L. G. (1992). Computer andRobot Vision, volume 1. Addison-Wesley, Reading,MA.
Liu, J., Slota, G., Zheng, G., Wu, Z., Park, M., Lee, S.,Rauschert, I., and Liu, Y. (2013). Symmetry detectionfrom real world images competition 2013: Summaryand results. In IEEE Conference on Computer Visionand Pattern Recognition (CVPR).
Liu, Y., Hel-Or, H., Kaplan, C., and Gool, L. V. (2010).Computational symmetry in computer vision andcomputer graphics. Foundations and Trends in Com-puter Graphics and Vision, 5:1–195.
Loy, G. and Eklundh, J. (2006). Detecting symmetry andsymmetric constellations of features. In EuropeanConference on Computer Vision (ECCV), pages 508–521.
Park, M., Lee, S., Chen, P., Kashyap, S., Butt, A., and Liu,Y. (2008). Performance evaluation of state-of-the-artdiscrete symmetry detection algorithms. In IEEE Con-ference on Computer Vision and Pattern Recognition(CVPR), pages 1–8.
Pohle-Frohlich, R. and Stalder, D. (2014). 3D-Symmetrietransformation zur Gefaßsegmentierung inMRT-TOF-Daten. In Bildverarbeitung fur die Medi-zin 2014, pages 144–149.
Rauschert, I., Brockelhurst, K., Liu, J., Kashyap, S., andLiu, Y. (2011). Workshop on symmetry detection fromreal world images - a summary. In IEEE Conferenceon Computer Vision and Pattern Recognition (CVPR).
Sato, Y., Nakajima, S., Shiraga, N., Atsumi, H., Yoshida, S.,Koller, T., Gerig, G., and Kikinis, R. (1998). Three-dimensional multi-scale line filter for segmentationand visualization of curvilinear structures in medicalimages. Medical Image Analysis, 2:143–168.
Shahbeig, S. (2013). Automatic and quick blood vessels ex-traction algorithm in retinal images. Image Process-ing, IET, 7:392–400.
Staal, J., Abramoff, M., Niemeijer, M., Viergever, M., andvan Ginneken, B. (2004). Ridge-based vessel segmen-tation in color images of the retina. Medical Imaging,IEEE Transactions on, 23:501–509.
184