International Journal of Science and Research (IJSR) ISSN (Online): 2319-7064
Index Copernicus Value (2013): 6.14 | Impact Factor (2013): 4.438
Volume 4 Issue 7, July 2015
www.ijsr.net Licensed Under Creative Commons Attribution CC BY
Usage of Online Shopping Among College
Students with Special Reference to Coimbatore
City
Dr. S. Nirmala1, A.Harisevitha
2
1Principal, Department of Business Administration, PSGR Krishnammal College for Women, Coimbatore
2M.Phil - Research Scholar, Department of Business Administration, PSGR Krishnammal College for Women, Coimbatore
Abstract: This study tries to find out the penetration of online shopping and the preferences of online shopping website among
students with special references to Coimbatore district.The online shopping websites like “Flip kart, Amazon, Jabong”, and others were
taken to understand which website is the most preferred by the students. Descriptive study was conducted by using questioner method
with a sample size of 100 respondents. An appropriate statistical tool like frequency analysis, crosstab, independent t-test, chi square and
anova was done to arrive at the result. The conclusive result shows that female students prefer online shopping more compared to male
students and it was also revealed that the Flip kart is the leading website among students compared to the other online shopping
websites.
Keywords: online shopping, buying behaviour, preferences of website
1. Introduction
Online shopping has been a growing trend in all four corners
of the world, in exacting amongst countries possessing
highly developed infrastructure available for marketing
performance through the internet.According to Internet
World Stats, India has the third largest number of
internetusers in the world after China and the USA despite
having a low internet penetrationrate of just 8.5 percent.
India’s count of internet users has been increasing at a
CAGR of35 percent from 2007. From 100 million users in
2010, the number will touch 237 millionusers by 2015 as per
Boston Consulting Group 2010 report.The five dominant
factors which influence consumer perceptions of online
shopping are information are to use satisfactions,
safety/confidentiality, and proper exploitation. Therefore,
understanding consumer attitude towards online shopping
helps marketing managers to predict the online shopping rate
and estimate the future growth of online commerce.
2. Statement of the Problem
Thus this study has been carried out on the title “ A study on
online shopping among college students and its difficulties
in Coimbatore District’’ This study will help us to
understand the students preference towards the usage of
internet for shopping and the difficulties faced by them in
the process.
3. Objectives of Study
1. To ascertain the usage of internet for online shopping by
different categories of college students in terms of
education qualification, age and gender.
2. To assess the reasons for which the online shopping is
being used.
3. To assess the benefits enjoyed during online shopping.
4. To ascertain the difficulties faced by the
college students.
5. To analyze the taste and preference of
the college students.
4. Limitation
There have been a number of limitations because of which
the survey may not be indicative of the views of the target
population. A few of these have been mentioned below.
The Sample size used for the research is less.
The Sample consisted of primarily students.
The Target Area was limited to College.
The Questionnaire was not extensive and more issues
could have been addressed.
The responses obtained might be inaccurate or biased,
inadvertently or deliberately.
The sample of the respondents chosen for the study might
not be representative.
Analysis of the proposed aspects might differ depending
on the tools and techniques used.
5. Research Design
Primary data collection was done through survey method
using a well structure questioner. The sample size of 100
respondents in Coimbatore city was chosen through
conveniences sample method.
Research work was only carried for 3 weeks.
The sample size taken here is accounting to a population
of 100 respondents.
The research design taken up by us is descriptive study
which gives the characteristics associated with the people
prefer online shopping.
To discover the association among different variables
Paper ID: SUB156724 1492

International Journal of Science and Research (IJSR) ISSN (Online): 2319-7064
Index Copernicus Value (2013): 6.14 | Impact Factor (2013): 4.438
Volume 4 Issue 7, July 2015
www.ijsr.net Licensed Under Creative Commons Attribution CC BY
6. Sample Size and Technique
The sample size chosen for the study is 100 samples.
Population is the aggregate of all units with specific
characteristics on which the samples are drawn. The samples
were taken on the basis of convenient sampling. And for the
purpose of present study a related sample of population was
selected on the basis of convenience.
7. Data Collection
The data, which is collected for the purpose of study
Primary Source.
The primary data comprises information on “survey of
study on student’s preference towards online shopping
with special reference to colleges in Coimbatore.”
The data has been collected directly from respondent with
the help of structured questionnaires.
The data is gathered from one region of people and used
for analysis which helped sorting, tabulating and
analyzing our objectives.
8. Statistical Tools Used ANOVA
Chi square
Cross tabs
Frequency of Gender in the Population
To find the frequency of gender in the population the
frequencies method is used
Inference
From the frequency table, it is inferred that 28% of the
respondents are male and 72%of the respondents are female.
We are able to know that the population with the gender
female is the major users of online shopping when compared
with the male population.
Frequency of Education Qualification in the Population
Table No 2
Inference:
From the frequency table it is clear to understand that mostly
22% of MBA graduates are highly prefer online shopping out
of 100 respondents and 3% of B.A and B.C.A. graduates are
less number of people prefer to use online shopping.
Frequency of Prefer Shopping in the Population
Table 3
Inference
From the above frequency table it known that 75% of our
respondents prefer online shopping and 25% of people
prefer direct purchasing.
Rank the Preference of Website
Fried Man Test
Table No 4
Paper ID: SUB156724 1493

International Journal of Science and Research (IJSR) ISSN (Online): 2319-7064
Index Copernicus Value (2013): 6.14 | Impact Factor (2013): 4.438
Volume 4 Issue 7, July 2015
www.ijsr.net Licensed Under Creative Commons Attribution CC BY
Inference There is a test used for finding out what ranking the
customers have given for the satisfaction in website in
online shopping. Here as per table own decisions has made
Flipkart as the mean rank of 2.49, Jabong as the mean rank
of 2.88, Amazon as the mean rank of 2.89, Junglee as the
mean rank of 3.11, others as a mean rank of 3.65. We know
that our respondents prefer highly Flipkart website of their
own decision for their satisfaction of online shopping
websites.
CROSSTABS
Table No 5
Inference
Among 100 respondents 17 respondents prefer online
shopping very often, 35 respondents prefer online shopping
often, 29 respondents prefer online shopping sometimes and
19 respondents prefer online shopping rarely. Among 17
respondents prefer online shopping very often as 7 are male
members, 10 are female members. Among 35 respondents
prefer online shopping often as 12 are male members 23 are
female members, Among 29 respondents prefer online
shopping sometimes as 7 male members and 22 female
members. Among 19 respondents prefer online shopping
rarely as 2 are male members and 17 are female members.
Hence we know that this table shows majority of
respondents prefer online shopping often.
Annova Test: Factors that determines the ANOVA is by
satisfaction of respondent and gender
Table-6
Paper ID: SUB156724 1494
International Journal of Science and Research (IJSR) ISSN (Online): 2319-7064
Index Copernicus Value (2013): 6.14 | Impact Factor (2013): 4.438
Volume 4 Issue 7, July 2015
www.ijsr.net Licensed Under Creative Commons Attribution CC BY
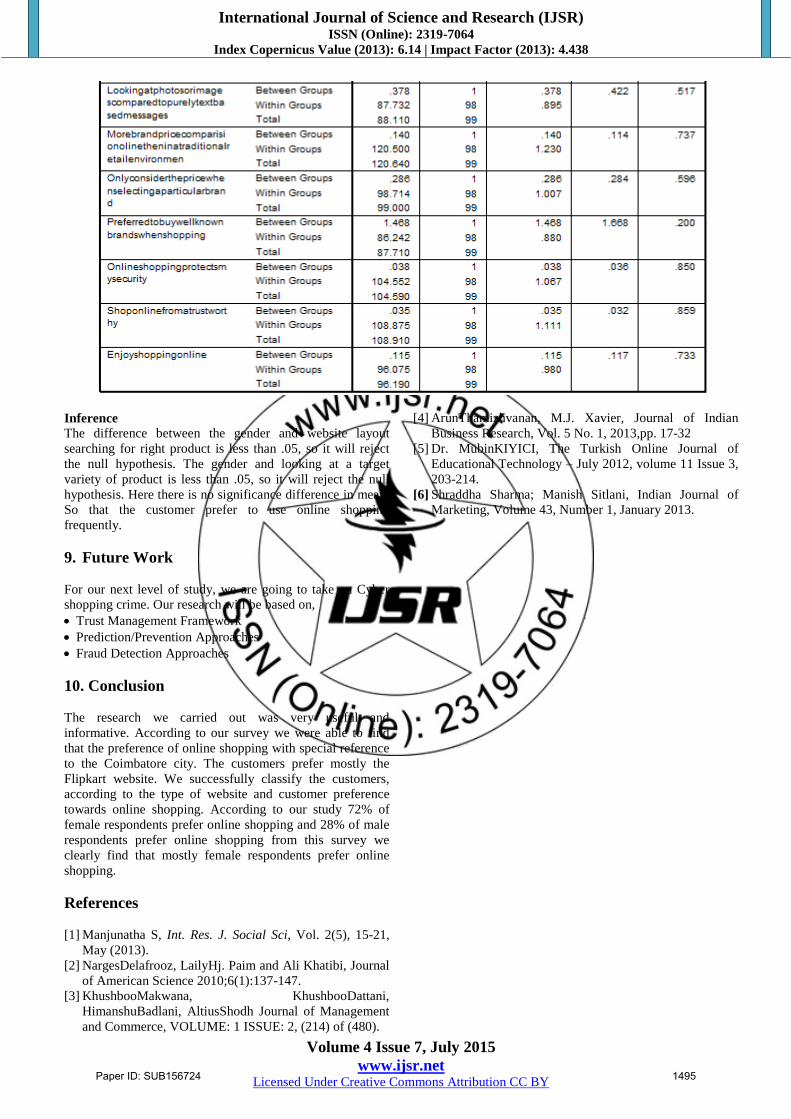
Inference
The difference between the gender and website layout
searching for right product is less than .05, so it will reject
the null hypothesis. The gender and looking at a target
variety of product is less than .05, so it will reject the null
hypothesis. Here there is no significance difference in mean.
So that the customer prefer to use online shopping
frequently.
9. Future Work
For our next level of study, we are going to take on Cyber
shopping crime. Our research will be based on,
Trust Management Framework
Prediction/Prevention Approaches
Fraud Detection Approaches
10. Conclusion
The research we carried out was very useful and
informative. According to our survey we were able to find
that the preference of online shopping with special reference
to the Coimbatore city. The customers prefer mostly the
Flipkart website. We successfully classify the customers,
according to the type of website and customer preference
towards online shopping. According to our study 72% of
female respondents prefer online shopping and 28% of male
respondents prefer online shopping from this survey we
clearly find that mostly female respondents prefer online
shopping.
References
[1] Manjunatha S, Int. Res. J. Social Sci, Vol. 2(5), 15-21,
May (2013).
[2] NargesDelafrooz, LailyHj. Paim and Ali Khatibi, Journal
of American Science 2010;6(1):137-147.
[3] KhushbooMakwana, KhushbooDattani,
HimanshuBadlani, AltiusShodh Journal of Management
and Commerce, VOLUME: 1 ISSUE: 2, (214) of (480).
[4] ArunThamizhvanan, M.J. Xavier, Journal of Indian
Business Research, Vol. 5 No. 1, 2013,pp. 17-32
[5] Dr. MübinKIYICI, The Turkish Online Journal of
Educational Technology – July 2012, volume 11 Issue 3,
203-214.
[6] Shraddha Sharma; Manish Sitlani, Indian Journal of
Marketing, Volume 43, Number 1, January 2013.
Paper ID: SUB156724 1495
Recommended