U . S. BAN C ORP
U.S. Bancorp4Q20 Earnings Conference Call
January 20, 2021
2U . S. BAN C ORP |
Forward-looking Statementsand Additional InformationThe following information appears in accordance with the Private Securities Litigation Reform Act of 1995:
This presentation contains forward-looking statements about U.S. Bancorp. Statements that are not historical or current facts, includingstatements about beliefs and expectations, are forward-looking statements and are based on the information available to, and assumptions andestimates made by, management as of the date hereof. These forward-looking statements cover, among other things, anticipated future revenueand expenses and the future plans and prospects of U.S. Bancorp. Forward-looking statements involve inherent risks and uncertainties, andimportant factors could cause actual results to differ materially from those anticipated. The COVID-19 pandemic is adversely affectingU.S. Bancorp, its customers, counterparties, employees, and third-party service providers, and the ultimate extent of the impacts on its business,financial position, results of operations, liquidity, and prospects is uncertain. Continued deterioration in general business and economic conditionsor turbulence in domestic or global financial markets could adversely affect U.S. Bancorp’s revenues and the values of its assets and liabilities,reduce the availability of funding to certain financial institutions, lead to a tightening of credit, and increase stock price volatility. In addition,changes to statutes, regulations, or regulatory policies or practices could affect U.S. Bancorp in substantial and unpredictable ways.U.S. Bancorp’s results could also be adversely affected by changes in interest rates; further increases in unemployment rates; deterioration in thecredit quality of its loan portfolios or in the value of the collateral securing those loans; deterioration in the value of its investment securities; legaland regulatory developments; litigation; increased competition from both banks and non-banks; civil unrest; changes in customer behavior andpreferences; breaches in data security; failures to safeguard personal information; effects of mergers and acquisitions and related integration;effects of critical accounting policies and judgments; and management’s ability to effectively manage credit risk, market risk, operational risk,compliance risk, strategic risk, interest rate risk, liquidity risk and reputation risk.For discussion of these and other risks that may cause actual results to differ from expectations, refer to U.S. Bancorp’s Annual Report onForm 10-K for the year ended December 31, 2019, on file with the Securities and Exchange Commission, including the sections entitled “RiskFactors” and “Corporate Risk Profile” contained in Exhibit 13, and all subsequent filings with the Securities and Exchange Commission underSections 13(a), 13(c), 14 or 15(d) of the Securities Exchange Act of 1934, including the section entitled “Risk Factors” in the Quarterly Report onForm 10-Q for the quarter ended September 30, 2020. In addition, factors other than these risks also could adversely affect U.S. Bancorp’sresults, and the reader should not consider these risks to be a complete set of all potential risks or uncertainties. Forward-looking statementsspeak only as of the date hereof, and U.S. Bancorp undertakes no obligation to update them in light of new information or future events.
This presentation includes non-GAAP financial measures to describe U.S. Bancorp’s performance. The calculations of these measures areprovided in the Appendix. These disclosures should not be viewed as a substitute for operating results determined in accordance with GAAP, norare they necessarily comparable to non-GAAP performance measures that may be presented by other companies.
3U . S. BAN C ORP |
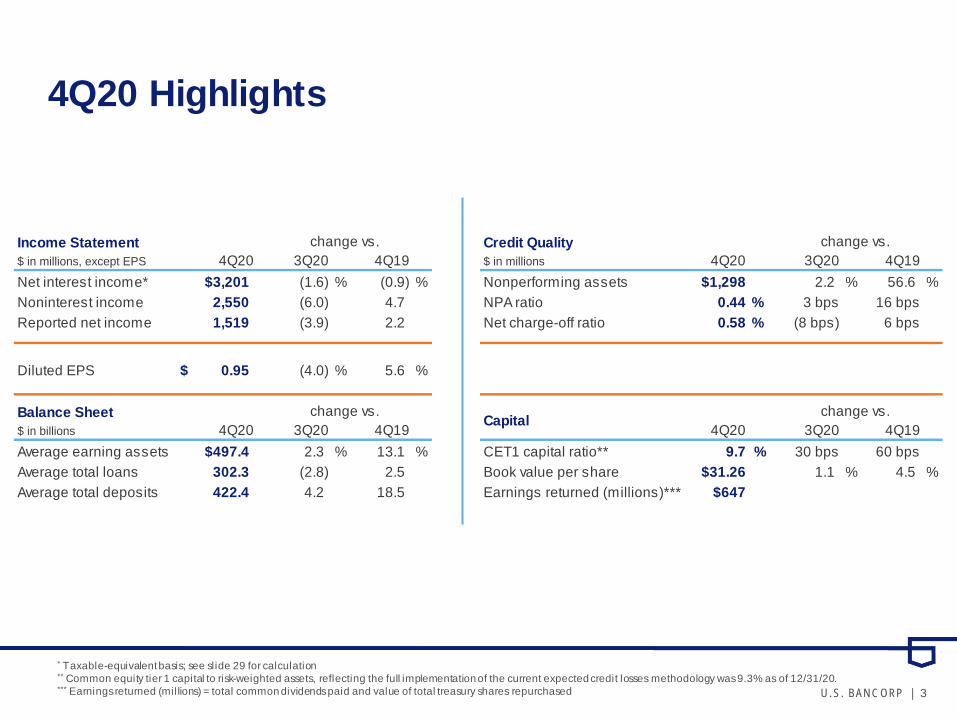
Income Statement Credit Quality$ in millions, except EPS 4Q20 3Q20 4Q19 $ in millions 4Q20 3Q20 4Q19Net interest income* $3,201 (1.6) % (0.9) % Nonperforming assets $1,298 2.2 % 56.6 %Noninterest income 2,550 (6.0) 4.7 NPA ratio 0.44 % 3 bps 16 bpsReported net income 1,519 (3.9) 2.2 Net charge-off ratio 0.58 % (8 bps) 6 bps
Diluted EPS 0.95$ (4.0) % 5.6 %
Balance Sheet$ in billions 4Q20 3Q20 4Q19 4Q20 3Q20 4Q19Average earning assets $497.4 2.3 % 13.1 % CET1 capital ratio** 9.7 % 30 bps 60 bpsAverage total loans 302.3 (2.8) 2.5 Book value per share $31.26 1.1 % 4.5 %Average total deposits 422.4 4.2 18.5 Earnings returned (millions)*** $647
Capitalchange vs.
change vs. change vs.
change vs.
4Q20 Highlights
* Taxable-equivalent basis; see slide 29 for calculation** Common equity tier 1 capital to risk-weighted assets, reflecting the full implementation of the current expected credit losses methodology was 9.3% as of 12/31/20.*** Earnings returned (millions) = total common dividends paid and value of total treasury shares repurchased
4U . S. BAN C ORP |
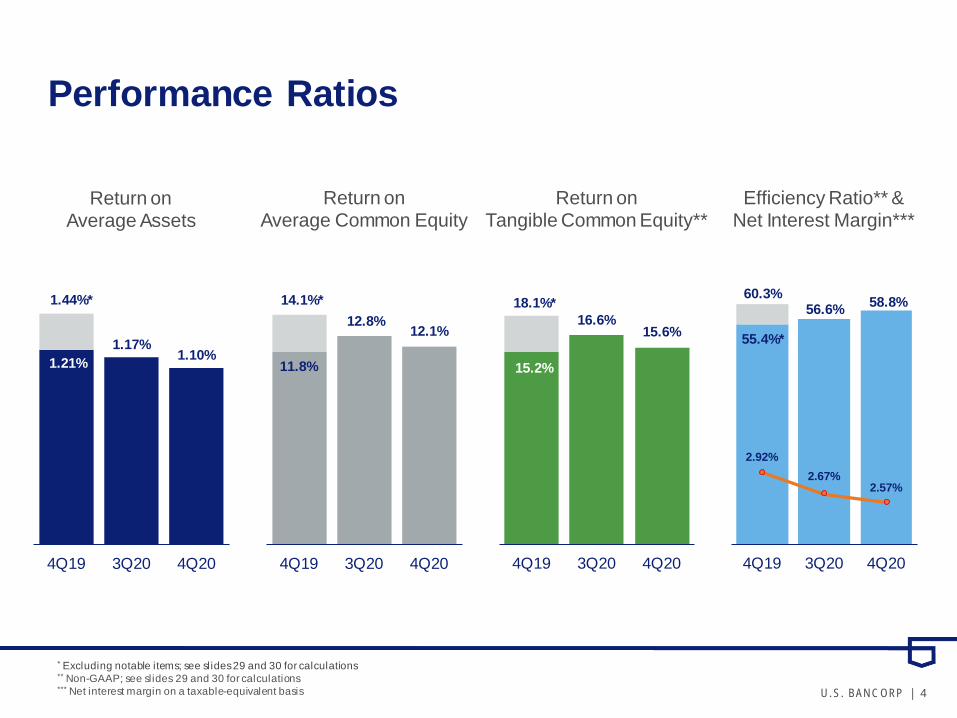
Performance Ratios
Efficiency Ratio** &Net Interest Margin***
Return on Average Common Equity
1.21%1.17%
1.10%
4Q19 3Q20 4Q20
55.4%*
56.6% 58.8%
2.92%2.67%
2.57%
4Q19 3Q20 4Q20
11.8%
12.8%12.1%
4Q19 3Q20 4Q20
15.2%
16.6%15.6%
4Q19 3Q20 4Q20
Return on Tangible Common Equity**
Return on Average Assets
1.44%* 14.1%* 18.1%* 60.3%
* Excluding notable items; see slides 29 and 30 for calculations** Non-GAAP; see slides 29 and 30 for calculations*** Net interest margin on a taxable-equivalent basis
5U . S. BAN C ORP |
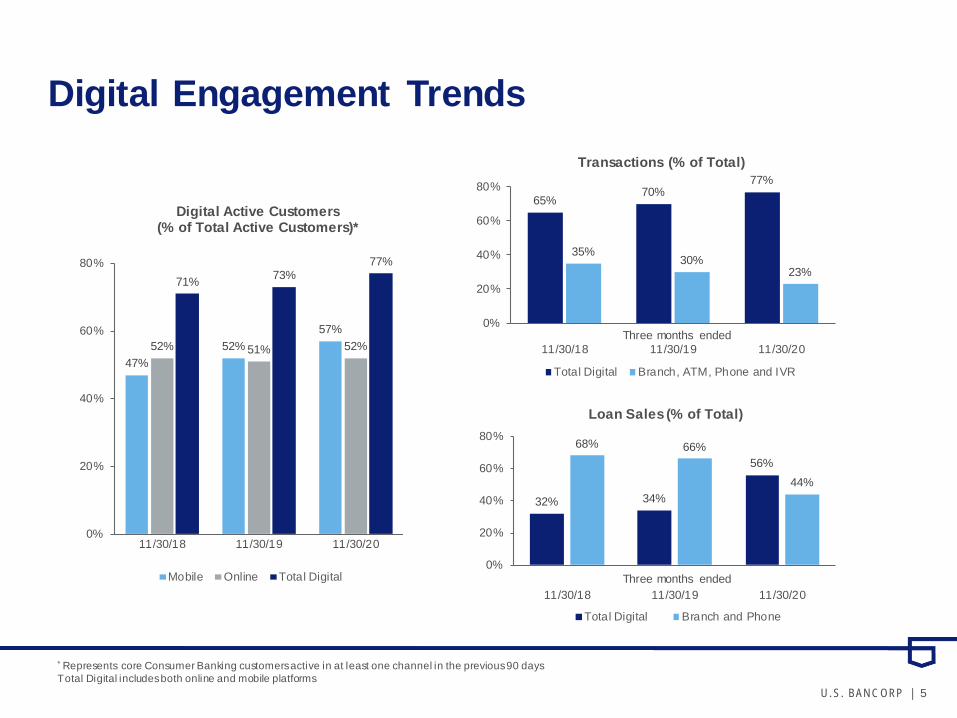
Digital Engagement Trends
47%52%
57%52% 51% 52%
71% 73%77%
0%
20%
40%
60%
80%
11/30/18 11/30/19 11/30/20
Digital Active Customers(% of Total Active Customers)*
Mobile Online Total Digital
65%70%
77%
35%30%
23%
0%
20%
40%
60%
80%
11/30/18 11/30/19 11/30/20
Transactions (% of Total)
Total Digital Branch, ATM, Phone and IVR
32% 34%
56%68% 66%
44%
0%
20%
40%
60%
80%
11/30/18 11/30/19 11/30/20
Loan Sales (% of Total)
Total Digital Branch and Phone
Three months ended
Three months ended
* Represents core Consumer Banking customers active in at least one channel in the previous 90 daysTotal Digital includes both online and mobile platforms
6U . S. BAN C ORP |
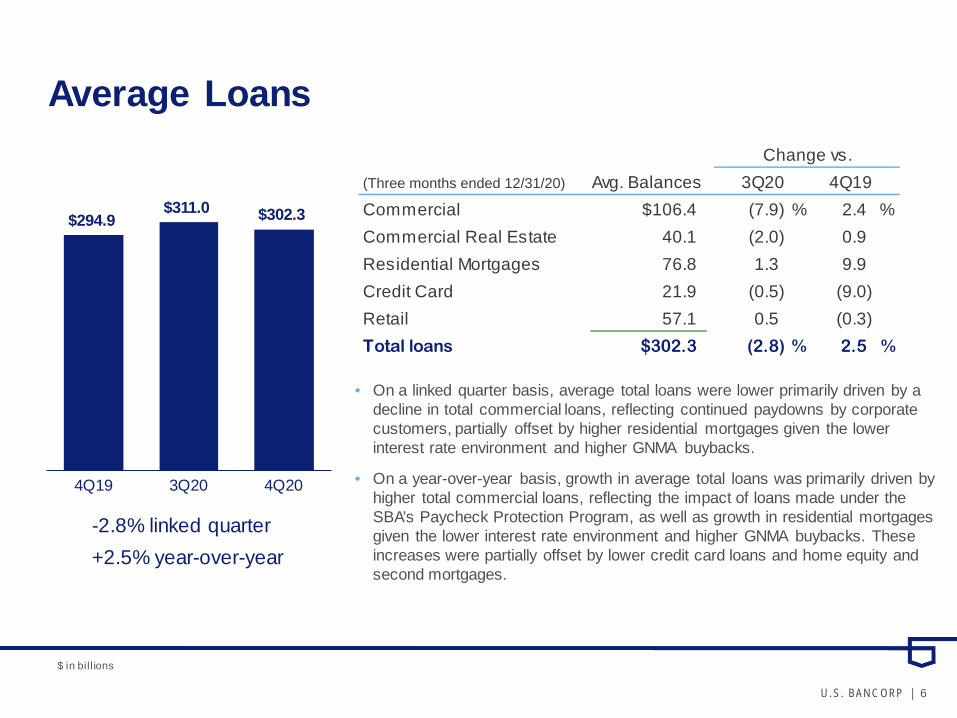
(Three months ended 12/31/20) Avg. Balances 3Q20 4Q19Commercial $106.4 (7.9) % 2.4 %Commercial Real Estate 40.1 (2.0) 0.9Residential Mortgages 76.8 1.3 9.9Credit Card 21.9 (0.5) (9.0)Retail 57.1 0.5 (0.3)Total loans $302.3 (2.8) % 2.5 %
Change vs.
Average Loans
-2.8% linked quarter+2.5% year-over-year
• On a linked quarter basis, average total loans were lower primarily driven by a decline in total commercial loans, reflecting continued paydowns by corporate customers, partially offset by higher residential mortgages given the lower interest rate environment and higher GNMA buybacks.
• On a year-over-year basis, growth in average total loans was primarily driven by higher total commercial loans, reflecting the impact of loans made under the SBA’s Paycheck Protection Program, as well as growth in residential mortgages given the lower interest rate environment and higher GNMA buybacks. These increases were partially offset by lower credit card loans and home equity and second mortgages.
$294.9 $311.0 $302.3
$294.9$311.0 $302.3
4Q19 3Q20 4Q20
$ in bil l ions
7U . S. BAN C ORP |
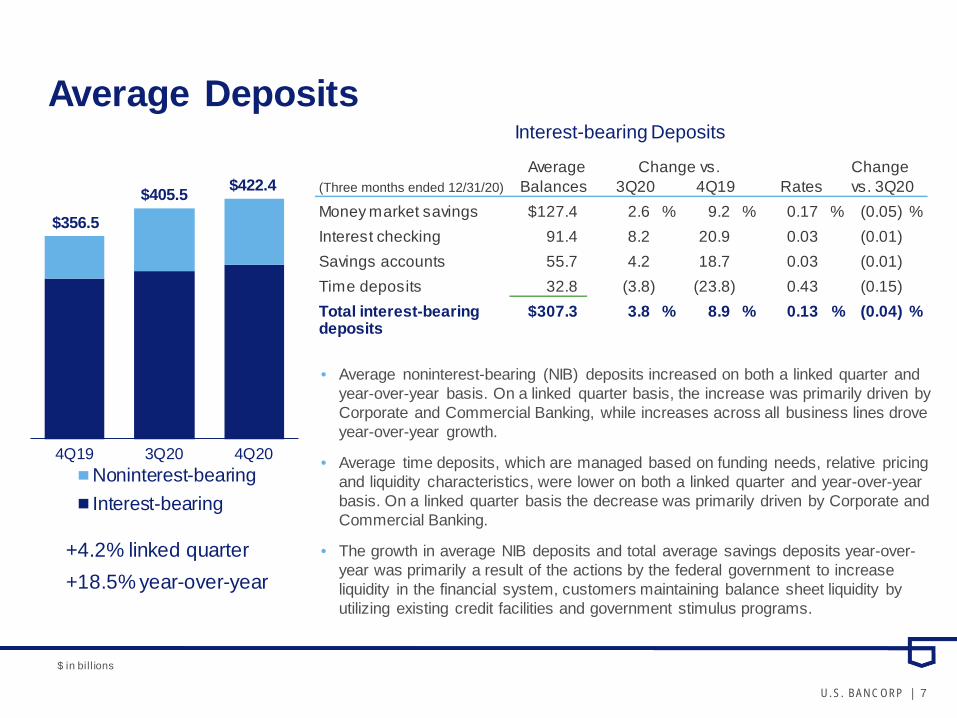
Average Change(Three months ended 12/31/20) Balances 3Q20 4Q19 Rates vs. 3Q20Money market savings $127.4 2.6 % 9.2 % 0.17 % (0.05) %Interest checking 91.4 8.2 20.9 0.03 (0.01)Savings accounts 55.7 4.2 18.7 0.03 (0.01)Time deposits 32.8 (3.8) (23.8) 0.43 (0.15)Total interest-bearing $307.3 3.8 % 8.9 % 0.13 % (0.04) %deposits
Change vs.
Average Deposits
4Q19 3Q20 4Q20Noninterest-bearingInterest-bearing
$356.5$405.5 $422.4
+4.2% linked quarter+18.5% year-over-year
Interest-bearing Deposits
• Average noninterest-bearing (NIB) deposits increased on both a linked quarter and year-over-year basis. On a linked quarter basis, the increase was primarily driven by Corporate and Commercial Banking, while increases across all business lines drove year-over-year growth.
• Average time deposits, which are managed based on funding needs, relative pricing and liquidity characteristics, were lower on both a linked quarter and year-over-year basis. On a linked quarter basis the decrease was primarily driven by Corporate and Commercial Banking.
• The growth in average NIB deposits and total average savings deposits year-over-year was primarily a result of the actions by the federal government to increase liquidity in the financial system, customers maintaining balance sheet liquidity by utilizing existing credit facilities and government stimulus programs.
$ in bil l ions
8U . S. BAN C ORP |
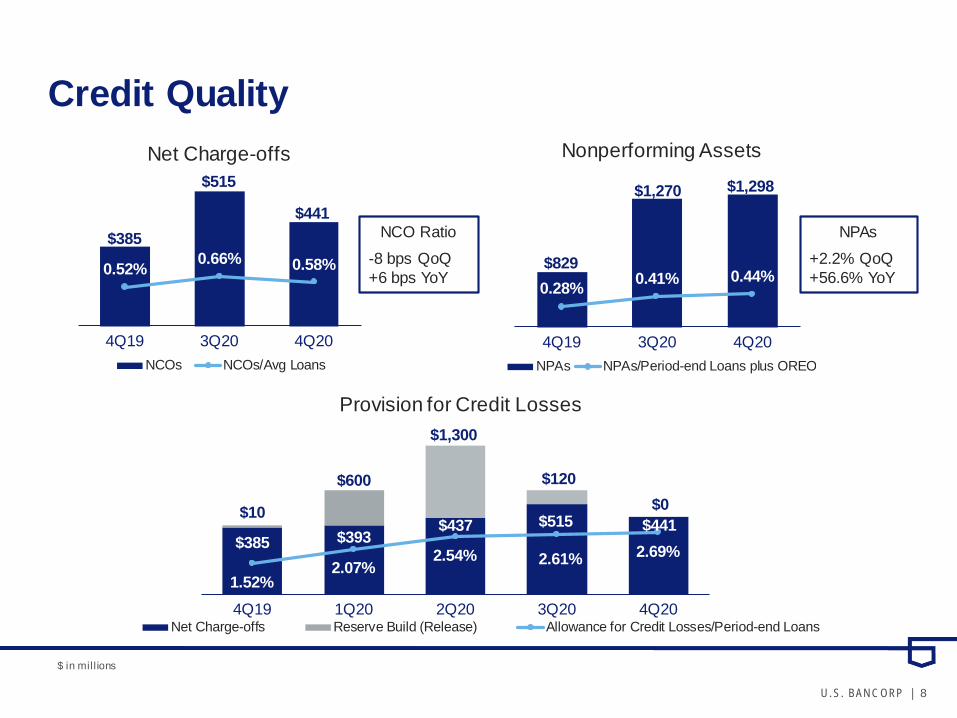
Credit Quality
$385
$515
$441
0.52% 0.66% 0.58%
4Q19 3Q20 4Q20
Net Charge-offs
NCOs NCOs/Avg Loans
$829
$1,270 $1,298
0.28% 0.41% 0.44%
4Q19 3Q20 4Q20
Nonperforming Assets
NPAs NPAs/Period-end Loans plus OREO
NCO Ratio-8 bps QoQ+6 bps YoY
NPAs+2.2% QoQ+56.6% YoY
$385 $393 $437 $515 $441
$10
$600
$1,300
$120$0
1.52%2.07%
2.54% 2.61% 2.69%
4Q19 1Q20 2Q20 3Q20 4Q20
Provision for Credit Losses
Net Charge-offs Reserve Build (Release) Allowance for Credit Losses/Period-end Loans
$ in mill ions
9U . S. BAN C ORP |
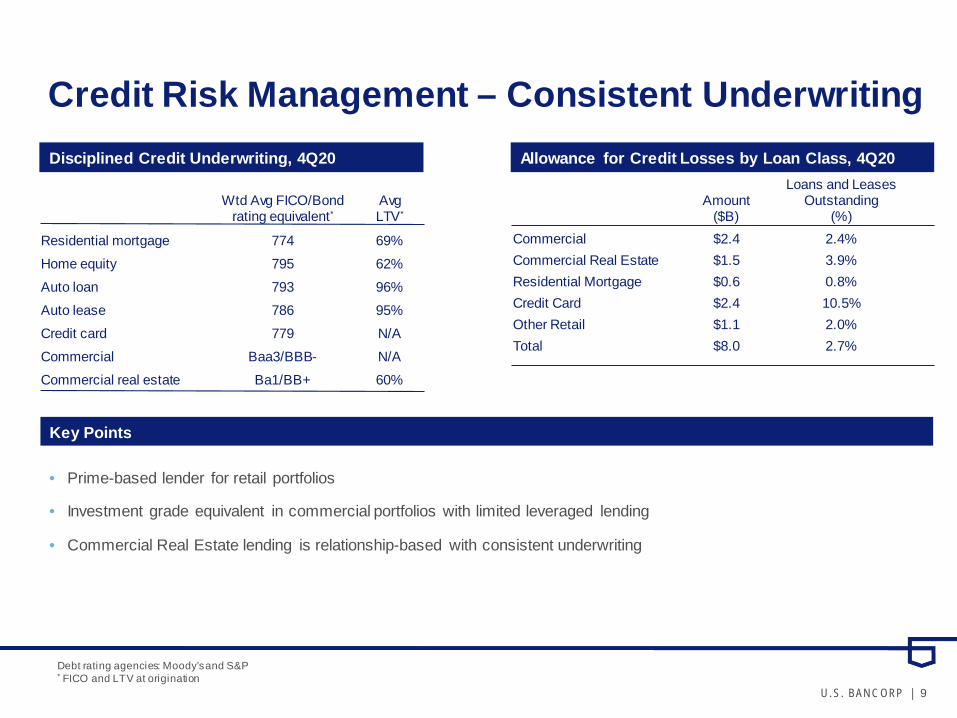
Credit Risk Management – Consistent UnderwritingAllowance for Credit Losses by Loan Class, 4Q20
Key Points
• Prime-based lender for retail portfolios
• Investment grade equivalent in commercial portfolios with limited leveraged lending
• Commercial Real Estate lending is relationship-based with consistent underwriting
Disciplined Credit Underwriting, 4Q20
Wtd Avg FICO/Bond rating equivalent*
Avg LTV*
Residential mortgage 774 69%Home equity 795 62%Auto loan 793 96%Auto lease 786 95%Credit card 779 N/ACommercial Baa3/BBB- N/ACommercial real estate Ba1/BB+ 60%
Amount ($B)
Loans and Leases Outstanding
(%)Commercial $2.4 2.4%Commercial Real Estate $1.5 3.9%Residential Mortgage $0.6 0.8%Credit Card $2.4 10.5%Other Retail $1.1 2.0%Total $8.0 2.7%
Debt rating agencies: Moody’s and S&P* FICO and LTV at origination
10U . S. BAN C ORP |
Segments
Outstanding Balances
($B)
Segment Loans (%)
Outstanding Balances
($B)
Segment Loans (%)
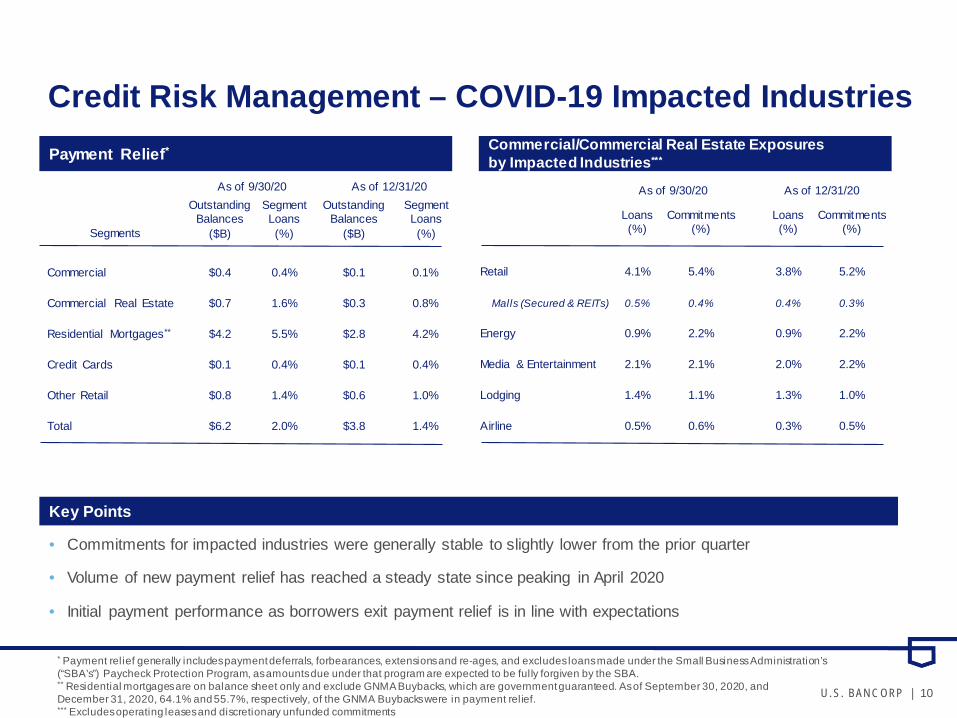
Commercial $0.4 0.4% $0.1 0.1%
Commercial Real Estate $0.7 1.6% $0.3 0.8%
Residential Mortgages** $4.2 5.5% $2.8 4.2%
Credit Cards $0.1 0.4% $0.1 0.4%
Other Retail $0.8 1.4% $0.6 1.0%
Total $6.2 2.0% $3.8 1.4%
Credit Risk Management – COVID-19 Impacted Industries
Loans (%)
Commitments (%)
Loans (%)
Commitments (%)
Retail 4.1% 5.4% 3.8% 5.2%
Malls (Secured & REITs) 0.5% 0.4% 0.4% 0.3%
Energy 0.9% 2.2% 0.9% 2.2%
Media & Entertainment 2.1% 2.1% 2.0% 2.2%
Lodging 1.4% 1.1% 1.3% 1.0%
Airline 0.5% 0.6% 0.3% 0.5%
Payment Relief*
• Commitments for impacted industries were generally stable to slightly lower from the prior quarter
• Volume of new payment relief has reached a steady state since peaking in April 2020
• Initial payment performance as borrowers exit payment relief is in line with expectations
Commercial/Commercial Real Estate Exposures by Impacted Industries***
Key Points
As of 9/30/20 As of 12/31/20 As of 9/30/20 As of 12/31/20
* Payment relief generally includes payment deferrals, forbearances, extensions and re-ages, and excludes loans made under the Small Business Administration’s (“SBA’s”) Paycheck Protection Program, as amounts due under that program are expected to be fully forgiven by the SBA.** Residential mortgages are on balance sheet only and exclude GNMA Buybacks, which are government guaranteed. As of September 30, 2020, and December 31, 2020, 64.1% and 55.7%, respectively, of the GNMA Buybacks were in payment relief.*** Excludes operating leases and discretionary unfunded commitments
11U . S. BAN C ORP |
ExcludingNotable Items
$ and shares in millions, except EPS % Change4Q20 3Q20 4Q19 vs. 3Q20 vs. 4Q19 4Q20 4Q19 vs. 4Q19
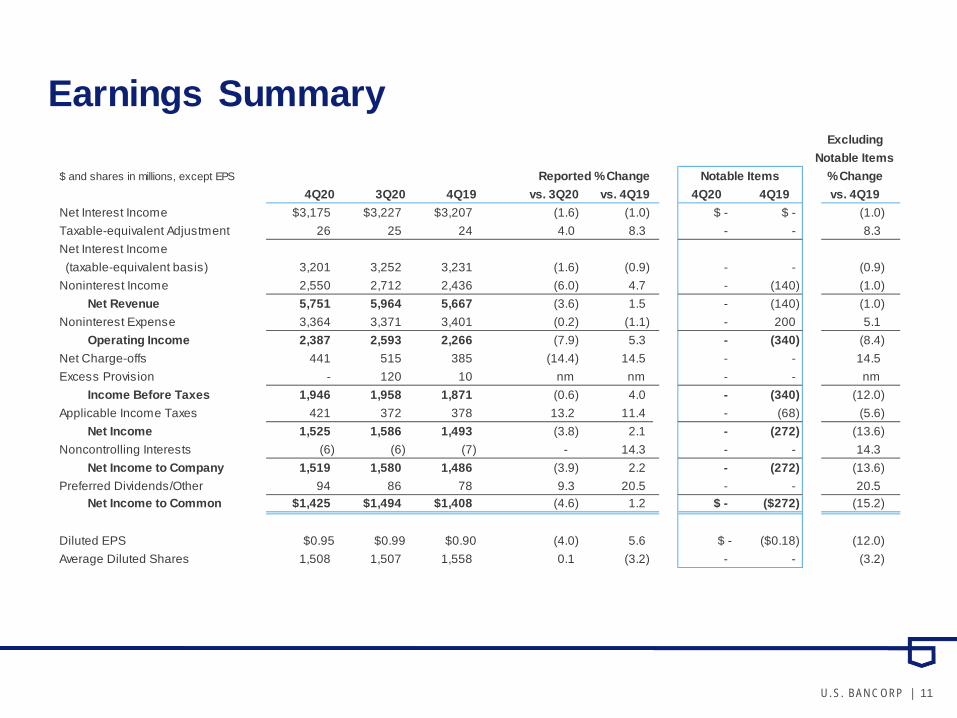
Net Interest Income $3,175 $3,227 $3,207 (1.6) (1.0) $ - $ - (1.0) Taxable-equivalent Adjustment 26 25 24 4.0 8.3 - - 8.3Net Interest Income (taxable-equivalent basis) 3,201 3,252 3,231 (1.6) (0.9) - - (0.9)Noninterest Income 2,550 2,712 2,436 (6.0) 4.7 - (140) (1.0)
Net Revenue 5,751 5,964 5,667 (3.6) 1.5 - (140) (1.0)Noninterest Expense 3,364 3,371 3,401 (0.2) (1.1) - 200 5.1
Operating Income 2,387 2,593 2,266 (7.9) 5.3 - (340) (8.4) Net Charge-offs 441 515 385 (14.4) 14.5 - - 14.5 Excess Provision - 120 10 nm nm - - nm
Income Before Taxes 1,946 1,958 1,871 (0.6) 4.0 - (340) (12.0) Applicable Income Taxes 421 372 378 13.2 11.4 - (68) (5.6)
Net Income 1,525 1,586 1,493 (3.8) 2.1 - (272) (13.6) Noncontrolling Interests (6) (6) (7) - 14.3 - - 14.3
Net Income to Company 1,519 1,580 1,486 (3.9) 2.2 - (272) (13.6) Preferred Dividends/Other 94 86 78 9.3 20.5 - - 20.5
Net Income to Common $1,425 $1,494 $1,408 (4.6) 1.2 $ - ($272) (15.2)
Diluted EPS $0.95 $0.99 $0.90 (4.0) 5.6 $ - ($0.18) (12.0) Average Diluted Shares 1,508 1,507 1,558 0.1 (3.2) - - (3.2)
Notable ItemsReported % Change
Earnings Summary

12U . S. BAN C ORP |
Notable Items
4Q20 4Q19$ - ($140)
- (140)
- 158- 42- 200
Income before taxes - (340)
- (68)
Net income - (272)- -
Net income applicable to U.S. Bancorp $ - ($272)
Diluted EPS impact - ($0.18)
$ in millions, except per share
Noncontrolling interest
Tax expense (benefit) on notable items
Total noninterest expense
Total noninterest income
Severance chargesOther accruals and charges
Visa derivative liability charge
13U . S. BAN C ORP |
Net Interest Income
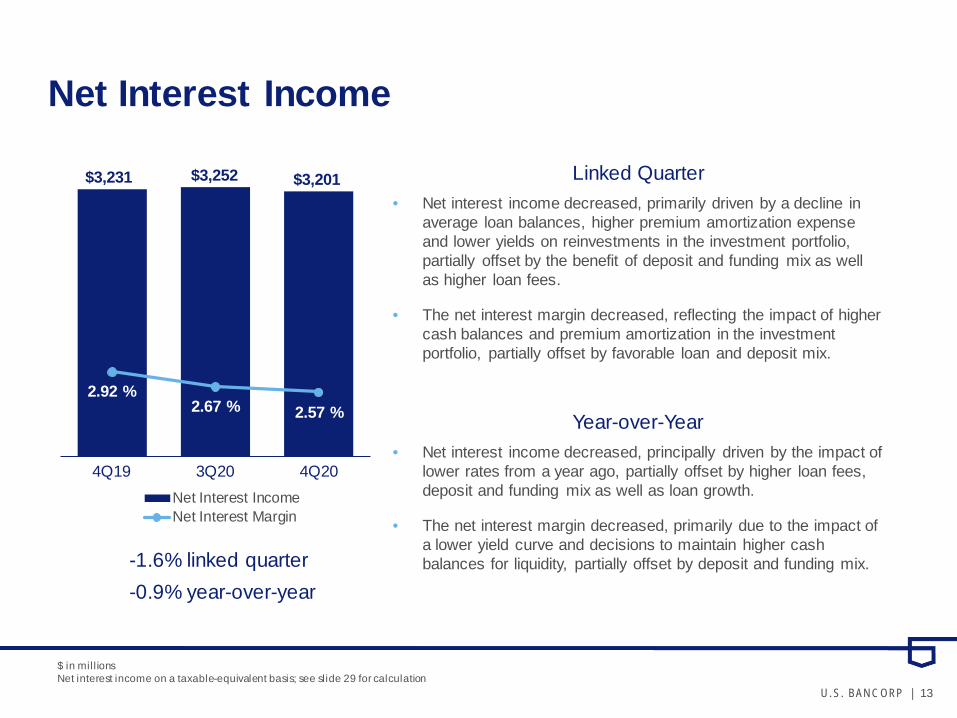
$3,231 $3,252 $3,201
2.92 %2.67 % 2.57 %
4Q19 3Q20 4Q20Net Interest IncomeNet Interest Margin
Linked Quarter• Net interest income decreased, primarily driven by a decline in
average loan balances, higher premium amortization expense and lower yields on reinvestments in the investment portfolio, partially offset by the benefit of deposit and funding mix as well as higher loan fees.
• The net interest margin decreased, reflecting the impact of higher cash balances and premium amortization in the investment portfolio, partially offset by favorable loan and deposit mix.
Year-over-Year• Net interest income decreased, principally driven by the impact of
lower rates from a year ago, partially offset by higher loan fees, deposit and funding mix as well as loan growth.
• The net interest margin decreased, primarily due to the impact of a lower yield curve and decisions to maintain higher cash balances for liquidity, partially offset by deposit and funding mix. -1.6% linked quarter
-0.9% year-over-year
$ in mill ionsNet interest income on a taxable-equivalent basis; see slide 29 for calculation
14U . S. BAN C ORP |
Noninterest Income
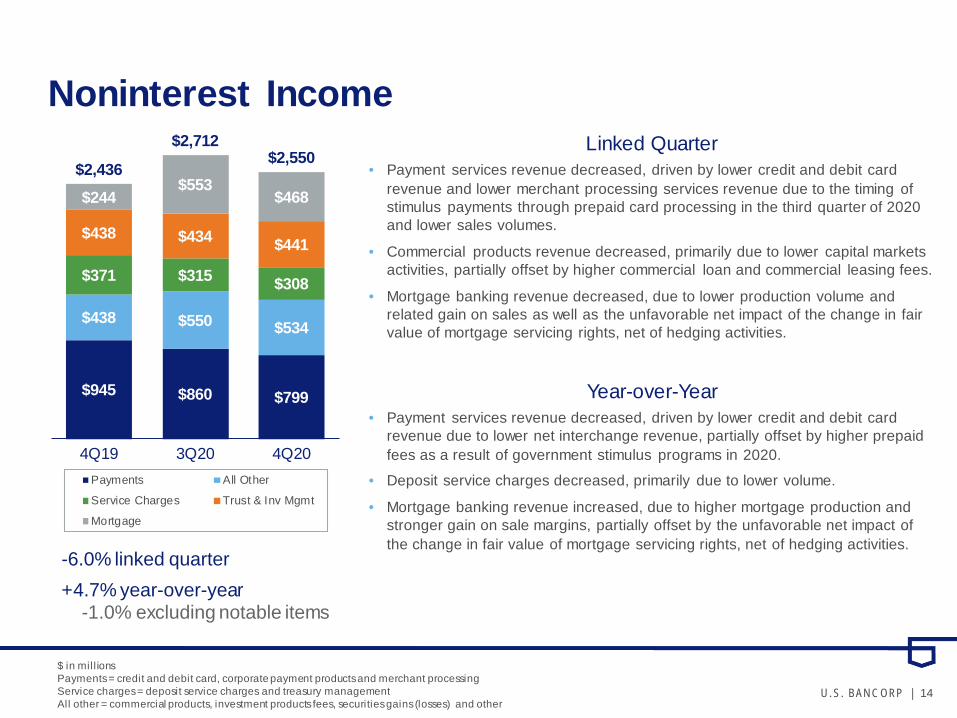
$945 $860 $799
$438 $550 $534
$371 $315 $308
$438 $434 $441
$244 $553
$468 $2,436
$2,712 $2,550
4Q19 3Q20 4Q20Payments All Other
Service Charges Trust & Inv Mgmt
Mortgage
-6.0% linked quarter+4.7% year-over-year
-1.0% excluding notable items
Linked Quarter• Payment services revenue decreased, driven by lower credit and debit card
revenue and lower merchant processing services revenue due to the timing of stimulus payments through prepaid card processing in the third quarter of 2020 and lower sales volumes.
• Commercial products revenue decreased, primarily due to lower capital markets activities, partially offset by higher commercial loan and commercial leasing fees.
• Mortgage banking revenue decreased, due to lower production volume and related gain on sales as well as the unfavorable net impact of the change in fair value of mortgage servicing rights, net of hedging activities.
Year-over-Year• Payment services revenue decreased, driven by lower credit and debit card
revenue due to lower net interchange revenue, partially offset by higher prepaid fees as a result of government stimulus programs in 2020.
• Deposit service charges decreased, primarily due to lower volume.
• Mortgage banking revenue increased, due to higher mortgage production and stronger gain on sale margins, partially offset by the unfavorable net impact of the change in fair value of mortgage servicing rights, net of hedging activities.
$ in mill ions Payments = credit and debit card, corporate payment products and merchant processingService charges = deposit service charges and treasury managementAll other = commercial products, investment products fees, securities gains (losses) and other
15U . S. BAN C ORP |
All Other
1Q20 2Q20 3Q20 4Q20Trav el*** (Credit & Debit)
1Q20 2Q20 3Q20 4Q20
Total
1Q20 2Q20 3Q20 4Q20
Payment Services
7.0%
6.1%
2.9%84.0%
5.4%
6.2%2.2%86.2%
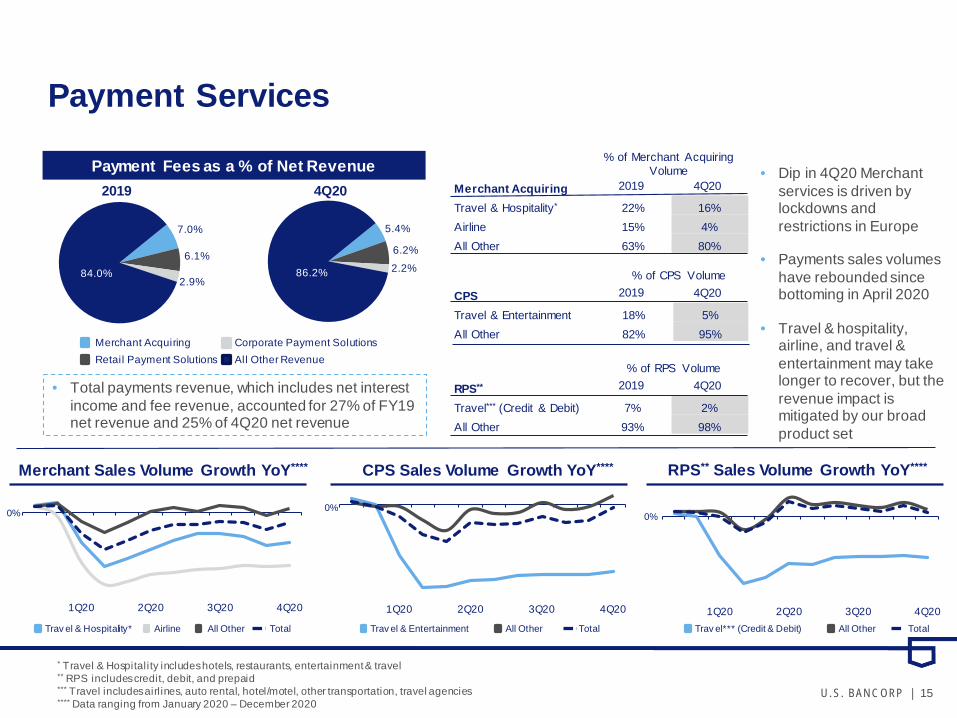
Payment Fees as a % of Net Revenue2019 4Q20
Merchant AcquiringRetail Payment Solutions
Corporate Payment SolutionsAll Other Revenue
• Total payments revenue, which includes net interest income and fee revenue, accounted for 27% of FY19 net revenue and 25% of 4Q20 net revenue
• Dip in 4Q20 Merchant services is driven by lockdowns and restrictions in Europe
• Payments sales volumes have rebounded since bottoming in April 2020
• Travel & hospitality, airline, and travel & entertainment may take longer to recover, but the revenue impact is mitigated by our broad product set
Merchant Acquiring Travel & Hospitality* 22% 16%Airline 15% 4%All Other 63% 80%
CPSTravel & Entertainment 18% 5%All Other 82% 95%
RPS**
Travel*** (Credit & Debit) 7% 2%All Other 93% 98%
% of Merchant Acquiring Volume
2019 4Q20
% of CPS Volume2019 4Q20
% of RPS Volume2019 4Q20
Merchant Sales Volume Growth YoY****
0%
CPS Sales Volume Growth YoY****
0%
RPS** Sales Volume Growth YoY****
0%
Trav el & Hospitality* Airline Trav el & Entertainment TotalAll Other All Other Total
* Travel & Hospitality includes hotels, restaurants, entertainment & travel** RPS includes credit, debit, and prepaid*** Travel includes airl ines, auto rental, hotel/motel, other transportation, travel agencies**** Data ranging from January 2020 – December 2020
16U . S. BAN C ORP |
Noninterest Expense
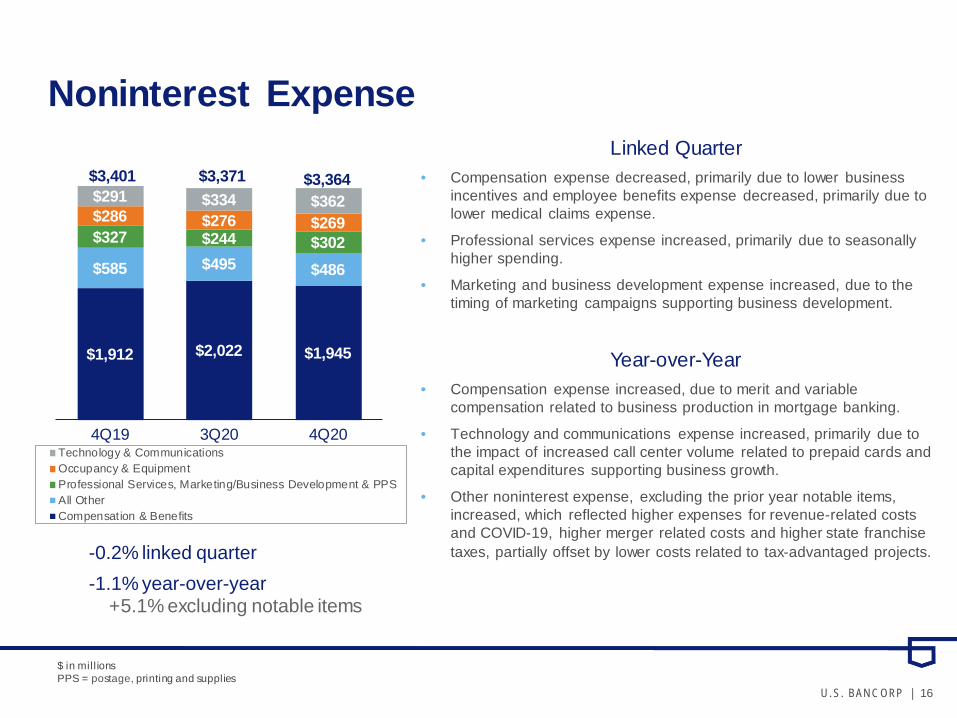
$1,912 $2,022 $1,945
$585 $495 $486
$327 $244 $302 $286 $276 $269 $291 $334 $362
4Q19 3Q20 4Q20Technology & CommunicationsOccupancy & EquipmentProfessional Services, Marketing/Business Development & PPSAll OtherCompensation & Benefits
$3,401 $3,371 $3,364
-0.2% linked quarter-1.1% year-over-year
+5.1% excluding notable items
Linked Quarter• Compensation expense decreased, primarily due to lower business
incentives and employee benefits expense decreased, primarily due to lower medical claims expense.
• Professional services expense increased, primarily due to seasonally higher spending.
• Marketing and business development expense increased, due to the timing of marketing campaigns supporting business development.
Year-over-Year• Compensation expense increased, due to merit and variable
compensation related to business production in mortgage banking.
• Technology and communications expense increased, primarily due to the impact of increased call center volume related to prepaid cards and capital expenditures supporting business growth.
• Other noninterest expense, excluding the prior year notable items, increased, which reflected higher expenses for revenue-related costs and COVID-19, higher merger related costs and higher state franchise taxes, partially offset by lower costs related to tax-advantaged projects.
$ in mill ionsPPS = postage, printing and supplies
17U . S. BAN C ORP |
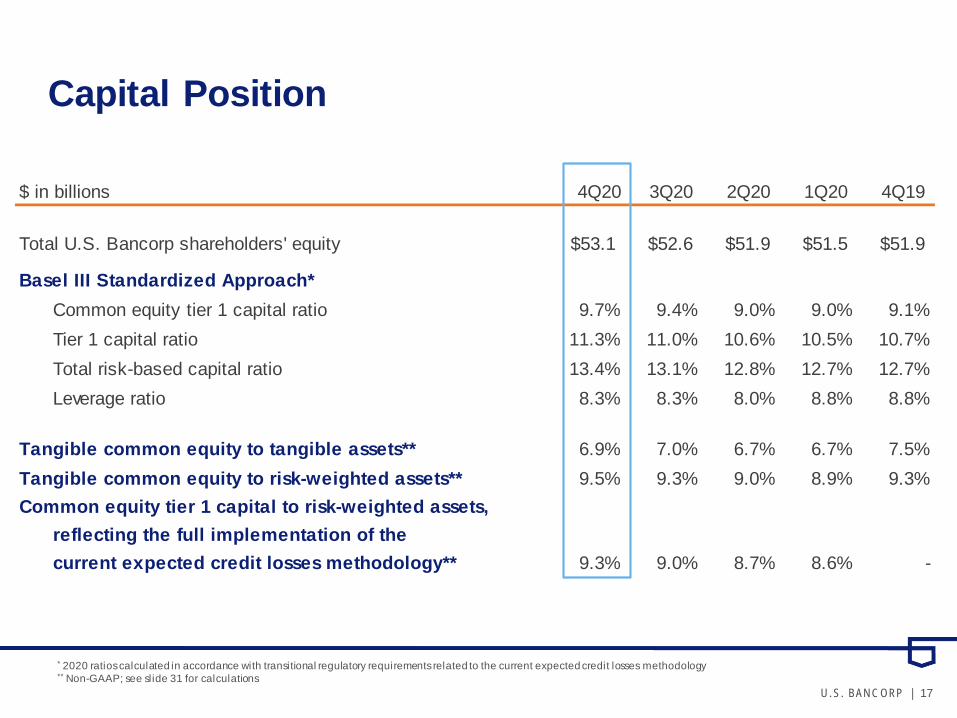
$ in billions 4Q20 3Q20 2Q20 1Q20 4Q19
Total U.S. Bancorp shareholders' equity $53.1 $52.6 $51.9 $51.5 $51.9
Basel III Standardized Approach*9.7% 9.4% 9.0% 9.0% 9.1%
11.3% 11.0% 10.6% 10.5% 10.7%13.4% 13.1% 12.8% 12.7% 12.7%8.3% 8.3% 8.0% 8.8% 8.8%
Tangible common equity to tangible assets** 6.9% 7.0% 6.7% 6.7% 7.5%Tangible common equity to risk-weighted assets** 9.5% 9.3% 9.0% 8.9% 9.3%Common equity tier 1 capital to risk-weighted assets,
reflecting the full implementation of the current expected credit losses methodology** 9.3% 9.0% 8.7% 8.6% -
Common equity tier 1 capital ratioTier 1 capital ratioTotal risk-based capital ratioLeverage ratio
Capital Position
* 2020 ratios calculated in accordance with transitional regulatory requirements related to the current expected credit losses methodology** Non-GAAP; see slide 31 for calculations
18U . S. BAN C ORP |
Appendix

19U . S. BAN C ORP |
Average Loans
vs. 4Q19• Average total loans increased by $7.4 billion, or 2.5% • Average residential mortgage loans increased by $6.9
billion, or 9.9%• Average commercial loans increased by $2.5 billion,
or 2.4%• Average credit card loans decreased by $2.2 billion,
or 9.0%
vs. 3Q20• Average total loans decreased by $8.7 billion, or 2.8% • Average commercial loans decreased by $9.1 billion,
or 7.9% • Average residential mortgage loans increased by $1.0
billion, or 1.3%
3.4% 3.9% 24.0% 11.4% 2.4%
(1.1%) 1.5%4.4% 5.0% 0.9%
8.4% 8.1%6.4% 10.5% 9.9%
7.6% 5.5%(5.8%) (6.9%) (9.0%)
1.9% 0.6%(1.1%) (1.3%) (0.3%)
$294.9 $297.7 $318.1 $311.0 $302.3
4Q19 1Q20 2Q20 3Q20 4Q20
Key Points
Year-over-Year Growth
3.9% 4.0% 10.0% 6.4% 2.5%
CommercialCRERes MtgRetail Credit Card
Average Loans ($bn)
20U . S. BAN C ORP |
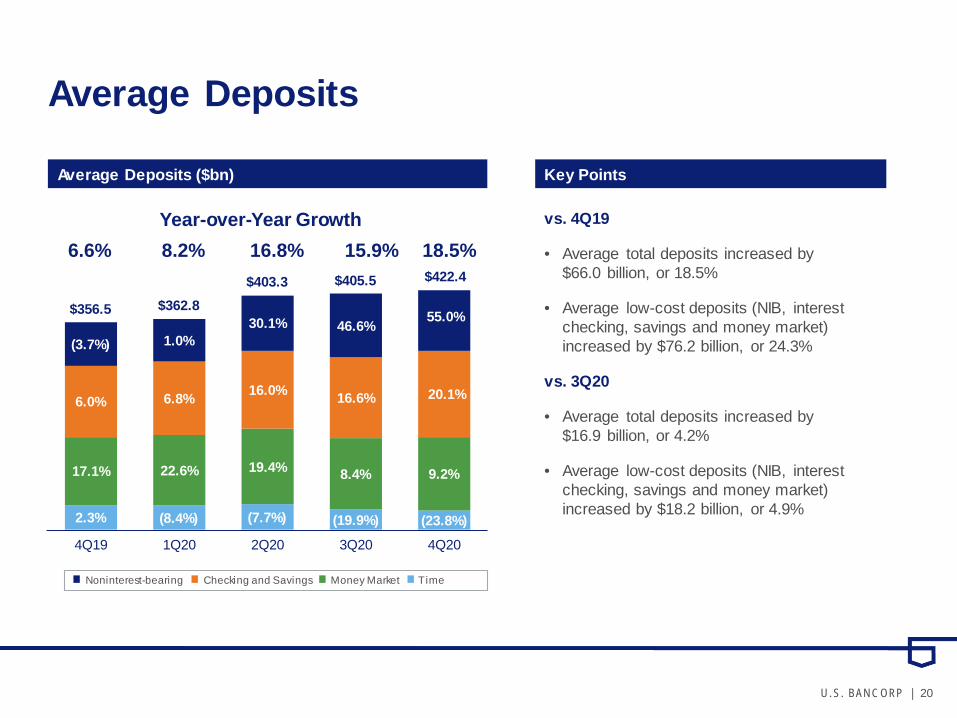
Year-over-Year Growth6.6% 8.2% 16.8% 15.9% 18.5%
TimeMoney MarketChecking and SavingsNoninterest-bearing
2.3% (8.4%) (7.7%) (19.9%) (23.8%)
17.1% 22.6% 19.4% 8.4% 9.2%
6.0% 6.8% 16.0% 16.6% 20.1%
(3.7%) 1.0%30.1% 46.6% 55.0%$356.5 $362.8 $403.3 $405.5
4Q19 1Q20 2Q20 3Q20 4Q20
Average Deposits
Key PointsAverage Deposits ($bn)
vs. 4Q19
• Average total deposits increased by $66.0 billion, or 18.5%
• Average low-cost deposits (NIB, interest checking, savings and money market) increased by $76.2 billion, or 24.3%
vs. 3Q20
• Average total deposits increased by $16.9 billion, or 4.2%
• Average low-cost deposits (NIB, interest checking, savings and money market) increased by $18.2 billion, or 4.9%
$422.4
21U . S. BAN C ORP |
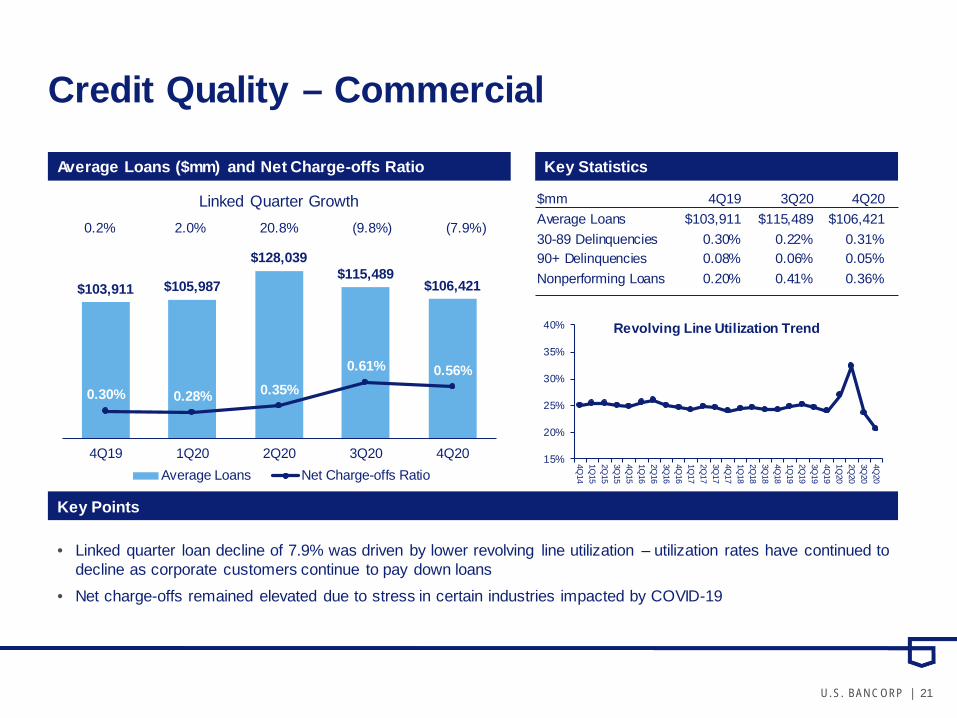
Credit Quality – Commercial
Average Loans ($mm) and Net Charge-offs Ratio Key Statistics
Key Points
$mm 4Q19 3Q20 4Q20Average Loans $103,911 $115,489 $106,42130-89 Delinquencies 0.30% 0.22% 0.31%90+ Delinquencies 0.08% 0.06% 0.05%Nonperforming Loans 0.20% 0.41% 0.36%
$103,911 $105,987
$128,039 $115,489
$106,421
0.30% 0.28% 0.35%0.61% 0.56%
4Q19 1Q20 2Q20 3Q20 4Q20Average Loans Net Charge-offs Ratio
15%
20%
25%
30%
35%
40%
4Q14
1Q15
2Q15
3Q15
4Q15
1Q16
2Q16
3Q16
4Q16
1Q17
2Q17
3Q17
4Q17
1Q18
2Q18
3Q18
4Q18
1Q19
2Q19
3Q19
4Q19
1Q20
2Q20
3Q20
4Q20
Revolving Line Utilization Trend
Linked Quarter Growth0.2% 2.0% 20.8% (9.8%) (7.9%)
• Linked quarter loan decline of 7.9% was driven by lower revolving line utilization – utilization rates have continued to decline as corporate customers continue to pay down loans
• Net charge-offs remained elevated due to stress in certain industries impacted by COVID-19

22U . S. BAN C ORP |
Investor$20,221
Owner Occupied
$8,783
CRE Mortgage CRE Construction
A&D Const$228 Multi-family
$4,073
Retail$226
ResidentialConstruction
$2,232
Office$975
Other$2,806
Resi Land$554
$mm 4Q19 3Q20 4Q20Average Loans $39,722 $40,929 $40,09830-89 Delinquencies 0.09% 0.23% 0.47%90+ Delinquencies 0.01% 0.00% 0.01%Nonperforming Loans 0.21% 0.82% 1.14%Performing TDRs* $160 $173 $153
Credit Quality – Commercial Real EstateAverage Loans ($mm) and Net Charge-offs Ratio Key Statistics
Key Points
$39,722 $40,078 $41,088 $40,929 $40,098
0.07% -0.02%0.22%
0.81% 0.83%
4Q19 1Q20 2Q20 3Q20 4Q20
Average Loans Net Charge-offs Ratio
Linked Quarter Growth
1.9% 0.9% 2.5% (0.4%) (2.0%)
• Average loans decreased by 2.0% on a linked quarter basis • Net charge-offs and nonperforming loans increased on a linked quarter basis due to stress in certain property types
impacted by COVID-19
* TDR = troubled debt restructuring
23U . S. BAN C ORP |
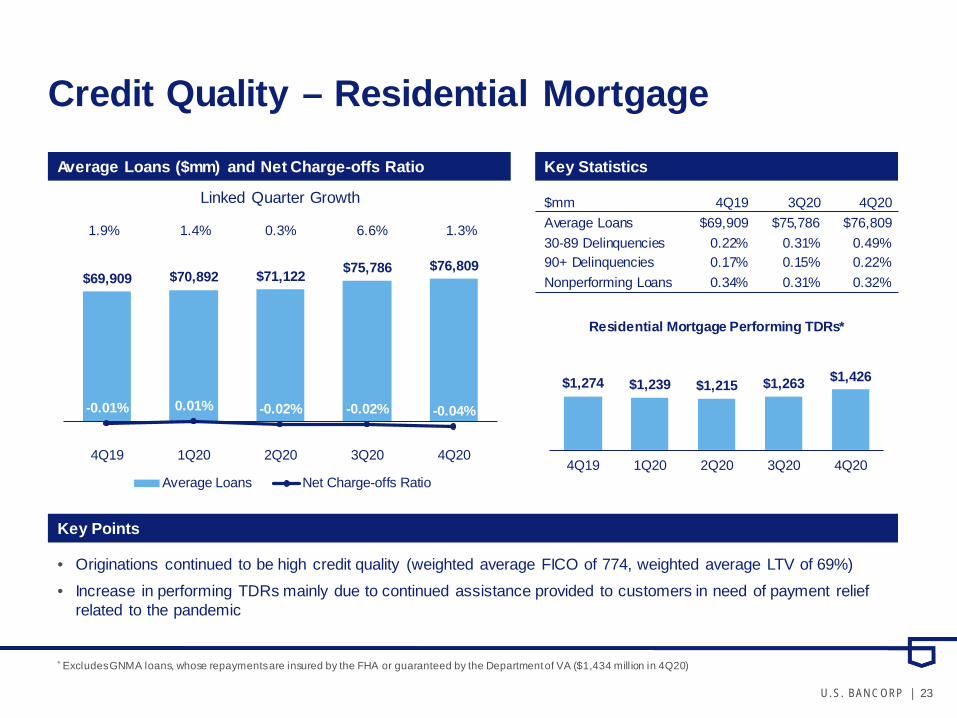
Credit Quality – Residential MortgageAverage Loans ($mm) and Net Charge-offs Ratio Key Statistics
Key Points
$69,909 $70,892 $71,122 $75,786 $76,809
-0.01% 0.01% -0.02% -0.02% -0.04%
4Q19 1Q20 2Q20 3Q20 4Q20
Average Loans Net Charge-offs Ratio
$mm 4Q19 3Q20 4Q20Average Loans $69,909 $75,786 $76,80930-89 Delinquencies 0.22% 0.31% 0.49%90+ Delinquencies 0.17% 0.15% 0.22%Nonperforming Loans 0.34% 0.31% 0.32%
$1,274 $1,239 $1,215 $1,263 $1,426
4Q19 1Q20 2Q20 3Q20 4Q20
Residential Mortgage Performing TDRs*
Linked Quarter Growth
1.9% 1.4% 0.3% 6.6% 1.3%
• Originations continued to be high credit quality (weighted average FICO of 774, weighted average LTV of 69%)• Increase in performing TDRs mainly due to continued assistance provided to customers in need of payment relief
related to the pandemic
* Excludes GNMA loans, whose repayments are insured by the FHA or guaranteed by the Department of VA ($1,434 mill ion in 4Q20)
24U . S. BAN C ORP |
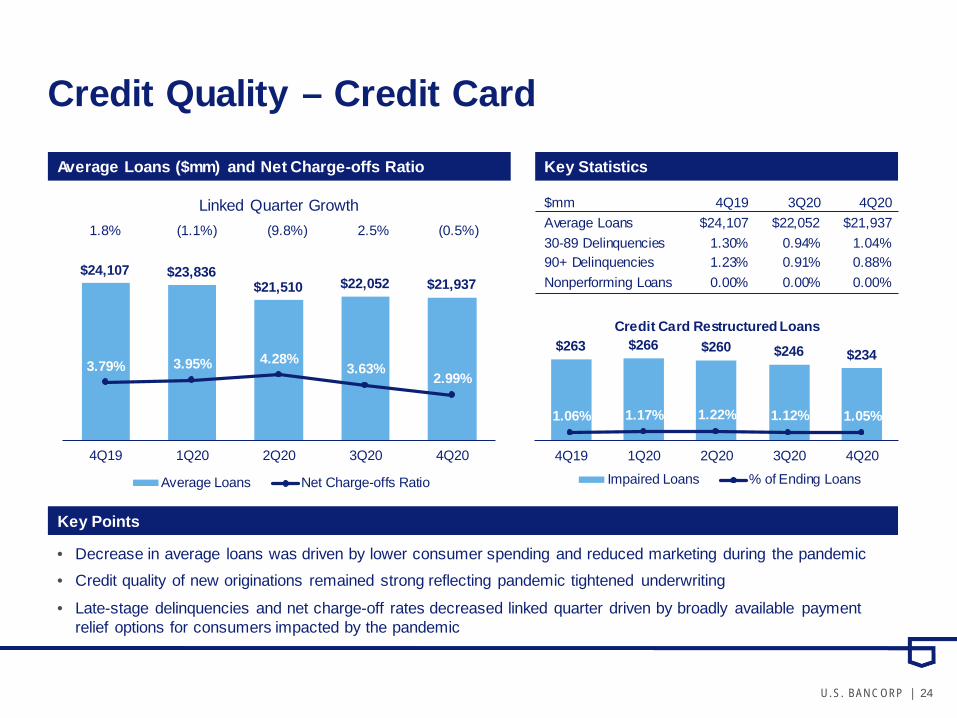
Credit Quality – Credit CardAverage Loans ($mm) and Net Charge-offs Ratio Key Statistics
Key Points
$24,107 $23,836$21,510 $22,052 $21,937
3.79% 3.95% 4.28% 3.63% 2.99%
4Q19 1Q20 2Q20 3Q20 4Q20
Average Loans Net Charge-offs Ratio
$mm 4Q19 3Q20 4Q20Average Loans $24,107 $22,052 $21,93730-89 Delinquencies 1.30% 0.94% 1.04%90+ Delinquencies 1.23% 0.91% 0.88%Nonperforming Loans 0.00% 0.00% 0.00%
$263 $266 $260 $246 $234
1.06% 1.17% 1.22% 1.12% 1.05%
4Q19 1Q20 2Q20 3Q20 4Q20
Credit Card Restructured Loans
Impaired Loans % of Ending Loans
Linked Quarter Growth1.8% (1.1%) (9.8%) 2.5% (0.5%)
• Decrease in average loans was driven by lower consumer spending and reduced marketing during the pandemic• Credit quality of new originations remained strong reflecting pandemic tightened underwriting
• Late-stage delinquencies and net charge-off rates decreased linked quarter driven by broadly available payment relief options for consumers impacted by the pandemic
25U . S. BAN C ORP |
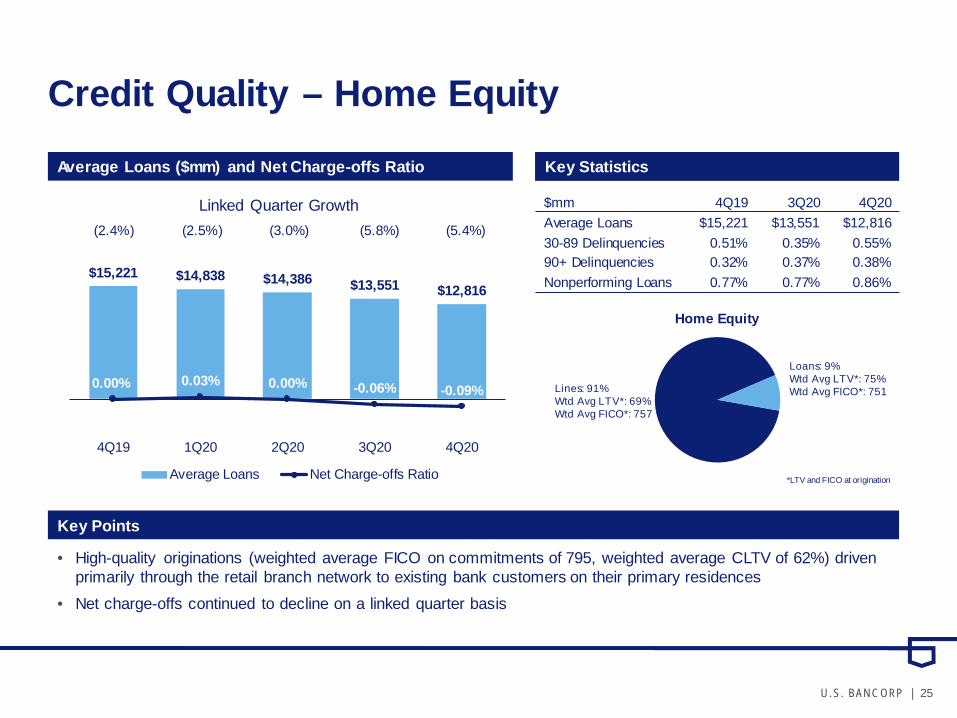
Credit Quality – Home EquityAverage Loans ($mm) and Net Charge-offs Ratio
$15,221 $14,838 $14,386 $13,551 $12,816
0.00% 0.03% 0.00% -0.06% -0.09%
4Q19 1Q20 2Q20 3Q20 4Q20
Average Loans Net Charge-offs Ratio
Key Points
Linked Quarter Growth(2.4%) (2.5%) (3.0%) (5.8%) (5.4%)
Key StatisticsKey Statistics
$mm 4Q19 3Q20 4Q20Average Loans $15,221 $13,551 $12,81630-89 Delinquencies 0.51% 0.35% 0.55%90+ Delinquencies 0.32% 0.37% 0.38%Nonperforming Loans 0.77% 0.77% 0.86%
Home Equity
Loans: 9%Wtd Avg LTV*: 75%Wtd Avg FICO*: 751Lines: 91%
Wtd Avg LTV*: 69%Wtd Avg FICO*: 757
*LTV and FICO at origination
• High-quality originations (weighted average FICO on commitments of 795, weighted average CLTV of 62%) driven primarily through the retail branch network to existing bank customers on their primary residences
• Net charge-offs continued to decline on a linked quarter basis
26U . S. BAN C ORP |
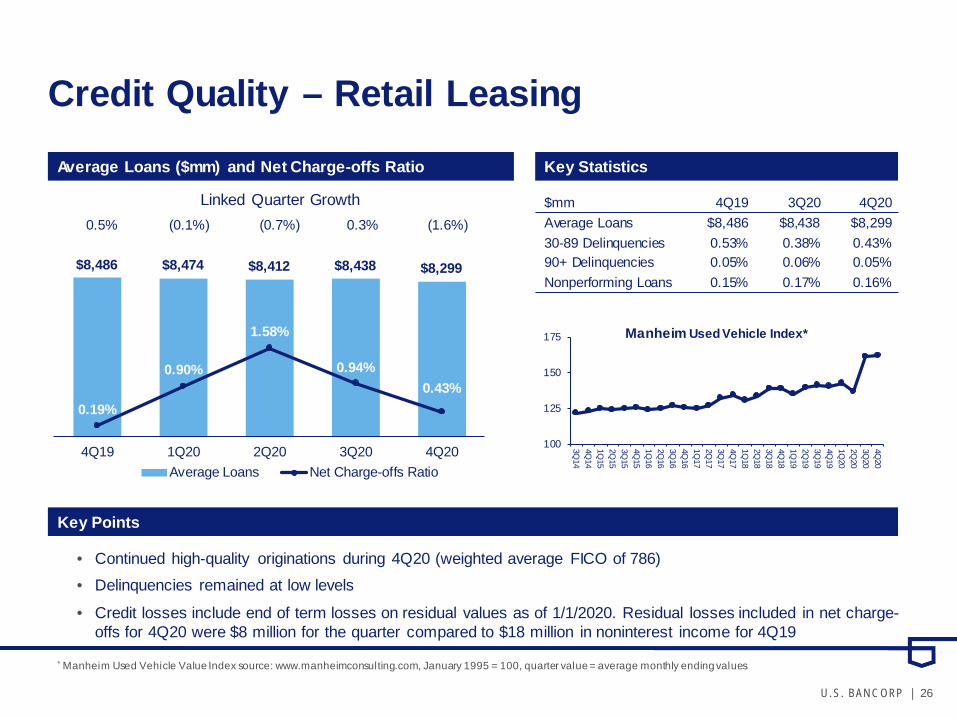
Credit Quality – Retail LeasingAverage Loans ($mm) and Net Charge-offs Ratio Key Statistics
Key Points
$8,486 $8,474 $8,412 $8,438 $8,299
0.19%
0.90%
1.58%
0.94%0.43%
0.0%0.2%0.4%0.6%0.8%1.0%1.2%1.4%1.6%1.8%2.0%2.2%2.4%2.6%2.8%3.0%
4Q19 1Q20 2Q20 3Q20 4Q20Average Loans Net Charge-offs Ratio
$mm 4Q19 3Q20 4Q20Average Loans $8,486 $8,438 $8,29930-89 Delinquencies 0.53% 0.38% 0.43%90+ Delinquencies 0.05% 0.06% 0.05%Nonperforming Loans 0.15% 0.17% 0.16%
100
125
150
175
3Q14
4Q14
1Q15
2Q15
3Q15
4Q15
1Q16
2Q16
3Q16
4Q16
1Q17
2Q17
3Q17
4Q17
1Q18
2Q18
3Q18
4Q18
1Q19
2Q19
3Q19
4Q19
1Q20
2Q20
3Q20
4Q20
Manheim Used Vehicle Index*
Linked Quarter Growth0.5% (0.1%) (0.7%) 0.3% (1.6%)
• Continued high-quality originations during 4Q20 (weighted average FICO of 786) • Delinquencies remained at low levels
• Credit losses include end of term losses on residual values as of 1/1/2020. Residual losses included in net charge-offs for 4Q20 were $8 million for the quarter compared to $18 million in noninterest income for 4Q19
* Manheim Used Vehicle Value Index source: www.manheimconsulting.com, January 1995 = 100, quarter value = average monthly ending values

27U . S. BAN C ORP |
Credit Quality – Other RetailAverage Loans ($mm) and Net Charge-offs Ratio Key Statistics
Key Points
$33,509 $33,552 $33,550 $34,773 $35,928
0.79% 0.79%0.54% 0.43% 0.48%
4Q19 1Q20 2Q20 3Q20 4Q20
Average Loans Net Charge-offs Ratio
$mm 4Q19 3Q20 4Q20Average Loans $33,509 $34,773 $35,92830-89 Delinquencies 0.81% 0.51% 0.60%90+ Delinquencies 0.13% 0.07% 0.10%Nonperforming Loans 0.11% 0.10% 0.09%
Auto Loans$19,390
Installment$13,688
Revolving Credit$2,675
Student Loans$175
Other Retail
Linked Quarter Growth0.2% 0.1% 0.0% 3.6% 3.3%
• Average loans increased linked quarter due to strong volume in recreational vehicle and boat loans• Delinquency and charge-offs remained at low levels driven by fiscal stimulus and broadly available payment relief
options for consumers impacted by the pandemic

28U . S. BAN C ORP |
Credit Quality – Auto LoansAverage Loans ($mm) and Net Charge-offs Ratio Key Statistics
Key Points
$19,434 $19,276 $18,758 $18,823 $19,390
0.47% 0.52%0.32% 0.23% 0.31%
4Q19 1Q20 2Q20 3Q20 4Q20Average Loans Net Charge-offs Ratio
$mm 4Q19 3Q20 4Q20Average Loans $19,434 $18,823 $19,39030-89 Delinquencies 1.06% 0.68% 0.83%90+ Delinquencies 0.10% 0.05% 0.11%Nonperforming Loans 0.15% 0.15% 0.13%
Indirect and Direct Channel
Direct: 4%Wtd Avg FICO: 758NCO: 0.33%
Indirect: 96%Wtd Avg FICO: 783NCO: 0.31%
Linked Quarter Growth0.0% (0.8%) (2.7%) 0.3% 3.0%
• Originations remain high quality reflecting pandemic tightened underwriting (weighted average FICO of 793) • Delinquency and charge-offs remained at low levels driven by fiscal stimulus and broadly available payment relief
options for consumers impacted by the pandemic
Auto loans are included in Other Retail category

29U . S. BAN C ORP |
(Dollars in Millions, Unaudited) Three Months EndedDecember 31, September 30, December 31,
2020 2020 2019 Net interest income $3,175 $3,227 $3,207Taxable-equivalent adjustment (4) 26 25 24
Net interest income, on a taxable-equivalent basis 3,201 3,252 3,231
Net interest income, on a taxable-equivalent basis (as calculated above) 3,201 3,252 3,231Noninterest income 2,550 2,712 2,436Less: Securities gains (losses), net 34 12 26
Total net revenue, excluding net securities gains (losses) (a) 5,717 5,952 5,641
Noninterest expense (b) 3,364 3,371 3,401
Efficiency ratio (b)/(a) 58.8 % 56.6 % 60.3 %
Total net revenue, excluding net securities gains (losses) (as calculated above) $5,641Less: Notable items (5) (140)
Total net revenue, excluding net securities gains (losses) and notable items (c) 5,781
Noninterest expense 3,401 Less: Notable items (6) 200
Noninterest expense, excluding notable items (d) 3,201
Efficiency ratio, excluding notable items (d)/(c) 55.4 %
Net income attributable to U.S. Bancorp $1,486Less: Notable items (7) (272)Net income attributable to U.S. Bancorp, excluding notable items 1,758 Annualized net income attributable to U.S. Bancorp, excluding notable items (e) 6,975
Average assets (f ) 485,853
Return on average assets, excluding notable items (e)/(f ) 1.44 %
Net income applicable to U.S. Bancorp common shareholders $1,408Less: Notable items (7) (272)Net income applicable to U.S. Bancorp common shareholders, excluding notable items 1,680 Annualized net income applicable to U.S. Bancorp common shareholders, excluding notable items (g) 6,665Average common equity (h) 47,163Return on average common equity, excluding notable items (g)/(h) 14.1 %
Non-GAAP Financial Measures
(4), (5), (6), (7) – see slide 32 for corresponding notes
30U . S. BAN C ORP |
Non-GAAP Financial MeasuresDecember 31, September 30, December 31,
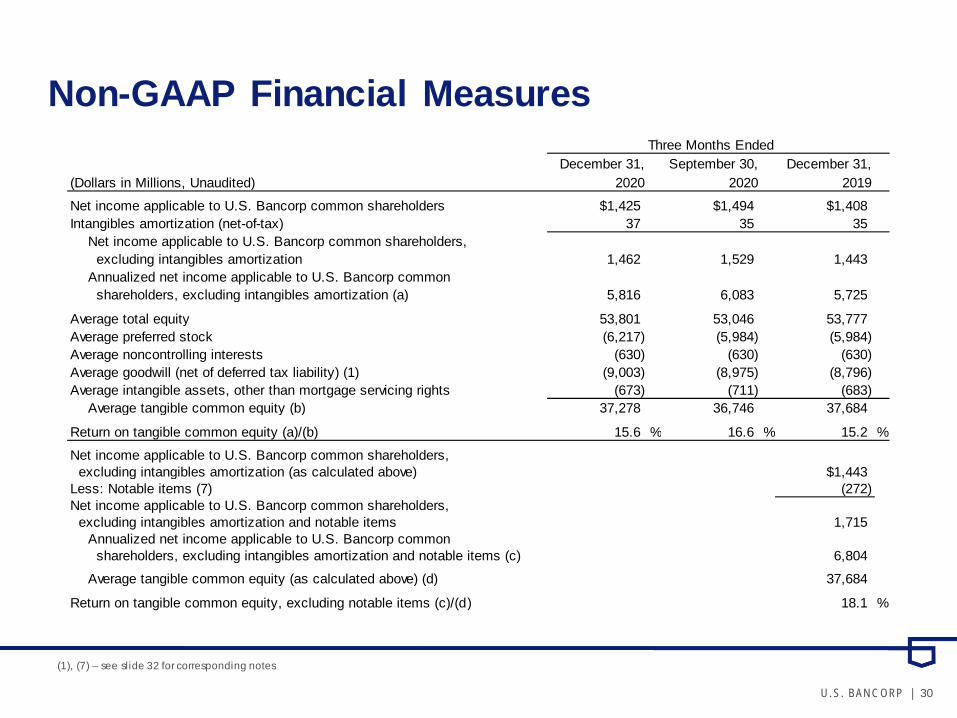
(Dollars in Millions, Unaudited) 2020 2020 2019Net income applicable to U.S. Bancorp common shareholders $1,425 $1,494 $1,408Intangibles amortization (net-of-tax) 37 35 35
Net income applicable to U.S. Bancorp common shareholders, excluding intangibles amortization 1,462 1,529 1,443Annualized net income applicable to U.S. Bancorp common shareholders, excluding intangibles amortization (a) 5,816 6,083 5,725
Average total equity 53,801 53,046 53,777Average preferred stock (6,217) (5,984) (5,984)Average noncontrolling interests (630) (630) (630)Average goodwill (net of deferred tax liability) (1) (9,003) (8,975) (8,796)Average intangible assets, other than mortgage servicing rights (673) (711) (683)
Average tangible common equity (b) 37,278 36,746 37,684
Return on tangible common equity (a)/(b) 15.6 % 16.6 % 15.2 %Net income applicable to U.S. Bancorp common shareholders, excluding intangibles amortization (as calculated above) $1,443Less: Notable items (7) (272)Net income applicable to U.S. Bancorp common shareholders, excluding intangibles amortization and notable items 1,715
Annualized net income applicable to U.S. Bancorp common shareholders, excluding intangibles amortization and notable items (c) 6,804Average tangible common equity (as calculated above) (d) 37,684
Return on tangible common equity, excluding notable items (c)/(d ) 18.1 %
Three Months Ended
(1), (7) – see slide 32 for corresponding notes
31U . S. BAN C ORP |
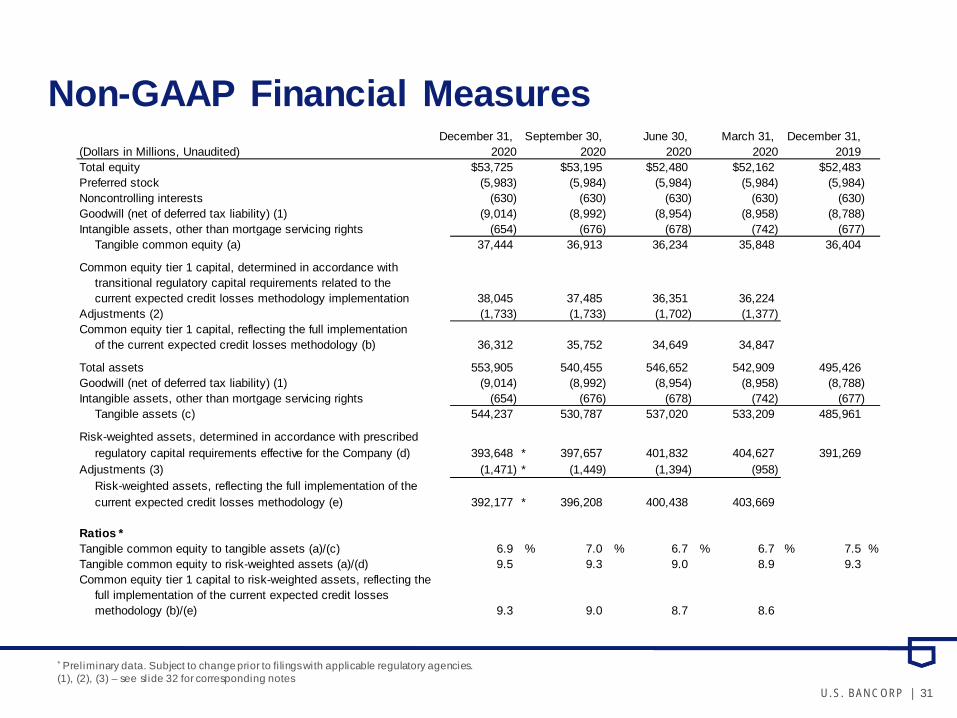
December 31, September 30, June 30, March 31, December 31, (Dollars in Millions, Unaudited) 2020 2020 2020 2020 2019 Total equity $53,725 $53,195 $52,480 $52,162 $52,483Preferred stock (5,983) (5,984) (5,984) (5,984) (5,984)Noncontrolling interests (630) (630) (630) (630) (630)Goodwill (net of deferred tax liability) (1) (9,014) (8,992) (8,954) (8,958) (8,788)Intangible assets, other than mortgage servicing rights (654) (676) (678) (742) (677)
Tangible common equity (a) 37,444 36,913 36,234 35,848 36,404
Common equity tier 1 capital, determined in accordance withtransitional regulatory capital requirements related to the current expected credit losses methodology implementation 38,045 37,485 36,351 36,224
Adjustments (2) (1,733) (1,733) (1,702) (1,377)Common equity tier 1 capital, reflecting the full implementation
of the current expected credit losses methodology (b) 36,312 35,752 34,649 34,847
Total assets 553,905 540,455 546,652 542,909 495,426Goodwill (net of deferred tax liability) (1) (9,014) (8,992) (8,954) (8,958) (8,788)Intangible assets, other than mortgage servicing rights (654) (676) (678) (742) (677)
Tangible assets (c) 544,237 530,787 537,020 533,209 485,961
Risk-weighted assets, determined in accordance with prescribedregulatory capital requirements effective for the Company (d) 393,648 * 397,657 401,832 404,627 391,269
Adjustments (3) (1,471) * (1,449) (1,394) (958)Risk-weighted assets, reflecting the full implementation of thecurrent expected credit losses methodology (e) 392,177 * 396,208 400,438 403,669
Ratios *Tangible common equity to tangible assets (a)/(c) 6.9 % 7.0 % 6.7 % 6.7 % 7.5 %Tangible common equity to risk-weighted assets (a)/(d) 9.5 9.3 9.0 8.9 9.3Common equity tier 1 capital to risk-weighted assets, reflecting the
full implementation of the current expected credit lossesmethodology (b)/(e) 9.3 9.0 8.7 8.6
Non-GAAP Financial Measures
* Preliminary data. Subject to change prior to fi lings with applicable regulatory agencies.(1), (2), (3) – see slide 32 for corresponding notes
32U . S. BAN C ORP |
Notes
(1) Includes goodwill related to certain investments in unconsolidated financial institutions per prescribed regulatory requirements.
(2) Includes the estimated increase in the allowance for credit losses related to the adoption of the current expected credit losses methodology net of deferred taxes.
(3) Includes the impact of the estimated increase in the allowance for credit losses related to the adoption of the current expected credit losses methodology.
(4) Based on a federal income tax rate of 21 percent for those assets and liabilities whose income or expense is not included for federal income tax purposes.
(5) Notable items related to noninterest income for the three months ended December 31, 2019 include: $140 million derivative liability charge related to previously sold Visa shares.
(6) Notable items related to noninterest expense for the three months ended December 31, 2019 include: $200 million of severance charges and asset impairments.
(7) Notable items for the three months ended December 31, 2019 include: $112 million (after-tax) derivative liability charge related to previously sold Visa shares and $160 million (after-tax) of severance charges and asset impairments.
U . S. BAN C ORP
U.S. Bancorp4Q20 Earnings Conference Call
January 20, 2021
Recommended