Embed Size (px)
Citation preview
4Q20 Earnings Presentation
March 2021
Copyright © 2019 Credit Suisse Group AG and/or its affiliates. All rights reserved.
Un
sa
ve
d D
ocu
me
nt
/ 3
/21
/20
18
/ 1
6:5
2
Credit Suisse does not provide any tax advice. Any tax statement herein regarding any U.S. federal tax is not intended or written to be used, and cannot be used, by any taxpayer for the purpose of avoiding any penalties. Any such statement herein was written to support the marketing or promotion of the transaction(s) or matter(s) to which the statement relates. Each taxpayer should seek advice based on the taxpayer's particular circumstances from an independent tax advisor.
These materials have been provided to you by Credit Suisse in connection with an actual or potential mandate or engagement and may not be used or relied upon for any purpose other than as specifically contemplated by a written agreement with Credit Suisse. In addition, these materials may not be disclosed, in whole or in part, or summarized or otherwise referred to except as agreed in writing by Credit Suisse. The information used in preparing these materials was obtained from or through you or your representatives or from public sources. Credit Suisse assumes no responsibility for independent verif ication of such information and has relied on such information being complete and accurate in all material respects. To the extent such information includes est imates and forecasts of future financial performance (including estimates of potential cost savings and synergies) prepared by or reviewed or discussed with the managements of your company and/or other potential transaction participants or obtained from public sources, we have assumed that such estimates and forecasts have been reasonably prepared on bases reflecting the best currently available estimates and judgments of such managements (or, with respect to estimates and forecasts obtained from public sources, represent reasonable estimates). These materials were designed for use by specific persons familiar with the business and the affairs of your company and Credit Suisse assumes no obligation to update or otherwise revise these materials. Nothing contained herein should be construed as tax, accounting or legal advice. You (and each of your employees, representatives or other agents) may disclose to any and all persons, without limitation of any kind, the tax treatment and tax structure of the transactions contemplated by these materials and all materials of any kind (including opinions or other tax analyses) that are provided to you relating to such tax treatment and structure. For this purpose, the tax treatment of a transaction is the purported or claimed U.S. federal income tax treatment of the transaction and the tax structure of a transaction is any fact that may be relevant to understanding the purported or claimed U.S. federal income tax treatment of the transaction.
These materials have been prepared by Credit Suisse ("CS") and its affiliates for use by CS. Accordingly, any information reflected or incorporated herein, or in related materials or in ensuing transactions, may be shared in good faith by CS and its affiliates with employees of CS, its affiliates and agents in any location.
Credit Suisse has adopted policies and guidelines designed to preserve the independence of its research analysts. Credit Suisse’s policies prohibit employees from directly or indirectly offering a favorable research rating or specific price target, or offering to change a research rating or price target, as consideration for or an inducement to obtain business or other compensation. Credit Suisse’s policies prohibit research analysts from being compensated for their involvement in investment banking transactions.
1
DisclaimerThis presentation has been prepared by BlueCity Holdings Limited (the “Company”) solely for informational purposes and has not been independently verified. By viewing or accessing the information contained in this material, the recipient hereby acknowledges and agrees that no representations, warranties or undertakings, express or implied, are made by the Company or any of its directors, shareholders, employees, agents, affiliates, advisors or representatives or the underwriters of the proposed offering as to, and no reliance should be placed upon, the accuracy, fairness, completeness or correctness of the information or opinions presented or contained in this presentation. None of the Company or any of its directors, shareholders, employees, agents, affiliates, advisors or representatives or the underwriters of the proposed offering accept any responsibility whatsoever (in negligence or otherwise) for any loss howsoever arising from any information presented or contained in this presentation or otherwise arising in connection with the presentation. The information presented or contained in this presentation is subject to change without notice, and its accuracy, completeness and comprehensiveness are not guaranteed.
Certain statements in this presentation, and other statements that the Company may make, are forward-looking statements within the meaning of Section 27A of the Securities Act and Section 21E of the Securities Exchange Act of 1934, as amended. These statements reflect the Company’s intent, beliefs or current expectations about the future. These statements can be recognized by the use of words such as “expects,” “plans,” “will,” “estimates,” “projects,” “intends,” “anticipates,” “believes,” “confident” or words of similar meaning. These forward-looking statements are not guarantees of future performance and are based on a number of assumptions about the Company’s operations and other factors, many of which are beyond the Company’s control, and accordingly, actual results may differ materially from these forward-looking statements. The Company or any of its affiliates, advisers or representatives or the underwriters of the proposed offering has no obligation and does not undertake to revise forward-looking statements to reflect future events or circumstances.
This presentation does not constitute an offer to sell or issue or an invitation or recommendation to purchase or subscribe for any securities of the Company for sale in the United States or anywhere else. No securities of the Company may be sold in the United States without registration with the United States Securities and Exchange Commission (the “SEC”) or an exemption from such registration pursuant to the Securities Act of 1933, as amended (the “Securities Act”) and the rules and regulations thereunder. No part of this presentation shall form the basis of or be relied upon in connection with any contract or commitment whatsoever. Specifically, these materials do not constitute a “prospectus” within the meaning of the Securities Act. This presentation does not contain all relevant information relating to the Company or its securities, particularly with respect to the risks and special considerations involved with an investment in the securities of the Company and is qualified in its entirety by reference to the detailed information in the prospectus relating to the proposed offering. The Company has filed a registration statement on Form F-1 with the SEC relating to its securities to be offered in the United States, but the registration statement has not yet become effective. Any public offering of the Company’s securities to be made in the United States will be made solely on the basis of the information contained in the statutory prospectus included in such registration statement. The prospectus contains detailed information about the Company, its subsidiaries, management, the consolidated financial statements and risks and uncertainties associated with its business and industry. Any decision to purchase the Company’s securities in the proposed offering should be made solely on the basis of the information contained in the prospectus relating to the proposed offering.
This presentation may certain non-GAAP measures which the Company uses as supplemental measures to review and assess its operating performance. These non-GAAP financial measures have limitations as analytical tools, and when assessing the Company’s operating performances, you should not consider them in isolation, or as a substitute for net income attributable to the Company or other consolidated statement of operations data prepared in accordance with U.S. GAAP.
THE INFORMATION CONTAINED IN THIS DOCUMENT IS HIGHLY CONFIDENTIAL AND IS BEING GIVEN SOLELY FOR YOUR INFORMATION AND ONLY FOR YOUR USE IN CONNECTION WITH THIS PRESENTATION. THE INFORMATION CONTAINED HEREIN MAY NOT BE COPIED, REPRODUCED, REDISTRIBUTED, OR OTHERWISE DISCLOSED, IN WHOLE OR IN PART, TO ANY OTHER PERSON IN ANY MANNER. Any forwarding, distribution or reproduction of this presentation in whole or in part is unauthorized.
By viewing, accessing or participating in this presentation, you hereby acknowledge and agree to keep the contents of this presentation and these materials confidential. You agree not to remove these materials, or any materials provided in connection herewith, from the conference room where such documents are provided. You agree further not to photograph, copy or otherwise reproduce this presentation in any form or pass on this presentation to any other person for any purpose, during the presentation or while in the conference room. You must return this presentation and all other materials provided in connection herewith to the Company upon completion of the presentation. By viewing, accessing or participating in this presentation, you agree to be bound by the foregoing limitations. Any failure to comply with these restrictions may constitute a violation of applicable securities laws.
Total Revenues
Net Loss
Monthly Active Users
Total Paying Users
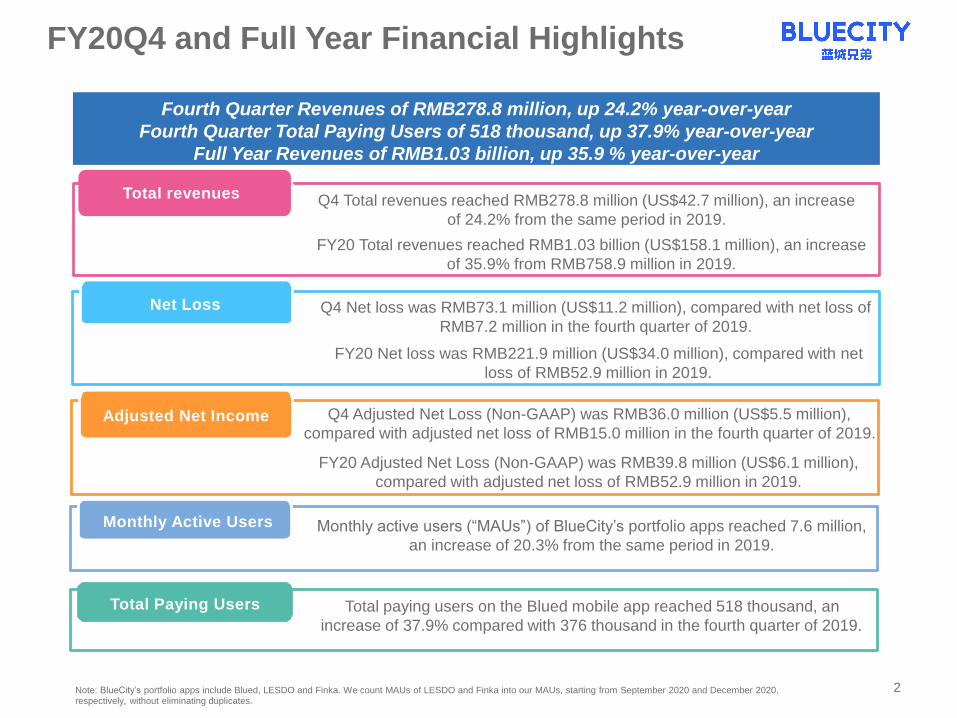
Fourth Quarter Revenues of RMB278.8 million, up 24.2% year-over-year
Fourth Quarter Total Paying Users of 518 thousand, up 37.9% year-over-year
Full Year Revenues of RMB1.03 billion, up 35.9 % year-over-year
• Monthly active users (“MAUs”) of BlueCity’s portfolio apps reached 7.6 million,
an increase of 20.3% from the same period in 2019.
• Total paying users on the Blued mobile app reached 518 thousand, an
increase of 37.9% compared with 376 thousand in the fourth quarter of 2019.
• Q4 Total revenues reached RMB278.8 million (US$42.7 million), an increase
of 24.2% from the same period in 2019.
• Q4 Net loss was RMB73.1 million (US$11.2 million), compared with net loss of
RMB7.2 million in the fourth quarter of 2019.
FY20Q4 and Full Year Financial Highlights
2
Adjusted Net Income Q4 Adjusted Net Loss (Non-GAAP) was RMB36.0 million (US$5.5 million),
compared with adjusted net loss of RMB15.0 million in the fourth quarter of 2019.
• FY20 Total revenues reached RMB1.03 billion (US$158.1 million), an increase
of 35.9% from RMB758.9 million in 2019.
Total revenues
• FY20 Net loss was RMB221.9 million (US$34.0 million), compared with net
loss of RMB52.9 million in 2019.
FY20 Adjusted Net Loss (Non-GAAP) was RMB39.8 million (US$6.1 million),
compared with adjusted net loss of RMB52.9 million in 2019.
Note: BlueCity’s portfolio apps include Blued, LESDO and Finka. We count MAUs of LESDO and Finka into our MAUs, starting from September 2020 and December 2020, respectively, without eliminating duplicates.
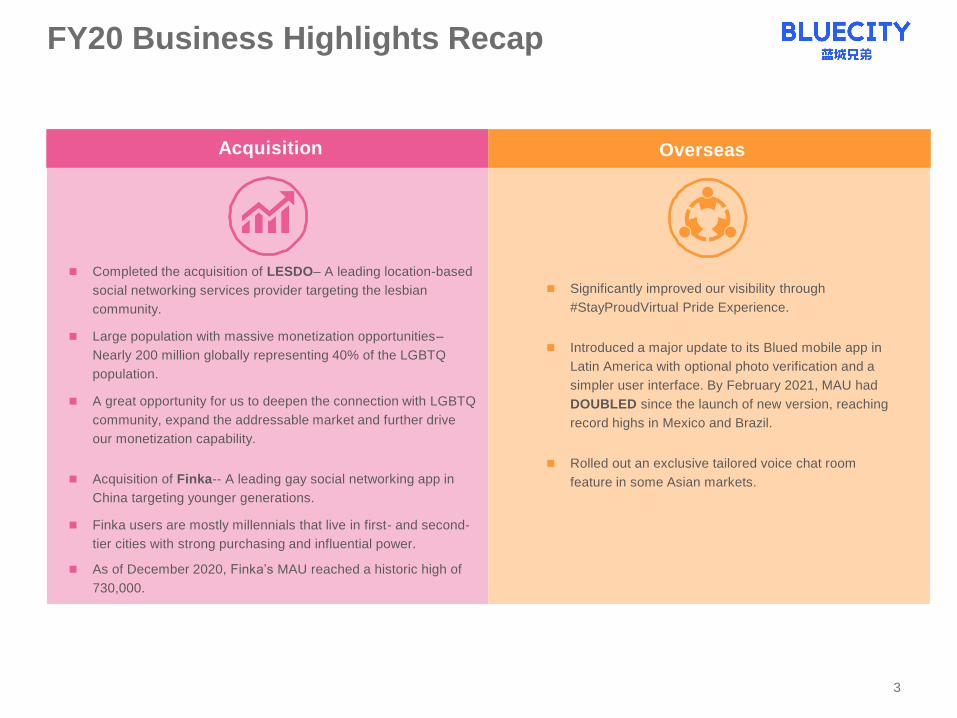
Acquisition Overseas
FY20 Business Highlights Recap
3
Completed the acquisition of LESDO– A leading location-based
social networking services provider targeting the lesbian
community.
Large population with massive monetization opportunities–
Nearly 200 million globally representing 40% of the LGBTQ
population.
A great opportunity for us to deepen the connection with LGBTQ
community, expand the addressable market and further drive
our monetization capability.
Acquisition of Finka-- A leading gay social networking app in
China targeting younger generations.
Finka users are mostly millennials that live in first- and second-
tier cities with strong purchasing and influential power.
As of December 2020, Finka’s MAU reached a historic high of
730,000.
Significantly improved our visibility through
#StayProudVirtual Pride Experience.
Introduced a major update to its Blued mobile app in
Latin America with optional photo verification and a
simpler user interface. By February 2021, MAU had
DOUBLED since the launch of new version, reaching
record highs in Mexico and Brazil.
Rolled out an exclusive tailored voice chat room
feature in some Asian markets.
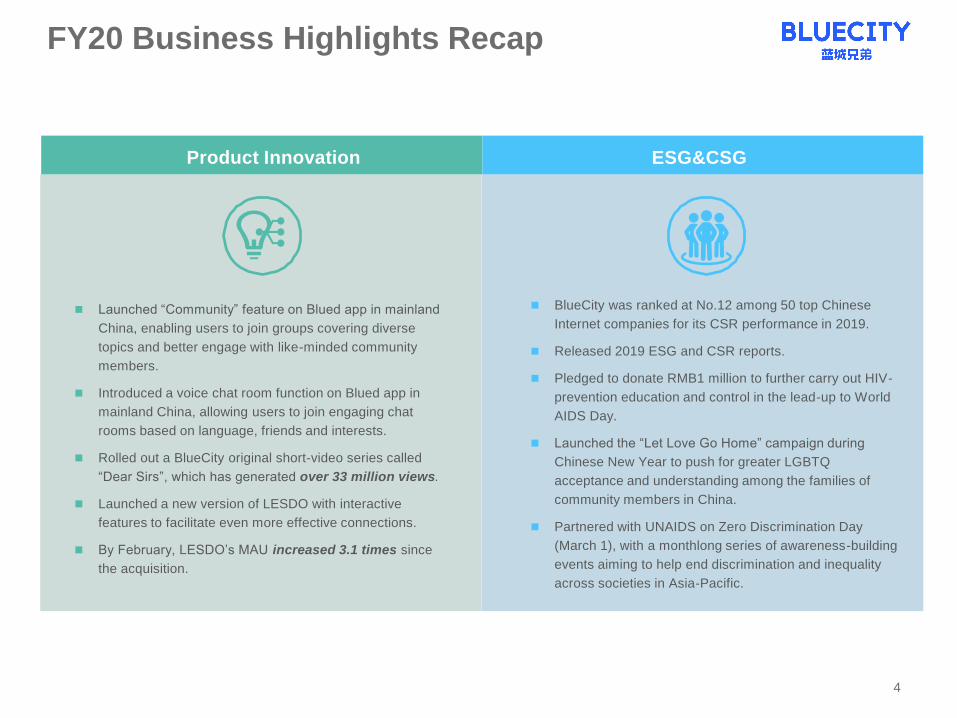
Product Innovation ESG&CSG
FY20 Business Highlights Recap
4
Launched “Community” feature on Blued app in mainland
China, enabling users to join groups covering diverse
topics and better engage with like-minded community
members.
Introduced a voice chat room function on Blued app in
mainland China, allowing users to join engaging chat
rooms based on language, friends and interests.
Rolled out a BlueCity original short-video series called
“Dear Sirs”, which has generated over 33 million views.
Launched a new version of LESDO with interactive
features to facilitate even more effective connections.
By February, LESDO’s MAU increased 3.1 times since
the acquisition.
BlueCity was ranked at No.12 among 50 top Chinese
Internet companies for its CSR performance in 2019.
Released 2019 ESG and CSR reports.
Pledged to donate RMB1 million to further carry out HIV-
prevention education and control in the lead-up to World
AIDS Day.
Launched the “Let Love Go Home” campaign during
Chinese New Year to push for greater LGBTQ
acceptance and understanding among the families of
community members in China.
Partnered with UNAIDS on Zero Discrimination Day
(March 1), with a monthlong series of awareness-building
events aiming to help end discrimination and inequality
across societies in Asia-Pacific.
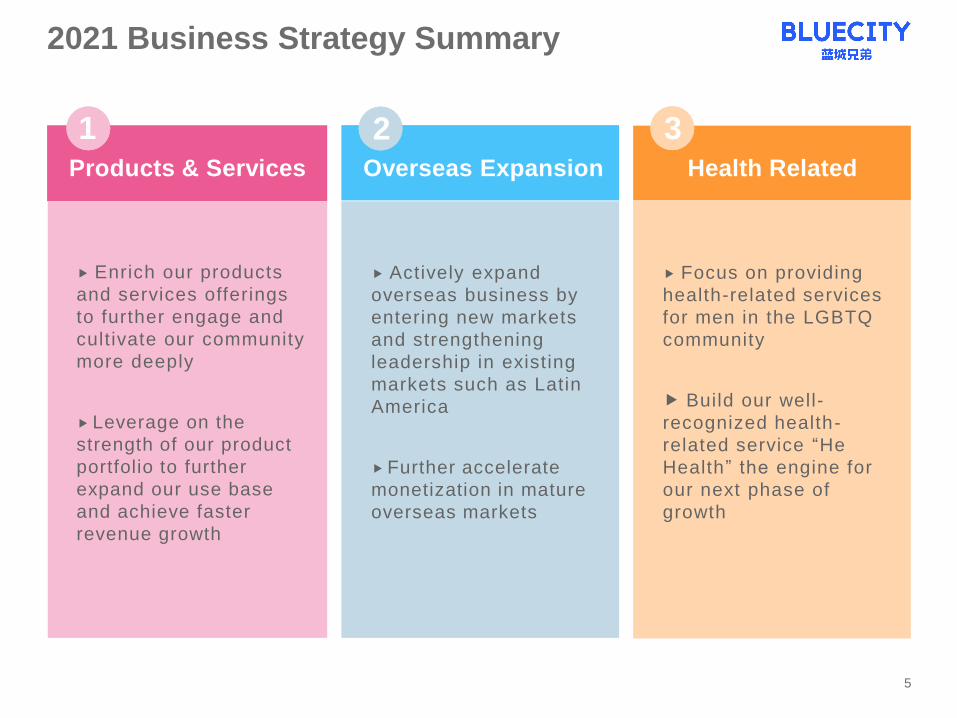
2021 Business Strategy Summary
21
Enrich our products
and services offerings
to further engage and
cultivate our community
more deeply
Leverage on the
strength of our product
portfolio to further
expand our use base
and achieve faster
revenue growth
Actively expand
overseas business by
entering new markets
and strengthening
leadership in existing
markets such as Latin
America
Further accelerate
monetization in mature
overseas markets
Focus on providing
health-related services
for men in the LGBTQ
community
Build our well-
recognized health-
related service “He
Health” the engine for
our next phase of
growth
3Overseas ExpansionProducts & Services Health Related
5
6
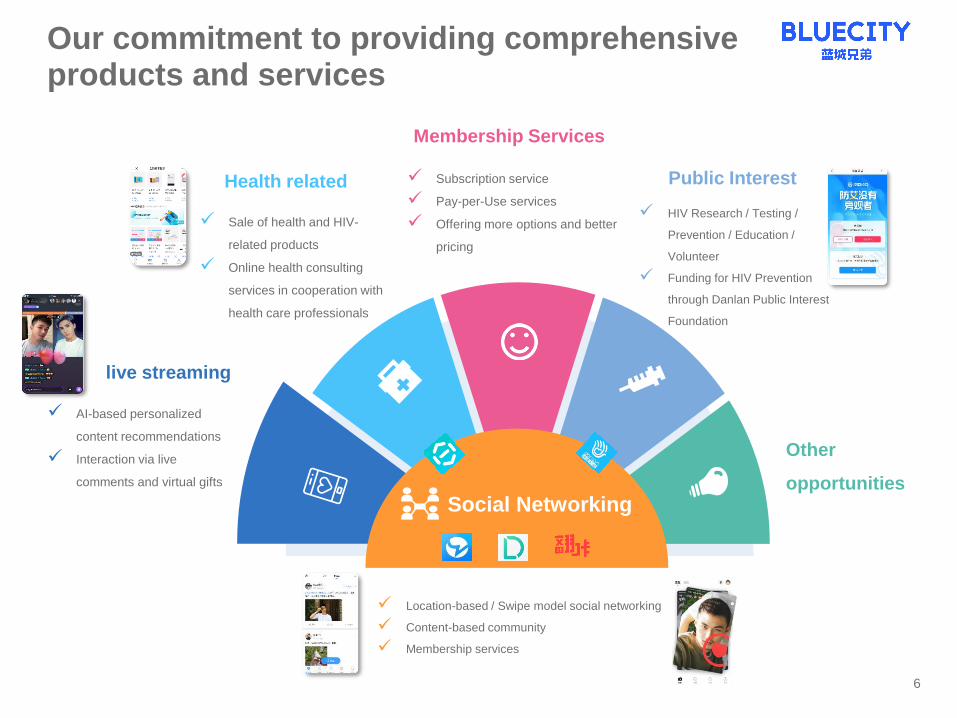
Social Networking
Location-based / Swipe model social networking
Content-based community
Membership services
live streaming
AI-based personalized
content recommendations
Interaction via live
comments and virtual gifts
Health related
Sale of health and HIV-
related products
Online health consulting
services in cooperation with
health care professionals
Membership Services
Subscription service
Pay-per-Use services
Offering more options and better
pricing
Public Interest
HIV Research / Testing /
Prevention / Education /
Volunteer
Funding for HIV Prevention
through Danlan Public Interest
Foundation
Our commitment to providing comprehensive products and services
Other
opportunities
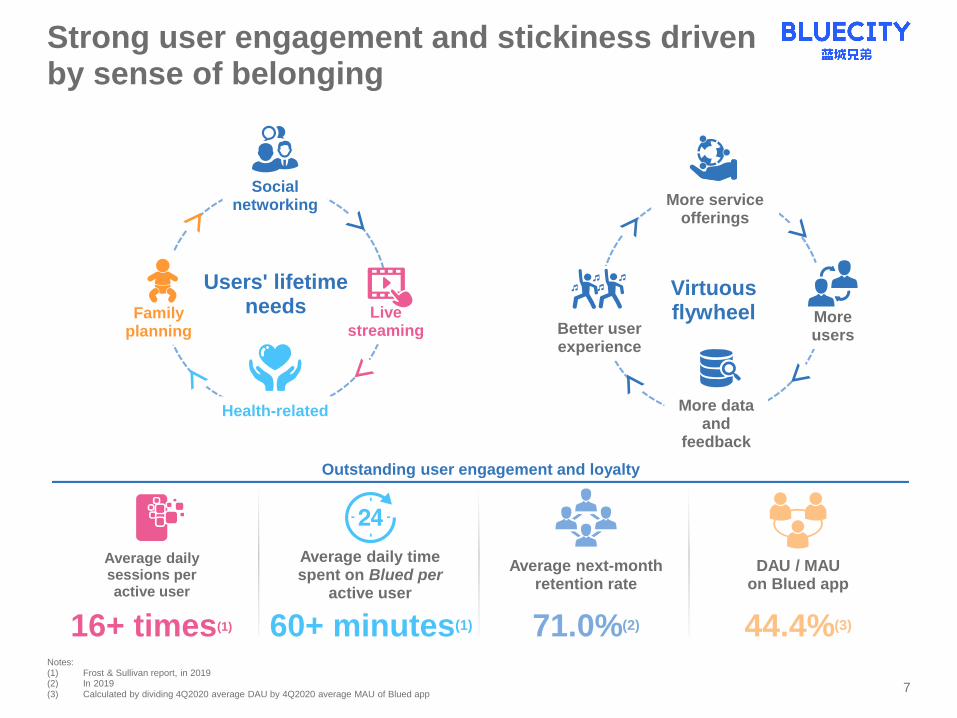
Strong user engagement and stickiness driven by sense of belonging
Outstanding user engagement and loyalty
Average next-month retention rate
71.0%(2)
Average daily time spent on Blued per
active user
60+ minutes(1)16+ times(1)
Average dailysessions per active user
Notes:(1) Frost & Sullivan report, in 2019(2) In 2019(3) Calculated by dividing 4Q2020 average DAU by 4Q2020 average MAU of Blued app
DAU / MAUon Blued app
44.4%(3)
7
Health-related
Socialnetworking
Familyplanning
Live streaming
Users' lifetime needs
More users
More data and
feedback
Better user experience
Virtuousflywheel
More service offerings
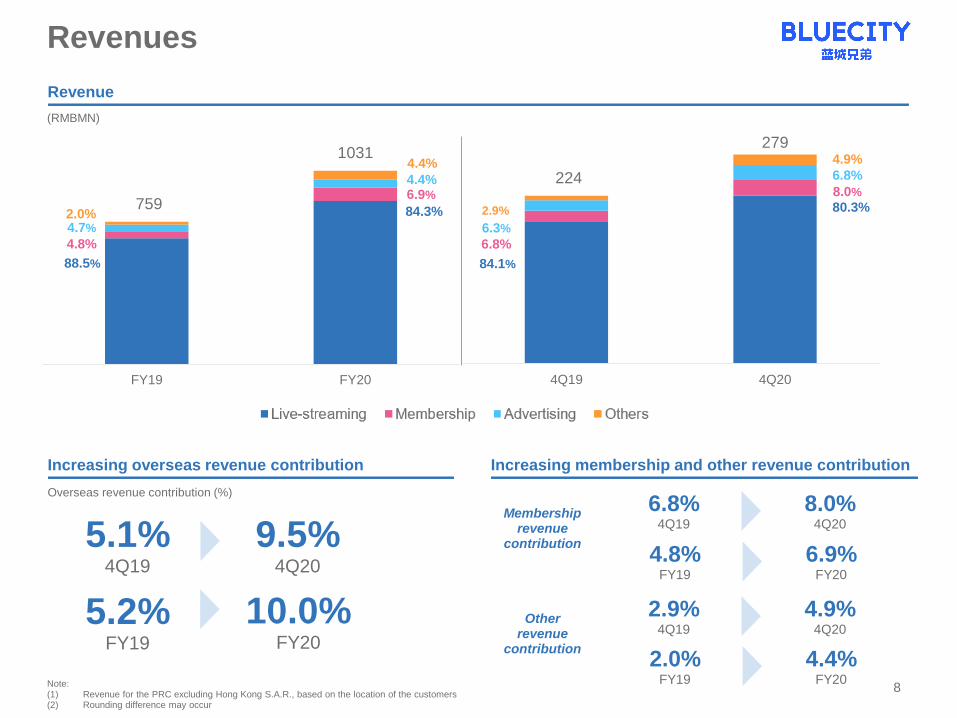
Revenues
(RMBMN)
Revenue
Note:(1) Revenue for the PRC excluding Hong Kong S.A.R., based on the location of the customers(2) Rounding difference may occur
Membership revenue
contribution
Other revenue
contribution
Increasing overseas revenue contribution Increasing membership and other revenue contribution
Overseas revenue contribution (%)
6.8%4Q19
8.0%4Q20
2.9%4Q19
4.9%4Q20
5.1%4Q19
9.5%4Q20
8
224
279
4Q19 4Q20
2.9%
6.3%
6.8%
84.1%
4.9%
6.8%
8.0%
80.3%759
1031
FY19 FY20
2.0%4.7%
4.8%
88.5%
4.4%
4.4%6.9%
84.3%
5.2%FY19
10.0%FY20
4.8%FY19
6.9%FY20
2.0%FY19
4.4%FY20
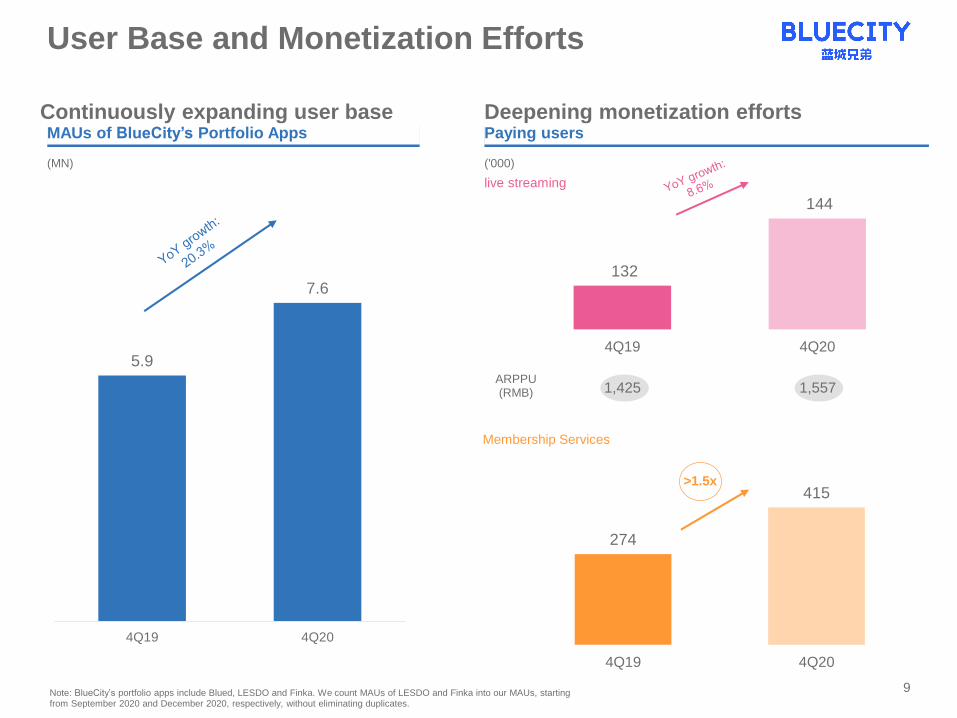
274
415
4Q19 4Q20
132
144
4Q19 4Q20
User Base and Monetization Efforts
Continuously expanding user base Deepening monetization effortsMAUs of BlueCity’s Portfolio Apps
(MN)
Paying users
>1.5x
ARPPU(RMB) 1,425 1,557
('000)
live streaming
Membership Services
9
5.9
7.6
4Q19 4Q20
Note: BlueCity’s portfolio apps include Blued, LESDO and Finka. We count MAUs of LESDO and Finka into our MAUs, starting from September 2020 and December 2020, respectively, without eliminating duplicates.
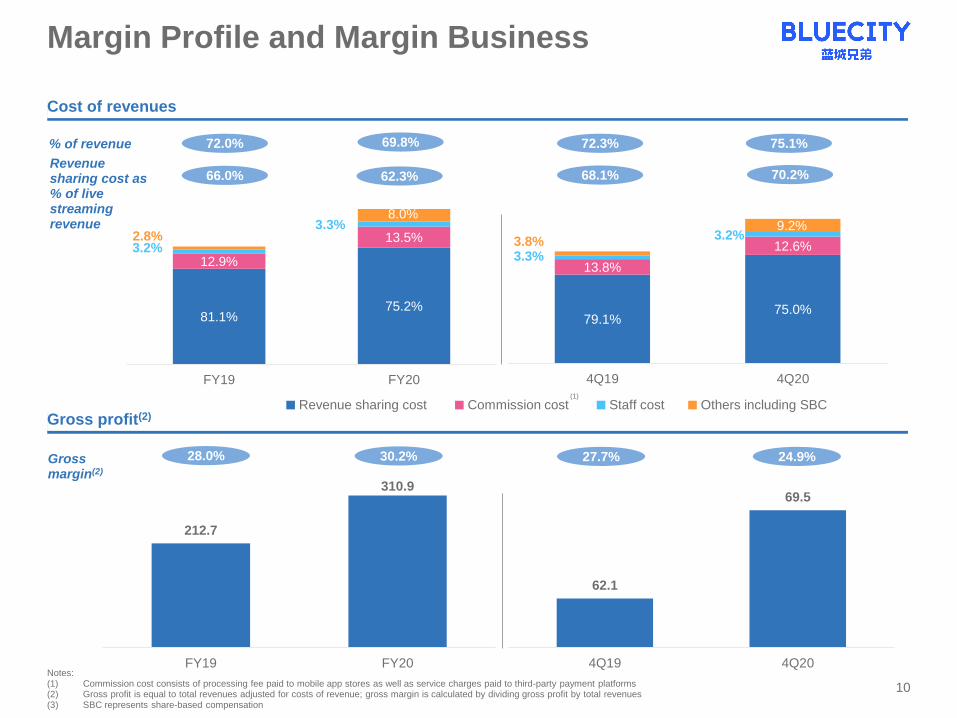
81.1%75.2%
12.9%
13.5%3.2%
3.3%2.8%
8.0%
FY19 FY20
79.1%75.0%
13.8%
12.6%3.3%
3.2%3.8%
9.2%
4Q19 4Q20
10
(1)
% of revenue
Gross margin(2)
Revenue sharing cost as % of live streaming revenue
Cost of revenues
Gross profit(2)
Notes:(1) Commission cost consists of processing fee paid to mobile app stores as well as service charges paid to third-party payment platforms (2) Gross profit is equal to total revenues adjusted for costs of revenue; gross margin is calculated by dividing gross profit by total revenues(3) SBC represents share-based compensation
Margin Profile and Margin Business
72.0% 72.3%
68.1%
28.0% 30.2%
Revenue sharing cost Commission cost Staff cost Others including SBC
66.0%
62.1
69.5
4Q19 4Q20
27.7% 24.9%
212.7
310.9
FY19 FY20
69.8%
62.3%
75.1%
70.2%
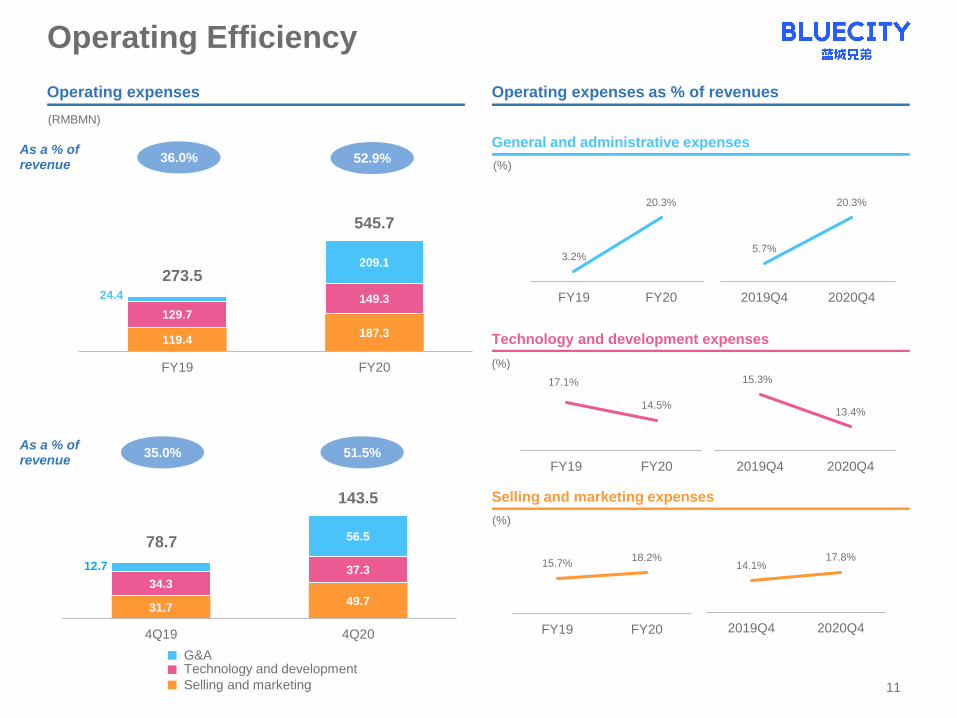
31.749.7
34.3 37.3 12.7
56.5 78.7
143.5
4Q19 4Q20
Selling and marketing expenses
Operating expenses
Technology and development expenses
General and administrative expenses36.0% 52.9%
Operating expenses as % of revenues
As a % of revenue
(%)
(%)
(%)
Selling and marketing
Technology and developmentG&A
(RMBMN)
35.0% 51.5%As a % of revenue
11
Operating Efficiency
119.4187.3
129.7
149.3 24.4
209.1
273.5
545.7
FY19 FY20
5.7%
20.3%
2019Q4 2020Q4
3.2%
20.3%
FY19 FY20
15.3%
13.4%
2019Q4 2020Q4
17.1%
14.5%
FY19 FY20
15.7%18.2%
FY19 FY20
14.1%17.8%
2019Q4 2020Q4
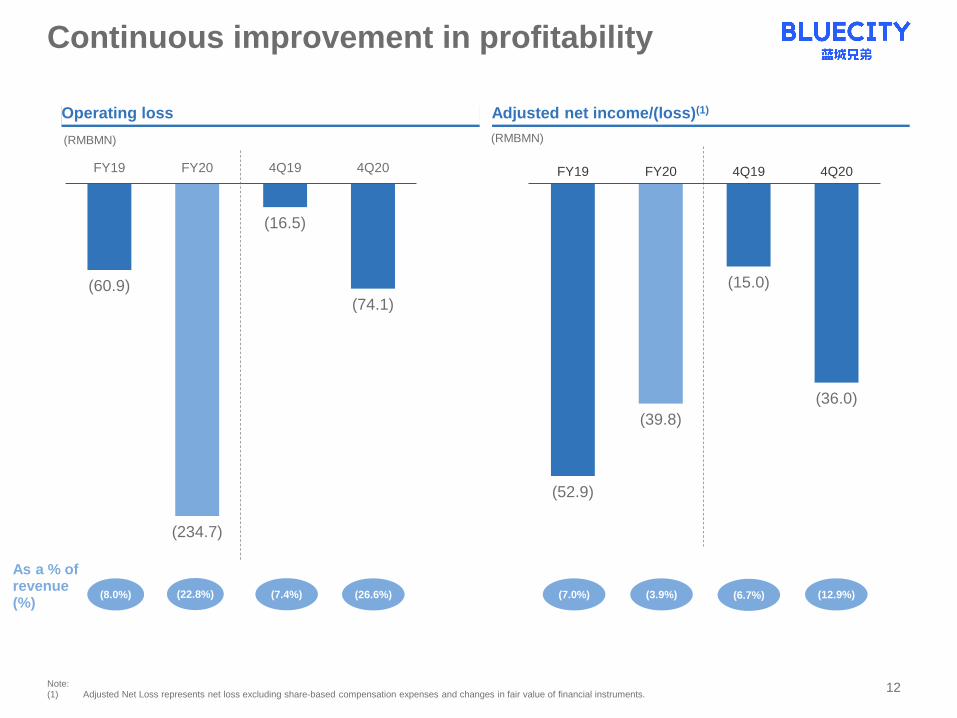
(60.9)
(234.7)
(16.5)
(74.1)
FY19 FY20 4Q19 4Q20
Adjusted net income/(loss)(1)Operating loss
Note:(1) Adjusted Net Loss represents net loss excluding share-based compensation expenses and changes in fair value of financial instruments.
(8.0%) (22.8%)
As a % of revenue(%)
(7.0%) (3.9%)(7.4%) (26.6%) (6.7%) (12.9%)
(RMBMN) (RMBMN)
12
Continuous improvement in profitability
(52.9)
(39.8)
(15.0)
(36.0)
FY19 FY20 4Q19 4Q20
Operating Income($M)
13
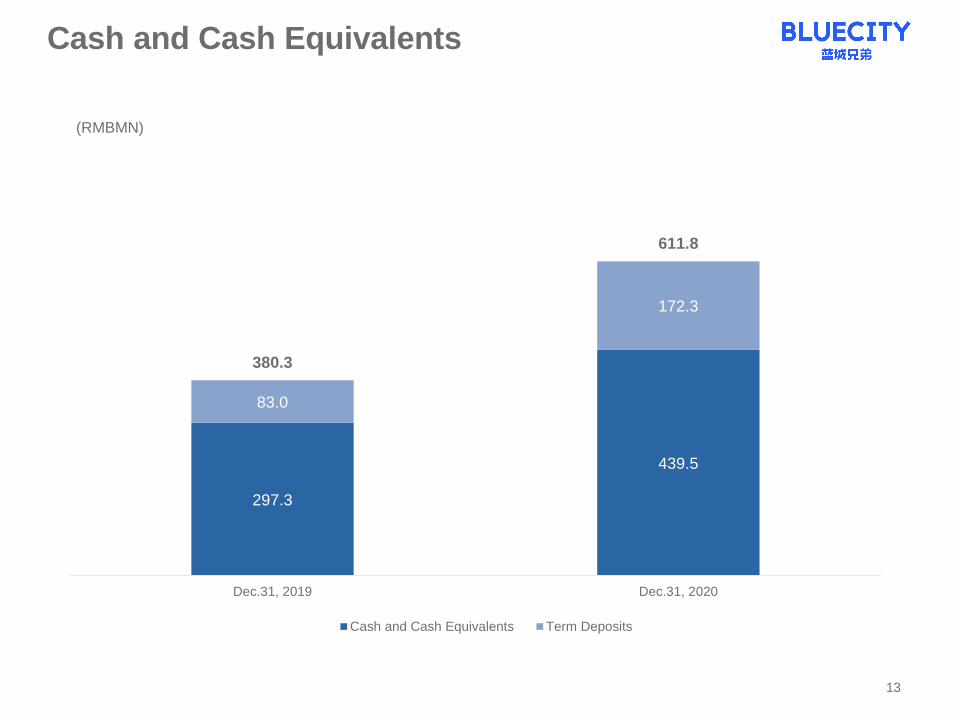
Cash and Cash Equivalents
297.3
439.5
83.0
172.3
380.3
611.8
Dec.31, 2019 Dec.31, 2020
Cash and Cash Equivalents Term Deposits
(RMBMN)
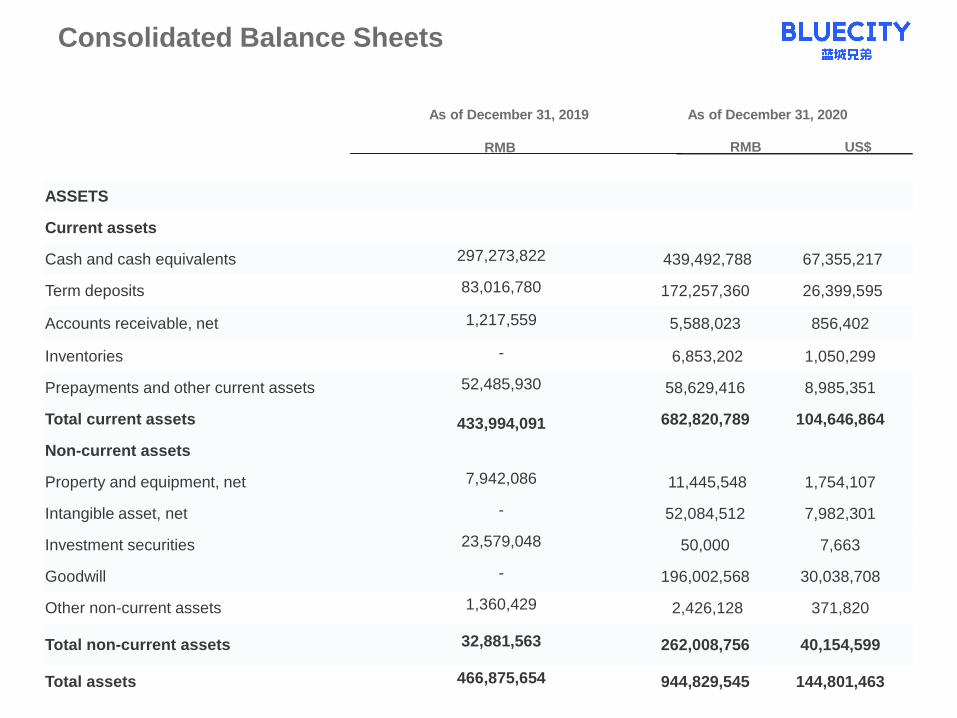
Consolidated Balance Sheets
ASSETS
Current assets
Cash and cash equivalents 297,273,822 439,492,788 67,355,217
Term deposits 83,016,780 172,257,360 26,399,595
Accounts receivable, net 1,217,559 5,588,023 856,402
Inventories - 6,853,202 1,050,299
Prepayments and other current assets 52,485,930 58,629,416 8,985,351
Total current assets 433,994,091 682,820,789 104,646,864
Non-current assets
Property and equipment, net 7,942,086 11,445,548 1,754,107
Intangible asset, net - 52,084,512 7,982,301
Investment securities 23,579,048 50,000 7,663
Goodwill - 196,002,568 30,038,708
Other non-current assets 1,360,429 2,426,128 371,820
Total non-current assets 32,881,563 262,008,756 40,154,599
Total assets 466,875,654 944,829,545 144,801,463
RMB
As of December 31, 2019 As of December 31, 2020
RMB US$
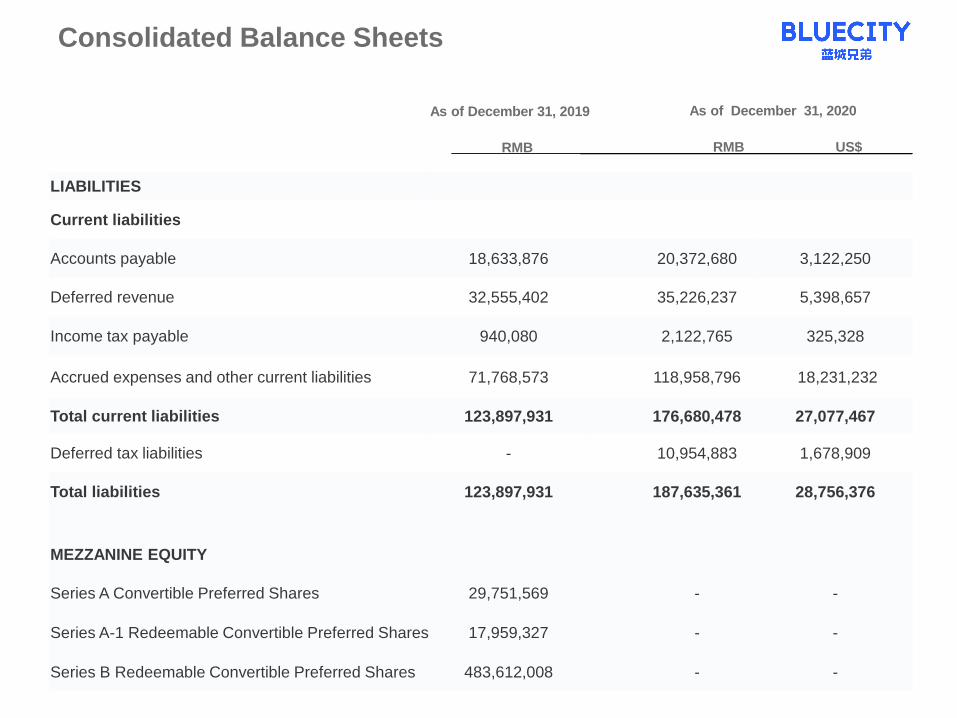
Consolidated Balance Sheets
LIABILITIES
Current liabilities
Accounts payable 18,633,876 20,372,680 3,122,250
Deferred revenue 32,555,402 35,226,237 5,398,657
Income tax payable 940,080 2,122,765 325,328
Accrued expenses and other current liabilities 71,768,573 118,958,796 18,231,232
Total current liabilities 123,897,931 176,680,478 27,077,467
Deferred tax liabilities - 10,954,883 1,678,909
Total liabilities 123,897,931 187,635,361 28,756,376
MEZZANINE EQUITY
Series A Convertible Preferred Shares 29,751,569 - -
Series A-1 Redeemable Convertible Preferred Shares 17,959,327 - -
Series B Redeemable Convertible Preferred Shares 483,612,008 - -
RMB
As of December 31, 2019 As of December 31, 2020
RMB US$
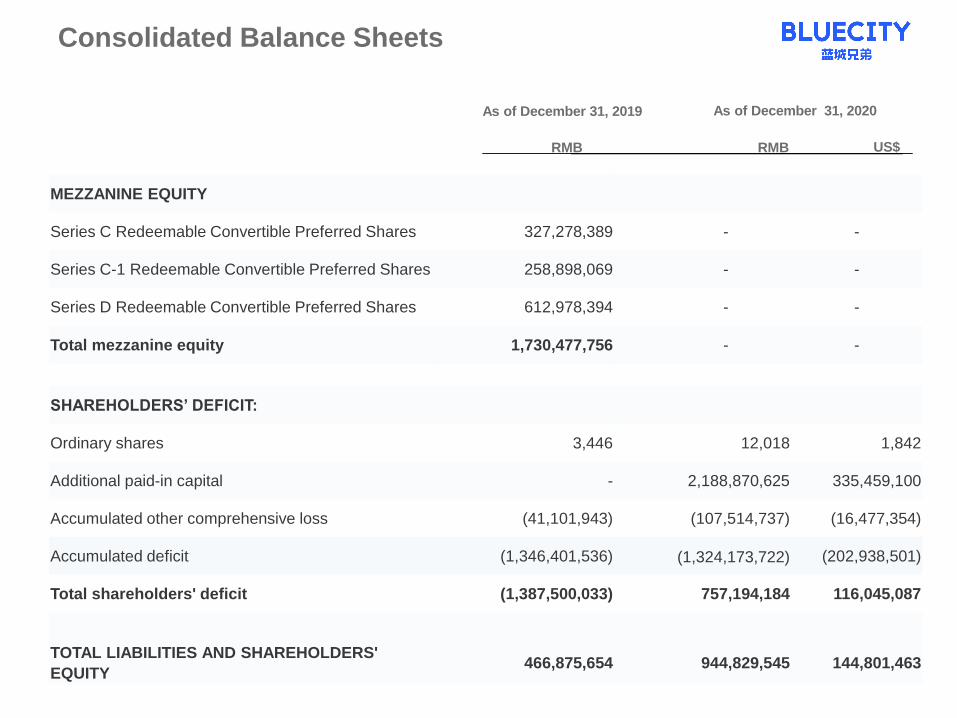
Consolidated Balance Sheets
MEZZANINE EQUITY
Series C Redeemable Convertible Preferred Shares 327,278,389 - -
Series C-1 Redeemable Convertible Preferred Shares 258,898,069 - -
Series D Redeemable Convertible Preferred Shares 612,978,394 - -
Total mezzanine equity 1,730,477,756 - -
SHAREHOLDERS’ DEFICIT:
Ordinary shares 3,446 12,018 1,842
Additional paid-in capital - 2,188,870,625 335,459,100
Accumulated other comprehensive loss (41,101,943) (107,514,737) (16,477,354)
Accumulated deficit (1,346,401,536) (1,324,173,722) (202,938,501)
Total shareholders' deficit (1,387,500,033) 757,194,184 116,045,087
TOTAL LIABILITIES AND SHAREHOLDERS'
EQUITY466,875,654 944,829,545 144,801,463
RMB
As of December 31, 2019 As of December 31, 2020
RMB US$
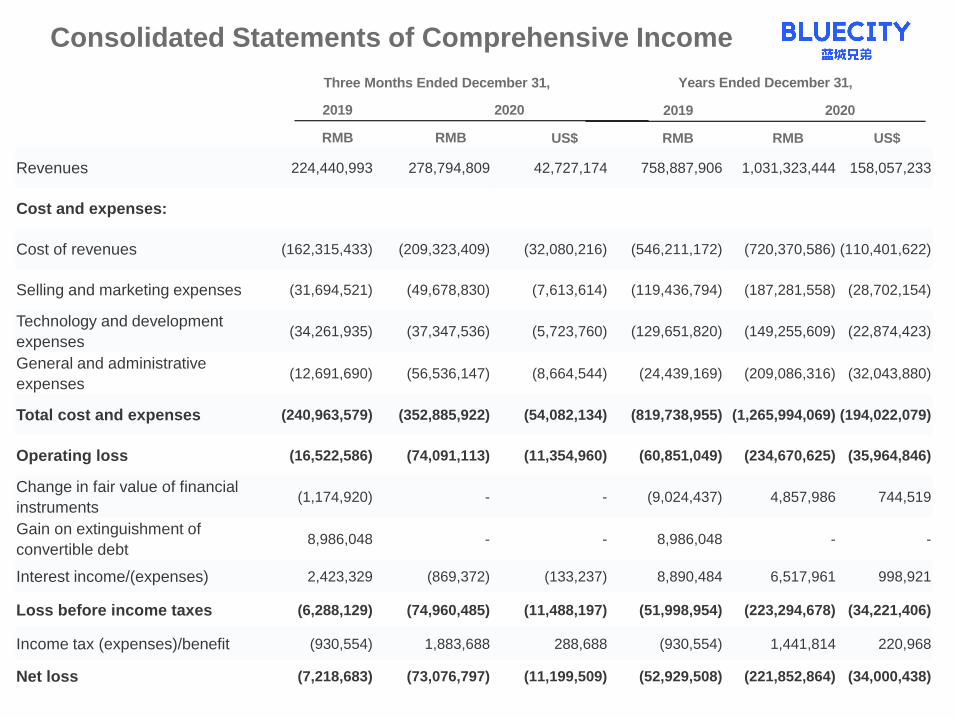
Consolidated Statements of Comprehensive Income
Revenues 224,440,993 278,794,809 42,727,174 758,887,906 1,031,323,444 158,057,233
Cost and expenses:
Cost of revenues (162,315,433) (209,323,409) (32,080,216) (546,211,172) (720,370,586) (110,401,622)
Selling and marketing expenses (31,694,521) (49,678,830) (7,613,614) (119,436,794) (187,281,558) (28,702,154)
Technology and development
expenses(34,261,935) (37,347,536) (5,723,760) (129,651,820) (149,255,609) (22,874,423)
General and administrative
expenses(12,691,690) (56,536,147) (8,664,544) (24,439,169) (209,086,316) (32,043,880)
Total cost and expenses (240,963,579) (352,885,922) (54,082,134) (819,738,955) (1,265,994,069) (194,022,079)
Operating loss (16,522,586) (74,091,113) (11,354,960) (60,851,049) (234,670,625) (35,964,846)
Change in fair value of financial
instruments(1,174,920) - - (9,024,437) 4,857,986 744,519
Gain on extinguishment of
convertible debt8,986,048 - - 8,986,048 - -
Interest income/(expenses) 2,423,329 (869,372) (133,237) 8,890,484 6,517,961 998,921
Loss before income taxes (6,288,129) (74,960,485) (11,488,197) (51,998,954) (223,294,678) (34,221,406)
Income tax (expenses)/benefit (930,554) 1,883,688 288,688 (930,554) 1,441,814 220,968
Net loss (7,218,683) (73,076,797) (11,199,509) (52,929,508) (221,852,864) (34,000,438)
2019 2020
Three Months Ended December 31,
RMB RMB US$
2019
Years Ended December 31,
RMB RMB US$
2020
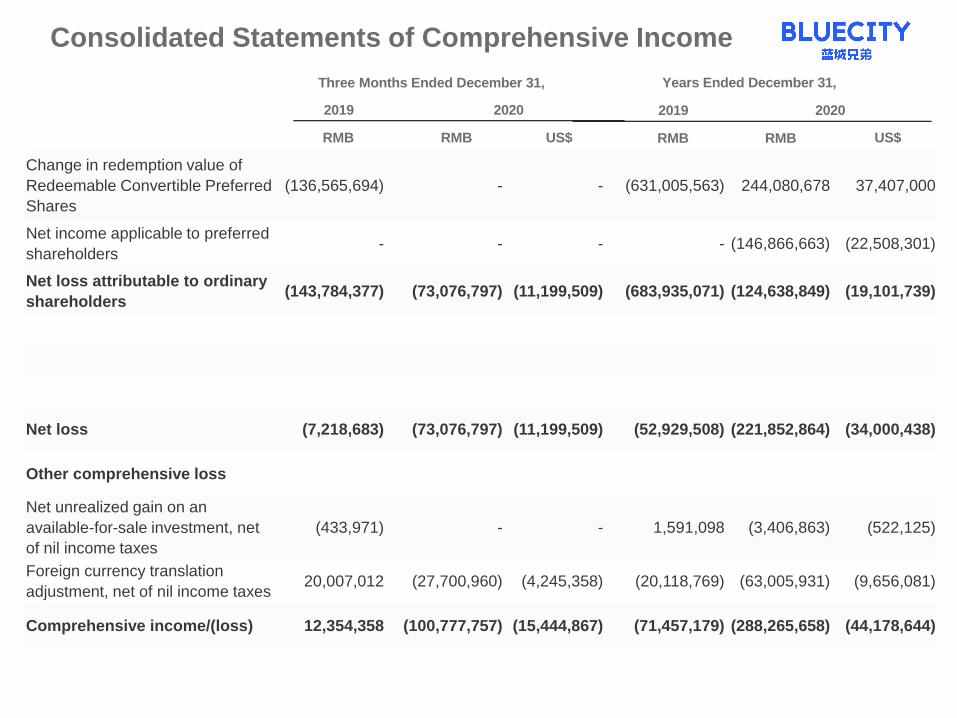
Consolidated Statements of Comprehensive Income
Change in redemption value of
Redeemable Convertible Preferred
Shares
(136,565,694) - - (631,005,563) 244,080,678 37,407,000
Net income applicable to preferred
shareholders - - - - (146,866,663) (22,508,301)
Net loss attributable to ordinary
shareholders(143,784,377) (73,076,797) (11,199,509) (683,935,071) (124,638,849) (19,101,739)
Net loss (7,218,683) (73,076,797) (11,199,509) (52,929,508) (221,852,864) (34,000,438)
Other comprehensive loss
Net unrealized gain on an
available-for-sale investment, net
of nil income taxes
(433,971) - - 1,591,098 (3,406,863) (522,125)
Foreign currency translation
adjustment, net of nil income taxes20,007,012 (27,700,960) (4,245,358) (20,118,769) (63,005,931) (9,656,081)
Comprehensive income/(loss) 12,354,358 (100,777,757) (15,444,867) (71,457,179) (288,265,658) (44,178,644)
2019 2020
Three Months Ended December 31,
RMB RMB US$
2019
Years Ended December 31,
RMB RMB US$
2020
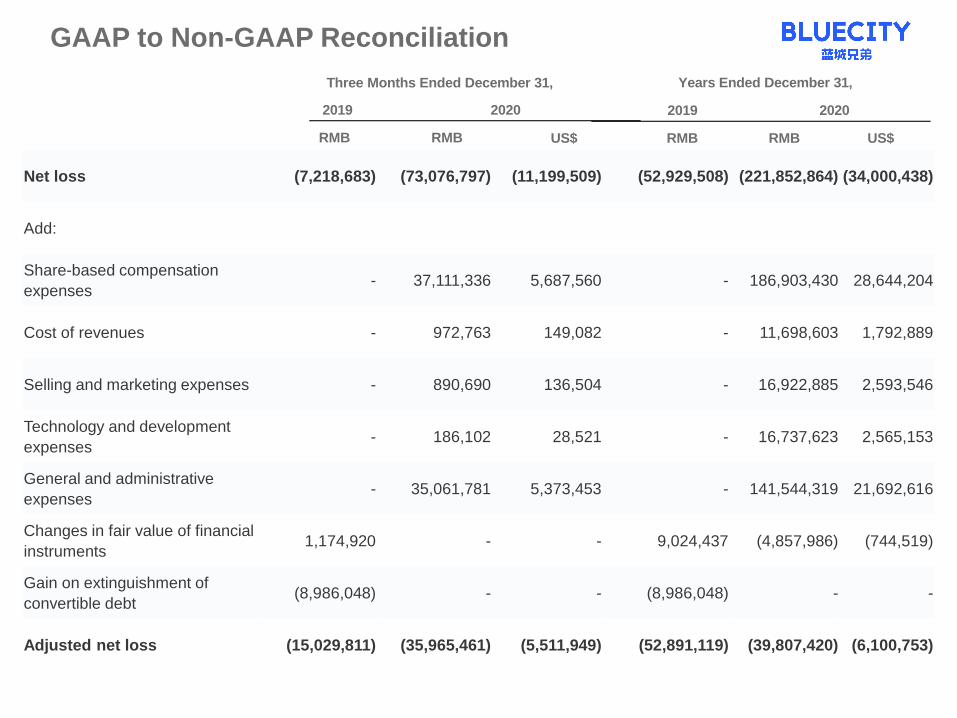
GAAP to Non-GAAP Reconciliation
Net loss (7,218,683) (73,076,797) (11,199,509) (52,929,508) (221,852,864) (34,000,438)
Add:
Share-based compensation
expenses- 37,111,336 5,687,560 - 186,903,430 28,644,204
Cost of revenues - 972,763 149,082 - 11,698,603 1,792,889
Selling and marketing expenses - 890,690 136,504 - 16,922,885 2,593,546
Technology and development
expenses- 186,102 28,521 - 16,737,623 2,565,153
General and administrative
expenses- 35,061,781 5,373,453 - 141,544,319 21,692,616
Changes in fair value of financial
instruments1,174,920 - - 9,024,437 (4,857,986) (744,519)
Gain on extinguishment of
convertible debt(8,986,048) - - (8,986,048) - -
Adjusted net loss (15,029,811) (35,965,461) (5,511,949) (52,891,119) (39,807,420) (6,100,753)
2019 2020
Three Months Ended December 31,
RMB RMB US$
2019
Years Ended December 31,
RMB RMB US$
2020