URBAN AGE ISTANBUL CONFERENCE
NOVEMBER 2009
Geetam Tiwari
Indian Institute of Technology
New Green Transport Infrastructure in Delhi
All rights are reserved by the presenter
www.urban-age.net
Geetam Tiwari
Transportation Research and Injury Prevention Program (TRIPP)/ Civil Engineering Department
Indian Institute of Technology (IIT) New Delhi, India
NEW GREEN TRANSPORT INFRASTRUCTURE DELHI TRANSIT
1996-2008
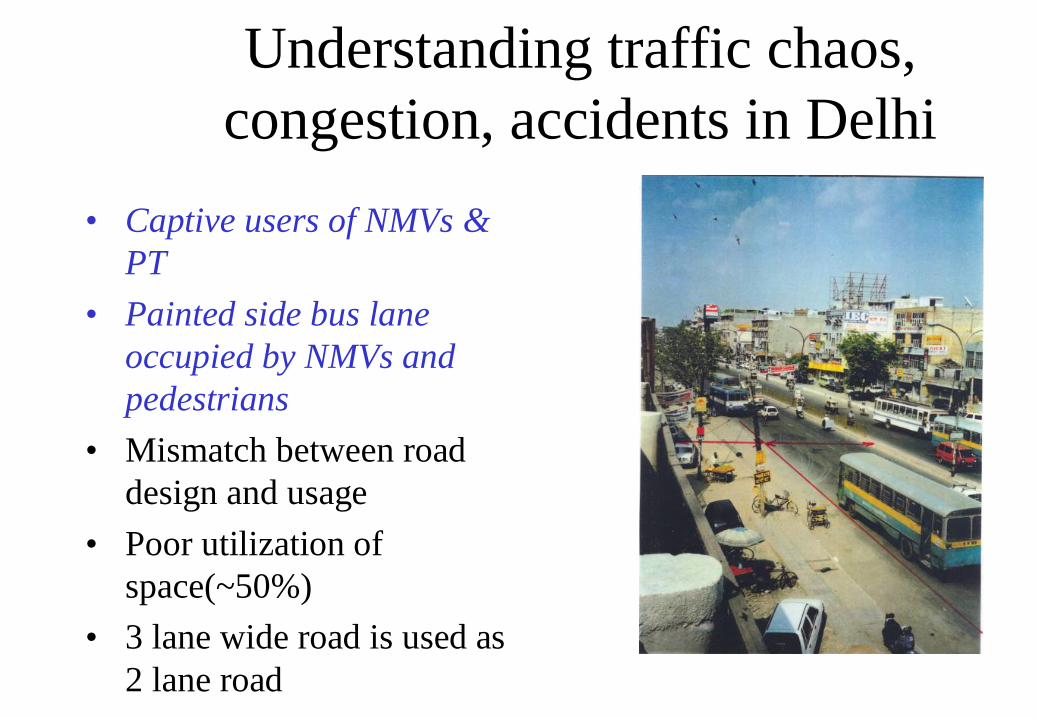
Understanding traffic chaos, congestion, accidents in Delhi
• Captive users of NMVs & PT
• Painted side bus lane occupied by NMVs and pedestrians
• Mismatch between road design and usage
• Poor utilization of space(~50%)
• 3 lane wide road is used as 2 lane road
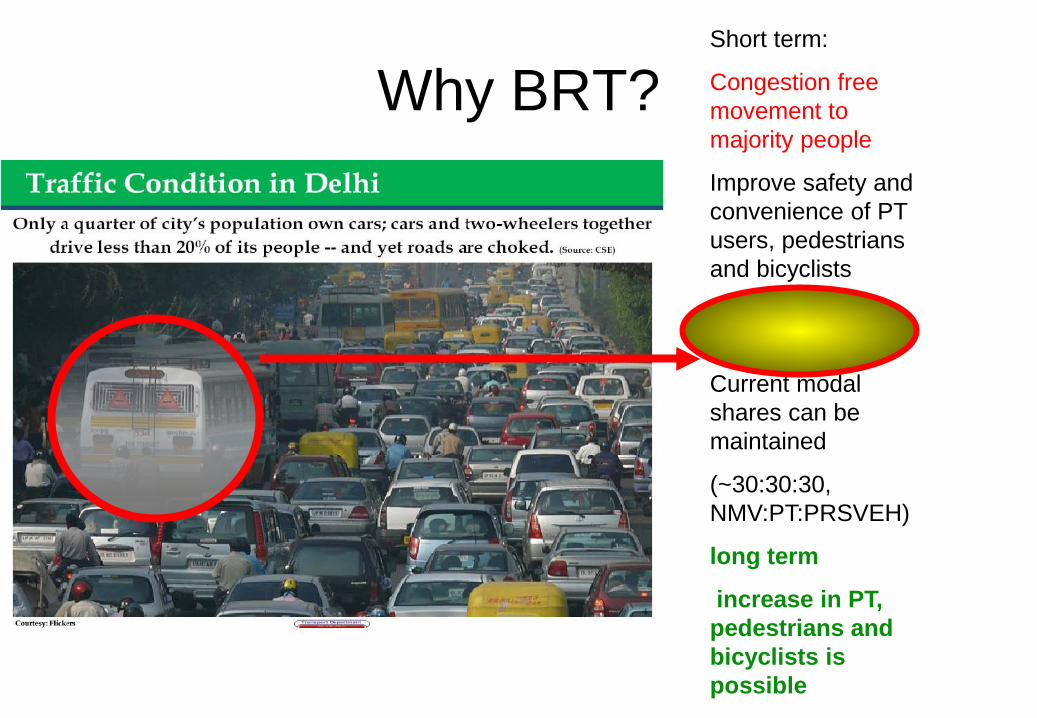
Why BRT?
Short term:
Congestion free movement to majority people
Improve safety and convenience of PT users, pedestrians and bicyclists
Move out buses from congestion
Current modal shares can be maintained
(~30:30:30, NMV:PT:PRSVEH)
long term
increase in PT, pedestrians and bicyclists is possible
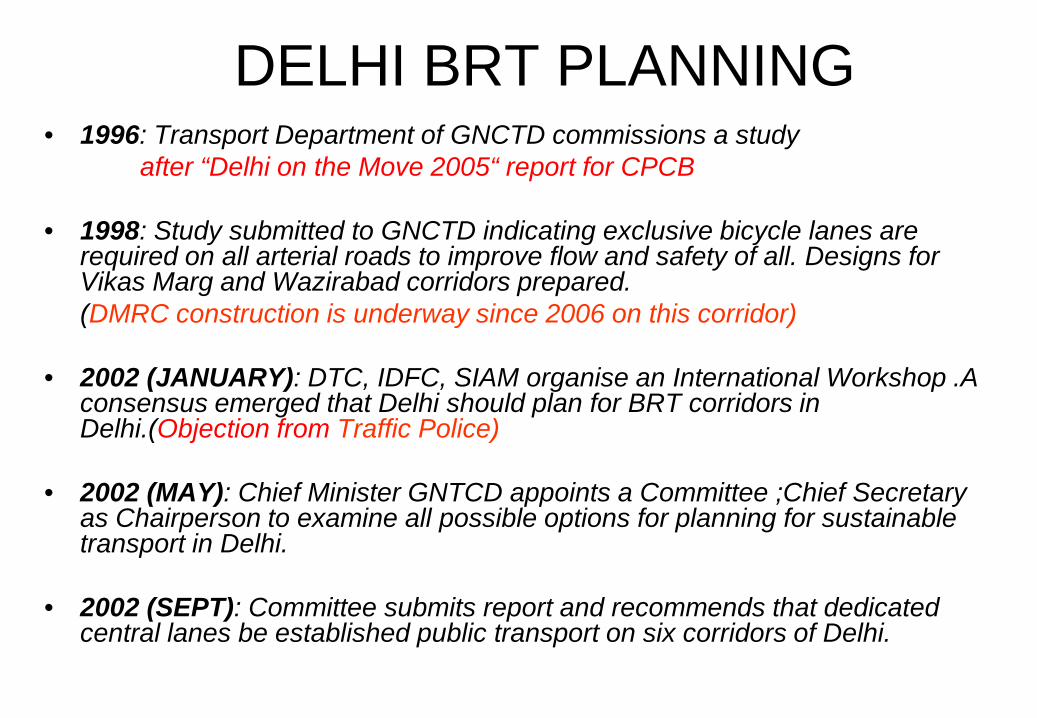
DELHI BRT PLANNING • 1996: Transport Department of GNCTD commissions a study after “Delhi on the Move 2005“ report for CPCB
• 1998: Study submitted to GNCTD indicating exclusive bicycle lanes are
required on all arterial roads to improve flow and safety of all. Designs for Vikas Marg and Wazirabad corridors prepared.
(DMRC construction is underway since 2006 on this corridor)
• 2002 (JANUARY): DTC, IDFC, SIAM organise an International Workshop .A consensus emerged that Delhi should plan for BRT corridors in Delhi.(Objection from Traffic Police)
• 2002 (MAY): Chief Minister GNTCD appoints a Committee ;Chief Secretary as Chairperson to examine all possible options for planning for sustainable transport in Delhi.
• 2002 (SEPT): Committee submits report and recommends that dedicated central lanes be established public transport on six corridors of Delhi.
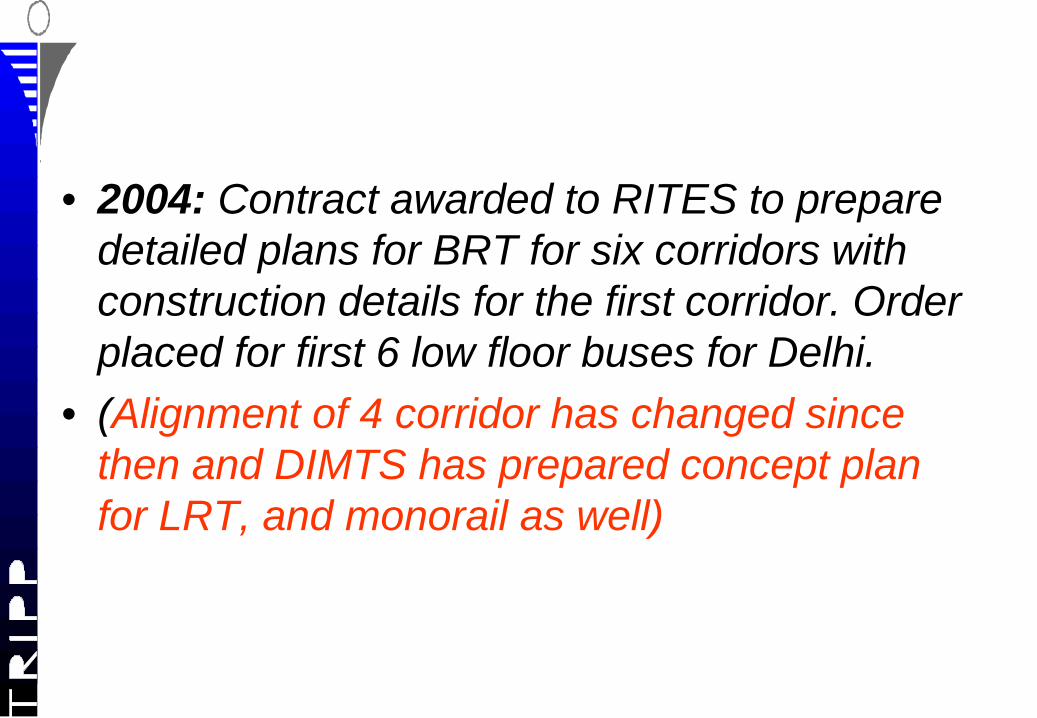
• 2004: Contract awarded to RITES to prepare detailed plans for BRT for six corridors with construction details for the first corridor. Order placed for first 6 low floor buses for Delhi.
• (Alignment of 4 corridor has changed since then and DIMTS has prepared concept plan for LRT, and monorail as well)
• 2005: Transport Department (GNCTD) organises an international workshop to examine design details for the first corridor. The national and international experts review the details and examine the corridor and their suggestions are incorporated in the designs.
• 2006: GNTCD establishes Delhi Integrated Multi-Modal Transit System (DIMTS), a Special Purpose Vehicle to oversee the establishment of public transport systems in Delhi.
• 2006 (Oct): Construction of the first corridor starts.
• 2006-2007: All details of the project examined by EPCA in several meetings with all stakeholders and suggestions incorporated.
• 6 km corridor operating since April 2008
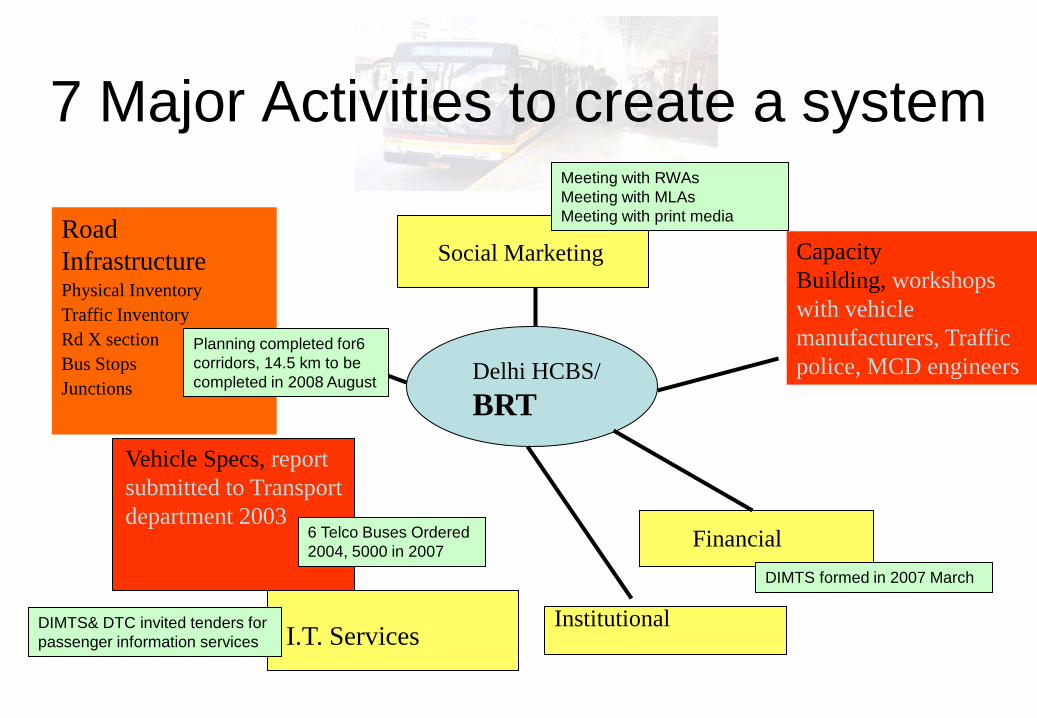
7 Major Activities to create a system
Delhi HCBS/ BRT
Road Infrastructure Physical Inventory Traffic Inventory Rd X section Bus Stops Junctions
Vehicle Specs, report submitted to Transport department 2003
I.T. Services Institutional
Financial
Social Marketing Capacity Building, workshops with vehicle manufacturers, Traffic police, MCD engineers
Planning completed for6 corridors, 14.5 km to be completed in 2008 August
6 Telco Buses Ordered 2004, 5000 in 2007
DIMTS formed in 2007 March
DIMTS& DTC invited tenders for passenger information services
Meeting with RWAs Meeting with MLAs Meeting with print media
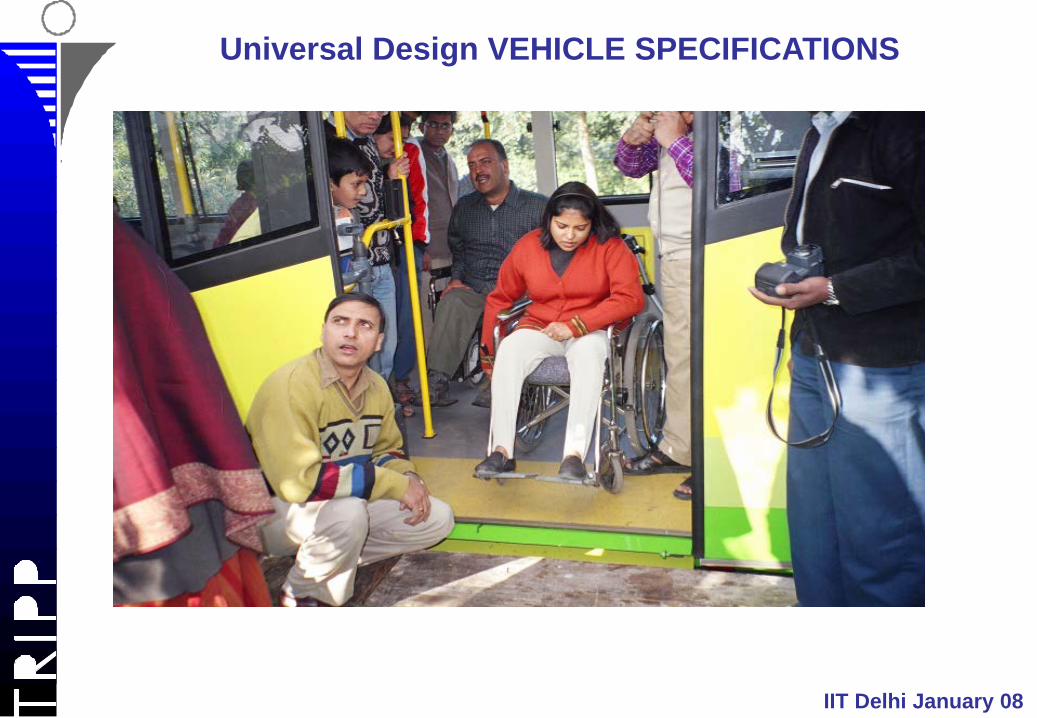
Universal Design VEHICLE SPECIFICATIONS
IIT Delhi January 08
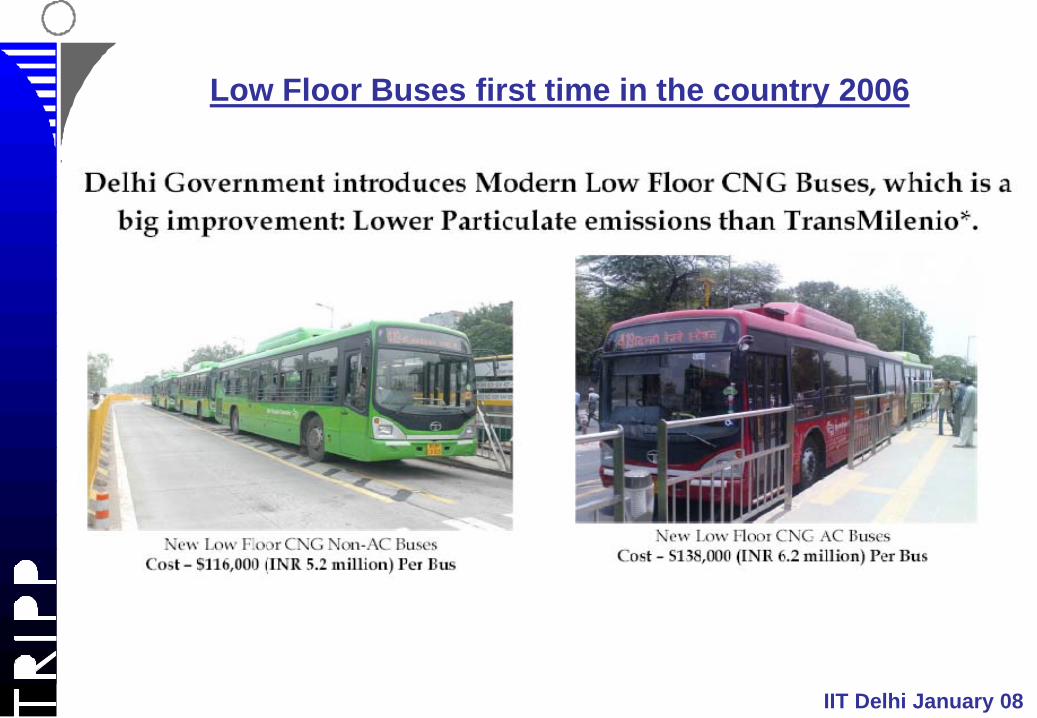
Low Floor Buses first time in the country 2006
IIT Delhi January 08
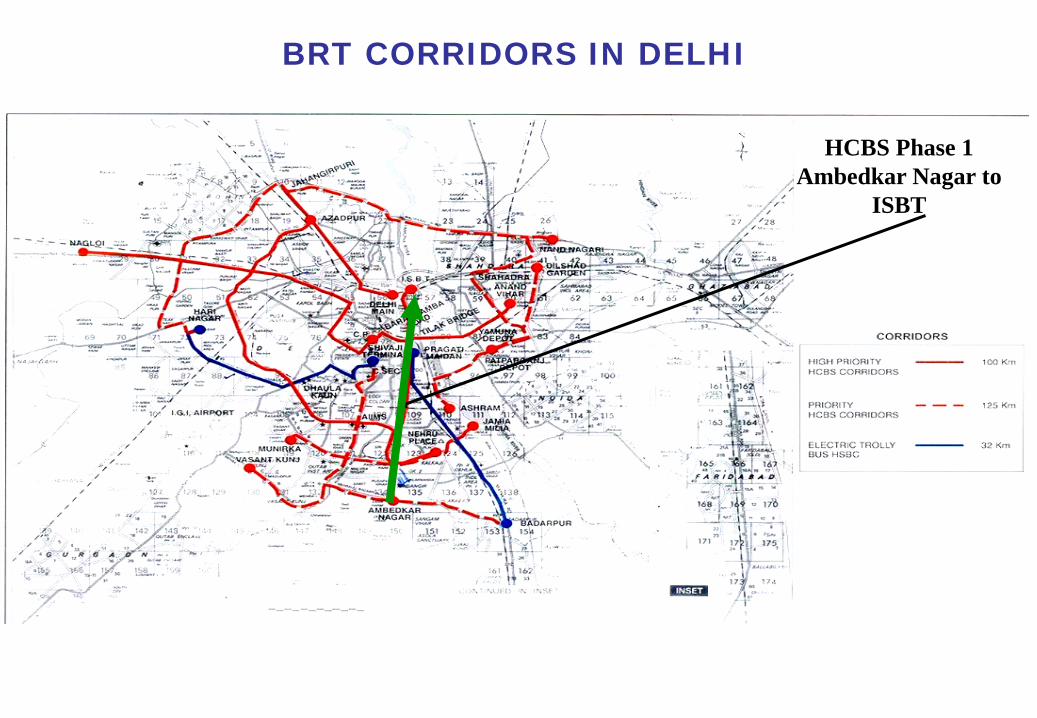
BRT CORRIDORS IN DELHI
HCBS Phase 1 Ambedkar Nagar to
ISBT
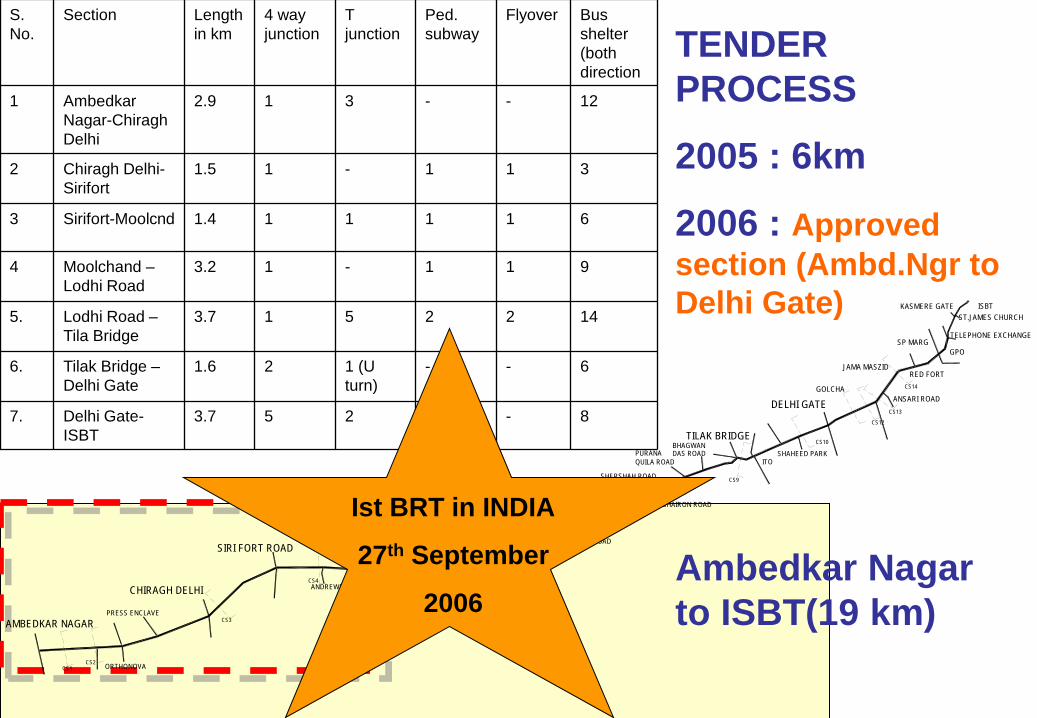
S. No.
Section Length in km
4 way junction
T junction
Ped. subway
Flyover Bus shelter
(both direction
1 Ambedkar Nagar-Chiragh Delhi
2.9 1 3 - - 12
2 Chiragh Delhi-Sirifort
1.5 1 - 1 1 3
3 Sirifort-Moolcnd 1.4 1 1 1 1 6
4 Moolchand – Lodhi Road
3.2 1 - 1 1 9
5. Lodhi Road – Tila Bridge
3.7 1 5 2 2 14
6. Tilak Bridge – Delhi Gate
1.6 2 1 (U turn)
- - 6
7. Delhi Gate-ISBT
3.7 5 2 2 - 8
TENDER PROCESS
2005 : 6km
2006 : Approved section (Ambd.Ngr to Delhi Gate)
Ambedkar Nagar to ISBT(19 km)
AMBEDKAR NAGAR
CHIRAGH DELHI
ORTHONOVA
PRESS ENCLAVE
SIRI FORT ROAD MOOLCHAND
LODHI ROAD
TILAK BRIDGE
DELHI GATE
SHAHEED PARKITO
BHAIRON ROAD
PURANABHAGWAN
SHERSHAH ROAD
ANDREWS GANJ LAJPAT NAGAR
DEFENCE COLONYJANGPURA
BHARTI MARGSUBRAMANYAM
MATHURA ROAD
DAS ROADQUILA ROAD
CS1CS2
CS3
CS4 CS5CS6
CS7
CS8
CS9
CS10
JAMA MASZIDRED FORT
ANSARI ROAD
GPOSP MARG
TELEPHONE EXCHANGE
ST.JAMES CHURCHKASMERE GATE ISBT
CS13
CS14
CS12
GOLCHA
Ist BRT in INDIA
27th September
2006
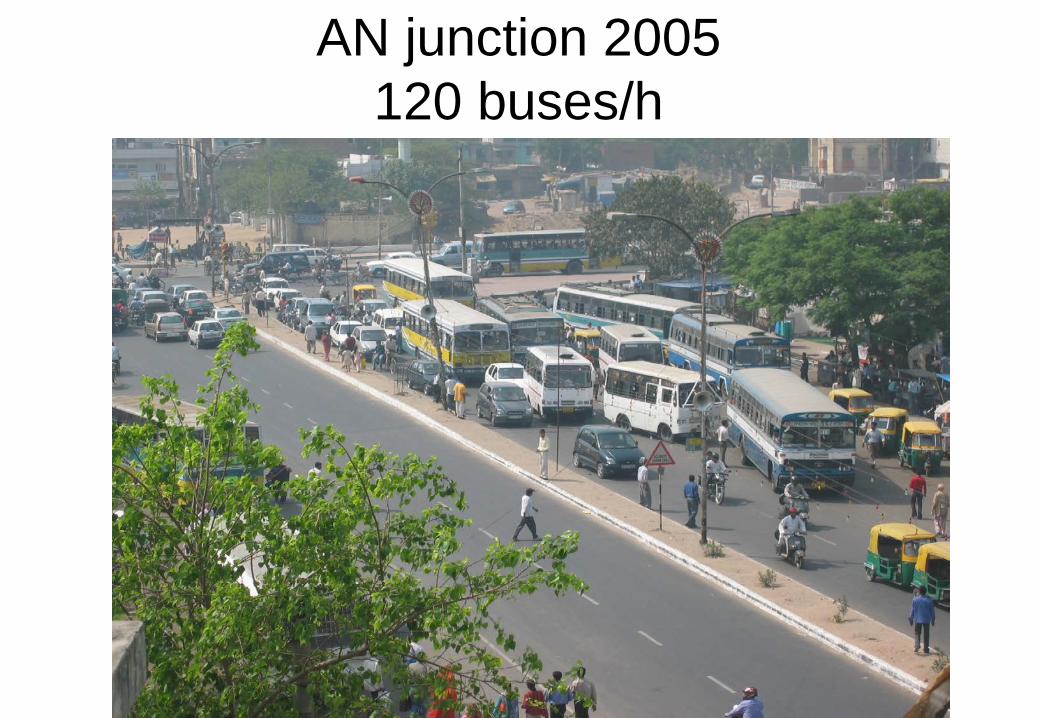
AN junction 2005 120 buses/h

A.N.Junction 2008 2 bus platforms (near side of junction) capacity:TU of 10 vehicles,at
grade crossing
Line capacity: 9000 prs/h Peak demand: 6000 prs/h
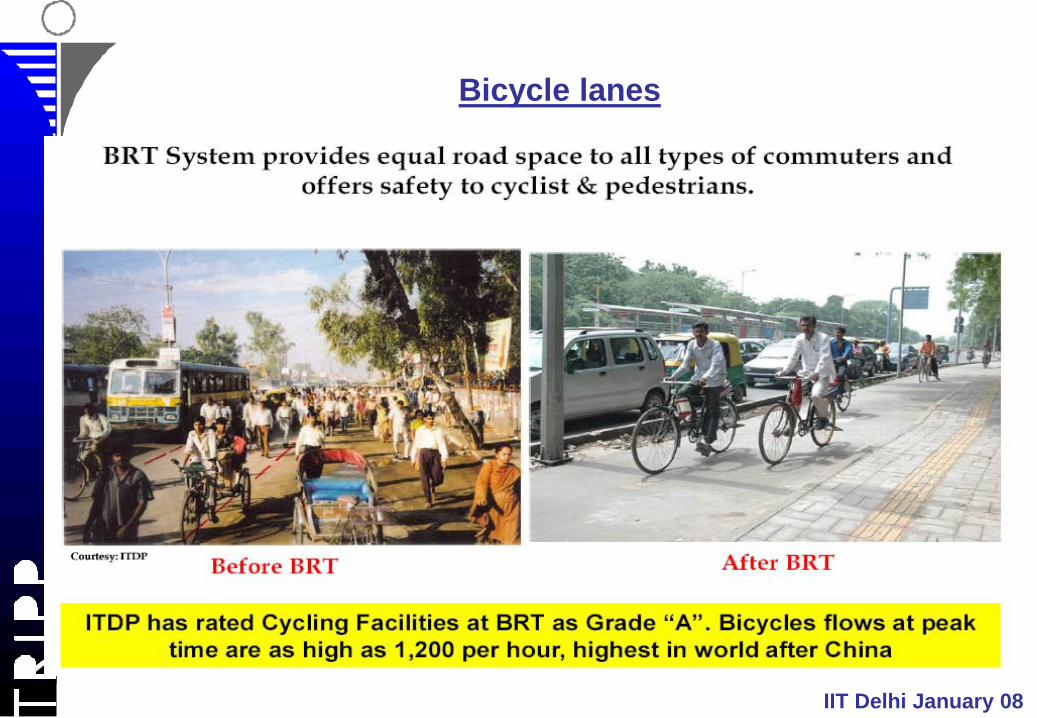
Bicycle lanes
IIT Delhi January 08
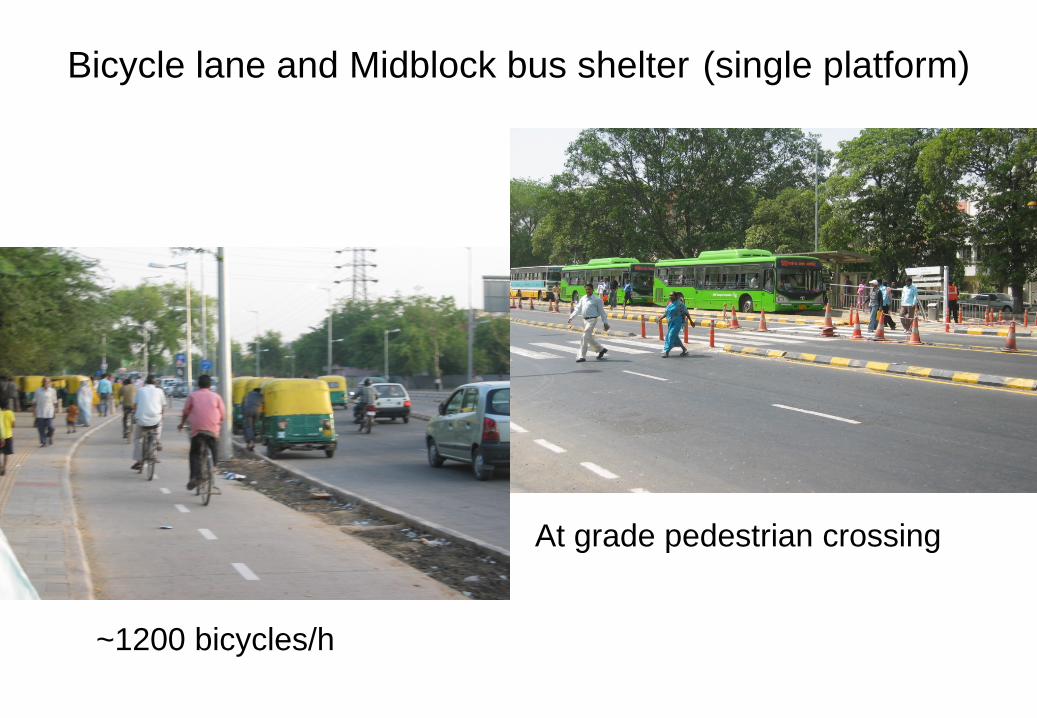
Bicycle lane and Midblock bus shelter (single platform)
~1200 bicycles/h
At grade pedestrian crossing

DETAILED DESIGN FEATURES
WIDE BARRIER FREE PEDESTRIAN INFRASTRUCTURE
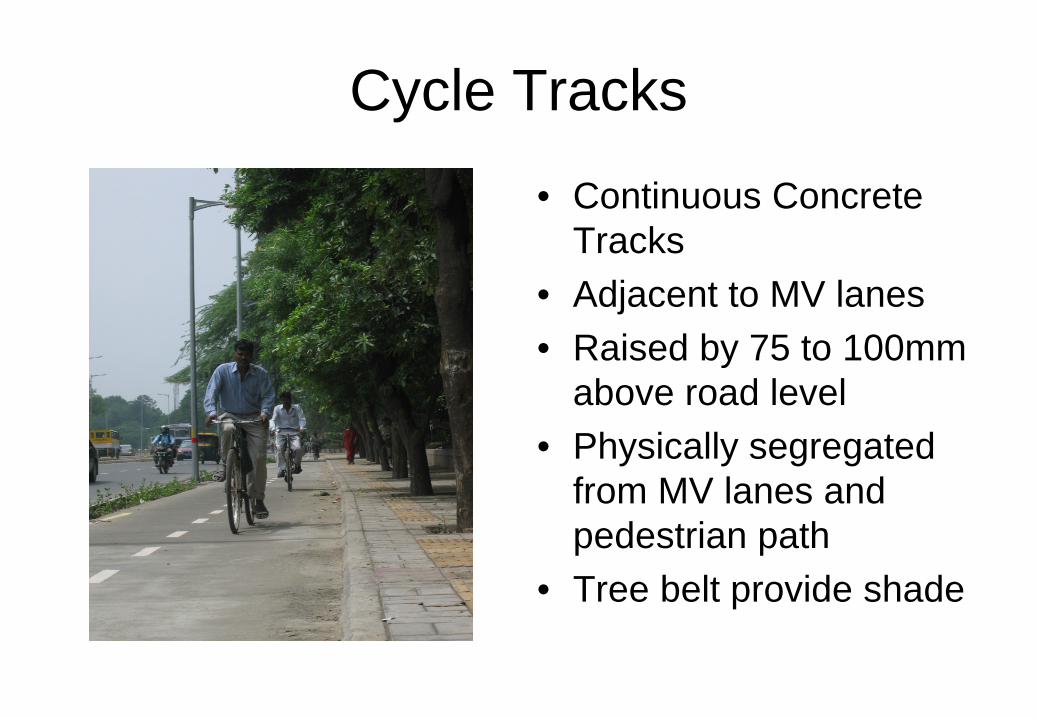
Cycle Tracks
• Continuous Concrete Tracks
• Adjacent to MV lanes • Raised by 75 to 100mm
above road level • Physically segregated
from MV lanes and pedestrian path
• Tree belt provide shade
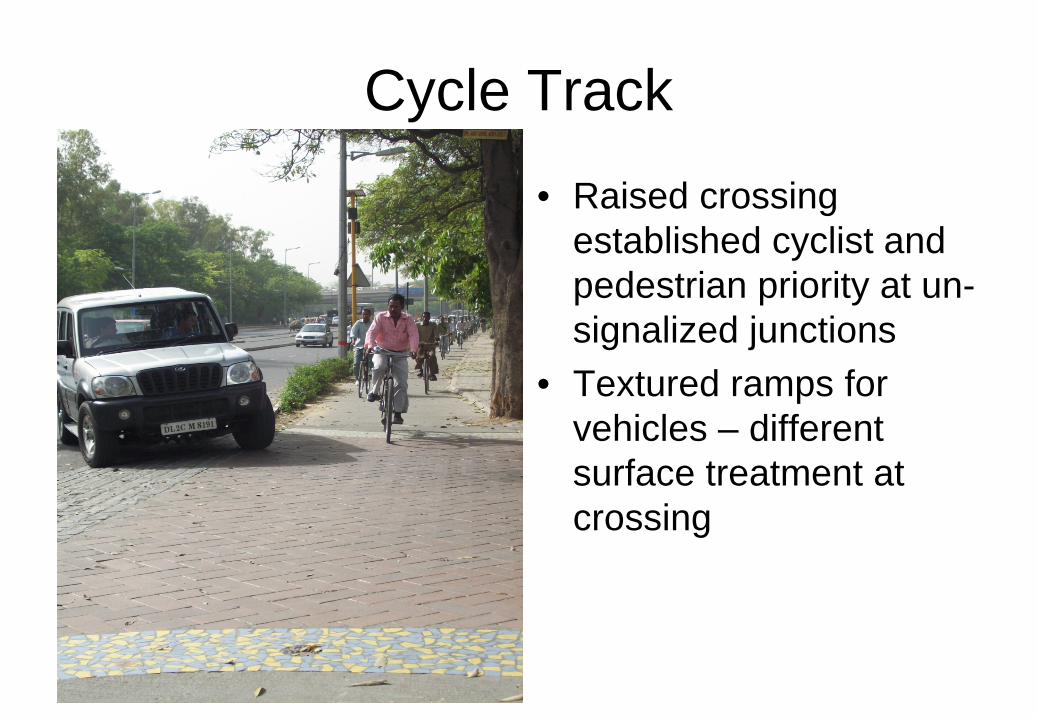
Cycle Track
• Raised crossing established cyclist and pedestrian priority at un-signalized junctions
• Textured ramps for vehicles – different surface treatment at crossing
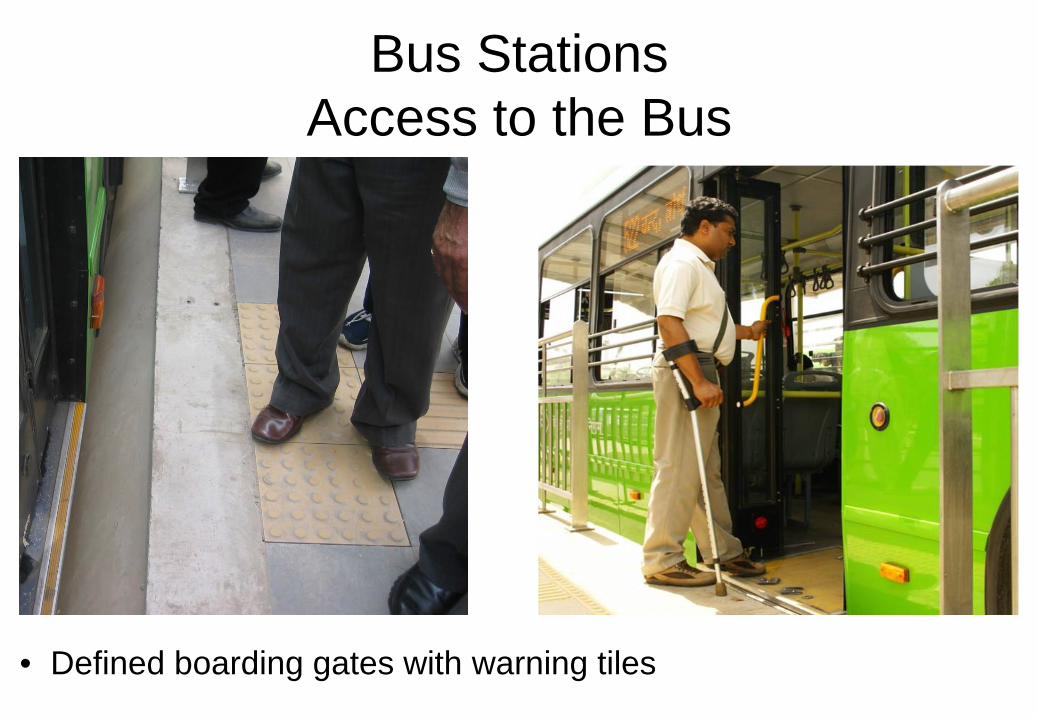
Bus Stations Access to the Bus
• Defined boarding gates with warning tiles
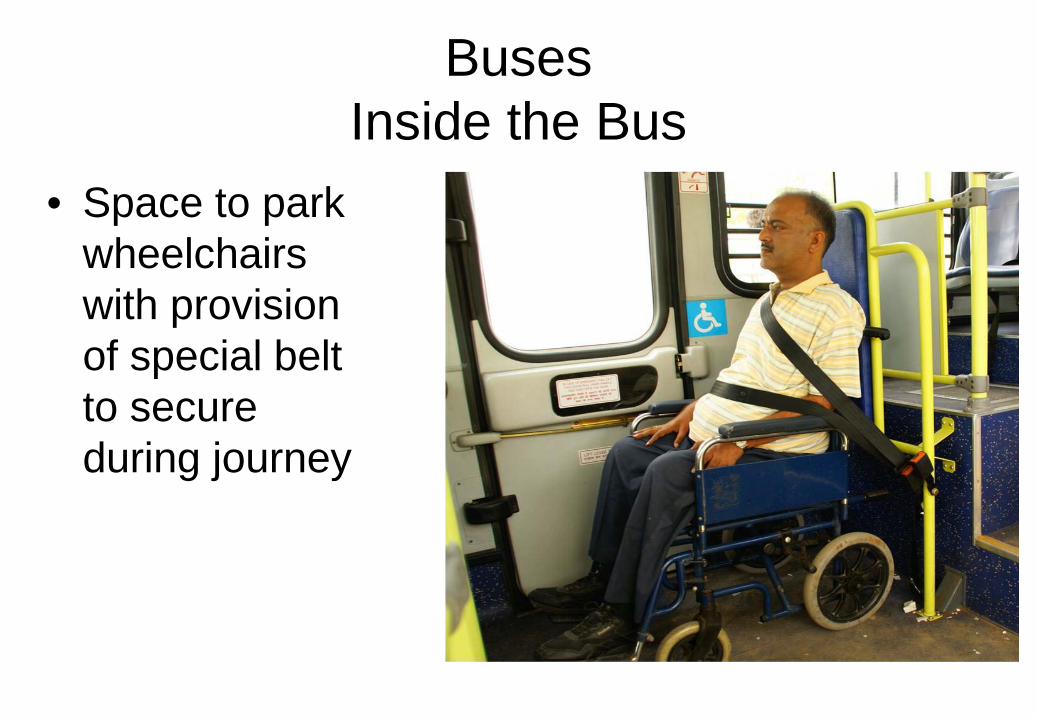
Buses Inside the Bus
• Space to park wheelchairs with provision of special belt to secure during journey
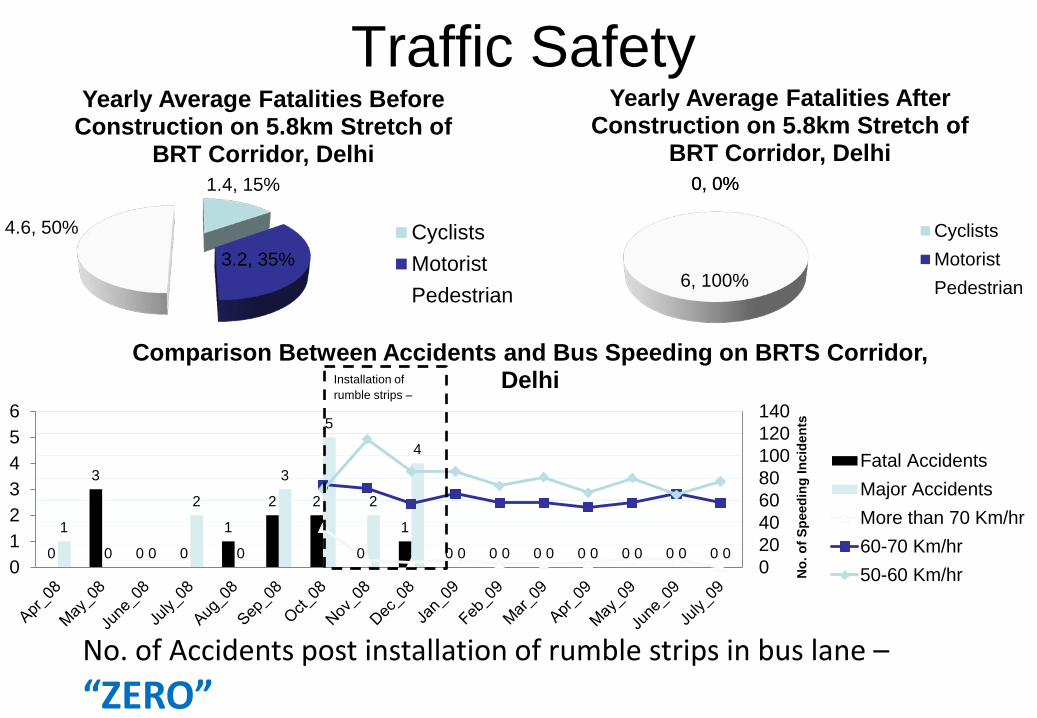
Traffic Safety
1.4, 15%
3.2, 35%
4.6, 50%
Yearly Average Fatalities Before Construction on 5.8km Stretch of
BRT Corridor, Delhi
CyclistsMotoristPedestrian
0, 0% 0, 0%
6, 100%
Yearly Average Fatalities After Construction on 5.8km Stretch of
BRT Corridor, Delhi
CyclistsMotoristPedestrian
No. of Accidents post installation of rumble strips in bus lane – “ZERO”
0
3
0 0
1
2 2
0
1
0 0 0 0 0 0 0
1
0 0
2
0
3
5
2
4
0 0 0 0 0 0 0 0123456
020406080100120140
No.
of S
peed
ing
Inci
dent
s
Comparison Between Accidents and Bus Speeding on BRTS Corridor, Delhi
Fatal AccidentsMajor AccidentsMore than 70 Km/hr60-70 Km/hr50-60 Km/hr
Installation of rumble strips –

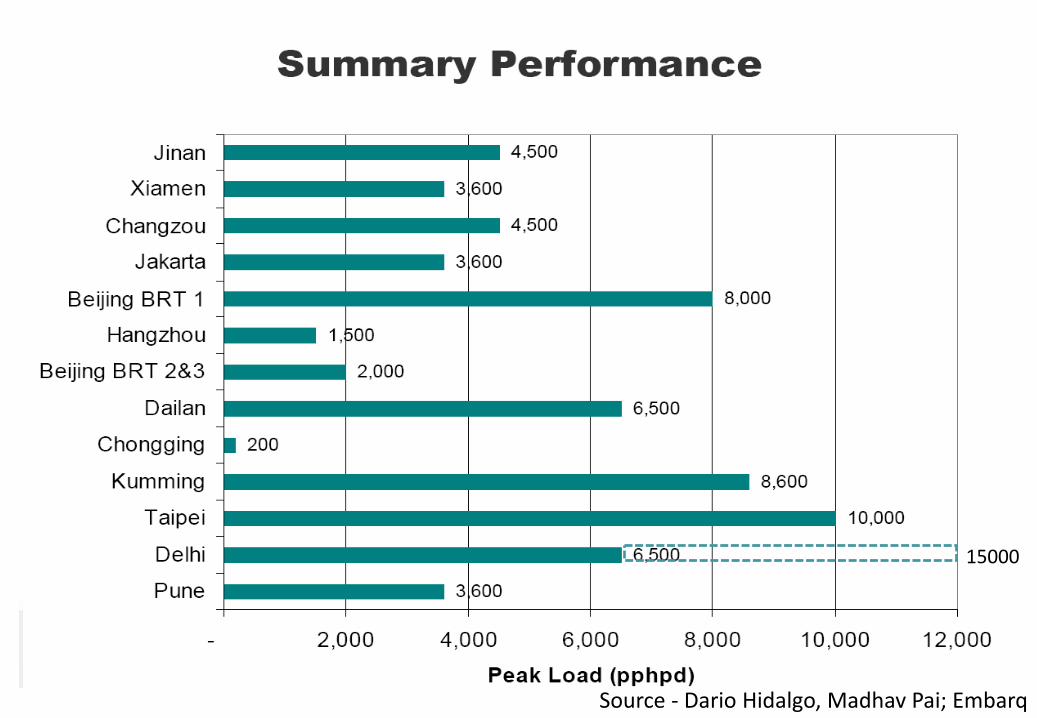
Source - Dario Hidalgo, Madhav Pai; Embarq
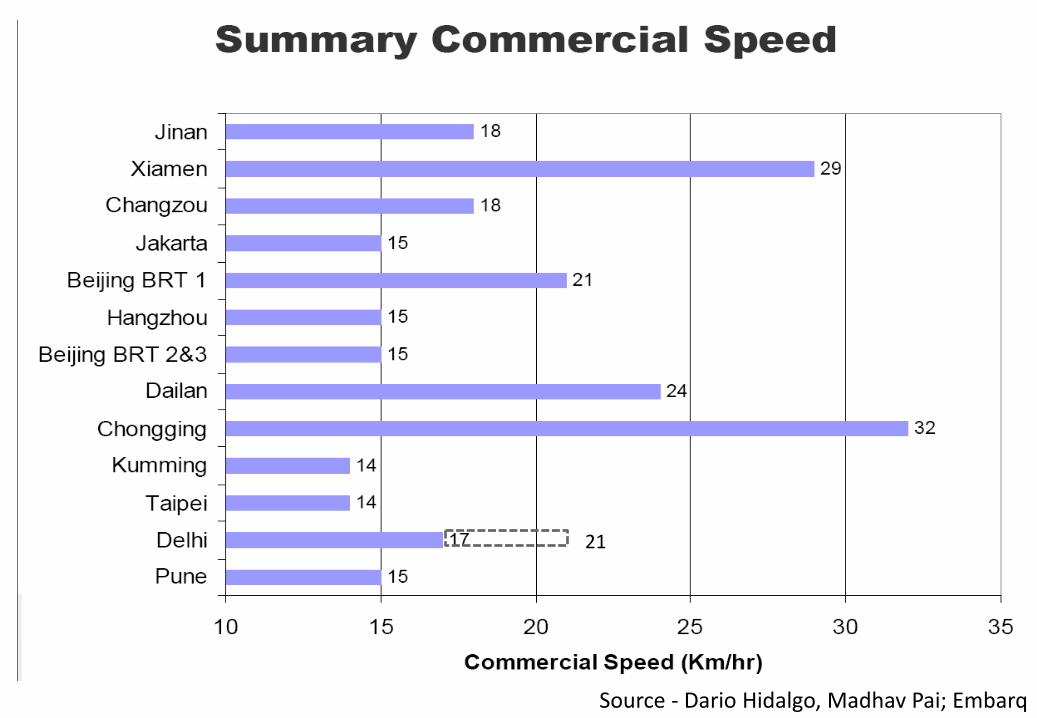
Source - Dario Hidalgo, Madhav Pai; Embarq
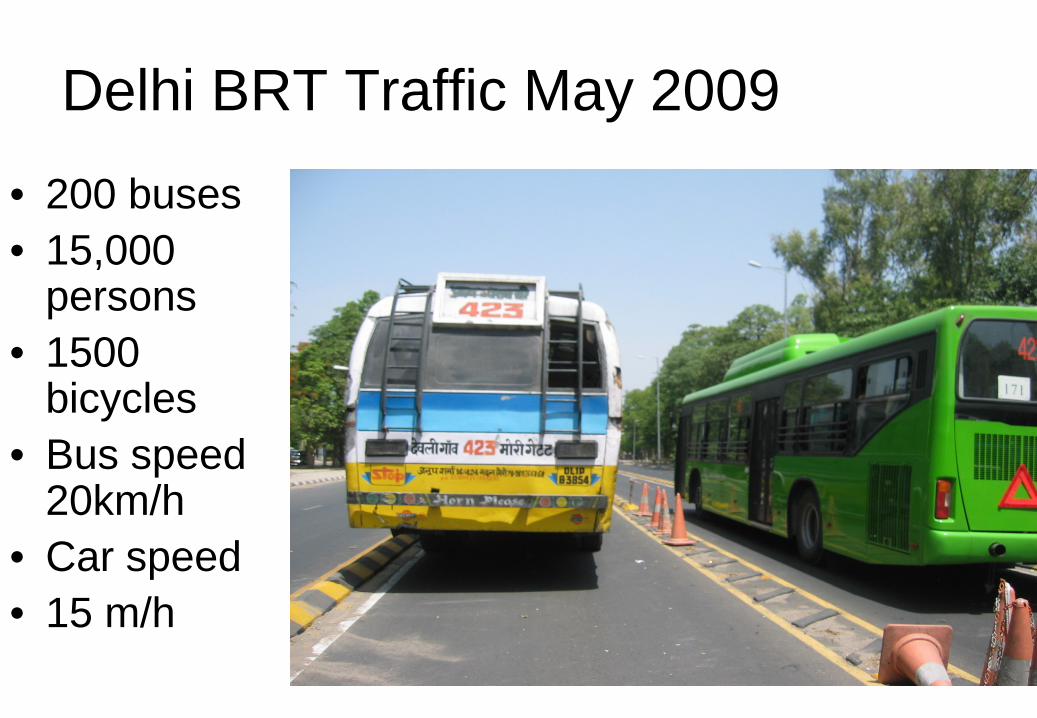
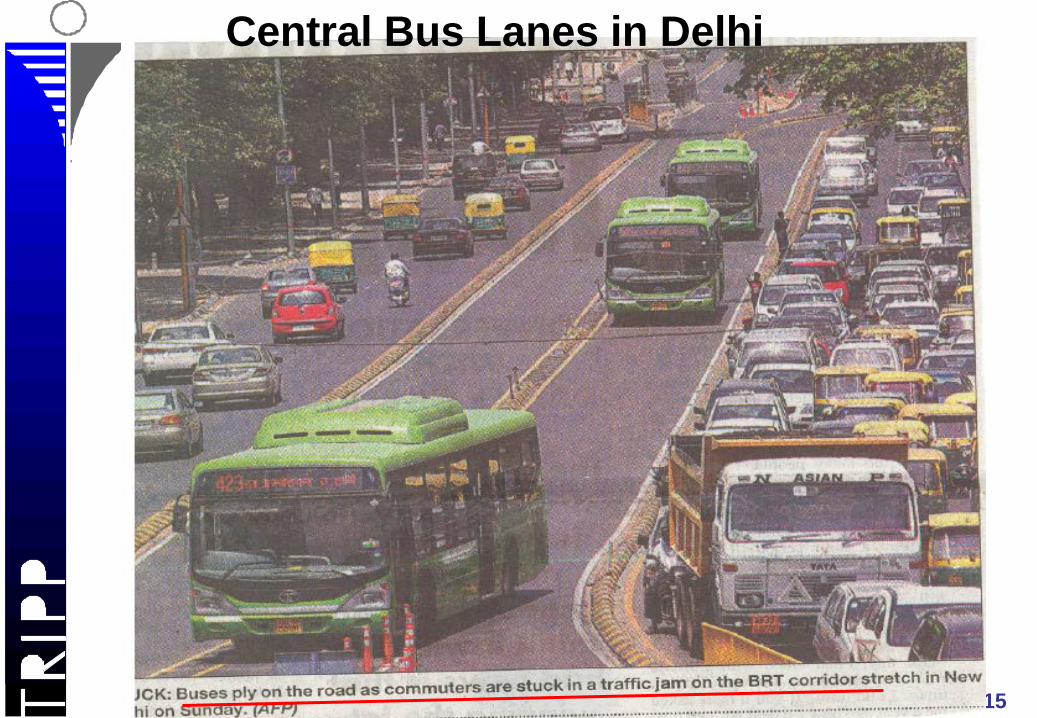
Delhi BRT Traffic May 2009
• 200 buses • 15,000
persons • 1500
bicycles • Bus speed
20km/h • Car speed • 15 m/h
Source - Dario Hidalgo, Madhav Pai; Embarq
15000
Source - Dario Hidalgo, Madhav Pai; Embarq
21
Media Reports
• 2002-2006(november) “…why has the project been delayed?”
• 2007May-2008 May “…BRT-Big Road Trauma”
• Mis-reporting of design details • High lighting inconvenience during
construction • Sensationalizing fatal accidents
IIT Delhi May 15
Central Bus Lanes in Delhi
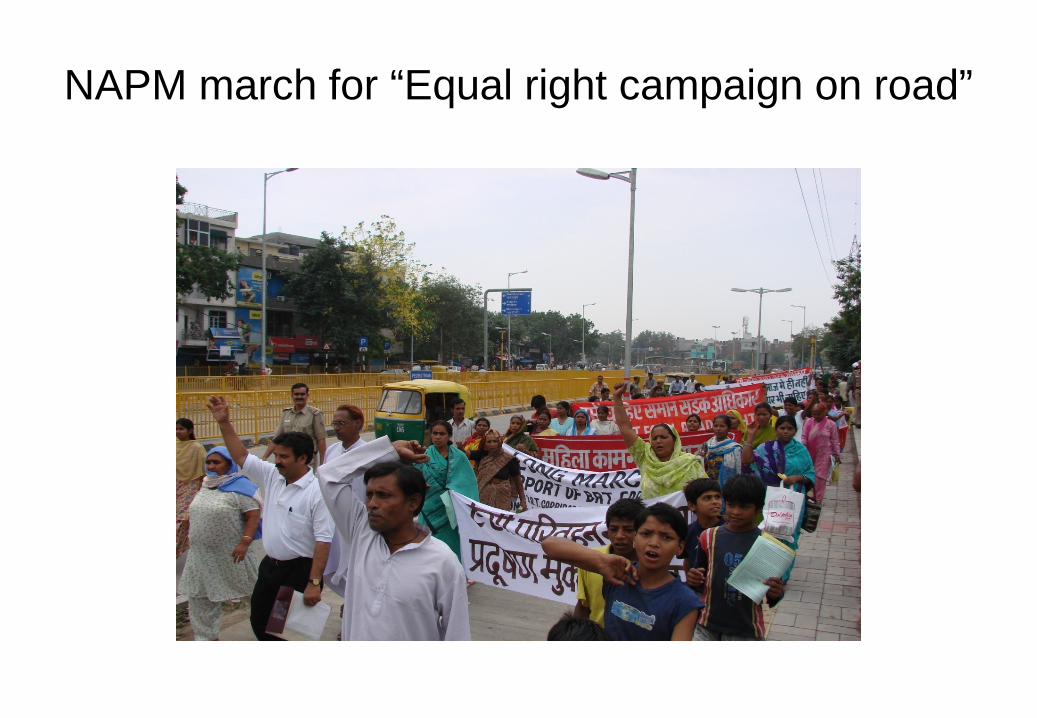
NAPM march for “Equal right campaign on road”
IIT Delhi 2003
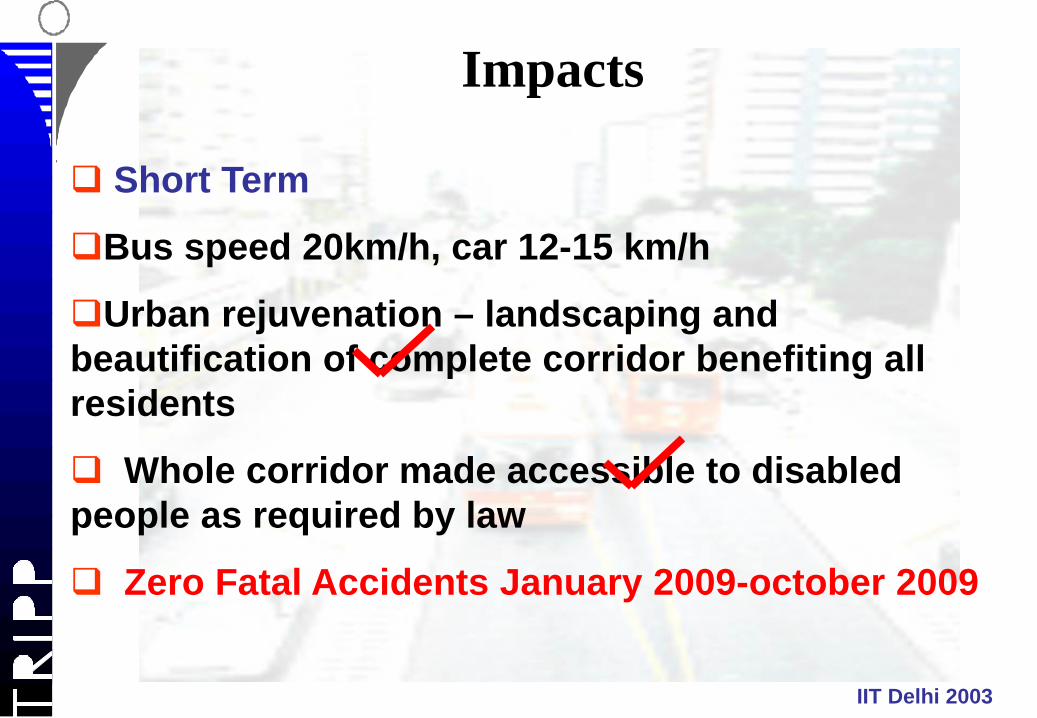
Impacts
Short Term
Bus speed 20km/h, car 12-15 km/h
Urban rejuvenation – landscaping and beautification of complete corridor benefiting all residents
Whole corridor made accessible to disabled people as required by law
Zero Fatal Accidents January 2009-october 2009

IIT Delhi 2003
Impacts
LongTerm
Increase in PT users because Bus speed 20km/h, car 12-15 km/h
Increase in pedestrian and bicycle trips because of safe network
Reduction in vehicular emissions because of smoother driving cycle
Reduction in GHGs because of high share of low carbon modes of transport
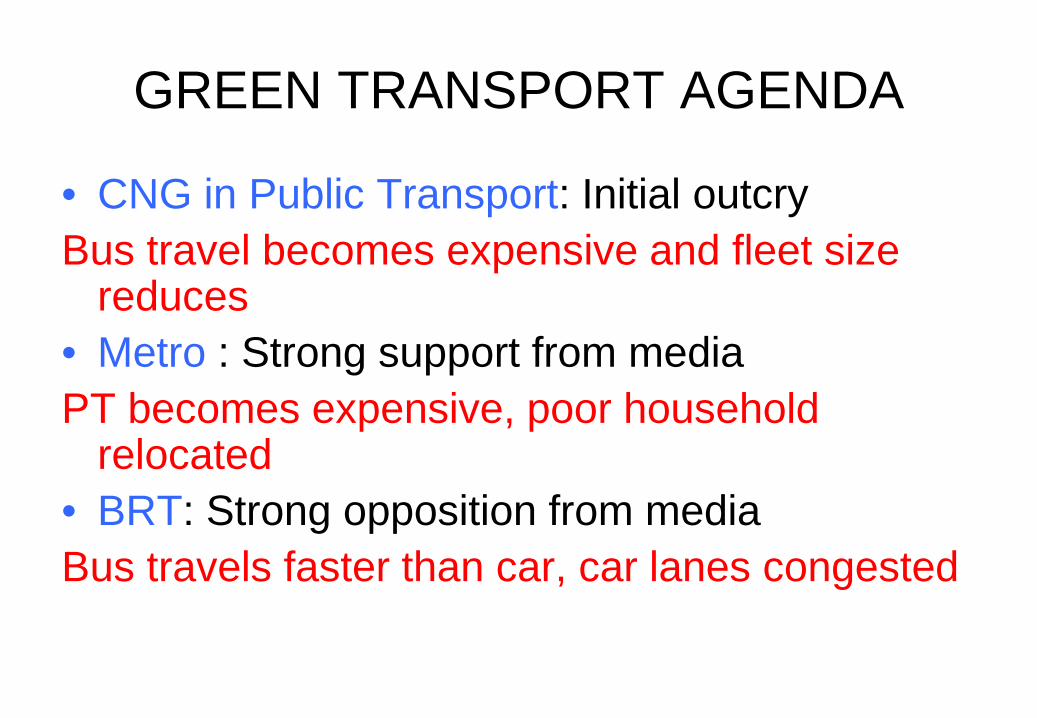
GREEN TRANSPORT AGENDA
• CNG in Public Transport: Initial outcry Bus travel becomes expensive and fleet size
reduces • Metro : Strong support from media PT becomes expensive, poor household
relocated • BRT: Strong opposition from media Bus travels faster than car, car lanes congested
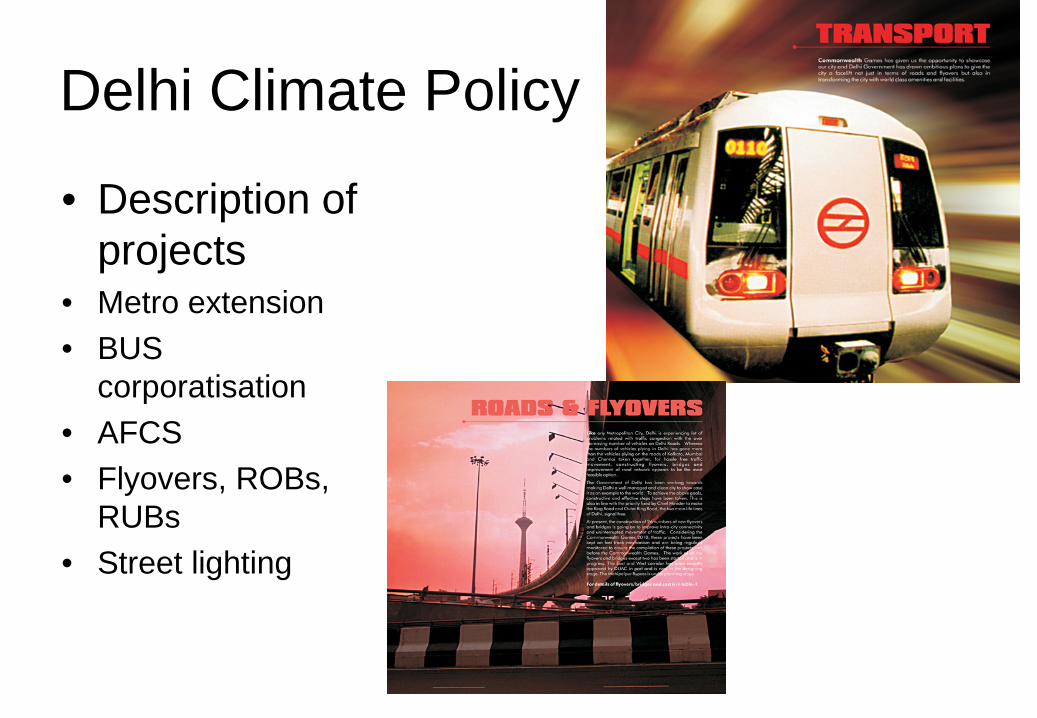
Delhi Climate Policy
• Description of projects
• Metro extension • BUS
corporatisation • AFCS • Flyovers, ROBs,
RUBs • Street lighting
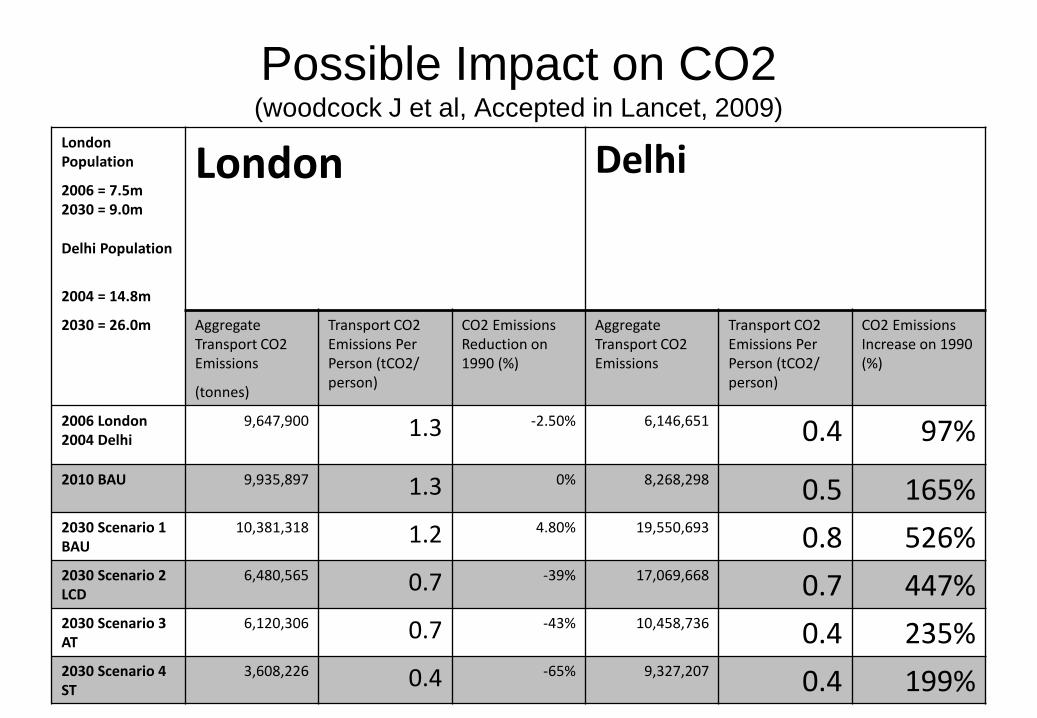
Possible Impact on CO2 (woodcock J et al, Accepted in Lancet, 2009)
London Population London Delhi 2006 = 7.5m 2030 = 9.0m
Delhi Population
2004 = 14.8m
2030 = 26.0m Aggregate Transport CO2 Emissions
Transport CO2 Emissions Per Person (tCO2/ person)
CO2 Emissions Reduction on 1990 (%)
Aggregate Transport CO2 Emissions
Transport CO2 Emissions Per Person (tCO2/ person)
CO2 Emissions Increase on 1990 (%)
(tonnes)
2006 London 2004 Delhi
9,647,900 1.3 -2.50% 6,146,651 0.4 97% 2010 BAU 9,935,897 1.3 0% 8,268,298 0.5 165% 2030 Scenario 1 BAU
10,381,318 1.2 4.80% 19,550,693 0.8 526% 2030 Scenario 2 LCD
6,480,565 0.7 -39% 17,069,668 0.7 447% 2030 Scenario 3 AT
6,120,306 0.7 -43% 10,458,736 0.4 235% 2030 Scenario 4 ST
3,608,226 0.4 -65% 9,327,207 0.4 199%
Recommended