UNIVERSITY OF PADOVA
Department of Agronomy, Food, Natural Resources, Animals and
Environment (DAFNAE)
DOCTORAL SCHOOL OF CROP SCIENCES
CURRICULUM CROP PROTECTION
CYCLE XXVII
Landscape dynamics of tachinid parasitoids
Director of the School: Prof. Antonio Berti
Supervisor: Dr. Lorenzo Marini
Co-supervisors: Prof. Andrea Battisti
Dr. Pierfilippo Cerretti
PhD Student: Diego J. Inclán Luna
Date of thesis submission
January 30th 2015


Declaration
I hereby declare that this submission is my own work and that, to the best of my
knowledge and belief, it contains no material previously published or written by another
person nor material which to a substantial extent has been accepted for the award of any
other degree or diploma of the university or other institute of higher learning, except
where due acknowledgment has been made in the text.
Padova, 30 January 2015 Diego J. Inclán
A copy of the thesis will be available at http://paduaresearch.cab.unipd.it/
Dichiarazione
Con la presente affermo che questa tesi è frutto del mio lavoro e che, per quanto io ne sia
a conoscenza, non contiene materiale precedentemente pubblicato o scritto da un'altra
persona né materiale che è stato utilizzato per l’ottenimento di qualunque altro titolo o
diploma dell'università o altro istituto di apprendimento, a eccezione del caso in cui ciò
venga riconosciuto nel testo.
Padova, 30 gennaio 2015 Diego J. Inclán
Una copia della tesi sarà disponibile presso http://paduaresearch.cab.unipd.it/


………… 7
.. ………… 9
.. ………… 11
………… 23
………… 49
………… 69
………… 89
………… 107
………… 129
………… 135
………… 159
………… 161
Table of contents
Summary………………………………………………………………..
Riassunto………………………………………………………………..
Chapter I ‒ Introduction……………………………………………
Chapter II ‒ Interactive effects of area and connectivity on the
diversity of tachinid parasitoids in highly fragmented
landscapes……………………………………………...
Chapter III ‒ Organic farming enhances parasitoid diversity at the
local and landscape scale………………………………
Chapter IV ‒ Landscape effect on parasitoid spillover between crop
and non-crop habitats………………………………….
Chapter V ‒ Spillover of natural enemies between contrasting field
margins and crops……………………………………...
Chapter VI ‒ Testing scale-dependent effects of semi-natural
habitats on farmland biodiversity……………………...
Conclusions……………………………………………………………..
References………………………………………………………………
Current affiliations of co-authors……………………………………….
Publications……………………………………………………………..


7
Summary
Habitat fragmentation and the intensification of agricultural landscapes are among the
main drivers affecting parasitoid diversity. Although many empirical and theoretical
studies have elucidated the effects of these processes on populations and communities of
parasitoids, the majority of the research has been focused on specialized groups of
hymenopterans. In this study the highly-diverse group of tachinid parasitoids (Diptera:
Tachinidae) was considered as an alternative model system to test the effects of landscape
fragmentation and agricultural intensification on the third trophic level.
The effects of habitat fragmentation are evaluated in Chapter II. This chapter
evaluates the relative importance of habitat loss, decrease of connectivity and their
potential interaction on tachinid diversity. This chapter shows that the reduction of habitat
area and the loss of connectivity significantly interacted, suggesting that management
practices aimed to mitigate the negative effect of habitat fragmentation need to consider
the connectivity in the surrounding landscape.
In the following chapters, diverse components of the intensification of agricultural
landscapes were evaluated. In Chapter III, the diversity of tachinids was examined in
relation to farm management (organic vs. conventional) at different spatial scales. This
study shows that organic management improved the diversity of tachinids at both the
local and landscape scales but only in arable crops while the effect in grasslands was
neutral. Thus, any attempt to enhance parasitoid diversity needs to consider the local
farming system in relation to the agricultural management in the surrounding landscape.
In Chapters IV and V the spatial dynamics and movement of parasitoids between
crop and non-crop habitats were evaluated. These chapters show that the spillover of
tachinid parasitoids was favored by the low contrast in habitat structure between the crop
and non-crop habitats. The highest spillover of parasitoids to arable land was found from
herbaceous semi-natural habitats, while woody structure reduced the exchange of
individuals between arable crop and non-crop habitats. Finally, in Chapters V and VI the
effects of different field margins to enhance farmland biodiversity were examined. The
results from these chapters demonstrate that the positive effect of field margins to
enhance the diversity of tachinids was related to the type and complexity of these semi-
natural habitats. This research provides new insights into the consequences of landscape
changes on the diversity of a key functional group that has been long overlooked in

8
ecological and conservation studies. The results will provide guidelines to implement
conservation measures to halt or reduce biodiversity loss of this important group of
parasitoids.
9
Riassunto
La frammentazione degli habitat e l’intensificazione dell’agricoltura sono riconosciuti tra
i principali fattori che incidono negativamente sulla diversità dei parassitoidi. Nonostante
numerosi studi hanno confermato questa tendenza, la gran parte di essi si è concentrata
sugli imenotteri parassitoidi. Questa tesi si concentra invece sui tachinidi (Diptera:
Tachinidae), considerati come sistema modello alternativo per testare gli effetti della
frammentazione del paesaggio e dell’agricoltura intensiva sul terzo livello trofico.
In particolare, gli effetti della frammentazione degli habitat sono descritti nel
Capitolo II, dove viene valutata l’importanza relativa della perdita dell’habitat, la
diminuzione della connettività e la loro potenziale interazione nell’influenzare la diversità
dei tachinidi. I risultati dimostrano che la riduzione dell’area e la perdita di connettività
dell’habitat interagiscono significativamente, evidenziando che le pratiche di gestione
finalizzate a mitigare gli effetti negativi della frammentazione dell’habitat non possono
prescindere dal prendere in considerazione la connettività con il paesaggio circostante.
Nei capitoli successivi sono stati invece valutati vari impatti connessi
all’intensificazione dell’agricoltura. Nel Capitolo III è stato esaminato come la gestione
delle aziende agricole (biologica vs. convenzionale) possa influenzare la diversità dei
tachinidi a diverse scale spaziali. I risultati dimostrano che la gestione biologica ha un
effetto positivo sulla diversità di tachinidi sia a scala locale sia a livello di paesaggio, ma
solamente nel caso dei seminativi mentre le praterie non ricevono nessun beneficio
dall’agricoltura biologica. Quindi qualsiasi tipo di intervento per migliorare la diversità
dei parassitoidi deve considerare il sistema di gestione agricolo locale in relazione al
paesaggio circostante.
Nei Capitoli IV e V sono state trattate le dinamiche spaziali di spostamento dei
parassitoidi tra ambienti coltivati e ambienti naturali. Questi capitoli dimostrano che il
movimento dei tachinidi è stato favorito dalla bassa differenziazione strutturale dei due
ambienti. Lo scambio di individui più elevato si è avuto dal margine erbaceo mentre il
margine caratterizzato dalla presenza delle siepi riduce lo scambio di individui tra i due
ambienti. Infine, nei Capitoli V and VI è stato valutato l’effetto di diverse tipologie di
margine dei terreni agricoli sulla biodiversità. I risultati ottenuti da questi capitoli
dimostrano che gli effetti positivi della presenza di margini semi-naturali sulla diversità
dei tachinidi siano correlati alla tipologia e alla complessità degli habitat.

10
Questa tesi fornisce nuove informazioni su come i cambiamenti a livello di
paesaggio influenzano la diversità di un gruppo funzionale chiave che è stato per lungo
tempo poco considerato negli studi di ecologia e conservazione. I risultati potranno essere
utilizzati per definire e implementare innovative misure di conservazione e mitigazione
degli impatti considerati.


Introduction
13
Threats to biodiversity: an overview
Biodiversity throughout the world continue to be threatened by multiple drivers. Species
are facing a continuous decline due to reduced quality and extent of terrestrial natural
ecosystems (Rosen 2000; Tilman et al. 2001). According to the Millennium Ecosystem
Assessment (MEA 2005), one of the main drivers affecting biodiversity is the conversion
of natural habitats into agricultural land. In the face of increasing food demand for a
growing human population, agricultural land continues to spread at the detriment of
natural habitats (Tilman et al. 2001; Foley et al. 2005; Godfray et al. 2010). It is estimated
that more than one third of the world land surface is now being used by agriculture (Foley
et al. 2005; Alexandratos & Bruinsma 2012; FAOSTAT 2014). This trend in land use is
leading to the formation of simple landscapes with only few and scattered semi-natural
habitats (Stoate et al. 2001; Robinson & Sutherland 2002). The biodiversity in
agricultural landscapes is further affected by the homogeneous matrix that is dominated
only by a few crops. Indeed, about 60% of food production is comprised only of three
cereals: wheat, corn and rice (Tilman et al. 2001; Alexandratos & Bruinsma 2012). In this
homogeneous landscapes, the disturbance and fragmentation of natural habitats disrupts
important biophysical processes from local to regional scales (Lambin & Geist 2006;
Karp et al. 2012), which is leading to an overall impoverishment of biological diversity.
In agricultural landscapes, remnant habitats play an important role in maintaining
biodiversity and in providing important ecosystem services such as natural control of
pests and pollination (Díaz et al. 2006; Bommarco et al. 2013). As the diversity of species
is tightly related to natural ecosystems is clear that the intensification of agriculture and
the resulting fragmentation of natural habitats are among the main drivers of biodiversity
decline (MEA 2005). Although, a large body of research has accumulated over the past
decades showing that biodiversity is directly affected by habitat fragmentation and
agricultural intensification, the detailed understanding of how these factors are
threatening biodiversity and ecosystem functioning is far to be completed. In fact, during
the last decades we have experienced high rates of biodiversity loss, with future scenarios
predicting that such losses are likely to increase (Ferraz et al. 2003; MEA 2005; Pereira et
al. 2010; Barnosky et al. 2011). Even with these negative scenarios, there is still a large
debate about how the loss of biodiversity is affecting the functioning of ecosystems and
their ability to provide goods and services to our society (Díaz et al. 2006; Cardinale et al.
Chapter I
14
2012). There is a clear need to devise consensual approaches to enhance biodiversity in
agricultural landscapes, but first we have the challenge to understand the dynamics and
processes affecting the species response. For this reason, my research has focused on
understanding how biodiversity is affected by (1) landscape fragmentation and (2)
agricultural intensification.
Landscape fragmentation
Habitat fragmentation is considered one of the major threats to biodiversity worldwide
(Sala et al. 2000). Fragmentation involves not only a reduction in the overall amount of
original habitat, but also in the connectivity of the remnant patches. A decrease of both
habitat area and connectivity are expected to reduce population viability and eventually
species diversity (Hanski 1999). One of the most evident effects of landscape
fragmentation is the reduction of the area of natural and semi-natural habitats. As the
remnant patches become smaller, higher extinction rates due to environmental
stochasticity in combination with a lower probability of receiving immigrants through
dispersal may cause the often observed declines in abundance and species richness
(Hanski 1999). The decline in diversity due to habitat fragmentation is not only the result
of the reduction of habitat area, but also an increase in the isolation of the fragments. The
conversion of continuous habitat into smaller and smaller fragments increases the
distance between fragments. Landscape connectivity is therefore the degree to which the
landscape facilitates or impedes movement among habitat fragments (Taylor et al. 1993;
Hanski 1999; Fischer & Lindenmayer 2007).
A common approach for predicting patterns of diversity within fragmented
habitats relies on the theory of island biogeography. Island biogeographic theory predicts
that species occurrences within fragments will be regulated by extinction and colonization
dynamics (MacArthur & Wilson 1967). However, this theory does not explicitly take into
account the surrounding matrix and its influence on dispersal probabilities and new
species contributions (Mendenhall et al. 2014). Therefore, the interactions among habitat
area, connectivity and the surrounding matrix should be considered in the attempt to
counteract negative impacts of habitat fragmentation. Species are predicted to be highly
sensitive to the reduction of habitat area and connectivity as organisms are likely to
Introduction
15
depend on a variety of resources across fragmented landscapes (Kruess & Tscharntke
1994; Valladares et al. 2006; Cagnolo et al. 2009). As habitats become smaller and less
connected, the multi-trophic interactions of species can be easily disrupted or altered
(Steffan-Dewenter & Tscharntke 2002; Nouhuys van 2005; Elzinga et al. 2007). Thus, the
available habitat must exceed a certain threshold value for the species to persist.
Landscapes with little and sparse habitats are likely to be below the extinction threshold,
while landscapes with large habitat cover and connectivity are expected to be above this
threshold (Pardini et al. 2010; Hanski 2011). After passing a species specific-habitat
threshold, the negative fragmentation consequences on biodiversity accelerate non-
linearly (e.g., Radford 2005; Pardini et al. 2010). However, it must be considered that the
effects of habitat fragmentation for individual organisms are many and varied, as species
with differing life histories are differently affected by habitat fragmentation. Thus, to
counteract the negative effects of landscape fragmentation on biodiversity, further
empirical evidence about the specific consequences of the reduction of habitat area and
connectivity on taxa with differing life histories is urgently needed. Only then we may
arrive to a global consensus about the threshold levels needed to guide the policy and
efforts towards habitat conservation.
Agricultural intensification
While many crop species were traditionally cultivated together within patches of native
vegetation, the specialization of agricultural systems into large agricultural fields of single
or few species is becoming increasingly common. Modern agricultural farming is often
occurring at large spatial scales, with extensive commercial fields replacing native
habitats and smallholder farms (Robinson & Sutherland 2002; Tilman et al. 2001).
Continuing this trend, the arable area in the world by 2050 is expected to expand by more
than 60 million of hectares, with the greatest expansion coming from the developing
world, where for example, agricultural expansion is expected to eradicate more than one
third of the Amazon forest (Soares-Filho et al. 2006; Alexandratos & Bruinsma 2012).
The intensification of agriculture results in the reproduction of similar crop environments
over large distances, causing a local modification of habitats and a broader fragmentation
of the landscape (Matson et al. 1997; Tscharntke et al. 2005). Agricultural intensification
is not only the result of change in land use, it is a combination of different processes

Chapter I
16
acting at different spatial scales. At the local scale, farming systems are characterized by
an intensive management due to the heavy use of external inputs like fertilizers and
pesticides, the improvement of crop varieties, and mechanization. At the landscape scale,
the intensification of agriculture is leading to an overall reduction of natural and semi-
natural habitats and the homogenization of the crop matrix (Tscharntke et al. 2005;
Wright et al. 2012). These practices are enhancing crop yields, but at the cost of reducing
the quality and extent of natural habitats, thus compromising the diversity of species
inhabiting these habitats (Matson et al. 1997; Tscharntke et al. 2005).
The broad scale transformation by agricultural intensification has been linked to
local and regional declines in native biodiversity (e.g., Sotherton 1998; Donald et al.
2001; Deguines et al. 2014). Furthermore, as this transformation affect the composition
and diversity of species in these landscapes, important ecosystem services such as
biological control and pollination are being compromised (e.g., Thies & Tscharntke 1999;
Klein et al. 2003; Hooper et al. 2005). As intensive agriculture replaces habitats that
previously supported diverse communities of organisms, only a set of agriculture-
associated species with a distinct set of physical, life-history, and functional traits will
dominate these hostile landscapes. For instance, generalist species are likely to persist in
these landscapes, while specialist species do not (Tscharntke et al. 2008; Pardini et al.
2010). To counteract the negative effects of agricultural intensification, the conservation
of pristine natural habitats have traditionally pursued as the main goal. However,
considering the importance of species migration between fragments, this conservation
strategy has a limited value as their success depend not only on the natural habitats but
also on the surrounding matrix (Tscharntke et al. 2008, 2012). In fact, Perfecto and
Vandermeer (2010) stress the need to incorporate the agricultural matrix as an integral
component of conservation programs. This also represent an opportunity to integrate the
conservation of the biodiversity of natural ecosystems with the enhancement of
ecosystems services in agricultural landscapes. However, to design efficient strategies we
still need empirical evidence on how different local and landscape processes affect the
diversity of species. For example, several local practices such as organic management,
enhancement of field boundaries and the conservation of semi-natural habitats have been
proposed as an alternative to increase farmland heterogeneity and enhance biodiversity
(e.g., Bengtsson et al. 2005; Letourneau & Bothwell 2008; Crowder et al. 2010; Merckx
et al. 2012; Haenke et al. 2014). However, the magnitude of the benefits derived from

Introduction
17
these systems within contrasting managed landscapes remains unclear and, in particular,
the potential scale-dependent response of biodiversity is relatively unexplored.
Identifying sustainable alternatives to the intensification of agricultural landscapes and
the scale at which biodiversity is affected by these alternatives is an important step to
maximize the ecosystem services and the conservation of biodiversity.
Study system
Although many empirical and theoretical studies have elucidated the effects of habitat
fragmentation and agricultural intensification on populations and communities of primary
producers and consumers (Hanski 1999; Ewers & Didham 2006), less attention has been
paid to the impacts of these drivers on the third trophic level. Furthermore, the majority of
the research done has been focused on specialized groups of hymenopteran parasitoids
(e.g., Cronin 2007; Elzinga et al. 2007; Rand & Tscharntke 2007; Holzschuh et al. 2010;
Fenoglio et al. 2012; Coudrain et al. 2013). Therefore, predictions derived from studies
on highly specialized taxa that parasitoids are highly susceptible to habitat fragmentation
(e.g., the ‘specialist−consumer hypothesis’ Kruess & Tscharntke 1994; ‘trophic rank
hypothesis’ Holt et al. 1999) and to the intensification of agricultural systems (e.g, Thies
et al. 2008), cannot necessarily be extended to more generalist groups (Nouhuys van
2005; Fenoglio et al. 2010). Therefore, for this study the highly-diverse group of tachinid
flies was used as an alternative model to test the effects of landscape fragmentation and
agricultural intensification on insect parasitoids. In particular, the research on landscape
fragmentation was focused on the effects of habitat area, connectivity and habitat quality,
while the research on agricultural intensification was focus on the effects of local
management and specific practices such as the management of field margins to enhance
parasitoid diversity. Furthermore, the different experiments in this thesis were designed to
contrast different spatial scales.
Among natural enemies, tachinid flies represent an optimal model group to
examine effects of habitat fragmentation and agricultural intensification on the third
trophic level. With almost 8,500 species, the Tachinidae family ranks second in diversity
within Diptera and is the most diverse group of non-hymenopteran parasitoids (Stireman
et al. 2006; O’Hara 2013). Species of this family are currently classified into four
Chapter I
18
subfamilies (Dexiinae, Exoristinae, Phasiinae, Tachininae), but in general the
phylogenetic relationships of this family remains poorly known (although see Cerretti et
al. 2014). Tachinids exhibit an impressive diversity of morphologies, ranging from small
(e.g., <2 mm, Catharosia minuta (Townsed)) to large (e.g., 20 mm, Tachina grossa (L.))
body size, from brightly and metallic to dull colored. Tachinids are well represented in all
biogeographical regions, but the Neotropical Region is by far the most species rich,
accounting for more than one-third of the diversity of these flies (O’Hara 2014).
However, only the Tachinidae of the Palearctic and Nearctic Regions are well known,
with perhaps 90% of their species documented (Stireman et al. 2006).
Unlike hymenopteran parasitoids, tachinids do not have a piercing ovipositor and
they do not inject any secretion derived from their reproductive system (i.e., paralyzing
venoms). Additionally, all species in the Tachinidae develop inside their host, as endo-
parasitoids, and allow their host to continue to feed and grow while they develop, as
koinobiont parasitoids (Askew & Shaw 1986). Another characteristic of tachinids is the
high diversity of the reproductive strategies that they have evolved. The majority of
tachinids are ovolarviparous, depositing eggs that contain fully developed first instar
larvae. In some species, a special type of ovolarvipary has evolved in which eggs are laid
on foliage and these eggs hatch only after being ingested by a host. Other groups of
tachinids are oviparous, injecting eggs directly into a host using a modified piercing
oviscapt. The evolution of different reproductive strategies has allowed tachinids to attack
a wide range of hosts, encompassing larvae as well as adult stages. As far as we know
immobile stages like egg and pupa are not suited by tachinids.
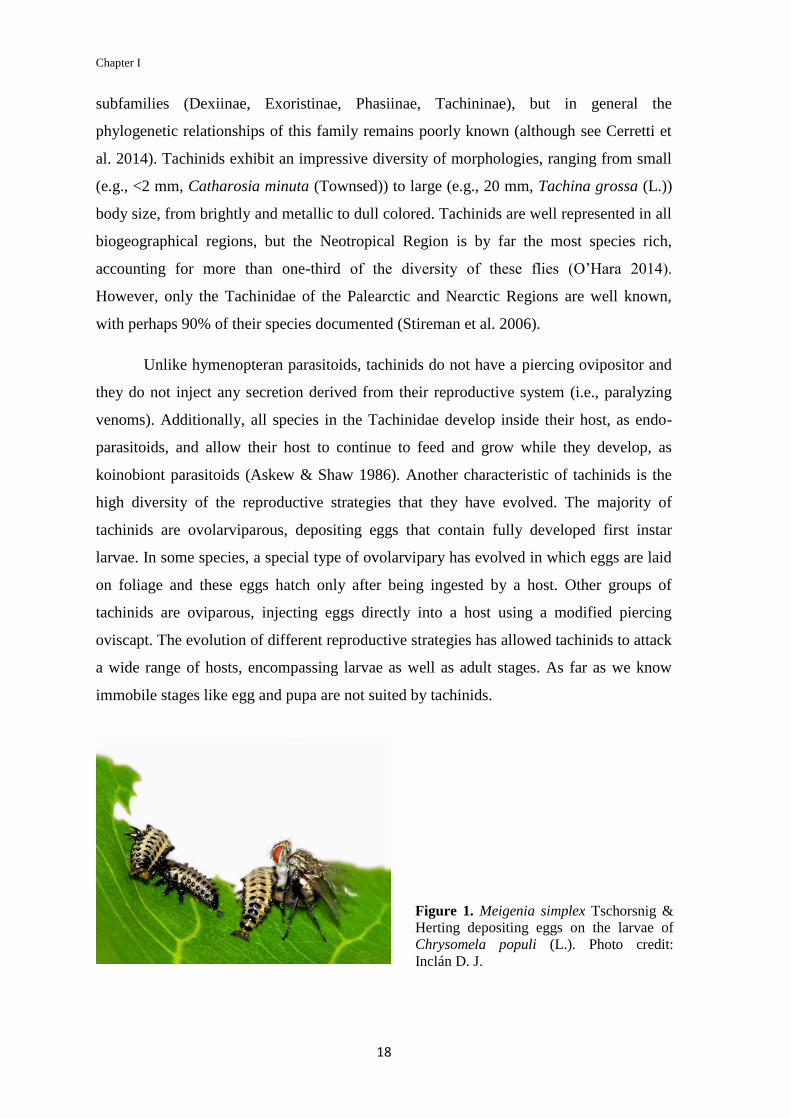
Figure 1. Meigenia simplex Tschorsnig &
Herting depositing eggs on the larvae of
Chrysomela populi (L.). Photo credit:
Inclán D. J.

Introduction
19
The high diversity of tachinids is likely related to the diversity of their hosts. In
contrast to the host range of hymenopteran parasitoids, tachinid species tend to attack a
wider range of hosts (Eggleton & Belshaw 1993). Hosts of tachinids are all arthropods,
mainly insects with only a few records of species attacking non-insect arthropods like
centipedes and scorpions (Williams et al. 1990; Haraldseide & Tschorsnig 2014). The
most commonly used hosts are phytophagous insects, primarily Lepidoptera, Coleoptera
(e.g., Fig. 1), Symphyta, Hemiptera, and Orthoptera. However, tachinids have been also
reported to attack hosts in at least six additional insect orders: Blattodea, Dermaptera,
Diptera, Embioptera, Mantodea, and Phasmida. In general, tachinids have lower host
specificity than other parasitoids such as hymenopterans (Stireman et al. 2006; Stireman
2005) and several species often attack large groups of host species across entire families
or orders (Eggleton & Gaston 1993; Stireman 2005; Cerretti et al. 2014). While some
species are known to be highly specialized in their host use, other species are highly
polyphagous. In fact, the tachinid Compsilura concinnata (Meigen) (Fig. 2) is known to
attack about 200 species of hosts belonging to more than ten families across Lepidoptera,
Hymenoptera, and Coleoptera (Arnaud 1978). This high variation in host use and host
specificity in this group makes the Tachinidae an ideal group for ecological research.
Tachinids have an important role as natural enemies of agricultural pests. Several
species play significant roles in regulating herbivore populations due to their
predominance in attacking the larval stage of major groups of insect pests (Stireman et al.
2006; Cerretti et al. 2014). In general, about 100 species have been employed in
biological control programs of crop and forest pests (Grenier 1988; Stireman et al. 2006).
Some successful examples of tachinids used in biological control programs include the
Figure 2. The highly polyphagous tachinid,
Compsilura concinnata (Meigen), with one
of their known hosts, Orgyia antiqua (L.).
Photo credit: Inclán D. J.

Chapter I
20
release of Cyzenis albicans (Fallén) from Europe against the winter moth (Operophtera
brumata L.) in Canada, and the release of Lixophaga diatraeae (Townsend) from Cuba
and Lydella minense (Townsend) from Brazil against sugarcane borers (Diatraea spp.) in
the Caribbean and South America (Grenier 1988; Lenteren & Bueno 2003). Beside the
importance of this group as natural enemies, tachinids could play a role also as
pollinators. Adult tachinids are flower-visiting insects and use nectar as an energy source
(e.g., Tooker et al. 2006; Al-Dobai et al. 2012). Although the importance of tachinids in
this respect has been largely unexplored (Stireman et al. 2006), few species are
specialized pollinators of Asclepiadoideae (Ollerton & Liede 2014; Nihei & Schwarz
2011) and Orchidaceae (Dodson 1962) flowers.
Despite the great diversity and crucial role of tachinids as parasitoids, relatively
little is known about their ecology and behavior. Their complex life styles are far to be
understood, as even basic biological information on hosts, mating systems, and habitat
requirements is known only for a few species. In fact, an enormous challenge still remain
at the taxonomic level as the truly diversity of this group still remains to be described.
However, giving the alarming rates of biodiversity loss, more research is needed to
elucidate the effects of landscape fragmentation and agricultural intensification on this
key functional group that has been long overlooked in ecological and conservation
studies.
Research objectives and thesis structure
The overall aim of this dissertation is to examine the landscape dynamics of one of the
most diverse and abundant group of non-hymenopteran natural enemies, the Tachinidae.
To achieve this goal the research has focused specifically on habitat fragmentation and
agricultural intensification as the main drivers of the diversity of tachinids. I aimed to
understand the diversity patterns of tachinid parasitoids under the influence of habitat
fragmentation and agricultural intensification by analyzing the spatial effects of these
processes on abundance, species richness and species composition.
The effects of habitat fragmentation are discussed in Chapter II. Specifically, the
main aim of this chapter was to evaluate the relative importance of habitat loss, decrease
of connectivity and their potential interactions on tachinid diversity. In the following

Introduction
21
chapters, diverse components of the intensification of agricultural landscapes were
evaluated. Specifically, in Chapter III the diversity of tachinids was examined in relation
to farm management (organic vs. conventional) at the local and landscape scales. In
Chapters IV, the potential spillover of tachinids in commercial apple orchards localized in
landscapes characterized by different proportions of crop and non-crop habitats was
evaluated. Finally, in the following two chapters the effects of different field margins to
enhance farmland biodiversity were examined. Specifically, Chapter V aimed to evaluate
the spillover of natural enemies from two contrasting field margins (grass margins and
hedgerows) into their adjacent crop, while Chapter VI aimed to test the effects of field
margin quality and semi-natural habitats at multiple scales across three taxonomic groups.


Fragmentation of semi-natural habitats
25
Abstract
Although many empirical and theoretical studies have elucidated the effects of habitat
fragmentation on the third trophic level, little attention has been paid to the impacts of
this driver on more generalist groups of non-hymenopteran parasitoids. Here, we used the
highly-diverse group of tachinid flies as an alternative model to test the effects of
landscape fragmentation on insect parasitoids. Our aims were: (i) to evaluate the relative
importance of habitat area and connectivity losses and their potential interaction on
tachinid diversity, (ii) to test whether the effects of habitat fragmentation changes
seasonally, and (iii) to further assess the effect of habitat diversity on tachinid diversity
and whether different parasitoid-host associations modify the species richness response to
fragmentation. In 2012 a pan-trap sampling was conducted in 18 semi-natural grasslands
embedded in intensive agricultural landscapes along statistically orthogonal gradients of
habitat area, connectivity and habitat diversity. We found an interaction between habitat
area and connectivity indicating that tachinid abundance and species richness were more
negatively affected by habitat loss in landscapes with low rather than with relatively large
habitat connectivity. Although tachinid communities exhibited large within-year species
turnover, we found that the effects of landscape fragmentation did not change seasonally.
We found that habitat diversity and host association did not affect tachinid species
diversity. Our results have important implications for biodiversity conservation as any
attempts to mitigate the negative effects of habitat loss need to take the general level of
habitat connectivity in the landscape into account.
Introduction
Habitat fragmentation is considered one of the major threats to biodiversity worldwide
(Sala et al. 2000). Although many empirical and theoretical studies have shed light on the
effects of habitat fragmentation on populations and communities of primary producers
and consumers (Hanski 1999; Ewers & Didham 2006), less attention has been paid to the
impacts of this driver on the third trophic level. Furthermore, the majority of the research
done has been focused on specialized groups of hymenopteran parasitoids (e.g., Cronin
2007; Elzinga et al. 2007; Rand & Tscharntke 2007; Holzschuh et al. 2010; Fenoglio et
al. 2012; Coudrain et al. 2013). Therefore, the prediction derived from studies on highly

Chapter II
26
specialized taxa that parasitoids are highly susceptible to fragmentation (the
‘specialist−consumer hypothesis’ Kruess & Tscharntke 1994; ‘trophic rank hypothesis’
Holt et al. 1999) cannot necessarily be extended to more generalist groups (Nouhuys van
2005; Fenoglio et al. 2010). Among natural enemies, tachinid flies represent an optimal
model group to examine effects of habitat fragmentation on the third trophic level. With
almost 10,000 described species, the Tachinidae is one of the most diverse families of
Diptera and represent the most diverse group of non-hymenopteran parasitoids (Brown
2001; O’Hara 2012). In general, tachinids have lower host specificity than other
parasitoids such as hymenopterans (Stireman & Singer 2003; Stireman 2005) and several
species often attack large groups of host species across entire families or orders (Stireman
2005; Cerretti et al. 2014). Our study provides one of the first empirical tests of the
impact of fragmentation on one of the most diverse and abundant groups of non-
hymenopteran natural enemies.
Fragmentation involves not only a reduction in the overall amount of original
habitat, but also in the connectivity of the remaining habitat patches. A decrease of both
habitat area and connectivity are expected to reduce population viability and eventually
species diversity (Hanski 1999). Insect natural enemies such as predators and parasitoids
are predicted to be highly sensitive to both processes as these organisms depend on
complex interactions between habitat and host dynamics (Kruess & Tscharntke 1994;
Valladares et al. 2006; Cagnolo et al. 2009). Given that parasitoids are typically
associated with particular hosts, they can only utilize the parts of the landscapes where
these resources occur. As habitats become smaller and less connected, the multi-trophic
interactions among plants, herbivores and their natural enemies can be easily disrupted or
altered (Steffan-Dewenter & Tscharntke 2002; Nouhuys van 2005; Elzinga et al. 2007).
Responses of parasitoids to habitat fragmentation can therefore be more difficult to
predict for primary producers or consumers.
Research on the impact of landscape fragmentation on species diversity has
mostly considered the landscape from a static temporal perspective, especially in
temperate regions. For parasitoids in particular, the persistence and success of the species
depend on their synchronization with important resources like hosts and nectar for the
adults that become available at different times depending on seasonality and
environmental conditions (Tylianakis et al. 2005; Stireman et al. 2012; Letourneau et al.
2012). The agricultural matrix in which fragmented habitats are embedded can be also
Fragmentation of semi-natural habitats
27
highly dynamic over time due to crop phenology and agronomic interventions (Baudry et
al. 2003; Vinatier et al. 2013). Given large fluctuations of resources between seasons, it is
important to consider if effects of habitat fragmentation vary seasonally. For instance, as
resources can be lower in certain time of the year the spatial requirements for a
population to persist could considerably increase (Olson et al. 2005). Therefore, the
relationship between habitat area, connectivity and parasitoids are expected to change
with season.
In fragmented landscapes habitat diversity within the remnant patches is another
key factor expected to influence natural enemies both directly and indirectly (Fenoglio et
al. 2010). Direct effects are mainly related to the availability of food for the adults such as
nectar or pollen resources (e.g., Géneau et al. 2012) and the provision of overwinter
resources (Shaw 2006), while indirect effects are related to the influence of the habitat
fragment quality on host availability (e.g., Segoli & Rosenheim 2013). While parasitoids
with a high degree of specialization should primarily respond to host density, more
generalist parasitoids are expected to respond to the richness and abundance of host
species (Heisswolf et al. 2009). Parasitoids with low host specificity should benefit from
patches with large habitat diversity, as these support greater abundance and diversity of
herbivore species (Rosenzweig 1995; Marini et al. 2010). However, empirical studies
(although see, Kruess 2003; Cronin & Reeve 2005; Holzschuh 2010) testing the relative
importance of habitat diversity on natural enemies compared to habitat configuration are
still lacking.
Considering the diversity and crucial role of non-hymenopteran parasitoids in
managed and natural ecosystems, more research is needed to elucidate the response of
this key functional group to habitat fragmentation. The main aims of this study were: (i)
to evaluate the relative importance of habitat loss, decrease of connectivity and their
potential interactions on tachinid diversity; (ii) to evaluate whether the effects of habitat
fragmentation changes seasonally; and (iii) to further assess the effect of habitat diversity
on tachinid diversity and whether different parasitoid-host associations modify the species
richness response to fragmentation. Specifically, we addressed three primary hypotheses.
First, according to the fragmentation threshold hypothesis (Andrén 1994; Pardini et al.
2010) we expect that the effect of habitat loss may depend on the level of habitat
connectivity in the landscape (Hanski 2011). Due to the high mobility and relatively low
specialization of tachinids, we expect that species diversity will respond to area only at
Chapter II
28
very low connectivity levels while in landscapes with relatively large connectivity the
effect of habitat area should be less important (Rösch et al. 2013). Second, due to
seasonal fluctuations in food resources and host density both in the patches and in the
matrix, we expect that the effects of habitat fragmentation should vary between spring,
summer and fall. Third, we hypothesized that fragments with high habitat diversity will
support higher parasitoid diversity than patches dominated by a single habitat by
providing larger resources for adults and more diverse host communities. In particular,
species attacking host groups common in several habitats should respond more strongly to
habitat diversity than species feeding on host groups that are mostly restricted to single
habitats. We tested this hypothesis in isolated abandoned grasslands in intensive arable
landscapes in a Mediterranean region, where shrub and tree encroachment in grasslands is
expected to increase habitat diversity at the beginning of the succession, but declines as
the cover of shrubs and trees gradually becomes continuous.
Methods
Study area and sampling design
The research was conducted within an area of c. 650 km2 in the province of Siena (central
Italy). The study region was characterized by a network of fragments of semi-natural
grasslands, shrublands and forests within an intensively managed agricultural landscape.
The grasslands patches are derived from eroded claystones (“biancane” badlands and
“calanchi” claystones) which results in a mosaic of habitats that range from bare ground
with scarce or no vegetation to grassland communities, with or without shrubs or trees.
The prevailing land use in the landscape is highly homogenous being cultivated almost
entirely with durum wheat. The agricultural matrix remains bare ground during summer
and the beginning of fall due to the harvest (c. July) and ploughing (c. September). The
cover of semi-natural grasslands in the surrounding landscape (2 km radius) varied
between c. 1 and 10%.
Eighteen patches were selected along three statistically uncorrelated gradients of
(1) area ranging from 0.2 to 11.5 ha, (2) habitat connectivity ranging from isolated to
well-connected patches and (3) within-patch habitat diversity varying from open
grasslands or shrublands to complex mosaics of grasslands with shrubs and trees (Table
Fragmentation of semi-natural habitats
29
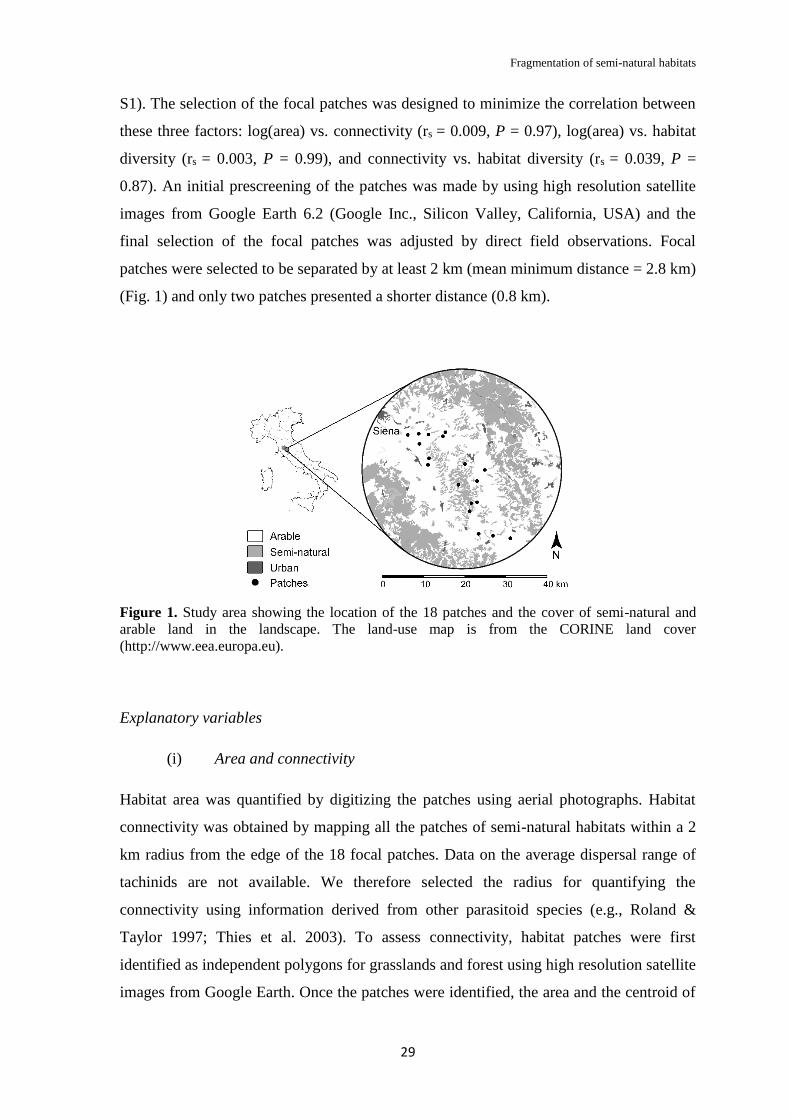
S1). The selection of the focal patches was designed to minimize the correlation between
these three factors: log(area) vs. connectivity (rs = 0.009, P = 0.97), log(area) vs. habitat
diversity (rs = 0.003, P = 0.99), and connectivity vs. habitat diversity (rs = 0.039, P =
0.87). An initial prescreening of the patches was made by using high resolution satellite
images from Google Earth 6.2 (Google Inc., Silicon Valley, California, USA) and the
final selection of the focal patches was adjusted by direct field observations. Focal
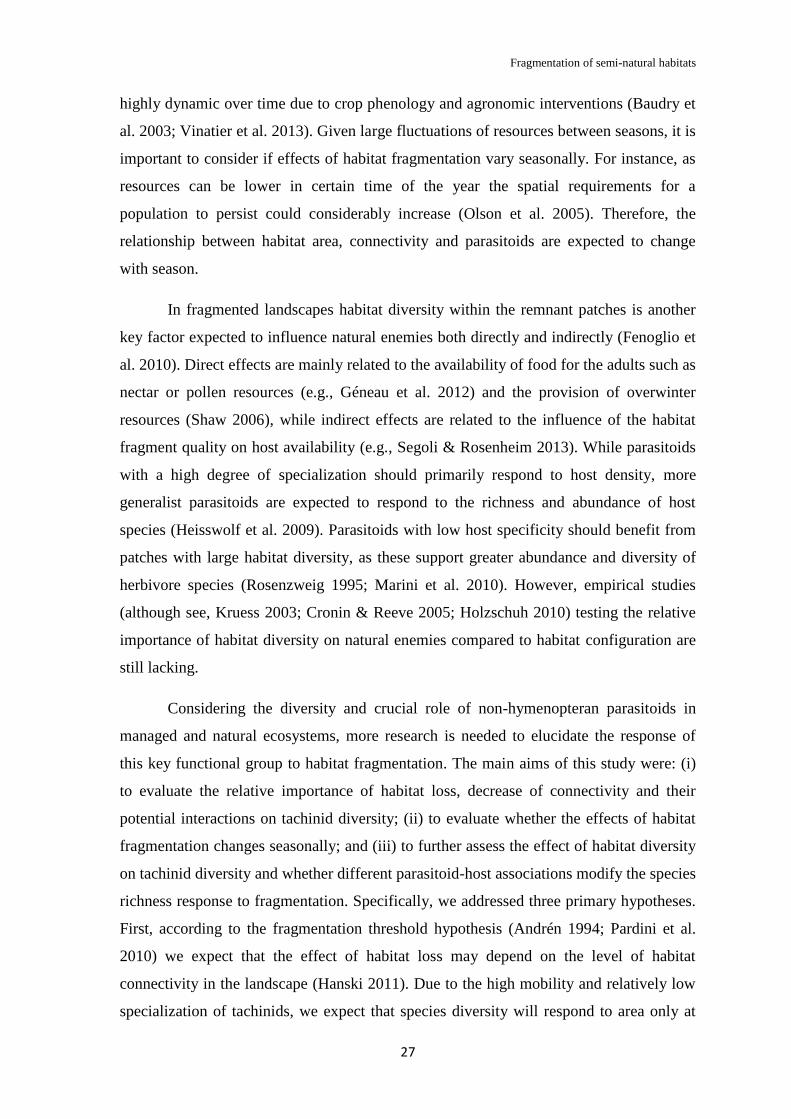
patches were selected to be separated by at least 2 km (mean minimum distance = 2.8 km)
(Fig. 1) and only two patches presented a shorter distance (0.8 km).
Figure 1. Study area showing the location of the 18 patches and the cover of semi-natural and
arable land in the landscape. The land-use map is from the CORINE land cover
(http://www.eea.europa.eu).
Explanatory variables
(i) Area and connectivity
Habitat area was quantified by digitizing the patches using aerial photographs. Habitat
connectivity was obtained by mapping all the patches of semi-natural habitats within a 2
km radius from the edge of the 18 focal patches. Data on the average dispersal range of
tachinids are not available. We therefore selected the radius for quantifying the
connectivity using information derived from other parasitoid species (e.g., Roland &
Taylor 1997; Thies et al. 2003). To assess connectivity, habitat patches were first
identified as independent polygons for grasslands and forest using high resolution satellite
images from Google Earth. Once the patches were identified, the area and the centroid of

Chapter II
30
each polygon within 2 km from the focal patch were calculated using ArcGIS 10.0 (ESRI,
Redlands, California, USA). Initially the connectivity was calculated separately for
grassland and forest, but in preliminary analyses connectivity computed using forest
patches was never associated with our response variables. Thus, in the present study we
presented only the grassland connectivity (see Table S1).
Habitat connectivity (SI) for each of the 18 focal patches (i) was measured using
the Hanski’s connectivity index (Hanski 1999):
SIi = e-dij Abj for all dij < 2.0km
i j
Where Aj is the size of neighboring habitat patches and dij is the distance from the center
of the neighboring patch j to the center of the focal patch i. The parameter is a proxy for
dispersal distance and b is a parameter that scales the size of the surrounding habitat
patches. Although information about specific dispersal abilities of tachinids is still lacking
(Letourneau et al. 2012), we used a value of = 0.5. Nonetheless, assigning other
dispersal abilities with between 1 and 2.0 did not substantially change the connectivity
index. For the scaling parameter b we chose b = 0.5 according to the assumptions that the
ratio of patch edge to patch area decreases with A0.5 when patch area increases (Moilanen
& Nieminen 2002). In preliminary analyses we also tested the connectivity index based
on a 1 km radius and found that the results were qualitatively similar with those found for
the 2 km radius. The model fit and the significance of the connectivity effect were,
however, slightly better for the 2 km than for the 1 km radius. We therefore presented the
results based on the former.
(ii) Within-patch habitat diversity
Three main habitat types can be identified within the patches: (i) bare ground with little or
sparse vegetation, (ii) shrublands and (iii) open grasslands. All patches were formerly
grazed and/or burnt, but due to the suspension of these traditional managements the semi-
natural grasslands have experienced shrubland encroachment (Maccherini et al. 2000).
All the patches were unmanaged at the time of the sampling but the time since the
abandonment differed. The dominant vegetation cover depended on the time since

Fragmentation of semi-natural habitats
31
suspension of management occurred; more recently burnt and grazed areas were
dominated by open grasslands while areas abandoned decades ago were increasingly
covered by shrubs and trees (Marini et al. 2010). Within the patch, the area covered by
bare ground, grasslands and shrublands was independently calculated using aerial
photographs (1:1500) with the software ImageJ (NIH, Bethesda, Maryland, USA). We
estimated habitat diversity using the Shannon index. Due to the low number of habitats
present, habitat diversity showed a tight hump-shaped relationship with the cover of both
grasslands and shrublands (y = -0.0002x2 + 0.0127x + 0.5713, R² = 0.59, P < 0.01 for
shrublands; y = -0.0003x2 + 0.0249x + 0.2284, R² = 0.79, P < 0.01 for grasslands). Due to
the broad resolution of host associations, it was not possible to measure any meaningful
variable related to host density or diversity. However, habitat diversity can be considered
a good proxy of host availability as insect herbivore diversity is often positively
correlated with habitat or resource heterogeneity (Tews et al. 2004).
Insect sampling
A Pan-trap sampling was conducted in the 18 semi-natural patches using a sampling
effort proportional to patch area. Two clusters of five pan-traps were used for each patch
with an area equal or smaller than 1.5 ha. In larger patches, one cluster of traps was added
for each additional ha. Each cluster of traps consisted of three standard yellow (500 ml,
16 cm diameter) and two UV-yellow plastic bowls (300 ml, 10 cm diameter) filled with a
solution of water and 3% dishwashing detergent (Sole TM). Yellow pan-traps have been
used as a reliable method for sampling tachinid flies (e.g., Stireman 2008). One UV-
yellow and one standard yellow pan-traps were held approximately 1 m above the ground
using a wood support and one UV-yellow and two standard yellow pan-traps were placed
on the ground within a two meter radius of the wood support. The cluster position was
kept fixed within the grassland patch, leaving a distance of at least 20 meters from the
borders and avoiding areas completely covered by shrubs. The sampling was conducted
every two to three weeks between March and November 2012. A total of 16 samplings
were performed covering the whole season during which the insects were active. During
each sampling, traps were set for a period of 48 hours. Samples were stored in alcohol
(70%) for sorting and identification. The specimens were identified to species level using
Cerretti (2010) and Cerretti et al. (2012). All the specimens are currently housed in the
insect collection of P. Cerretti at the MZUR (Museo di Zoologia, Università di Roma La
Sapienza, Rome, Italy).

Chapter II
32
Host association
Host association of the tachinid species was derived from Cerretti and Tschorsnig (2010)
and Cerretti (2010). Unlike most parasitoids that are highly specialized at the host-species
level, tachinids frequently attack a broad spectrum of hosts (Stireman & Singer 2003;
Stireman 2005; Cerretti et al. 2014). Therefore, host association was defined at the insect
order level. In cases where hosts were uncertain or unknown, the classification was
inferred from the genus except for the few genera that are known to attack different
orders (e.g., Exorista Meigen). We identified seven orders of potential hosts: Lepidoptera
(n = 65), Coleoptera (n = 19), Hemiptera (n = 25), Hymenoptera (n = 3), Dermaptera (n =
2), Orthoptera (n = 1), Diptera (n = 1) and Chilopoda-Lithobiomorpha (n = 1). For 12
species, it was not possible to assign host association due to the lack of data. For the host
association analysis, only the species attacking lepidopterans, coleopterans and
hemipterans were included (n = 109).
Statistical analyses
To test the effects of habitat loss, connectivity and season, we used a general linear model
(GLM) for tachinid abundance and a generalized linear mixed model (GLMM) with a
Poisson distribution and a log-link function for species richness. The response variable
was the cumulative number of individuals/species per patch obtained per each sampling
event. Season was included in both models as a categorical factor with three levels, where
spring included the first five samplings (16th March - 12th May), summer the following
six (26th May - 8th August) and fall the last five samplings (26th August - 24th November).
Both models included the focal patch as random factor to account for the repeated
sampling in the same patch. Area and abundance were log-transformed in each model to
improve linearity. The model tested the effect of area, connectivity, season and the
interactions between area, connectivity and season. We first build a full model and then
we simplified the model by removing one-by-one, starting from the interaction, the least
significant terms with P > 0.05. The GLM and GLMM analyses were performed using
the “nlme” (Pinheiro et al. 2013) and “lme4” (Bates et al. 2014) packages, respectively,
implemented in R (R Development Core Team, 2013).
To test whether tachinid abundance and species richness respond differently to
habitat diversity according to host association, we used a GLM for abundance and a
GLMM with a Poisson distribution and a log-link function for species richness. Similar to
Fragmentation of semi-natural habitats
33
the models described above, abundance and area were log-transformed to improve
linearity in both models. The response variable was the cumulative number of
individuals/species per each host group and patch obtained per each season. The low
occurrence of tachinids did not allow to work with the data from the single sampling
event. Both models included the focal patch as random factor to account for the repeated
sampling in the same patch of different host groups. Both models included host as a
categorical fixed effect with three levels (species attacking Lepidoptera, Coleoptera or
Hemiptera). The other fixed effects, in both models, were area, connectivity, habitat
diversity and the interaction between habitat diversity and host. We did not test
interactions between host, area and connectivity as we did not have any specific
ecological hypotheses to support these tests. However, in preliminary analyses we
explored all these interactions and found no clear effects for any of them. To simplify the
model we applied a backwards deletion procedure as explained above.
To explore the effect of the proportional sampling on the fragmentation effects we
used a widespread species richness estimator and species rarefaction curves (Magurran et
al. 2010). The congruence between the results using the raw data and the asymptotic
estimators would indicate that the effects detected are not a sampling artifact. First, we
calculated the Jack1 species richness estimator using the function “specpool” from the
statistical package “vegan” (Oksanen et al. 2007), implemented in the software R (R
Development Core Team, 2013). Then, we run a similar model as explained above, where
our response variable was the species richness estimator by patch, as the estimator takes
in account the species accumulated after the sixteen samplings. Additionally, we
constructed the species rarefaction curves to describe the species accumulation in relation
to our sampling effort. For each focal patch, the rarefaction curve and its 95% intervals of
confidence was calculated and plotted using 1,000 permutations with the function
“accumcomp” from the “BiodiversityR” package (Kindt & Coe 2005) based on functions
of the “vegan” package (Oksanen et al. 2007), implemented in R (R Development Core
Team, 2013). To explore the species community changes between seasons, we calculated
the number of shared species and the Jaccard similarity index (Magurran et al. 2010)
using the software EstimateS 9.0 (Colwell 2013). Values close to 1 of this index indicate
low beta-diversity between seasons.
A potential problem with data obtained for many ecological observational studies
is that the variables sampled may have a spatial component. For instance, our species
Chapter II
34
richness or abundance measures in neighbouring patches are likely to be similar. This can
result in spatial autocorrelation which causes problems for statistical methods that make
assumptions about the independence of residuals (Legendre & Legendre 1998). We
therefore tested for spatial autocorrelation using Mantel correlograms (Borcard &
Legendre 2012). Specifically, we tested whether model residuals obtained for both
abundance and species richness were spatially auto-correlated. Spatial correlograms were
constructed using 12 lag intervals. Each interval was 2.61 km wide, ranging from 0.93 to
33.25 km. The first lag distance allowed to include the mean distance between focal
patches. Mantel correlation coefficients were calculated for each lag interval and tested
for significance with a permutation test, using 1999 permutations. Each correlogram was
tested for significance using a Bonferroni-corrected α of 0.01 (Legendre & Legendre
1998). The spatial autocorrelation analysis was performed using the “mpmcorrelogram”
(Pinheiro et al. 2013) implemented in R (R Development Core Team, 2013).
Results
General results
From March to November 2012, a total of 1528 individuals were observed (see Table S2).
One-hundred-twenty-nine species belonging to 78 genera were identified. Three species
appeared to be dominant accounting for almost 50% of the total specimens: Zeuxia
aberrans (Loew), Gastrolepta anthracina (Meigen), and Besseria reflexa Robineau-
Desvoidy, representing 18, 17 and 12.4% of the specimens collected, respectively. In
general, the most abundant species were associated with Hemiptera (e.g., B. reflexa) and
Coleoptera hosts (e.g., Z. aberrans and G. anthracina). However, more than half of the
species collected were associated to lepidopteran hosts (see host association section
below). Additionally, the species Chetogena micronychia (Masson) and Pseudomintho
diversipes (Strobl) were recorded for the first time in Italy. The estimated rarefaction
curves for each focal patch ended with a fairly similar slope, suggesting that the observed
species richness was comparable between patches (Fig. S1).

Fragmentation of semi-natural habitats
35
Table 1. Results from the mixed models testing the effects of patch area, connectivity, and season
on tachinid (a) log-abundance and (b) species richness. Patch was included as a random factor and
area was log-transformed to improve linearity in both models. For abundance we used general
linear models with a normal distribution while for species richness we used a generalized linear
mixed model with a Poisson distribution (log-link function). The interactions between season and
area and between season and connectivity were removed from the model with a backwards
deletion procedure (P > 0.05). For the full model refer to Table S3.
(a) Abundance Estimate SE t value P value
Intercept -9.320 2.271 -4.104 <0.001
Log(Area) 2.549 0.514 4.960 <0.001
Connectivity 0.246 0.110 2.246 0.041
Season-spring -0.869 0.106 -8.200 <0.001
Season-summer -0.361 0.113 -3.181 0.001
Log(Area) x Connectivity -0.057 0.024 -2.291 0.037
(b) Species richness z value
Intercept -10.845 2.374 -4.567 <0.001
Log(Area) 2.675 0.525 5.095 <0.001
Connectivity 0.277 0.115 2.413 0.016
Season-spring -0.967 0.096 -10.067 <0.001
Season-summer -0.219 0.086 -2.558 0.011
Log(Area) x Connectivity -0.060 0.025 -2.376 0.018
Species composition and abundance varied strongly over time. Of the 1528
specimens sampled, 53% were collected in fall and 31% and 16% were collected in
summer and spring, respectively. The most species-rich season was summer with 82
species followed by fall and spring with 79 and 34 species, respectively. Additionally, we
found that more than half of the species collected were restricted to only one particular
season. Specifically, 26, 25 and 9% of the species were found exclusively in summer, fall
and spring, respectively. The communities from summer and autumn are the most similar,
sharing more than half of the species, while spring was more dissimilar from summer and
fall (Table 2).
Effect of area, connectivity and season
We found a significant effect on tachinid abundance and species richness of both habitat
area and connectivity (Table 1). We also found in both models an interaction between
Chapter II
36
area and connectivity, i.e. when connectivity was low the area effect was stronger, while
when connectivity was large the area effect became less apparent (Fig. 2). The model
using the species estimator as our response variable led to similar results as those
obtained using observed species richness (Table S4). We found no support for any
interaction between seasons and either area or connectivity indicating that the effects of
both factors were consistent among seasons (Table S3), even if the species assemblages
changed substantially over time (Table 2). We did not find significant spatial
autocorrelation in the residuals of both abundance and species richness models. At all the
distances, the Mantel correlations were close to zero.
Table 2. Tachinid community similarity between the different seasons. Jaccard similarity index
varies between 0 (completely different communities) and 1 (completely similar communities)
(Magurran et al. 2010).
Season Shared species Jaccard similarity
Spring vs. Summer 18 0.19
Spring vs. Autumn 14 0.14
Autumn vs. Summer 44 0.38
Host association and habitat diversity
Although tachinids exhibit a wide range of hosts, three insect orders were identified as
their main hosts. Species attacking lepidopterans represented half of the species collected,
while hemipterans and coleopterans grouped 19 and 15% of the species, respectively.
However, the most abundant species were related mainly to coleopterans and
hemipterans. The interaction between habitat diversity and host association was not
significant for both tachinid abundance and species richness. Similarly, we did not find
any support that connectivity or area interacted with host association (Table S5).

Fragmentation of semi-natural habitats
37
Figure 2. Plots showing the interaction between area and connectivity on tachinid log-abundance
and species richness. Panels are ranked from left (a) to right (c) according to increasing habitat
connectivity. The fitted line is a general linear model estimate for log-abundance and a
generalized linear mixed model estimate for species richness. The points represent the partial
residuals from the respective models described in Table 1. Panels were drawn using the “visreg”
function from the library “visreg” in R.
Discussion
Our study is one of the few testing simultaneously the effect of habitat area, connectivity
and habitat diversity on species diversity on non-hymenopteran parasitoids. Tachinid
parasitoids showed a clear species−area relationship with a linear increase in abundance
and species richness as the area of the patches increases. However, the strength of the
habitat loss effect depended on the degree of habitat connectivity. Abundance and species
richness were negatively affected by habitat loss in highly fragmented landscapes, but the
effect was less evident in landscapes with relatively high habitat connectivity. This result
has important implications for biodiversity conservation as any attempts to mitigate the
negative effects of habitat loss need to take the general level of habitat connectivity in the
landscape into account (see also Rösch et al. 2013).

Chapter II
38
Habitat fragmentation often consists of a combination of area reduction with a
decrease in connectivity among remnant fragments. As the habitat patches become
smaller, higher extinction rates due to environmental stochasticity in combination with a
lower probability of receiving immigrants through dispersal may cause the often observed
declines in abundance and species richness (Hanski 1999). A growing body of research
further suggests that low connectivity can significantly affect the dispersal and species
persistence in fragmented landscapes (Roland & Taylor 1997; Cronin 2007). In
accordance with these predictions, we found that tachinid species diversity was positively
related to habitat connectivity, but this effect also interacted with habitat loss. As the
habitat patches became highly isolated, the abundance and richness of tachinids were
more dependent on habitat area. Contrastingly, as the patches became relatively well
connected the effect of habitat area was less evident. These contrasting effects of habitat
loss at different levels of habitat connectivity, has been already shown for leafhopper
communities (Rösch et al. 2013). The observed interaction between area and connectivity
is consistent with the concept of extinction threshold applied at the community level
(Andrén 1994; Pardini et al. 2010), i.e. for a given species, the total quantity of habitat
available must exceed a certain threshold value for the species to persist. Landscapes with
little and fragmented habitat are likely to be below the extinction threshold, while
landscapes with large habitat cover and connectivity are expected to be above this
threshold (Hanski 2011). The persistence of diverse tachinid parasitoid communities in
our study area despite the high levels of fragmentation and low connectivity support the
view that more generalist parasitoids can cope better with fragmentation pressure than
more specialist groups (e.g., Pardini et al. 2010). This also suggests that tachinids may be
good dispersers and/or they can use alternative hosts in the adjacent agricultural matrix,
although this remains to be tested.
Although tachinids exhibited large within-year species turnover, we found that
this large temporal replacement did not modify the overall effects of landscape
fragmentation. While most of the studies regarding habitat fragmentation have ignored
changes in species through time, the few studies considering this effect have reported that
species interact differently with habitat type in the different seasons (Letourneau et al.
2012). Differently to our initial hypothesis that the effects of habitat fragmentation varies
between seasons, our results indicated that the parasitoid community that we examined
had a relatively constant response to both area and connectivity.

Fragmentation of semi-natural habitats
39
Contrary to our predictions, we did not find a relationship between habitat
diversity and overall parasitoid abundance and species richness. The low host specificity
of tachinids may have led to the lack of habitat diversity effect. Tachinids are expected to
further depend on host density rather than just host diversity. Increasing habitat diversity
has been proved to support a greater variety of species (e.g., Landis et al. 2005; Scherber
et al. 2006), but not necessarily an increase in species abundances (e.g., Johnson et al.
2006; Bennett & Gratton 2013). In fact, host density is often more associated to landscape
variables such as area and connectivity (e.g., Ekroos et al. 2013; Veres et al. 2013).
Similarly, we did not find an interaction between habitat diversity and host association
indicating that the parasitoid species did not respond to this variable irrespective of their
host association.
Contrary to the hypothesis that parasitoids are highly susceptible to habitat
fragmentation (Kruess & Tscharntke 1994; Holt et al. 1999), we showed that relatively
polyphagous parasitoids may not be as severely affected by habitat loss. However, we
found that for tachinid parasitoids their diversity still depends on minimum levels of
remnant habitats in the landscape (c. 10%). The processes of habitat area reduction and
loss of connectivity significantly interacted indicating that management practices to
mitigate the negative effect of habitat loss at the local scale need to consider the
surrounding landscape. In particular, the conservation of habitat connectivity needs to be
specially considered on landscapes with small remnant habitats. Maintaining large habitat
diversity within the habitat remnants appeared to be neutral to more generalist parasitoids.
Our study provides new insights into the consequences of landscape changes on the
diversity of a key functional group that has been long overlooked in ecological and
conservation studies. The next step will be to understand the consequences of the loss of
parasitoid diversity on ecosystem functioning (e.g., Fenoglio et al. 2012) to fully
understand how fragmentation affects the complex multi-trophic interactions in highly
fragmented landscapes.
Chapter II
40
Acknowledgements
We would like to thank Andrea Battisti and John O. Stireman who provided helpful
comments on earlier versions of this manuscript. We thank Jochen Krauss and two
anonymous reviewers for very insightful comments on early versions of this manuscript.
This study was partially supported by Corpo Forestale dello Stato. DJI was supported by
a PhD Fellowship from the CARIPARO Foundation.

Fragmentation of semi-natural habitats
41
Supplementary Material
Table S1. Description of the sampled patches with the indication of area, connectivity (% of
semi-natural coverage), and within patch habitat composition.
Locality ID No
traps
Area
(ha)
Coordinates
(decimal
degrees)
Semi-natural (%)
(2 km buffer)
Within patch
habitat composition
(%)
Long Lat Grass Forest Total Bare
ground
Shrub Grass
Asciano ID47 2 0.28 11.602 43.204 7 12.6 19.6 4.5 50.9 44.6
Arbia N01 2 0.48 11.452 43.278 5.9 2.8 8.7 16.5 1.9 81.6
San Quirico d'Orcia DI17 2 0.72 11.618 43.070 3.1 7.6 10.7 1.3 45.3 53.4
Pienza N05 2 0.92 11.665 43.064 4.9 1.2 6.1 3 56.6 40.4
San Giovani d'Asso N08 2 0.95 11.577 43.139 4.9 20.1 25 2.4 73.3 24.2
Chiusure DI44 2 1.3 11.580 43.181 3.5 13.3 16.9 3 58.5 38.6
Asciano DI50 2 1.36 11.548 43.216 4.2 26.6 30.8 35.9 17.7 46.5
Torrenieri N06 3 1.76 11.557 43.122 7.5 25.5 33 4 54.4 41.6
Vescona Chiesa DI52 3 1.81 11.498 43.281 4.1 1.3 5.4 17.6 9.3 73.1
Monteroni d'Arbia DI10 3 1.92 11.451 43.229 3.1 21.7 24.9 2.9 19.7 77.4
San Giovani d'Asso N04 4 2.91 11.563 43.136 2 34.2 36.1 4.8 84.5 10.7
Bollano N03 5 4.43 11.529 43.175 10.1 46 56.1 1.5 88.7 9.8
Arbia ID22 6 4.66 11.397 43.278 2.3 6.3 8.6 5.1 13.2 81.7
Vescona Chiesa DI34 6 5.36 11.492 43.274 2.5 10.3 12.8 7.5 33.7 58.8
Monteroni d'Arbia DI09 8 7.2 11.449 43.218 1.5 0.7 2.2 0.9 42.3 56.8
Arbia DI38 9 8.34 11.427 43.281 5.3 1 6.3 4.6 30.6 64.8
San Quirico d'Orcia N07 10 9.36 11.579 43.075 4.5 13.9 18.4 1.1 44.2 54.8
Arbia ID12 12 10.82 11.428 43.260 2.8 4.4 7.2 6.6 31.2 62.3

Chapter II
42
Table S2. Tachinid species and their abundance in the study area.
Species Total of specimens
Acemya acuticornis (Meigen, 1824) 1
Aplomya confinis (Fallén, 1820) 17
Atylomyia loewii Brauer, 1898 3
Besseria reflexa Robineau-Desvoidy, 1830 199
Bithia immaculata (Herting, 1971) 1
Bithia modesta (Meigen, 1824) 7
Blepharipa pratensis (Meigen, 1824) 1
Bothria frontosa (Meigen, 1824) 2
Campylocheta latigena Mesnil, 1974 1
Carcelia falenaria (Rondani, 1859) 53
Catharosia albisquama (Villeneuve, 1932) 2
Catharosia pygmaea (Fallén, 1815) 2
Cestonia cineraria Rondani, 1861 2
Chetina setigena Rondani, 1856 14
Chetogena filipalpis Rondani, 1859 5
Chetogena micronychia (Masson, 1969)*** 1
Chetogena rondaniana (Villeneuve, 1931) 2
Clairvillia pninae Kugler, 1971 1
Clausicella suturata Rondani, 1859 4
Clemelis massilia Herting, 1977 9
Clemelis pullata (Meigen, 1824) 1
Clytiomya sola (Rondani, 1861) 1
Cylindromyia auriceps (Meigen, 1838) 8
Cylindromyia bicolor (Olivier, 1812) 1
Cylindromyia brassicaria (Fabricius, 1775) 3
Cylindromyia brevicornis (Loew, 1844) 1
Cylindromyia intermedia (Meigen, 1824) 6
Cylindromyia pilipes (Loew, 1844) 7
Cylindromyia pusilla (Meigen, 1824) 1
Cylindromyia rufifrons (Loew, 1844) 1
Cylindromyia rufipes (Meigen, 1824) 2
Cyrtophleba ruricola (Meigen, 1824) 2
Dolichocolon paradoxum Brauer & Bergenstamm, 1889 17
Drino atropivora (Robineau-Desvoidy, 1830) 3
Dufouria nigrita (Fallén, 1810) 2
Ectophasia crassipennis (Fabricius, 1794) 2
Eriothrix rufomaculata (DeGeer, 1776) 2
Erycia festinans (Meigen, 1824) 10
Erynniopsis antennata (Rondani, 1861) 1
Eurysthaea scutellaris (Robineau-Desvoidy, 1848) 1
Exorista civilis (Rondani, 1859) 1
Exorista larvarum (Linnaeus, 1758) 1
Exorista mimula (Meigen, 1824) 1
Exorista nympharum (Rondani, 1859) 3
Exorista rustica (Fallén, 1810) 4
Gaedia connexa (Meigen, 1824) 4

Fragmentation of semi-natural habitats
43
Table S2. continued
Gaedia distincta Egger, 1861 4
Gastrolepta anthracina (Meigen, 1826) 276
Gonia picea (Robineau-Desvoidy, 1830) 1
Hebia flavipes Robineau-Desvoidy, 1830 1
Kirbya moerens (Meigen, 1830) 2
Lecanipa leucomelas (Meigen, 1824) 1
Leucostoma anthracinum (Meigen, 1824) 4
Leucostoma nudifacies Tschorsnig, 1991 5
Leucostoma simplex (Fallén, 1815) 6
Leucostoma tetraptera (Meigen, 1824) 21
Linnaemya frater (Rondani, 1859) 2
Linnaemya soror Zimin, 1954 2
Linnaemya vulpina (Fallén, 1810) 6
Litophasia hyalipennis (Fallén, 1815) 1
Loewia setibarba Egger, 1856 12
Lomachantha parra Rondani, 1859 3
Macquartia dispar (Fallén, 1820) 1
Macquartia tessellum (Meigen, 1824) 1
Macquartia viridana Robineau-Desvoidy, 1863 2
Medina collaris (Fallén, 1820) 1
Medina separata (Meigen, 1824) 6
Meigenia dorsalis (Meigen, 1824) 3
Meigenia majuscula (Rondani, 1859) 15
Meigenia mutabilis (Fallén, 1810) 5
Meigenia uncinata Mesnil, 1967 1
Microphthalma europaea Egger, 1860 4
Microsoma exiguum (Meigen, 1824) 1
Mintho rufiventris (Fallén, 1817) 26
Nemorilla maculosa (Meigen, 1824) 48
Ocytata pallipes (Fallén, 1820) 2
Opesia cana (Meigen, 1824) 1
Opesia grandis (Egger, 1860) 17
Oswaldia muscaria (Fallén, 1810) 4
Pales pavida (Meigen, 1824) 21
Panzeria puparum (Fabricius, 1794) 1
Paratryphera barbatula (Rondani, 1859) 18
Paratryphera bisetosa (Brauer & Bergenstamm, 1891) 8
Paratryphera mesnili Herting, 1977 1
Paratryphera palpalis (Rondani, 1859) 7
Peleteria iavana (Wiedemann, 1819) 8
Peleteria meridionalis (Robineau-Desvoidy, 1830) 4
Peleteria rubescens (Robineau-Desvoidy, 1830) 9
Peleteria ruficornis (Macquart, 1835) 6
Peribaea apicalis Robineau-Desvoidy, 1863 2
Peribaea tibialis (Robineau-Desvoidy, 1851) 5
Periscepsia carbonaria (Panzer, 1798) 11
Periscepsia latifrons (Zetterstedt, 1844) 1
Periscepsia spathulata (Fallén, 1820) 1

Chapter II
44
Table S2. continued
Phania funesta (Meigen, 1824) 21
Phasia mesnili (Draber-Monko, 1965) 3
Phasia obesa (Fabricius, 1798) 1
Phasia pandellei (Dupuis, 1957) 5
Phorinia aurifrons Robineau-Desvoidy, 1830 2
Platymya antennata (Brauer & Bergenstamm, 1891) 1
Platymya fimbriata (Meigen, 1824) 1
Prosopea nigricans (Egger, 1861) 5
Pseudogonia parisiaca (Robineau-Desvoidy, 1851) 12
Pseudogonia rufifrons (Wiedemann, 1830) 4
Pseudomintho diversipes (Strobl, 1899)*** 24
Pseudoperichaeta palesioidea (Robineau-Desvoidy, 1830) 1
Siphona geniculata (DeGeer, 1776) 3
Siphona pauciseta Rondani, 1865 3
Smidtia laticauda (Mesnil, 1963) 1
Spallanzania rectistylum (Macquart, 1847) 1
Staurochaeta albocingulata (Fallén, 1820) 1
Stomina caliendrata (Rondani, 1862) 4
Stomina calvescens Herting, 1977 19
Stomina tachinoides (Fallén, 1817) 3
Tachina magnicornis (Zetterstedt, 1844) 6
Thecocarcelia trichops Herting, 1967 1
Thelaira nigripes (Fabricius, 1794) 1
Thelaira solivaga (Harris, 1780) 2
Thelyconychia solivaga (Rondani, 1861) 1
Triarthria setipennis (Fallén, 1810) 5
Voria ruralis (Fallén, 1810) 88
Wagneria cunctans (Meigen, 1824) 1
Wagneria gagatea Robineau-Desvoidy, 1830 1
Zaira cinerea (Fallén, 1810) 2
Zeuxia aberrans (Loew, 1847) 289
Zeuxia cinerea Meigen, 1826 8
Zeuxia erythraea (Egger, 1856) 4
Zeuxia zejana Kolomiets, 1971 1
Ziminia masiceraeformis (Portshinsky, 1881) 2
Total of species 129
Total specimens 1528 ***Indicates new species recorded for Italy

Fragmentation of semi-natural habitats
45
Table S3. Results from the mixed models testing the effects of patch area, connectivity, and
season on tachinid (a) log-abundance and (b) species richness. Patch was included as a random
factor and area was log-transformed to improve linearity in both models. For abundance we used
a general linear model while for species richness we used a generalized linear mixed model with a
Poisson distribution (log-link function).
(a) Abundance Estimate SE t value P value
Intercept -10.910 2.382 -4.581 <0.001
Log(Area) 2.875 0.539 5.335 <0.001
Connectivity 0.255 0.110 2.317 0.036
Season-spring 1.051 1.046 1.005 0.316
Season-summer 2.037 1.120 1.820 0.070
Log(Area) x Connectivity -0.057 0.025 -2.292 0.038
Connectivity x spring -0.009 0.015 -0.578 0.564
Connectivity x summer -0.016 0.016 -1.013 0.312
Log(Area) x spring -0.403 0.235 -1.717 0.087
Log(Area) x summer -0.479 0.251 -1.906 0.060
(b) Species richness
z value
Intercept -11.114 2.461 -4.516 <0.001
Log(Area) 2.715 0.542 5.013 <0.001
Connectivity 0.287 0.115 2.487 0.0129
Season-spring -2.091 1.258 -1.663 0.0964
Season-summer 0.924 1.072 0.863 0.3884
Log(Area) x Connectivity -0.061 0.025 -2.418 0.0156
Connectivity x spring 0.005 0.013 0.403 0.6868
Connectivity x summer -0.016 0.012 -1.277 0.2017
Log(Area) x spring 0.220 0.260 0.848 0.3963
Log(Area) x summer -0.182 0.221 -0.824 0.4102
The categorical factor season included three levels (spring, summer, and fall). All the other
variables were continuous.
Table S4. Results from the generalized linear model using the Jack1 species richness estimators
as response variable. The generalized linear model tested the effects of patch area, connectivity
and their interaction on the estimated species richness. GLM was performed using a Poisson
distribution (log-link function). The model did not include season as the estimator used the 16
sampling events to estimate species richness.
Estimate SE z value P value
Intercept -4.645 1.483 -3.132 0.002
Log(Area) 1.813 0.321 5.650 <0.001
Connectivity 0.150 0.074 2.030 0.042
Log(Area) x Connectivity -0.032 0.016 -1.991 0.046

Chapter II
46
Table S5. Results from the mixed models testing the effects of patch area, connectivity, host type
and habitat diversity on tachinid (a) log-abundance and (b) species richness. Patch was included
as a random factor and area was log-transformed to improve linearity in both models. For
abundance we used general linear models while for species richness we used a generalized linear
mixed model with a Poisson distribution (log-link function).
(a) Abundance Estimate SE t value P value
Intercept -13.237 2.605 -5.081 <0.001
Log(Area) 3.446 0.620 5.558 <0.001
Connectivity 0.414 0.133 3.109 0.008
Hemiptera host 0.418 0.943 0.443 0.658
Lepidoptera host 1.839 0.943 1.950 0.053
Habitat diversity 0.112 0.990 0.113 0.912
Log(Area) x Connectivity -0.096 0.030 -3.174 0.007
Habitat diversity x Hemiptera host -1.473 1.272 -1.158 0.249
Habitat diversity x Lepidoptera host -2.536 1.272 -1.993 0.048
(b) Species richness
z value
Intercept -11.150 3.096 -3.601 <0.001
Log(Area) 2.438 0.720 3.385 0.001
Connectivity 0.263 0.158 1.664 0.096
Hemiptera host 1.125 0.774 1.454 0.146
Lepidoptera host 2.051 0.658 3.119 0.002
Habitat diversity 0.687 0.977 0.703 0.482
Log(Area) x Connectivity -0.057 0.035 -1.616 0.106
Habitat diversity x Hemiptera host -1.533 1.034 -1.483 0.138
Habitat diversity x Lepidoptera host -1.441 0.871 -1.655 0.098
The categorical factor host included three levels (Coleoptera, Hemiptera and Lepidoptera hosts).
All the other variables were continuous.

Fragmentation of semi-natural habitats
47
Figure S1. Accumulation curves of tachinid species richness against the number of sampling
events for each focal patch. The vertical lines in the accumulation curves represent the 95% CI.
Rarefaction curves are based on 1000 randomizations. Curves were drawn using the
“accumcomp” function from the library “BiodiversityR” in R. For specific patch information refer
to TableS1 using the ID code.


Organic farming enhances parasitoid diversity
51
Abstract
The magnitude of the benefits derived from organic farming within contrasting managed
landscapes remains unclear and, in particular, the potential scale-dependent response of
insect parasitoids is relatively unexplored. Identifying the scale at which parasitoids are
affected by organic farming will be an important step to enhance their conservation. We
sampled tachinid parasitoids at the centre and margin of arable and grassland fields on
paired organic and conventional farms located in landscapes with different proportions of
organic land. A total of 192 fields were sampled in two biogeographical regions of the
UK. We found that the positive effect of organic farming on tachinid parasitoid diversity
can be observed at multiple spatial scales. At the local scale, we found higher abundance
and species richness of tachinid parasitoids on organic than on conventional farms and on
field margins than on field centres. At the landscape scale, the diversity of tachinids was
higher in landscapes with higher proportions of organic land. At both scales, the positive
effect of organic farming was clear for arable fields, while it was almost neutral for
grasslands. Any attempt to enhance parasitoid diversity in agricultural landscapes needs
to consider the local management in relation to habitat type, location within the field and
agricultural management in the surrounding landscape. Organic management in arable
fields is clearly enhancing tachinid diversity, while the management of organic grasslands
needs to be reconsidered. To increase the biodiversity of grasslands, organic management
should aim to enhance habitat heterogeneity and to reduce mowing frequency and grazing
intensity. To restore parasitoid diversity, the promotion of organic agriculture should aim
to increase both the total extent of organic farming and the connectivity of individual
organic farms. As the benefits of organic farming clearly spread beyond individual farm
boundaries, any economic assessment of organic farming should consider these positive
externalities.
Introduction
In the last few decades, agricultural intensification has strongly increased crop
productivity through mechanization and the use of improved crop varieties, chemical
fertilizers and pesticides leading to severe ecological simplification of European agro-
ecosystems (Swift et al. 1996; Tilman et al. 2001; Wilby & Thomas 2002; Bengtsson et

Chapter III
52
al. 2005; Fuller et al. 2005; Holzschuh et al. 2010; Geiger et al. 2010). This simplification
has resulted in a marked reduction in the diversity of insect natural enemies with possible
negative effects on pest control services (Wilby & Thomas 2002; Bianchi et al. 2006;
MacFayden et al. 2009; Thies et al. 2011; Jonsson et al. 2012). Although it is relatively
well known that intensive agricultural systems are responsible for the decline of species
diversity and the abundance of natural enemies in general (e.g., Fuller et al. 2005;
Letourneau & Bothwell 2008; Macfadyen et al. 2009, 2011; Lohaus et al. 2013), the
understanding of the effects of agricultural management at different spatial scales on
important natural enemies such as parasitoids is still incomplete.
In Europe, to counteract the decline in farmland biodiversity, several agri-
environment schemes (AES) have been implemented, including subsidies to support
organic farming. In contrast to conventional agriculture, organic farming is a production
system considered to be more sustainable because the use of synthetic fertilizers and
pesticides are excluded. These practices increase farmland heterogeneity and often
enhance parasitoid diversity and possibly natural pest control (Bengtsson et al. 2005;
Letourneau & Bothwell 2008; Macfadyen et al. 2009, 2011; Crowder et al. 2010),
although the specific contribution of insect parasitoid diversity to pest control remains
unclear (Finke & Denno 2004; Pérez-Lachaud et al. 2004; Batchelor et al. 2005).
Research on parasitoids has only focused on organic management at the local scale,
ignoring potential effects at the landscape scale. Although several studies have considered
the effects of landscape composition on insect diversity, this research has mainly focused
on the role of semi-natural habitats or habitat heterogeneity in the landscape (see review
of Tuck et al. 2014), rather than effects of management type within the same land-use
class (but see Holzschuh et al. 2008; Rundlöf et al. 2010; Gabriel et al. 2010). The
magnitude of the benefits derived from organic farming within diverse agricultural
managed landscapes remains unclear. Similarly, while recent research has highlighted
that different taxa respond to organic management at different spatial scales (Gabriel et al.
2006; Clough et al. 2007; Gabriel et al. 2010), the potential scale-dependent response of
insect parasitoids is relatively unexplored. Identifying the scale at which parasitoids are
most strongly affected by organic farming will be an important step to maximize the
benefits from AES and potentially to enhance the biocontrol of pests.
Most of the studies that have elucidated the effect of agricultural management and
landscape on parasitoids have focused on single or a few species of hymenopteran

Organic farming enhances parasitoid diversity
53
parasitoids (e.g., Thies et al. 2011; Jonsson et al. 2012; Lohaus et al. 2013). In this work,
we used tachinids (Diptera: Tachinidae) as an alternative and non-hymenopteran
parasitoid group. With almost 8,500 species, the Tachinidae family ranks second in
diversity within the Diptera and is the most diverse group of non-hymenopteran
parasitoids (Stireman et al. 2006; O’Hara 2013). Tachinids tend to have a wider range of
hosts than hymenopteran parasitoids and can be very important natural enemies of
agricultural pests. Tachinids often play significant roles in regulating herbivore
populations due to their predominance in attacking the larval stage of lepidopterans,
coleopterans, hemipterans and other major groups of insect herbivores (Stireman et al.
2006; Cerretti et al. 2014). In general, about 100 species have been employed in
biological control programs of crop and forest pests (Grenier 1988; Stireman et al. 2006).
Additionally, adult tachinids are flower visiting insects as they use nectar as an energy
source and may even act as pollinators (Al-Dobai et al. 2012), although their importance
in this respect has been largely unexplored (Stireman et al. 2006). Considering the
diversity and crucial role of tachinids as parasitoids, more research is needed to elucidate
the effects of management across different scales on this key functional group.
The main aim of our study was to examine how local farm management (organic
vs. conventional) and the proportion of land under organic farming in the landscape
affects species richness and the abundance of tachinid parasitoids. Specifically, we
addressed four main questions. First, due to the marked differences in local management
between organic and conventional farming, does organic farming enhance the local
diversity of parasitoids? Second, if organic management has a positive effect on tachinid
diversity, is this effect stronger for arable crops than for grasslands? Third, due to the
greater difference in the local management of field centres between the two farming
regimes, is there a more pronounced effect of organic farming in field centres than in field
margins? Fourth, according to the source-sink hypothesis (Pulliam 1988), is organic
farming acting as “source” of parasitoids from where conventional farms could benefit as
“sink” habitats through the spill-over of individuals? If so, it is expected that parasitoid
diversity in conventional farms located in landscapes with high coverage of organic
farming will be greater than in landscapes dominated by conventional agriculture.

Chapter III
54
Methods
Study area and sampling design
The study design and the site selection are described in full detail in Gabriel et al. (2010).
In summary, sixteen landscapes of 10 x 10 km were selected containing different
proportions of land under organic farming (Fig. 1a). Landscapes were arranged in eight
clusters of paired landscapes. Paired landscapes were chosen to have similar
environmental conditions (i.e. very similar landscape composition), but contrasting
amounts of organic farming, i.e. organic “hotspot” versus “coldspot” depending on the
proportion of land under organic farming (hotspot mean 17.2%, range 8.9‒36.8% vs.
coldspot mean 1.4%, range 0.5‒3.3%) (see Gabriel et al. 2009). The paired landscapes
within each cluster were located within an average distance of 28.3 ± 14.4 km. Four
clusters were located in the Central South West and four in the North Midlands of
England (Fig 1a). Each landscape (both hotspot and coldspot) contained one focal organic
and one conventional farm with similar enterprise structure (Fig 1b). The paired farms
were located within an average distance of 2.9 ± 1.4 km. This study design ensured that
the local farm management and the proportion of land under organic farming in the
landscape were uncorrelated enabling us to test the interaction between the two scales.
Within each farm, three cereal fields (mainly winter wheat) and three grassland fields
(mainly grazed permanent pastures) were selected (Fig. 1b). A total of 192 fields were
sampled, within 16 organic and 16 conventional farms located in eight clusters divided in
two regions.

Organic farming enhances parasitoid diversity
55
Figure 1. Scheme showing the hierarchical sampling design. (a) Distribution of the 16 paired
landscapes across two regions in England. (b) Landscapes with grey shading representing low
(coldspot) or high (hotspot) amount of organic land in the landscapes. Each landscape contains
one conventional (white circle) and one organic farm (grey circle). Farms contain three arable
(solid rectangles) and three grass (dashed rectangles) fields. (c) Within each field three groups of
three pan-traps were placed in the field margin and in the field centre.
Insect sampling
Within each field, pan-trap sampling was conducted along two transects. The first transect
was placed in the margin of the field (uncultivated area) and the second transect was
placed in the field centre, about 25 m from the margin. On each transect, three groups of
three pan-traps were placed separated by 25 m (Fig. 1c). Each group of pan-traps
consisted of three UV-reflecting colored plastic bowls (yellow, white and blue) with an
internal diameter of 11 cm. Pan-traps were held just above the top of the vegetation by a
wooden stake and the bowls were half filled with water to which a drop of detergent was
added to break the surface tension. The sampling was conducted twice in 2007 in June
and July when the average temperature was above 15ºC. During each sampling round,
traps were set for a period of 48 hours after which insects were retrieved and stored in
alcohol (70%) for sorting and identification. A total of 2,304 samples were processed and
the specimens belonging to the family Tachinidae (Diptera) were identified to species

Chapter III
56
level using Cerretti (2010) and Cerretti et al. (2012). All the specimens were housed in
the insect collection of P. Cerretti at the MZUR (Museo di Zoologia, Università di Roma
La Sapienza, Rome, Italy).
Statistical analyses
To test the effects of cover of organic land in the landscape (hotspot and coldspot), farm
management (organic and conventional), habitat (arable and grassland fields), and trap
location (margin vs. centre) we used generalized linear mixed effect models. The
response variable was the species richness per field and the total number of individuals
per field. For abundance we used a generalized linear mixed model with a negative
binomial distribution. For species richness we used a generalized linear mixed model with
a Poisson distribution. The families and link functions used in the models were selected
based on residual deviance and distribution of residuals. Both models included region
(Central South and North Midlands), landscape (hotspot and coldspot), farm management
(organic and conventional), habitat (arable and grassland fields), and location (margin and
centre) as categorical fixed effects. Both models included landscape-cluster (n = 8),
landscape ID (n = 16), farm ID (n = 32) and field ID (n = 192) as random factors to
account for the nested design of the sampling. Although due to its nature region could be
a random effect, we include it as a fixed factor because it only had two levels (Bolker et
al. 2008). The analyses were performed using the package “glmmADMB” (Fournier et al.
2012), implemented in R 3.0.2 (R Development Core Team 2013).
To compare the fit of all the possible combinations of predictors in our models we
used the second-order Akaike’s information criterion (AICc) corrected for small samples
(Whittingham et al. 2006). We first built a global model containing the variable region
and all the interactions among landscape, farm management, habitat, and location. Region
was not included in any interactions, as we did not have any ecological hypothesis to
support these analyses. We compared all the models using ΔAICc and Akaike weights
(∑wi). A model is usually considered plausible if its ΔAICc is below two (Burnham &
Anderson 2002). To evaluate the relative importance of each predictor, we summed the wi
across the models in the set in which the predictor occurred. The model inference
analyses were performed using the “MuMIn” package (Barton 2013) implemented in R
(R Development Core Team 2013).

Organic farming enhances parasitoid diversity
57
To assess the variability explained by the fixed and random effects, we calculated
the pseudo-R2. We did not perform this analysis on the abundance model, as currently it is
not possible to calculate the pseudo-R2 of a GLMM with a negative binomial distribution
(Nakagawa & Schielzeth 2013; Johnson 2014). To calculate the pseudo-R2 for the species
richness model, we built a mixed model including all parameters that were included in
models with a ΔAICc below two. Then, we calculated the marginal and conditional
pseudo-R2 using the function “r.squaredGLMM” implemented in the “MuMIn” package
(Barton 2013). The marginal pseudo-R2 describes the proportion of variance explained by
the fixed factors alone, while the conditional pseudo-R2 describes the proportion of
variance explained by both the fixed and random factors (Nakagawa & Schielzeth 2013).
Results
A total of 12,954 individuals were collected belonging to 50 species (for species list see
Table S1), 8,041 individuals belonging to 40 species were collected in organic farms,
while 4,913 individuals belonging to 35 species were collected in conventional farms.
Fifteen species were only found on organic farms, while 10 were only found on
conventional farms. Two species were dominant accounting for more than 80% of the
total abundance. Siphona geniculata (DeGeer) and Eriothrix rufomaculata (DeGeer)
represented 68% and 19% of the individuals collected, respectively. Siphona geniculata is
one of the few parasitoids known to attack crane fly larvae (Diptera: Tipulidae) which are
important agricultural pests damaging grasslands and cereals, although they can also be a
problem in other crops, particularly where they are grown after grass leys (Belshaw 1993;
Blackshaw & Coll 1999). Eriothrix rufomaculata is a parasitoid of lepidopteran larvae,
known to attack pyralid larvae (Lepidoptera: Pyralidae) in grasses (Paston & Rotheray
2009).

Chapter III
58
Table 1. Sum of Akaike weights (Σwi) across all models for tachinid abundance and species
richness. For each predictor, Σwi is the sum of weights of the models that contain that variable.
Σwi can vary between 0 and 1 and represent the relative importance of the variables (Burnham &
Anderson 2002).
Abundance Species richness
Σwi Σwi
Habitat 1.00 0.96
Landscape 1.00 1.00
Location 1.00 1.00
Management 1.00 0.96
Region 1.00 1.00
Habitat x Landscape 0.99 0.85
Habitat x Location 0.44 0.69
Habitat x Management 1.00 0.47
Landscape x Location 0.64 0.72
Landscape x Management 0.50 0.31
Location x Management 0.42 0.41
Habitat x Landscape x Location 0.12 0.19
Habitat x Landscape x Management 0.26 0.05
Habitat x Location x Management 0.14 0.08
Landscape x Location x Management 0.07 0.03
Habitat x Landscape x Location x Management 0 0
For tachinid abundance, six plausible models were selected (ΔAICc < 2, Table
S2). The sum of model weights for each predictor gave support for strong effects of
region, landscape, farm management, habitat, and trap location on tachinid abundance
(Table 1). This indicates that the tachinid abundance was higher in Central South (mean =
48.56 ± 5.72 SE) than North Midlands (21.38 ± 2.72 SE), higher in hotspots (42.63 ± 5.44
SE) than in coldspots (27.18 ± 3.43 SE) (Fig. 2b), higher in organic (43.47 ± 5.86 SE)
than in conventional (26.27 ± 2.61 SE) farms (Fig. 2a), higher in grasslands (42.09 ± 5.54
SE) than in arable crops (27.86 ± 3.35 SE), and higher in the field margins (48.26 ± 5.60
SE) than in the field centres (21.24 ± 2.84 SE). We also found a good support for two
interactions: management x habitat and landscape x habitat. The first interaction
(management x habitat) indicated that organic management exhibited higher abundance
than conventional management in arable fields but not in grassland fields (Fig. 3a).
Similarly, hotspots had a higher abundance than coldspots in arable fields but not in

Organic farming enhances parasitoid diversity
59
grasslands (Fig. 3b; landscape x habitat interaction). Although less strong, we found two
additional interactions: landscape x location and landscape x management. The first
interaction (landscape x location) indicated that the difference in abundance between field
margins and centres was less evident in hotspots than in coldspots. The second interaction
(landscape x management) indicated that in hotspots the abundance of tachinids on
conventional farms was more similar to that of organic farms.
Figure 2. Mean values (± SE) of tachinid abundance (a, b) and species richness (c, d) per farm
management (Con: conventional, Org: organic) and landscape composition (Cold: coldspot, Hot:
hotspot).
For tachinid species richness, 10 plausible models were selected (ΔAICc < 2,
Table S2). Similar to tachinid abundance, we found a strong effect of region, landscape,
farm management, habitat, and trap location on tachinid species richness (Table 1). This
indicates that the tachinid species richness was higher in Central South (3.28 ± 0.12 SE)
than North Midlands (2.18 ± 0.11 SE), higher in hotspots (3.02 ± 0.13 SE) than in
coldspots (2.43 ± 0.11 SE) (Fig. 2d), higher in organic (2.92 ± 0.13 SE) than in
conventional (2.52 ± 0.11 SE) farms (Fig. 2c), higher in arable crops (2.80 ± 0.13 SE)
than in grasslands (2.64 ± 0.12 SE), and higher in the field margins (3.36 ± 0.13 SE) than
in the field centres (2.08 ± 0.10 SE). As above, we also found strong support for an
interaction between landscape and habitat, where hotspots displayed higher species
richness than coldspots in arable fields, but not in grasslands (Fig. 3d). Although less

Chapter III
60
supported, we found two additional interactions: habitat x location and landscape x
location. These interactions indicate that the differences in species richness between field
margins and centres were less evident in grasslands than in arable crops and in hotspots
than in coldspots. We further found that fixed effects explained the majority of the
variability of the mixed model containing all the parameters with a ΔAICc < 2.
Specifically, we found a pseudo-R2 of 0.30 for the proportion of variance explained by the
fixed factors alone, while for the proportion of variance explained by both the fixed and
random factors we found a pseudo-R2 of 0.32.
Figure 3. Interaction between management (Con: conventional, Org: organic) and habitat (a, c)
and between landscape and habitat (b, d) on tachinid log-abundance and log-species richness.
Dots represent mean values and bars represent the SE.
Discussion
Our study indicates a positive effect of organic farming on tachinid parasitoid diversity at
multiple spatial scales. We found higher abundance and species richness both on organic
farms and in hotspot landscapes. However, the tachinid parasitoid response was complex
and various interactions between the organic farming and local habitat were found. In
particular, the positive effect of organic management was clear for arable fields while it
was almost neutral for grasslands, either at the local or at the landscape scale. These
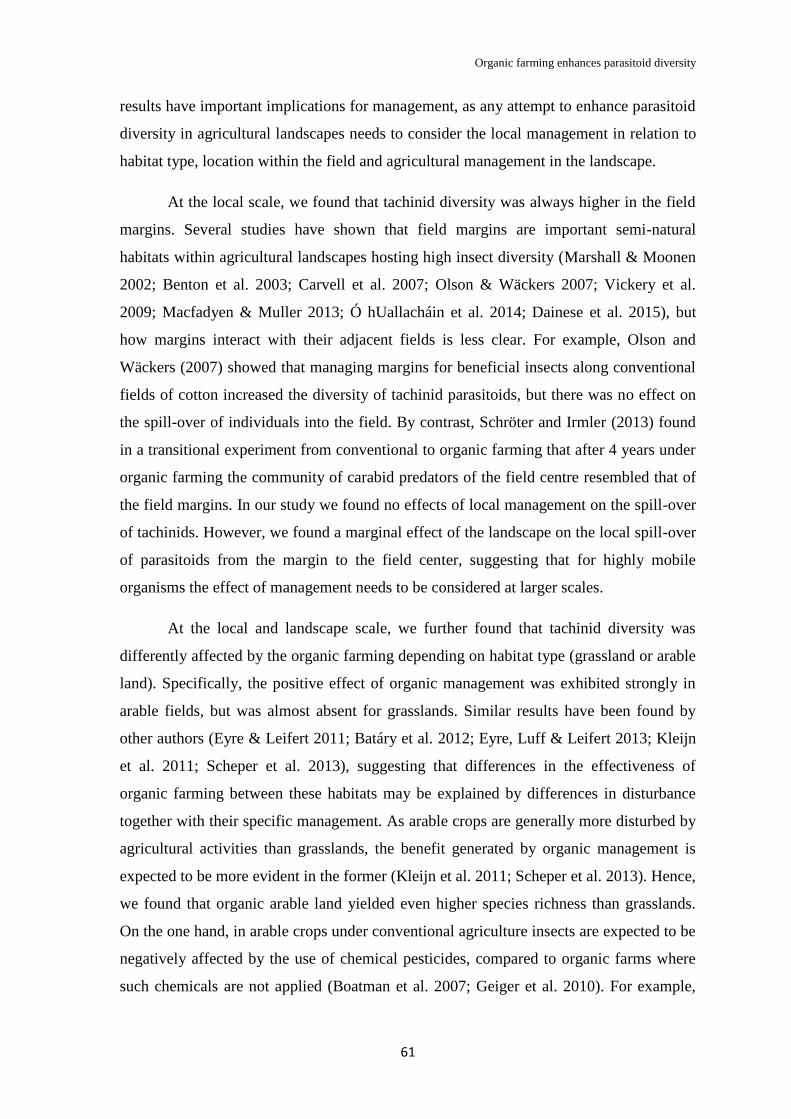
Organic farming enhances parasitoid diversity
61
results have important implications for management, as any attempt to enhance parasitoid
diversity in agricultural landscapes needs to consider the local management in relation to
habitat type, location within the field and agricultural management in the landscape.
At the local scale, we found that tachinid diversity was always higher in the field
margins. Several studies have shown that field margins are important semi-natural
habitats within agricultural landscapes hosting high insect diversity (Marshall & Moonen
2002; Benton et al. 2003; Carvell et al. 2007; Olson & Wäckers 2007; Vickery et al.
2009; Macfadyen & Muller 2013; Ó hUallacháin et al. 2014; Dainese et al. 2015), but
how margins interact with their adjacent fields is less clear. For example, Olson and
Wäckers (2007) showed that managing margins for beneficial insects along conventional
fields of cotton increased the diversity of tachinid parasitoids, but there was no effect on
the spill-over of individuals into the field. By contrast, Schröter and Irmler (2013) found
in a transitional experiment from conventional to organic farming that after 4 years under
organic farming the community of carabid predators of the field centre resembled that of
the field margins. In our study we found no effects of local management on the spill-over
of tachinids. However, we found a marginal effect of the landscape on the local spill-over
of parasitoids from the margin to the field center, suggesting that for highly mobile
organisms the effect of management needs to be considered at larger scales.
At the local and landscape scale, we further found that tachinid diversity was
differently affected by the organic farming depending on habitat type (grassland or arable
land). Specifically, the positive effect of organic management was exhibited strongly in
arable fields, but was almost absent for grasslands. Similar results have been found by
other authors (Eyre & Leifert 2011; Batáry et al. 2012; Eyre, Luff & Leifert 2013; Kleijn
et al. 2011; Scheper et al. 2013), suggesting that differences in the effectiveness of
organic farming between these habitats may be explained by differences in disturbance
together with their specific management. As arable crops are generally more disturbed by
agricultural activities than grasslands, the benefit generated by organic management is
expected to be more evident in the former (Kleijn et al. 2011; Scheper et al. 2013). Hence,
we found that organic arable land yielded even higher species richness than grasslands.
On the one hand, in arable crops under conventional agriculture insects are expected to be
negatively affected by the use of chemical pesticides, compared to organic farms where
such chemicals are not applied (Boatman et al. 2007; Geiger et al. 2010). For example,
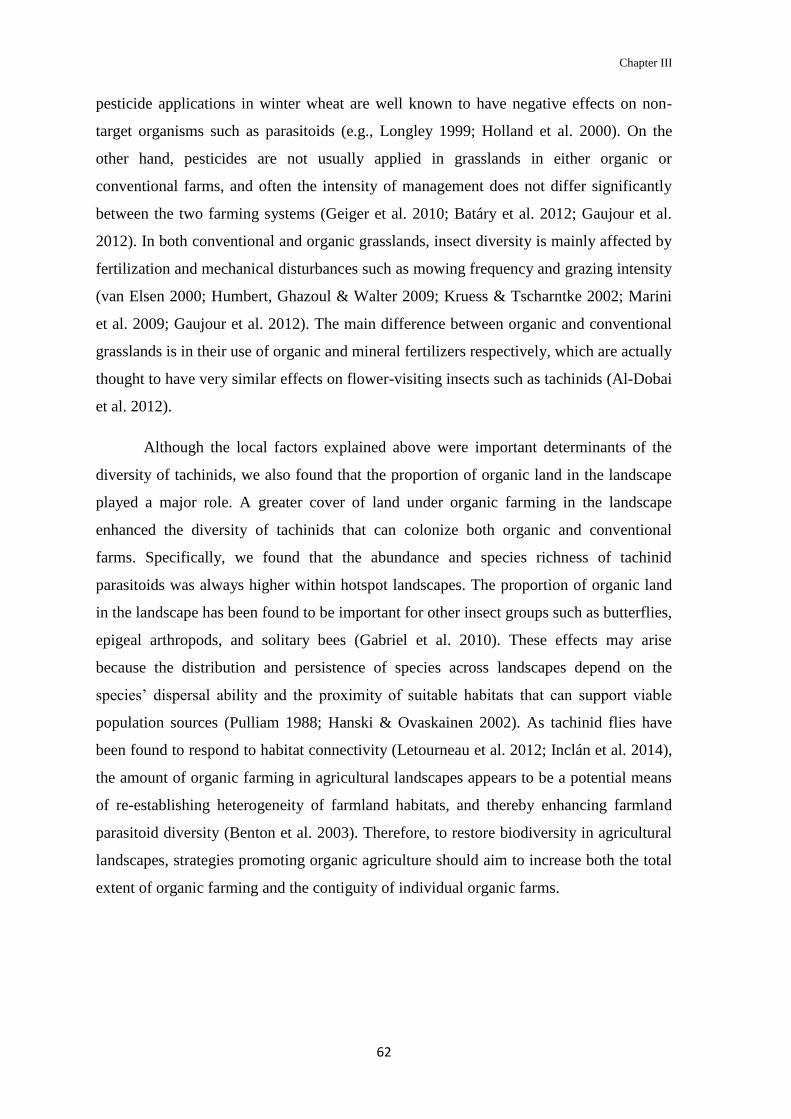
Chapter III
62
pesticide applications in winter wheat are well known to have negative effects on non-
target organisms such as parasitoids (e.g., Longley 1999; Holland et al. 2000). On the
other hand, pesticides are not usually applied in grasslands in either organic or
conventional farms, and often the intensity of management does not differ significantly
between the two farming systems (Geiger et al. 2010; Batáry et al. 2012; Gaujour et al.
2012). In both conventional and organic grasslands, insect diversity is mainly affected by
fertilization and mechanical disturbances such as mowing frequency and grazing intensity
(van Elsen 2000; Humbert, Ghazoul & Walter 2009; Kruess & Tscharntke 2002; Marini
et al. 2009; Gaujour et al. 2012). The main difference between organic and conventional
grasslands is in their use of organic and mineral fertilizers respectively, which are actually
thought to have very similar effects on flower-visiting insects such as tachinids (Al-Dobai
et al. 2012).
Although the local factors explained above were important determinants of the
diversity of tachinids, we also found that the proportion of organic land in the landscape
played a major role. A greater cover of land under organic farming in the landscape
enhanced the diversity of tachinids that can colonize both organic and conventional
farms. Specifically, we found that the abundance and species richness of tachinid
parasitoids was always higher within hotspot landscapes. The proportion of organic land
in the landscape has been found to be important for other insect groups such as butterflies,
epigeal arthropods, and solitary bees (Gabriel et al. 2010). These effects may arise
because the distribution and persistence of species across landscapes depend on the
species’ dispersal ability and the proximity of suitable habitats that can support viable
population sources (Pulliam 1988; Hanski & Ovaskainen 2002). As tachinid flies have
been found to respond to habitat connectivity (Letourneau et al. 2012; Inclán et al. 2014),
the amount of organic farming in agricultural landscapes appears to be a potential means
of re-establishing heterogeneity of farmland habitats, and thereby enhancing farmland
parasitoid diversity (Benton et al. 2003). Therefore, to restore biodiversity in agricultural
landscapes, strategies promoting organic agriculture should aim to increase both the total
extent of organic farming and the contiguity of individual organic farms.

Organic farming enhances parasitoid diversity
63
Conclusions
Our results have important implications for parasitoid conservation in agricultural
landscapes. In particular, any attempt to enhance parasitoid diversity, by means of organic
management, needs to consider the local management in relation to habitat type and
agricultural management in the landscape. At the local scale, organic management in
arable fields is clearly enhancing tachinid diversity, while the management of organic
grasslands needs to be reconsidered (Batary et al. 2012). As it has been shown by other
authors, the effects of AES measures increase with the size of the ecological contrast
created by the measure (Kleijn et al. 2011; Scheper et al. 2013). The contrast between
conventional and organic wheat fields is much higher than that between conventional and
organic grasslands. Therefore, to increase the biodiversity of grasslands, organic
management should aim to enhance heterogeneity and to modify management practices
such as mowing and grazing intensity (Humbert et al. 2009; Gaujour et al. 2012). At the
landscape scale, our results exemplify how landscapes with higher proportion of organic
land improved the overall diversity of tachinid parasitoids. Conventional farms had 42
and 18% higher tachinid abundance and species richness in organic landscapes than in
landscapes with high cover of conventional agriculture. Thus, as the benefits of organic
management spread beyond the borders of individual farms, any economic assessment of
the costs and benefits of organic farming should incorporate these “positive externalities”
that are not captured in the farms’ balance sheets. To restore parasitoid diversity in
agricultural landscapes, the promotion of organic agriculture (i.e. as an AES strategy)
should aim to increase both the total extent of organic farming and the connectivity of
individual organic farms. Subsequently, the biodiversity restored by the implementation
of organic management (either at the local or landscape scale) could support important
ecosystem services. As organic management increased the abundance of tachinid
parasitoids (by about 40%), the pest control in these systems is expected to be greater.
Additionally, as tachinid parasitoids have a wide range of hosts, increasing their diversity
would increase also the potential to control a wide spectrum of pests (i.e. the two most
abundant species in our study attack two completely different host groups). Furthermore,
we expect that the results found here on tachinid parasitoids, could be extended to other
groups of insect parasitoids. However, to justify and facilitate the increase of organic
farming, future research is still needed to demonstrate the specific contribution of
parasitoids to key ecosystem services such as biological control.

Chapter III
64
Acknowledgements
We thank the farmers, the field and laboratory assistants and the RELU SCALE team for
collaboration. The research was funded as part of the UK Research Councils’ Rural
Economy and Land Use Programme (RELU) (RES-227-25-0006). DJI was supported by
a PhD Fellowship from the CARIPARO Foundation. LM was supported by the European
Community's Seventh Framework Programme under grant agreement no 311781,
LIBERATION Project (www.fp7liberation.eu).

Organic farming enhances parasitoid diversity
65
Supplementary Material
Table S1. Tachinid species and their abundance in the study sites.
Species Total of individuals
Actia infantula (Zetterstedt, 1844) 1
Actia lamia (Meigen, 1838) 1
Admontia maculisquama (Zetterstedt, 1859) 2
Bithia spreta (Meigen, 1824) 2
Catharosia pygmaea (Fallén, 1815) 4
Compsilura concinnata (Meigen, 1824) 2
Demoticus plebejus (Fallén, 1810) 1
Dexia rustica (Fabricius, 1775) 1
Dexiosoma caninum (Fabricius, 1781) 1
Dinera grisescens (Fallén, 1817) 94
Drino lota (Meigen, 1824) 1
Dufouria chalybeata (Meigen, 1824) 2
Epicampocera succincta (Meigen, 1824) 44
Eriothrix rufomaculata (DeGeer, 1776) 2524
Exorista larvarum (Linnaeus, 1758) 3
Exorista rustica (Fallén, 1810) 113
Freraea gagatea Robineau-Desvoidy, 1830 2
Loewia foeda (Meigen, 1824) 3
Lydella grisescens Robineau-Desvoidy, 1830 40
Lydella stabulans (Meigen, 1824) 3
Macquartia grisea (Fallén, 1810) 1
Macquartia praefica (Meigen, 1824) 2
Medina separata (Meigen, 1824) 2
Meigenia incana (Fallén, 1810) 1
Meigenia mutabilis (Fallén, 1810) 322
Nemorilla maculosa (Meigen, 1824) 3
Nowickia ferox (Panzer, 1809) 17
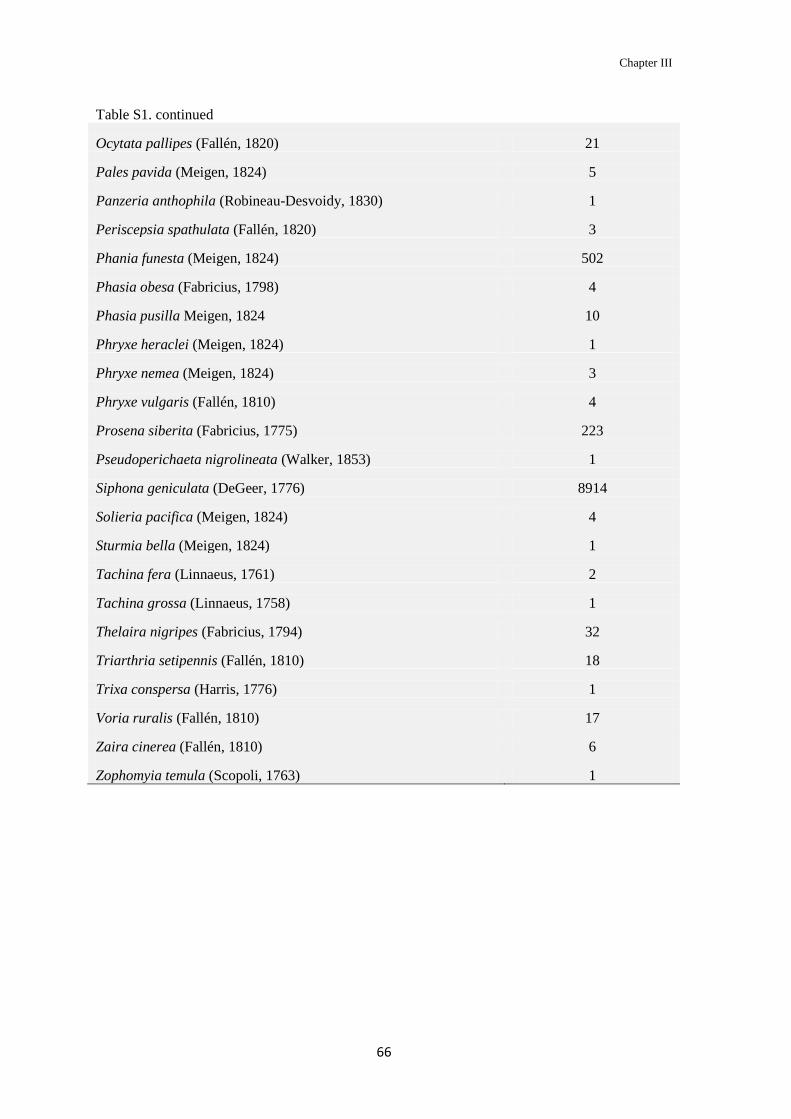
Chapter III
66
Table S1. continued
Ocytata pallipes (Fallén, 1820) 21
Pales pavida (Meigen, 1824) 5
Panzeria anthophila (Robineau-Desvoidy, 1830) 1
Periscepsia spathulata (Fallén, 1820) 3
Phania funesta (Meigen, 1824) 502
Phasia obesa (Fabricius, 1798) 4
Phasia pusilla Meigen, 1824 10
Phryxe heraclei (Meigen, 1824) 1
Phryxe nemea (Meigen, 1824) 3
Phryxe vulgaris (Fallén, 1810) 4
Prosena siberita (Fabricius, 1775) 223
Pseudoperichaeta nigrolineata (Walker, 1853) 1
Siphona geniculata (DeGeer, 1776) 8914
Solieria pacifica (Meigen, 1824) 4
Sturmia bella (Meigen, 1824) 1
Tachina fera (Linnaeus, 1761) 2
Tachina grossa (Linnaeus, 1758) 1
Thelaira nigripes (Fabricius, 1794) 32
Triarthria setipennis (Fallén, 1810) 18
Trixa conspersa (Harris, 1776) 1
Voria ruralis (Fallén, 1810) 17
Zaira cinerea (Fallén, 1810) 6
Zophomyia temula (Scopoli, 1763) 1
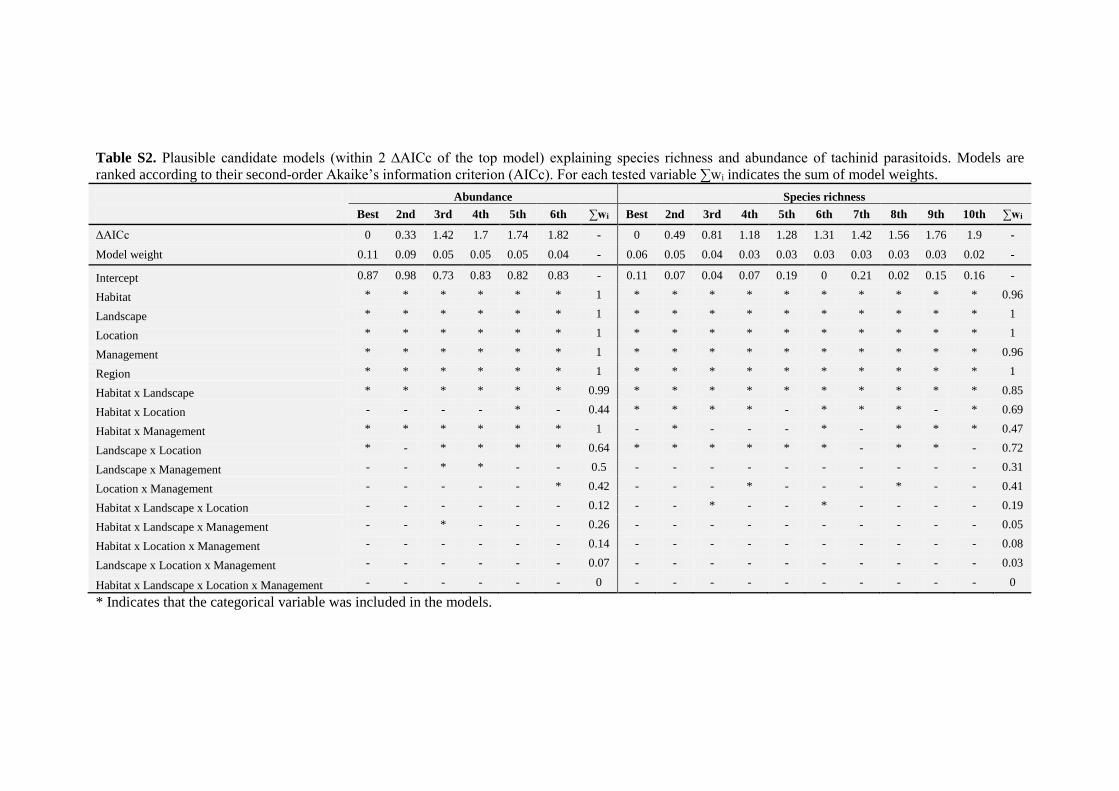
Table S2. Plausible candidate models (within 2 ∆AICc of the top model) explaining species richness and abundance of tachinid parasitoids. Models are
ranked according to their second-order Akaike’s information criterion (AICc). For each tested variable ∑wi indicates the sum of model weights.
Abundance Species richness
Best 2nd 3rd 4th 5th 6th ∑wi Best 2nd 3rd 4th 5th 6th 7th 8th 9th 10th ∑wi
ΔAICc 0 0.33 1.42 1.7 1.74 1.82 - 0 0.49 0.81 1.18 1.28 1.31 1.42 1.56 1.76 1.9 -
Model weight 0.11 0.09 0.05 0.05 0.05 0.04 - 0.06 0.05 0.04 0.03 0.03 0.03 0.03 0.03 0.03 0.02 -
Intercept 0.87 0.98 0.73 0.83 0.82 0.83 - 0.11 0.07 0.04 0.07 0.19 0 0.21 0.02 0.15 0.16 -
Habitat * * * * * * 1 * * * * * * * * * * 0.96
Landscape * * * * * * 1 * * * * * * * * * * 1
Location * * * * * * 1 * * * * * * * * * * 1
Management * * * * * * 1 * * * * * * * * * * 0.96
Region * * * * * * 1 * * * * * * * * * * 1
Habitat x Landscape * * * * * * 0.99 * * * * * * * * * * 0.85
Habitat x Location - - - - * - 0.44 * * * * - * * * - * 0.69
Habitat x Management * * * * * * 1 - * - - - * - * * * 0.47
Landscape x Location * - * * * * 0.64 * * * * * * - * * - 0.72
Landscape x Management - - * * - - 0.5 - - - - - - - - - - 0.31
Location x Management - - - - - * 0.42 - - - * - - - * - - 0.41
Habitat x Landscape x Location - - - - - - 0.12 - - * - - * - - - - 0.19
Habitat x Landscape x Management - - * - - - 0.26 - - - - - - - - - - 0.05
Habitat x Location x Management - - - - - - 0.14 - - - - - - - - - - 0.08
Landscape x Location x Management - - - - - - 0.07 - - - - - - - - - - 0.03
Habitat x Landscape x Location x Management - - - - - - 0 - - - - - - - - - - 0
* Indicates that the categorical variable was included in the models.


Landscape effect on parasitoid spillover
71
Abstract
The intensification of agriculture has led to a severe simplification of agricultural
landscapes, resulting in a marked reduction in the diversity of insect natural enemies.
However, how this simplification shapes the community composition of insect parasitoids
is still unclear. We examined the potential spillover of tachinid parasitoids from semi-
natural habitats into apple orchards across different landscapes. We sampled commercial
apple orchards localized in landscapes characterized by different proportions of crop and
non-crop habitats (forest and grasslands) to first evaluate if increasing the cover of semi-
natural habitats will affect the local species richness of apple orchards. Second, we tested
whether the contribution of forest and grassland habitats to the local tachinid community
composition of apple orchards changes according to landscape composition. We found
that increasing the cover of semi-natural habitats did not affect local tachinid species
richness in apple orchards, while it strongly affected the species composition.
Independently of the landscape, we found highly nested communities of tachinids
between apple orchards and forest habitats suggesting a strong spillover of tachinids
between these habitats. In contrast, tachinids in apple orchards were nested with grassland
habitats when the proportion of semi-natural habitats was very low. Our results have
important implications for the conservation of insect parasitoids in agricultural
landscapes, as the spillover of species in agricultural land can be affected by the type and
the proportion of semi-natural habitats in the surrounding landscape.
Introduction
In the last decades, the intensification of agriculture has led to a severe simplification of
agricultural landscapes (Swift et al. 1996; Tilman et al. 2001). This simplification has
been caused by an increase of the size of crop fields and a marked reduction of the
remaining natural and semi-natural habitats, which has resulted in landscapes dominated
by only a few crop types (Robinson & Sutherland 2002; Tscharntke et al. 2012). The
simplification of agricultural landscapes has resulted in a marked reduction of the
diversity of insect natural enemies with possible negative effects on pest control service
(Wilby & Thomas 2002; Bianchi et al. 2006; Thies et al. 2011; Jonsson et al. 2012).
Although the overall negative effects of landscape simplification on the species richness
Chapter IV
72
of natural enemies are relatively well known (e.g., Macfadyen & Muller 2013; Inclán et
al. 2014; Martinson & Fagan 2014), how this process shapes the community composition
of important natural enemies such as parasitoids is still unclear.
The ecological contrast between habitats within intensive agricultural landscapes
is an important factor determining the spillover of species between these habitats.
Therefore, the contrast between agricultural and semi-natural habitats will determine
species immigration and emigration (Polis et al. 1997; Schellhorn et al. 2014). Several
authors have found species flow from natural habitats into adjacent agricultural fields
(e.g., Landis et al. 2000; Geiger et al. 2008; Rusch et al. 2010; Blitzer et al. 2012), but
dispersal in the opposite direction has also been found (e.g., Tscharntke et al. 2005; Rand
et al. 2006; Blitzer et al. 2012; Frost et al. 2014). This spillover of parasitoids has also
been shown to affect important ecosystem services such as natural pest suppression
(Landis et al. 2000; Macfadyen & Muller 2013; Gagic et al. 2014). Although it is clear
that the spillover of organisms like parasitoids can affect trophic interactions in the
recipient habitat (Tscharntke et al. 2005; Rand & Louda 2006; Rand et al. 2006; Klapwijk
& Lewis 2012; Macfadyen & Muller 2013; Martinson & Fagan 2014), how the spillover
of parasitoids change in relation to specific habitats within different landscapes is still a
little understood topic.
Studies about spillover of natural enemies from natural habitats into adjacent
agricultural fields have focused on predators with limited dispersal range like most
ground-dwelling predators (e.g., see review of Blitzer et al. 2012) and less attention has
been paid on the spillover of more mobile organisms such as parasitoids (although see
Olson & Wäckers 2007; Macfadyen & Muller 2013; Frost et al. 2014). Furthermore, the
majority of these studies have focused on the effects on species richness, ignoring the
effects on species composition (but see Gagic et al. 2014). In this work, we used tachinid
flies (Diptera: Tachinidae) as a model group to investigate the spillover of a highly
mobile and diverse group of parasitoids. The family Tachinidae, with almost 8,500
species, ranks second in diversity within the Diptera and is the most diverse group of non-
hymenopteran parasitoids (Stireman et al. 2006; O’Hara 2013). Tachinids can be very
important natural enemies because of their predominance in attacking major groups of
insect herbivores as lepidopterans, coleopterans and hemipterans (Stireman et al. 2006;
Cerretti et al. 2014). In this study, we examined the spillover of tachinid parasitoids from
two semi-natural habitats into agricultural land in contrasting landscapes. Specifically, we

Landscape effect on parasitoid spillover
73
sampled commercial apple orchards localized in landscapes characterized by different
proportions of crop and non-crop habitats (forest and grasslands). Specifically, we have
addressed three main hypotheses. First, we expected that increasing the cover of semi-
natural habitats will increase the local species richness of apple orchards. Higher species
richness in apple orchards located in forest- or grassland-dominated landscapes will
indicate a high spillover between these habitats. Therefore, a significant interaction
between local habitat and landscape will be indicative of spillover between habitats.
Second, as we expected that the spillover will vary across different habitats and
landscapes, we tested the contribution of forest and grassland habitats to the local
diversity of apple orchards located in landscapes with different proportions of semi-
natural habitats. We used an index of nestedness to compare the species composition
between crop and non-crop habitats. Third, due to the high mobility and relatively low
specialization of tachinids, we expected that the spillover of tachinids will not be limited
by distance. In particular, we tested the role of dispersal in shaping the spillover of
species by testing the distance-decay of similarity within habitats across different
landscapes.
Methods
Study area
The research was conducted within an area of c. 160 km2 in the province of Trento, NE
Italy. Specifically, the sites were located within an elevation of 450–600 m across the
Valsugana Valley, in the southern European Alps. The study region is in one of the major
apple production areas of Europe with ∼12,000 ha of intensive orchards. In recent
decades, there has been a dramatic landscape homogenization that has created large areas
covered exclusively by apple orchards (Marini et al. 2012). Within these homogenous
landscapes, it is still possible to find some scattered orchards located in a non-crop matrix
composed mainly of grasslands and forests. Apple orchards, forests and grasslands
represented the main land uses in the region. Apple orchards, mainly the variety ‘Golden
Delicious’, are characterized by a highly specialized conventional management with only
very few organic or traditionally managed orchards. Grassland habitats are usually
heavily fertilized (>150 kg N ha−1 yr−1) and mown 2–4 times per year resulting in dense

Chapter IV
74
swards dominated by grasses and with low forb abundances (see Marini et al. 2008).
Forest habitats are mainly composed of Scots pine mixed with broad-leaf tree species
(mainly Fraxinus ornus L. and Ostrya carpinifolia Scop.).
Table 1. Habitat composition by each type of landscape. The mean and SE were calculated from
the percentage of coverage of each habitat within a 500 m radius.
Landscape type Apple orchards Forests Grasslands
mean SE mean SE mean SE
Apple-dominated 52.78 6.13 19.09 5.12 14.25 4.38
Forest-dominated 9.18 2.55 65.73 5.49 20.15 6.01
Grassland-dominated 11.93 3.28 10.92 3.42 67.75 2.87
Sampling design
Twenty-one commercial apple orchards were selected in landscapes characterized by
different proportions of crop and non-crop habitats. We selected seven orchards in
landscapes (0.5 km radius) dominated by apple plantations, seven in landscapes
dominated by forests and seven in landscapes dominated by grasslands (Table 1).
Landscapes were selected to be separated by at least 1 km (mean minimum distance = 2.2
km) and only three landscapes were separated by a shorter distance (0.8 km). Within each
landscape three sites representing apple, forest and grassland habitats were selected (Fig.
1). The three sites were separated by no more than 60 m and were located in the centroid
of each landscape (Fig. 1c). We identified the habitats embedded in the three landscape
classes by quantifying the landscape composition within a 500 m radius around the
centroid of the three selected habitats using detailed land-use maps (Servizio Urbanistica,
Provincia di Trento) in ArcGIS 10 (ESRI®). For each selected landscape, we quantified
the cover of apple, forests and grasslands. For each landscape, we selected the habitats
with about the same local management and located at elevations between 450 and 600 m
such that the management and elevation did not differ among the three landscape classes.

Landscape effect on parasitoid spillover
75
Figure 1. Experimental design showing the tree local habitats (forest, grassland and apple
orchards; square blocks in the center of each landscape) sampled across (a) forest-dominated, (b)
grassland-dominated and (c) apple-dominated landscapes (circles). As shown in (c), the
landscapes were based on a radius of 500 m and each of the three habitats was located in its
centroid, each one separated by no more of 60 m. As shown in (b), within each landscape the
relativized nestedness (Nrel) was calculated for each pair of habitats: A-G (Apple - Grassland), A-
F (Apple - Forest) and F-G (Forest - Grassland).
Insect sampling
Pan-trap sampling was conducted across the 21 landscapes. Within each landscape, the
three habitats were sampled using three clusters of pan-traps. Within each habitat, each
cluster of traps was separated by 25 m. Each cluster of traps consisted of one standard
yellow and two UV-reflecting yellow plastic bowls (500 ml, 16 cm diameter) filled with a
solution of water and 3% dishwashing detergent (Sole TM). Within each cluster, pan-
traps were placed on the ground, each one separated about one meter from each other.
The cluster position was kept fixed within each habitat, leaving a distance of at least 10
meters from the borders and avoiding areas completely covered by shrubs. The sampling
was conducted between July and September 2013. A total of four samplings were
performed covering the main season during which the insects were active. During each
sampling round, traps were set for a period of 48 hours after which insects were retrieved
and stored in alcohol (70%) for sorting and identification. The specimens belonging to the
Tachinidae (Diptera) were identified to species level using Cerretti (2010) and Cerretti et
al. (2012). All the specimens were housed in the insect collection of P. Cerretti at the
Museo di Zoologia, Università di Roma La Sapienza, Rome, Italy (MZUR).
Statistical analyses
(i) Species richness analysis
To test whether tachinid species richness responded differently to local habitat and
landscape composition, we used a generalized linear mixed model (GLMM) with a
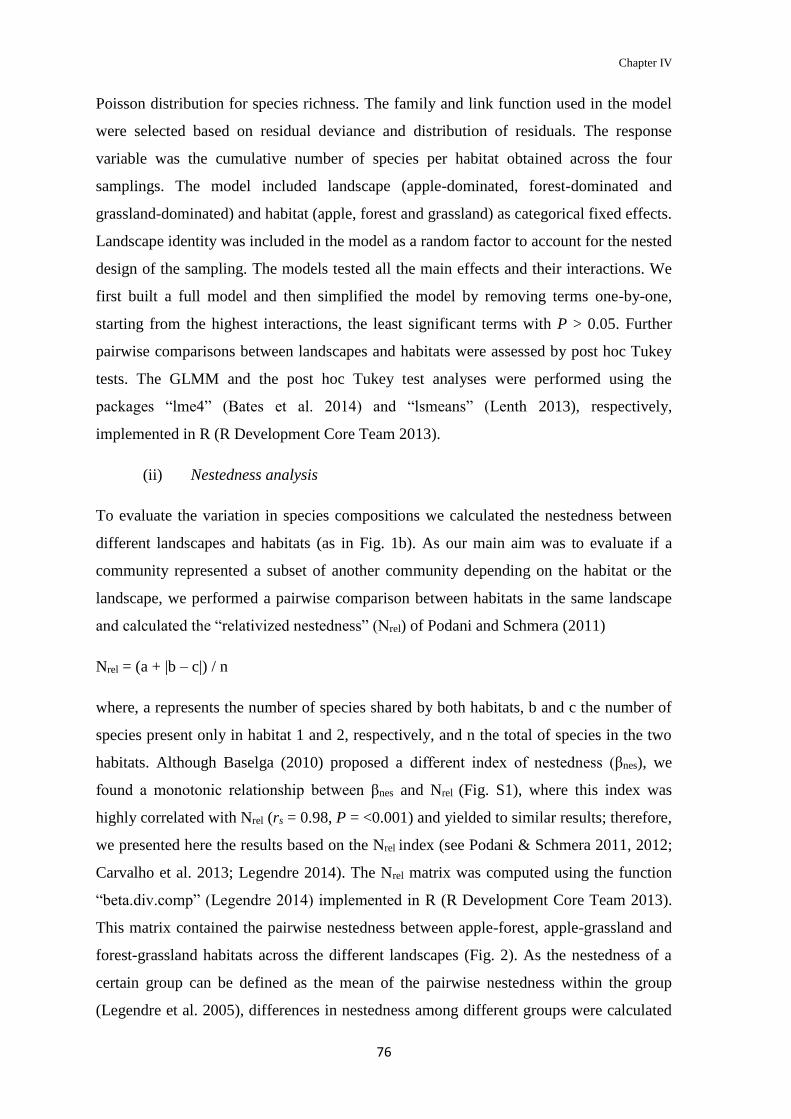
Chapter IV
76
Poisson distribution for species richness. The family and link function used in the model
were selected based on residual deviance and distribution of residuals. The response
variable was the cumulative number of species per habitat obtained across the four
samplings. The model included landscape (apple-dominated, forest-dominated and
grassland-dominated) and habitat (apple, forest and grassland) as categorical fixed effects.
Landscape identity was included in the model as a random factor to account for the nested
design of the sampling. The models tested all the main effects and their interactions. We
first built a full model and then simplified the model by removing terms one-by-one,
starting from the highest interactions, the least significant terms with P > 0.05. Further
pairwise comparisons between landscapes and habitats were assessed by post hoc Tukey
tests. The GLMM and the post hoc Tukey test analyses were performed using the
packages “lme4” (Bates et al. 2014) and “lsmeans” (Lenth 2013), respectively,
implemented in R (R Development Core Team 2013).
(ii) Nestedness analysis
To evaluate the variation in species compositions we calculated the nestedness between
different landscapes and habitats (as in Fig. 1b). As our main aim was to evaluate if a
community represented a subset of another community depending on the habitat or the
landscape, we performed a pairwise comparison between habitats in the same landscape
and calculated the “relativized nestedness” (Nrel) of Podani and Schmera (2011)
Nrel = (a + |b – c|) / n
where, a represents the number of species shared by both habitats, b and c the number of
species present only in habitat 1 and 2, respectively, and n the total of species in the two
habitats. Although Baselga (2010) proposed a different index of nestedness (βnes), we
found a monotonic relationship between βnes and Nrel (Fig. S1), where this index was
highly correlated with Nrel (rs = 0.98, P = <0.001) and yielded to similar results; therefore,
we presented here the results based on the Nrel index (see Podani & Schmera 2011, 2012;
Carvalho et al. 2013; Legendre 2014). The Nrel matrix was computed using the function
“beta.div.comp” (Legendre 2014) implemented in R (R Development Core Team 2013).
This matrix contained the pairwise nestedness between apple-forest, apple-grassland and
forest-grassland habitats across the different landscapes (Fig. 2). As the nestedness of a
certain group can be defined as the mean of the pairwise nestedness within the group
(Legendre et al. 2005), differences in nestedness among different groups were calculated
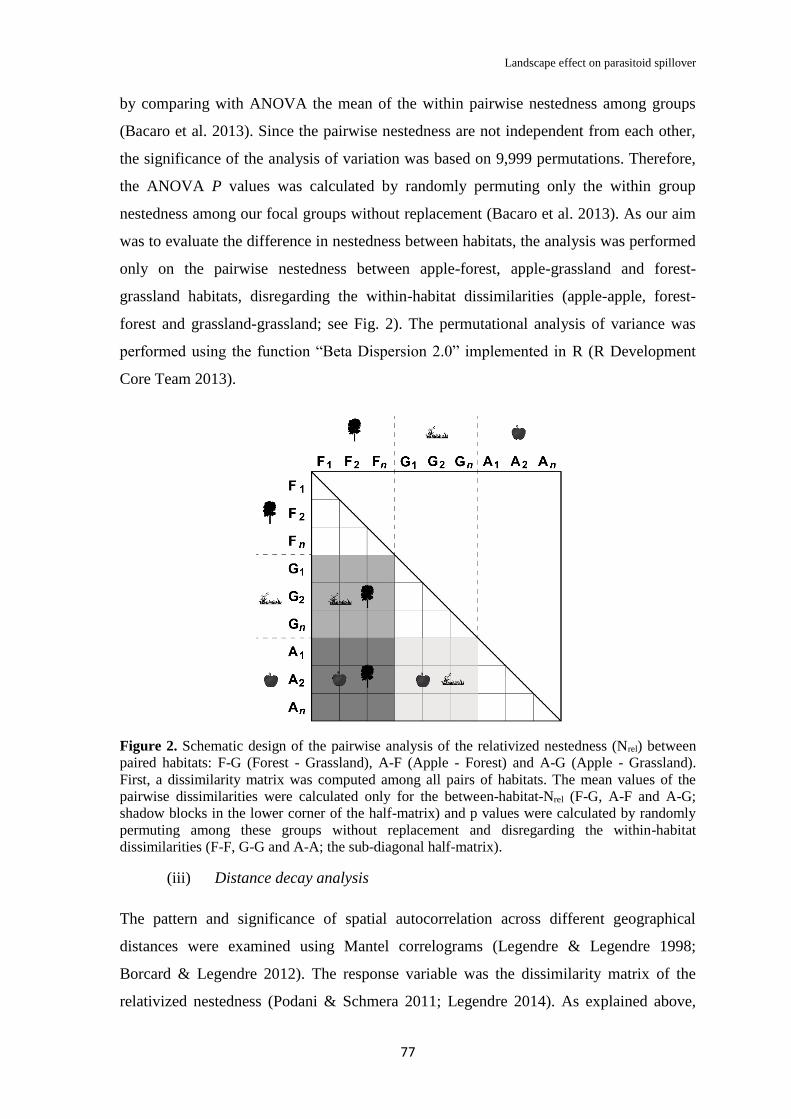
Landscape effect on parasitoid spillover
77
by comparing with ANOVA the mean of the within pairwise nestedness among groups
(Bacaro et al. 2013). Since the pairwise nestedness are not independent from each other,
the significance of the analysis of variation was based on 9,999 permutations. Therefore,
the ANOVA P values was calculated by randomly permuting only the within group
nestedness among our focal groups without replacement (Bacaro et al. 2013). As our aim
was to evaluate the difference in nestedness between habitats, the analysis was performed
only on the pairwise nestedness between apple-forest, apple-grassland and forest-
grassland habitats, disregarding the within-habitat dissimilarities (apple-apple, forest-
forest and grassland-grassland; see Fig. 2). The permutational analysis of variance was
performed using the function “Beta Dispersion 2.0” implemented in R (R Development
Core Team 2013).
Figure 2. Schematic design of the pairwise analysis of the relativized nestedness (Nrel) between
paired habitats: F-G (Forest - Grassland), A-F (Apple - Forest) and A-G (Apple - Grassland).
First, a dissimilarity matrix was computed among all pairs of habitats. The mean values of the
pairwise dissimilarities were calculated only for the between-habitat-Nrel (F-G, A-F and A-G;
shadow blocks in the lower corner of the half-matrix) and p values were calculated by randomly
permuting among these groups without replacement and disregarding the within-habitat
dissimilarities (F-F, G-G and A-A; the sub-diagonal half-matrix).
(iii) Distance decay analysis
The pattern and significance of spatial autocorrelation across different geographical
distances were examined using Mantel correlograms (Legendre & Legendre 1998;
Borcard & Legendre 2012). The response variable was the dissimilarity matrix of the
relativized nestedness (Podani & Schmera 2011; Legendre 2014). As explained above,

Chapter IV
78
the Nrel matrix was computed using the function “beta.div.comp” (Legendre 2014).
Following the Nrel matrix, the distance matrix was constructed based on the geographical
distance between each pair of habitats. Spatial autocorrelation was evaluated using 11 lag
intervals. Each interval was 2.4 km wide, ranging from 1.2 to 26.2 km. Mantel correlation
coefficients were calculated for each lag interval and tested for significance with a
permutation test, using 1,999 permutations. Each distance class was tested for
significance using a Bonferroni-corrected α of 0.01 (Legendre & Legendre 1998). The
spatial autocorrelation analysis was performed using the function “mantel.correlog” in the
“vegan” package (Oksanen et al. 2013) implemented in R (R Development Core Team
2013).
Results
General results
A total of 2,617 individuals were collected belonging to 110 species of Tachinidae (Table
S1). Forty specimens that were not possible to identify to species level (e.g., some
females of Exorista Meigen and Meigenia Robineau-Desvoidy) were excluded from the
analyses. Two species were dominant and accounted for more than 70% of the total
abundance. Voria ruralis (Fallén) and Phania funesta (Meigen) represented 63% and 9%
of the individuals collected, respectively. Voria ruralis is a parasitoid of lepidopteran
larvae while P. funesta is a parasitoid of hemipterans (Cerretti 2010). Additionally, the
species Linnaemya zachvatkini Zimin and Oswaldia eggeri (Brauer & Bergenstamm)
were recorded for the first time in Italy.
Table 2. Results from the generalized linear mixed model testing the effects of habitat and
landscape on tachinid species richness.
df Chi-Square P value
Habitat 2 60.35 < 0.001
Landscape 2 9.57 < 0.001
Habitat x Landscape 4 11.3 0.02
Species richness
For tachinid species richness, we found that increasing the cover of semi-natural habitats
did not increase the local species richness of apple orchards. Specifically, we found a

Landscape effect on parasitoid spillover
79
significant effect of habitat and landscape (Table 2), where forest habitats and forest
landscapes had the highest species richness (Fig. 3). Pairwise comparisons between
habitats showed that each habitat was different within each other (Tukey HSD; P <
0.001). Pairwise comparisons between landscapes showed that apple landscapes were
significantly different from forest landscapes (Tukey HSD; P = 0.002), while grasslands
were not different from apple (Tukey HSD; P = 0.22) and forest (Tukey HSD; P = 0.18)
landscapes. We further found an interaction between landscape and habitat (Table 2),
where the species richness on forest habitats was higher on forest landscapes (Fig. 3).
Specifically, the species richness on apple and grassland habitats did not differ across
different landscapes (Tukey HSD; P > 0.1). In contrast, the species richness on forest
habitats was higher on forest landscapes, being similar to that of grassland landscapes
(Tukey HSD; P = 0.15), but significantly different to that of apple landscapes (Tukey
HSD; P = 0.001).
Figure 3. Interaction between habitat (Apple, Forest, and Grassland) and landscape composition
(Apple-dominated, Forest-dominated, and Grassland-dominated) on tachinid species richness.
Dots indicate mean values and bars the SE.
Nestedness
For the relativized nestedness, we found a significant effect of habitat (P = 0.001) and
landscape (P = 0.001). At the local scale, apple orchards were highly nested with forest
habitats (Nrel = 0.66 ± 0.02), contrasting with the lower nestedness between apple and
grassland (Nrel = 0.52 ± 0.02) and grassland and forest (Nrel = 0.49 ± 0.02) habitats. At the
landscape scale, we found the highest nestedness within apple landscapes (Nrel = 0.64 ±
0.02), contrasting with the lower nestedness within forest (Nrel = 0.53 ± 0.02) and

Chapter IV
80
grassland (Nrel = 0.51 ± 0.02) landscapes. We further found an interaction between
landscape and habitats (Fig. 4), where the Nrel on apple-forest (P = 0.03) and apple-
grassland (P = 0.001) habitats was significantly different across different landscapes,
contrasting with the Nrel of forest-grassland (P = 0.67) habitats that were similar across
the different landscapes. Specifically, we found that apple habitats were highly nested
with forest habitats mainly on apple landscapes (Nrel = 0.73 ± 0.04), being lower on forest
(Nrel = 0.64 ± 0.04) and grassland (Nrel = 0.62 ± 0.03) landscapes. Similarly, apple
habitats were highly nested with grassland habitats only in apple landscapes (Nrel = 0.71 ±
0.04), being lower on forest (Nrel = 0.43 ± 0.04) and grassland (Nrel = 0.43 ± 0.03)
landscapes. Contrastingly, we found that the nestedness between grassland and forest did
not change across different landscapes.
Figure 4. Interaction between pairs of habitat (Apple - Forest, Apple - Grass and Forest -
Grassland) and landscape composition (Apple-dominated, Forest-dominated, and Grassland-
dominated) on the tachinid relativized nestedness (Nrel). Dots indicate mean values and bars the
SE.
Distance decay
We found no spatial structure with geographical distance indicating that the species were
not dispersal limited in our study area. We did not find significant correlation between the
relativized nestedness of different habitats and geographical distance. At all the distances,
the Mantel correlations were not significant (Table S2).

Landscape effect on parasitoid spillover
81
Discussion
Our results show a potential high spillover of tachinid parasitoids from semi-natural
habitats into apple orchards. Although increasing the cover of semi-natural habitats did
not affect the local tachinid species richness in apple orchards, we found evidence of
spillover at the community level. However, the tachinid parasitoid response was complex
and various interactions between the habitat type and proportion of semi-natural habitats
were found. Tachinid species inhabiting apple orchards were likely to be a subset of the
forest or the grassland habitats, but this depended on the landscape type. Specifically, the
highly nested community of tachinids between apple orchards and forest habitats suggest
a strong spillover of tachinids between these habitats. In contrast, tachinids in apple
orchards were nested with grassland habitats only when the proportion of semi-natural
habitats was low. Our results have important implications for the conservation of insect
parasitoids in agricultural landscapes, as the spillover of species in agricultural land can
be affected by the type and the proportion of semi-natural habitats in the surrounding
landscape.
As crop fields can be hostile environments for the persistence of natural enemies,
the surrounding natural habitats represent a key element for their survival. Parasitoids are
known to benefit from natural and semi-natural areas, as these habitats provide alternative
host species, energy sources for adults, over-wintering sites and/or pesticide-free zones
(Tscharntke et al. 2007; Schellhorn et al. 2014). Although several studies have shown that
the proportion of natural habitats within agricultural fields can influence the abundance
and species richness of insect parasitoids (e.g., Bianchi et al. 2006; Tscharntke et al.
2007; Klapwijk & Lewis 2012; Veres et al. 2013; Schellhorn et al. 2014), the contribution
of local habitat and landscape to the composition of parasitoid communities remains less
clear (but see Gagic et al. 2014). While in our study the coverage of semi-natural habitats
did not affect the species richness of tachinid parasitoids in apple orchards, we found
evidence for a spillover as the tachinid community inhabiting these habitats were highly
nested depending on the type and the proportion of semi-natural habitats in the landscape.
Independently of the proportion of forest in the landscape, the tachinid community
composition of apple orchards was likely to be a subset of the forest habitats. In contrast,
tachinids in apple orchards were nested with grassland habitats only on landscapes
dominated by apple orchards. Thus, the diversification of agricultural landscapes have the

Chapter IV
82
potential to enhance spillover of parasitoid communities, but further considerations
related to the type and spatial configuration of semi-natural habitats need to be
considered.
Landscapes with high proportions of semi-natural habitats have been hypothesized
to promote a higher parasitoid diversity as these have a more favorable arrangement of
crop and non-crop habitats in relation to simple landscapes with low extents of semi-
natural habitats (Bianchi et al. 2006; Tscharntke et al. 2012). Although we found that
semi-natural habitats can act as sources of parasitoid diversity in agricultural landscapes,
increasing the proportion of semi-natural areas did not always enhance the spillover of
parasitoids. The type, area and the spatial arrangement of semi-natural habitats are
important features affecting the spatial distribution of species (Dunning et al. 1992; Polis
et al. 1997; Tscharntke et al. 2012; Schellhorn et al. 2014). According to Dunning et al.
(1992), these features can affect the movement of species between patches in the
landscape depending on four ecological process: (1) “landscape complementation” and
(2) “landscape supplementation” occur when species depend on resources of different
habitats that are non-substitutable or substitutable, respectively; (3) “source-sink
dynamics” occurs when particular patches act as a source of species that disperse to less
productive patches; and (4) “the neighborhood effect” appears when species are more
affected by the characteristics of the surrounding patch than by more distance patches. In
our study, the spillover of tachinids is likely to be affected by one or more of these
processes depending on the configuration of the landscape. For instance, the spillover
between forest and apple habitats could be the result of species searching for alternative
resources (landscape supplementation) and/or species from forest habitats emigrating to
apple orchards (source-sink dynamics). In contrast, different processes could act on
grassland habitats (i.e. the neighborhood effect), as the spillover of tachinids between
grasslands and apple orchards is likely to be affected by the large ecological contrast of
the two habitats, as well as the size and distribution of these habitats (Dunning et al. 1992;
Polis et al. 1997; Tscharntke et al. 2012). Therefore, as the proportion of semi-natural
grasslands increases in the landscape the spillover of tachinids species from grasslands to
apple orchards is less likely to occur when species may find all the resources to complete
their life cycles within the semi-natural habitat and/or they are not dispersal limited
(Klapwijk & Lewis 2012). However, in landscapes dominated by agricultural land species

Landscape effect on parasitoid spillover
83
cannot persist in the reduced semi-natural habitat and are more likely to explore for
alternative resources in the crop landscape.
The dispersal of parasitoid species is linked to their movement and navigation
capacity (Godfray 1994; Klapwijk & Lewis 2012; Schellhorn et al. 2014). Here, we found
no spatial structure with geographical distance in the tachinid community, suggesting that
the species were not dispersal limited in our study area. Tachinids, like many other
parasitoids, are known to use diverse cues to forage for resources, starting with long-
range cues (i.e. location of the habitat of their hosts using plant volatiles) and short-range
cues (i.e., finding a suitable host by host kairomones and/or visual cues) (Godfray 1994;
Stireman 2002; Ichiki et al. 2013). Thus, as the search for alternative hosts in the
landscape could change in different species the spillover will also depend on how
parasitoid species can perceive the environment. This could explain the low nestedness
between forest and grassland habitats, as these habitats are structurally different and
parasitoids are likely to avoid the movement between these habitats. Therefore, the
spillover of parasitoids may be influenced by the specialization of species on different
cues (e.g., Stireman 2002; Ichiki et al. 2013) that can be related to a specific set of
habitats within the landscape. These results are also in line with the edge-permeability
hypothesis (Stamps et al. 1987), where habitats with high degree of contrast are expected
to be relatively impermeable to movement, while similar habitats are likely to be more
permeable. Although we found that different compositions of semi-natural habitats in the
landscape affect the species spillover to apple orchards, the spillover of species into crops
with different structure and phenology may be affected in different ways. Further
empirical studies considering how the community of parasitoids changes across different
spatio-temporal scales within different arrangements of crop and non-crop habitats are
needed.
Conclusions
The majority of studies testing the effects on spillover have focused on the effects on
species richness of natural enemies, ignoring the changes of community composition.
Here we found that increasing the cover of semi-natural habitats did not affect the local
tachinid species richness in apple orchards, but it strongly affected the parasitoid species

Chapter IV
84
composition. Although we found that semi-natural habitats can act as sources of
parasitoid diversity in agricultural landscapes, increasing the proportion of semi-natural
areas did not always enhance the spillover of parasitoids. The type, area and the spatial
arrangement of semi-natural habitats are important features affecting the tachinid
community composition. This is of particular importance in simplified landscapes (i.e.
our apple-dominated landscape) where the spillover of parasitoids is likely to depend on
the semi-natural areas present in these landscapes. Our results have important
implications for the conservation of parasitoids and semi-natural habitats in agricultural
landscapes, as the diversification of agricultural landscapes have the potential to enhance
spillover of parasitoid communities depending on the type and the proportion of semi-
natural habitats in the surrounding landscape.
Acknowledgements
We would like to thank to Jim O’Hara and Simone Fattorini who provided helpful
comments on earlier versions of this manuscript. This study was partially supported by
the European Community’s Seventh Framework Programme under grant agreement no
311781, LIBERATION Project (www.fp7liberation.eu) to LM. DJI was supported by a
PhD Fellowship from the CARIPARO Foundation.
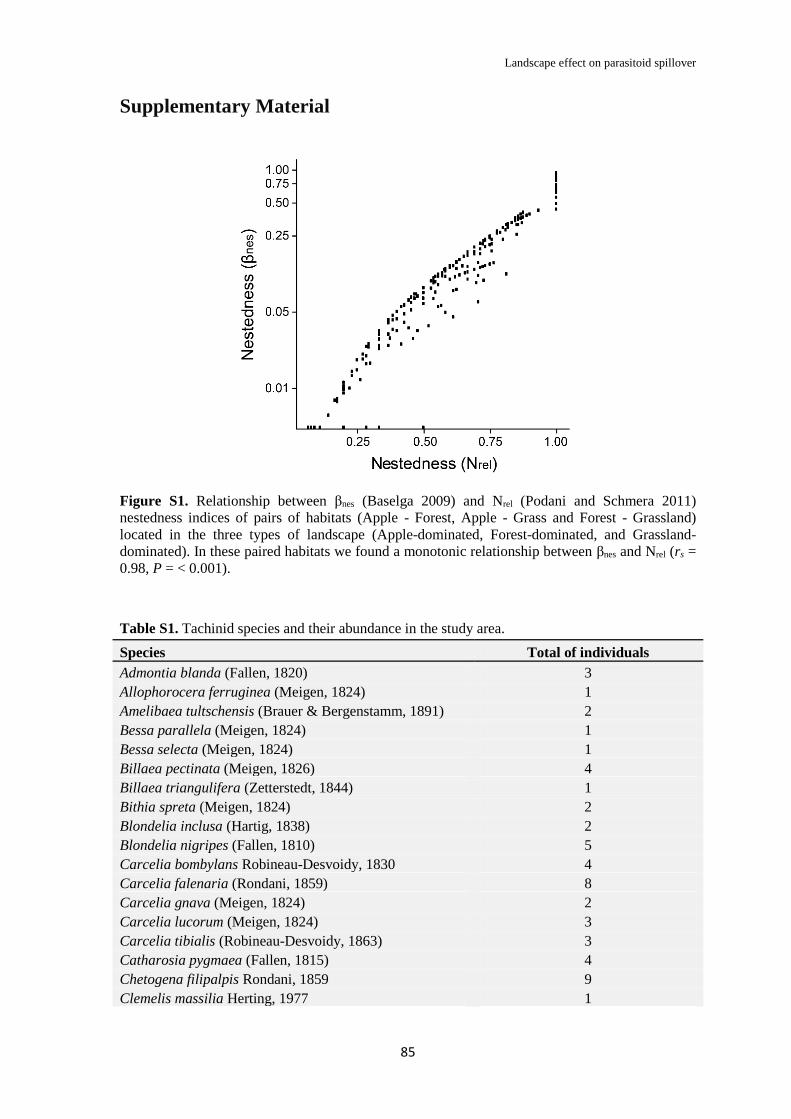
Landscape effect on parasitoid spillover
85
Supplementary Material
Figure S1. Relationship between βnes (Baselga 2009) and Nrel (Podani and Schmera 2011)
nestedness indices of pairs of habitats (Apple - Forest, Apple - Grass and Forest - Grassland)
located in the three types of landscape (Apple-dominated, Forest-dominated, and Grassland-
dominated). In these paired habitats we found a monotonic relationship between βnes and Nrel (rs =
0.98, P = < 0.001).
Table S1. Tachinid species and their abundance in the study area.
Species Total of individuals
Admontia blanda (Fallen, 1820) 3
Allophorocera ferruginea (Meigen, 1824) 1
Amelibaea tultschensis (Brauer & Bergenstamm, 1891) 2
Bessa parallela (Meigen, 1824) 1
Bessa selecta (Meigen, 1824) 1
Billaea pectinata (Meigen, 1826) 4
Billaea triangulifera (Zetterstedt, 1844) 1
Bithia spreta (Meigen, 1824) 2
Blondelia inclusa (Hartig, 1838) 2
Blondelia nigripes (Fallen, 1810) 5
Carcelia bombylans Robineau-Desvoidy, 1830 4
Carcelia falenaria (Rondani, 1859) 8
Carcelia gnava (Meigen, 1824) 2
Carcelia lucorum (Meigen, 1824) 3
Carcelia tibialis (Robineau-Desvoidy, 1863) 3
Catharosia pygmaea (Fallen, 1815) 4
Chetogena filipalpis Rondani, 1859 9
Clemelis massilia Herting, 1977 1

Chapter IV
86
Table S1. continued
Clemelis pullata (Meigen, 1824) 1
Compsilura concinnata (Meigen, 1824) 19
Cylindromyia bicolor (Olivier, 1812) 2
Cylindromyia brassicaria (Fabricius, 1775) 2
Cyrtophleba ruricola (Meigen, 1824) 3
Dexia vacua (Fallen, 1817) 40
Dinera carinifrons (Fallen, 1817) 1
Dinera ferina (Fallen, 1817) 5
Dinera grisescens (Fallen, 1817) 153
Dionaea aurifrons (Meigen, 1824) 1
Drino lota (Meigen, 1824) 1
Drino atropivora (Robineau-Desvoidy, 1830) 4
Drino gilva (Hartig, 1838) 5
Epicampocera succincta (Meigen, 1824) 3
Eriothrix monticola (Egger, 1856) 5
Eriothrix rufomaculata (DeGeer, 1776) 2
Erythrocera nigripes (Robineau-Desvoidy, 1830) 3
Eumea linearicornis (Zetterstedt, 1844) 4
Eumea mitis (Meigen, 1824) 1
Eurysthaea scutellaris (Robineau-Desvoidy, 1848) 2
Exorista glossatorum (Rondani, 1859) 1
Exorista rustica (Fallen, 1810) 15
Freraea gagatea Robineau-Desvoidy, 1830 1
Gaedia connexa (Meigen, 1824) 1
Gymnosoma rotundatum (Linnaeus, 1758) 1
Hemyda obscuripennis (Meigen, 1824) 1
Hemyda vittata (Meigen, 1824) 1
Hubneria affinis (Fallen, 1810) 1
Labigastera forcipata (Meigen, 1824) 1
Leskia aurea (Fallen, 1820) 1
Linnaemya comta (Fallen, 1810) 31
Linnaemya frater (Rondani, 1859) 1
Linnaemya impudica (Rondani, 1859) 2
Linnaemya picta (Meigen, 1824) 2
Linnaemya soror Zimin, 1954 2
Linnaemya tessellans (Robineau-Desvoidy, 1830) 27
Linnaemya zachvatkini Zimin, 1954** 1
Litophasia hyalipennis (Fallen, 1815) 1
Loewia brevifrons (Rondani, 1856) 2
Loewia foeda (Meigen, 1824) 1
Loewia nudigena Mesnil, 1973 1
Lomachantha parra Rondani, 1859 1
Macquartia chalconota (Meigen, 1824) 1
Macquartia grisea (Fallén, 1810) 1
Macquartia pubiceps (Zetterstedt, 1845) 1
Macquartia tenebricosa (Meigen, 1824) 1
Medina luctuosa (Meigen, 1824) 1

Landscape effect on parasitoid spillover
87
Table S1. continued
Medina melania (Meigen, 1824) 3
Medina multispina (Herting, 1966) 8
Medina separata (Meigen, 1824) 19
Meigenia dorsalis (Meigen, 1824) 22
Meigenia majuscula (Rondani, 1859) 1
Meigenia mutabilis (Fallen, 1810) 16
Meigenia simplex Tschorsnig & Herting, 1998 3
Meigenia uncinata Mesnil, 1967 3
Microsoma exiguum (Meigen, 1824) 5
Nemoraea pellucida (Meigen, 1824) 27
Nilea hortulana (Meigen, 1824) 3
Oswaldia eggeri (Brauer & Bergenstamm, 1889)** 3
Pales pavida (Meigen, 1824) 11
Pales processioneae (Ratzeburg, 1840) 2
Paratryphera barbatula (Rondani, 1859) 11
Paratryphera bisetosa (Brauer & Bergenstamm, 1891) 1
Peleteria prompta (Meigen, 1824) 1
Peribaea tibialis (Robineau-Desvoidy, 1851) 13
Periscepsia prunaria (Rondani, 1861) 1
Periscepsia spathulata (Fallen, 1820) 6
Phania funesta (Meigen, 1824) 222
Phryxe nemea (Meigen, 1824) 27
Phryxe vulgaris (Fallen, 1810) 1
Platymya fimbriata (Meigen, 1824) 9
Prooppia nigripalpis (Robineau-Desvoidy, 1848) 4
Pseudoperichaeta nigrolineata (Walker, 1853) 1
Rhacodinella apicata (Pandelle, 1896) 10
Senometopia lena (Richter, 1980) 1
Senometopia separata (Rondani, 1859) 2
Siphona flavifrons Staeger, 1849 2
Siphona geniculata (De Geer, 1776) 1
Siphona paludosa Mesnil, 1960 6
Solieria fenestrata (Meigen, 1824) 35
Strongygaster globula (Meigen, 1824) 2
Sturmia bella (Meigen, 1824) 2
Tachina fera (Linnaeus, 1761) 16
Tachina magnicornis (Zetterstedt, 1844) 8
Thelaira leucozona (Panzer, 1809) 3
Thelaira nigripes (Fabricius, 1794) 3
Thelaira solivaga (Harris, 1780) 7
Triarthria setipennis (Fallen, 1810) 2
Vibrissina turrita (Meigen, 1824) 20
Voria ruralis (Fallen, 1810) 1615
Winthemia quadripustulata (Fabricius, 1794) 3
Zophomyia temula (Scopoli, 1763) 2
**Indicates new species recorded for Italy

Chapter IV
88
Table S2. Spatial autocorrelation between the relativized nestedness (Nrel) and the geographical
distance between pair of habitats (AxF, Apple x Forest; AxG, Apple x Grassland; GxF, Grassland
x Forest). Mantel correlation coefficients were calculated for each lag interval and tested for
significance with a permutation test, using 1,999 permutations. Each distance class was tested for
significance using a Bonferroni-corrected α of 0.01.
Nrel Distance class Distance (m) N Mantel.cor P (Mantel) P (corrected)
AxF
1 1296 234 -0.02 0.27 0.27
2 3788 170 0.01 0.44 0.88
3 6280 148 0.05 0.13 0.40
4 8772 316 0.00 0.48 1.00
5 11264 180 0.03 0.25 1.00
6 13755 176 -0.02 0.30 1.00
7 16247 162 -0.01 0.39 1.00
8 18739 110 0.05 0.08 0.68
9 21231 92 -0.05 0.17 1.00
10 23723 84 -0.01 0.46 1.00
11 26215 48 -0.05 0.20 1.00
AxG
1 1295 232 -0.04 0.16 0.16
2 3777 166 0.03 0.21 0.43
3 6260 152 0.07 0.06 0.17
4 8743 304 0.00 0.46 1.00
5 11225 194 0.00 0.46 1.00
6 13708 170 -0.03 0.22 1.00
7 16191 160 0.04 0.21 1.00
8 18673 116 0.02 0.30 1.00
9 21156 88 -0.07 0.12 1.00
10 23639 84 0.03 0.32 1.00
11 26121 52 -0.06 0.16 1.00
GxF
1 1278 230 -0.02 0.24 0.24
2 3771 174 -0.03 0.26 0.52
3 6265 146 -0.01 0.38 1.00
4 8759 312 0.04 0.12 0.47
5 11252 190 0.00 0.46 1.00
6 13746 168 0.01 0.48 1.00
7 16239 168 0.00 0.49 1.00
8 18733 108 0.03 0.24 1.00
9 21227 92 -0.08 0.05 0.43
10 23720 84 0.06 0.10 1.00
11 26214 48 0.00 0.46 1.00


Chapter V
91
Abstract
The intensification of agricultural systems has led to a rapid increase of arable land with a
consequent fragmentation of natural habitats, causing a reduction in the diversity of insect
natural enemies. The introduction of high-quality field margins has been proposed to
counteract this decline in farmland biodiversity, but how these margins can affect the
spillover of natural enemies between crop and non-crop habitats is still unclear. In this
work we investigated the spillover of two contrasting groups of natural enemies: the
Tachinidae and the Syrphidae. We examined the spillover from two types of field margin
(grass margin and hedgerow) into adjacent maize fields located in landscapes with
different proportion of arable land. The spillover of natural enemies can be affected by
field margins, but the response varied significantly between the two groups. For
hoverflies, abundance and richness was always higher toward the center of the crop fields
compared to the margin. In contrast, the complexity of field margins appeared to have a
positive effect on the diversity of tachinids, but this effect was not reflected in the
spillover of these parasitoids. The spillover of tachinids was related to the degree of
contrast between the margin and the crop as the spillover of this group was more evident
on the grass margin. Our results have important implications for the conservation of
natural enemies in fragmented landscapes. Measures focusing on the creation and
management of field boundaries need to consider the local contrast between field margins
and crops in relation to the dispersal ability of different taxa.
Introduction
The intensification of agricultural systems has led to a rapid increase of arable land with a
consequent fragmentation of natural habitats (Tilman et al. 2001). Agricultural landscapes
are often characterized by a mosaic of semi-natural habitats interspersed within a hostile
matrix dominated by only a few crops. These simplified landscapes are responsible for
the severe reduction in the diversity of insect natural enemies, which in turn is possibly
negatively affecting important ecological services such as the biological control of pests
(Wilby & Thomas 2002; Bianchi et al. 2006; MacFayden et al. 2009; Thies et al. 2011;
Jonsson et al. 2012). In Europe, agri-environment schemes (AES) have been implemented
to counteract this decline in farmland biodiversity. Within farms, the conservation and
Spillover of natural enemies
92
implementation of semi-natural elements such as hedgerows, field margins and
wildflower strips are among the most commonly interventions (Marshall & Moonen
2002; Haaland et al. 2011). Although there is growing empirical evidence suggesting that
the presence of these semi-natural elements can help to mitigate the negative effects of
agricultural intensification on insect diversity (e.g., Merckx et al. 2012; Haenke et al.
2014; Dainese et al. 2015), the understanding of how these farmland interventions affect
the spillover of natural enemies is still unclear.
The spillover of natural enemies represents the movement of species from one
habitat to another in search of specific resources (e.g., prey/hosts, nectar for adults,
shelter). In agricultural landscapes, the spillover of natural enemies is known to be
affected by the shape and the contrast of the different habitats within these landscapes
(Polis et al. 1997; Schellhorn et al. 2014). Habitats with high degree of contrast are
expected to be relatively impermeable to movement, while structurally similar habitats
are likely to be more permeable (Stamps et al. 1987). Furthermore, there is growing
evidence suggesting that the spillover of natural enemies is not only affected by local
variables such as the shape and contrast of habitats, but also by landscape processes (i.e.,
the proportion of forests and mass-flowering crops in the landscape, Haenke et al. 2014).
Several authors have found spillover of species from natural habitats into adjacent
agricultural fields (e.g., Landis et al. 2000; Geiger et al. 2008; Rusch et al. 2010; Blitzer
et al. 2012), but movement in the opposite direction has also been observed (e.g., Rand et
al. 2006; Blitzer et al. 2012; Frost et al. 2014). Although there are several studies showing
that the spillover of natural enemies can alter important ecosystem services such as
pollination and natural pest suppression (Landis et al. 2000; Macfadyen & Muller 2013;
Gagic et al. 2014; Haenke et al. 2014), most of these studies have focused on the
interactions of semi-natural habitats like forest and grassland patches with agricultural
fields, while little is known about the spillover of natural enemies from managed field
margins.
Studies about the spillover of natural enemies have often focused on single taxa
ignoring that dispersal dynamics can vary substantially across different groups of natural
enemies. While some groups of natural enemies are tightly associated to semi-natural
habitats and are highly sensitive to the fragmentation, other taxa are well adapted to
fragmented landscapes and are capable to use ephemeral and spatially patchy resources
(Tscharntke et al. 2005). In this work we investigated the potential spillover of two

Chapter V
93
contrasting groups of natural enemies: tachinids (Diptera: Tachinidae) and hoverflies
(Diptera: Syrphidae). On the one hand, the vast majority of tachinid parasitoids are
known to depend on semi-natural habitats in the landscape (Letourneau et al. 2012; Inclán
et al. 2014). On the other hand, several species of hoverflies are well-adapted to disturbed
habitats, where they can be commonly found in high densities (Meyer et al. 2009).
Besides these differences, both groups are important natural enemies as the predominance
of tachinid parasitoids in attacking major groups of insect herbivores (Stireman et al.
2006; Cerretti et al. 2014) and the prevalence of hoverflies as aphidophagous predators
(Alhmedi et al. 2008; Almohamad et al. 2009). Additionally, adults of both groups can
provide pollination service: tachinids are flower visiting insects given that they
commonly use nectar as an energy source (Stireman et al. 2006; Al-Dobai et al. 2012),
while hoverflies are well known pollinators of wild flowers and flowering-crops (e.g.,
Jauker & Wolters 2008; Haenke et al. 2014).
In this study, we examined the spillover of tachinids and hoverflies from two
contrasting field margins (grass margins and hedgerows) into the adjacent crop (maize
fields) located in landscapes with different proportion of arable land. Specifically, we
have addressed three main hypotheses. First, we expected that increasing the complexity
of field margin (grass margins vs. hedgerows) will enhance the diversity of natural
enemies. Here, we hypothesized that the diversity of tachinids and hoverflies would be
higher in hedgerows as these boundaries provide more diverse resources (i.e., diverse
hosts/preys) than grass margins. Second, we investigated if an increase of species
diversity in a given field margin is translated into an increased spillover to the adjacent
crop fields. According to the “edge-permeability hypothesis” (Stamps et al. 1987), it is
expected a greater spillover of natural enemies when the field margin is more structurally
similar to their adjacent crop. Therefore, we expected that natural enemies inhabiting
grass margins would be more likely to move into the adjacent maize field, while species
from hedgerows would be more likely to stay at the margin. Third, we expected that the
spillover of tachinids and hoverflies could be also affected by the landscape and that the
spillover of both groups of natural enemies would be more pronounced in landscapes with
low proportion of arable land (e.g., Haenke et al. 2014).
Spillover of natural enemies
94
Methods
Study area
The investigated area extended for about 10,000 km2 in the Venetian-Friulian Plain
(north-eastern Italy). The climate was humid sub-Mediterranean with annual rainfall
ranging between 1200 ‒ 1500 mm year-1 and a mean annual temperature of 13°C. The
majority of the study area (~ 65 %) was dominated by intensive agriculture where maize,
wheat, and soybean were the dominant crops. These intensive landscapes were intermixed
with scattered fragments of semi-natural habitats such as forests, grasslands and
hedgerows.
Sampling design
To identify the effect of agricultural intensification on the spill-over of natural enemies,
we first selected 12 landscapes to span a gradient in the proportion of arable land (19 ‒ 99
%). The landscape composition was assessed using a buffer with a 500 m radius. For each
buffer, arable fields were manually digitized from a visual inspection of high-resolution
satellite images (Google Earth). In GIS (Quantum GIS 1.7, Open Source Geospatial
Foundation Project, http://qgis.osgeo.org), we quantified the area of each patch and then
we calculated the proportion of arable land within each buffer.
To test the effect of different field margins on the spillover of natural enemies we
kept constant the crop type and we selected two contrasting field margins. In each
landscape, we selected two maize fields with two different field margins: (i) a grass
margin and (ii) a hedgerow. The grass margins were characterized by a perennial grass
strip without any nearby tree (average width 2.3 m), while the hedgerows consisted of a
grass strip adjacent to a hedge formed by a combination of different shrubs and tree
species (average width 2.5 m). To evaluate the spillover of species from the field margin
into the crop, we set up one transect of pan-traps in the middle of each field margin.
Within each transect, we sampled at six different distances, starting within the field
margin and at 0, 2, 6, 15 and 40 m into their adjacent maize field.

Chapter V
95
Insect sampling
We sampled hoverflies and tachinid flies using pan-traps. At the different distances (field
margin, 0, 2, 6, 15 and 40 m into the crop), one cluster of pan-traps was used. The cluster
of traps consisted of one standard yellow and one UV-reflecting yellow plastic bowls
(500 ml, 16 cm diameter) filled with a solution of water and 2% dishwashing detergent.
Within each cluster, pan-traps were placed directly on the ground between two crop rows,
each one separated one meter from the other. The sampling was done from the end of
May until the beginning of July 2013, allowing us to sample the maize fields when the
plants were less than 0.6 m tall. A total of four samplings were performed covering the
season during which the crop is more susceptible to insect pest attack (e.g., Showers
1993, Hance 1997). During each sampling round, traps were set for a period of 72 hours
after which insects were collected and stored in alcohol (70%) for sorting and
identification. Hoverflies were identified to species level using Bartsch (2009) and
Speight (2010), while tachinids were identified to species level using Cerretti (2010) and
Cerretti et al. (2012). All the specimens are housed at the MZUR (Museo di Zoologia,
Università di Roma La Sapienza, Rome, Italy) insect collection.
Data analysis
To test the effect of landscape composition, field margin and trap distance we used
general and generalized linear mixed models (GLMMs). The response variable was the
species richness and the total abundance calculated by pooling together the samples for
each taxon within each cluster of traps during the four samplings. For the abundance of
both taxa we used generalized linear mixed models with a negative binomial distribution
and for the species richness of both taxa we used general linear mixed models with a
normal distribution. The families and link functions used in the models were selected
based on residual deviance and distribution of residuals. In each model, field margin type
was entered as categorical fixed factor, while the proportion of arable land and the trap
distance were set as continuous fixed factors. Trap distance was further log-transformed
to account for the logarithmic scale of the distance in our sampling design. Interactions
between the proportion of arable land, field margin and trap distance were also tested. We
accounted for the nested design of our study by including the landscape identity (n = 12)
and the transect identity within each landscape (n = 24) as random factors. The analyses
were performed using the packages “glmmADMB” (Fournier et al. 2012) for generalized

Spillover of natural enemies
96
and “nlme” (Pinheiro et al. 2015) for general mixed models, implemented in R 3.0.2 (R
Development Core Team 2013).
To compare the fit of all the possible combinations of predictors in our models we
used the second-order Akaike’s information criterion (AICc) corrected for small samples
(Whittingham et al. 2006). We first built a global model containing all the interactions
among the proportion of arable land, field margin and trap distance. We compared all the
models using ΔAICc and Akaike weights (∑wi). The best fitting model was the one with
the lowest AICc. In a set of n models, each model i can be ranked using its difference in
AICc score with the best-fitting model (ΔAICci = AICci–AICc minimum). The difference
in AICc values indicated the relative support for the different models. A model was
considered plausible if its ΔAICc was below two (Burnham & Anderson 2002). To
evaluate the relative importance of each predictor, we summed the wi across the models
in the set in which the predictor occurred. The model inference analyses were performed
using the “MuMIn” package (Barton 2013) implemented in R (R Development Core
Team 2013).
Results
A total of 3,411 individuals were collected belonging to 30 species of Syrphidae (Table
S1). The species Melanostoma mellinum (L.) accounted for more than 70% of the total
hoverfly abundance. Melanostoma mellinum is an aphidophagous species commonly
found in disturbed habitats (Speight 2013). For Tachinidae, a total of 370 individuals
were collected belonging to 47 species (Table S2). Three species of tachinids were
dominant and accounted for more than 60% of the total abundance. Dinera grisescens
(Fallén), Microphthalma europaea Egger and Voria ruralis (Fallén) represented 32, 17
and 13% of the individuals collected, respectively. Dinera grisescens and M. europaea
are parasitoids of coleopteran larvae, while V. ruralis is a parasitoid of lepidopteran
larvae (Cerretti & Tschorsnig 2010; Cerretti 2010).

Chapter V
97
Table 1. Plausible candidate models (within 2 ∆AICc of the top model) explaining the abundance
and species richness of (a) Syrphidae and (b) Tachinidae. Models are ranked according to their
second-order Akaike’s information criterion (AICc). For each tested variable ∑wi indicates the
sum of model weights.
(a) Syrphidae
Abundance Species richness
∑wi Best 2nd 3rd 4th ∑wi Best
ΔAICc - 0 0.45 1.36 1.49 - 0
Model weight - 0.28 0.22 0.14 0.13 - 0.37
Intercept - 2.67 2.67 2.74 2.67 - 3.27
Arable land 0.54 - 0.29 - 0.2 0.34 -
Distance 1 0.12 0.12 0.12 0.12 0.86 0.21
Field margin 0.37 - - * - 0.35 -
Arable land x Distance 0.28 - -0.05 - - 0.08 -
Arable land x Field margin 0.06 - - - - 0.04 -
Distance x Field margin 0.14 - - - - 0.1 -
Arable land x Distance x Field margin 0.01 - - - - <0.01 -
(b) Tachinidae
ΔAICc - 0 1.74 - - - 0
Model weight - 0.47 0.2 - - - 0.37
Intercept - 1.22 1.22 - - - 2.13
Arable land 0.45 - -0.15 - - 0.44 -
Distance 1 -0.5 -0.45 - - 1 -0.45
Field margin 0.91 * * - - 0.8 *
Arable land x Distance 0.12 - - - - 0.15 -
Arable land x Field margin 0.15 - - - - 0.15 -
Distance x Field margin 0.87 * * - - 0.69 *
Arable land x Distance x Field margin 0.02 - - - - 0.02 -
* Indicates that the categorical variable was included in the models.
For hoverfly abundance, four plausible models were selected (ΔAICc < 2, Table
1a). The sum of model weights for each predictor gave support only for an effect of trap
distance (Table 1a, Fig. 1a). This indicated that the abundance of hoverflies was higher
toward the center of the crop field (edge: 19.8 ± 4.3, 0 m: 21.3 ± 3.1, 2 m: 21.7 ± 3.9, 6
m: 23.7 ± 3.6, 15 m: 25.9 ± 3.9, 40 m: 27.5 ± 3.2). For hoverfly species richness, only a
single plausible model was selected (ΔAICc < 2, Table 1a). Similar to the hoverfly
abundance, the sum of model weights for each predictor gave support only a strong effect
of trap distance (Table 1a, Fig. 1b). This indicated that the species richness of hoverflies
was higher toward the center of the crop field (edge: 2.9 ± 0.3, 0 m: 3.9 ± 0.4, 2 m: 3.6 ±
0.5, 6 m: 3.7 ± 0.4, 15 m: 3.4 ± 0.4, 40 m: 4.3 ± 0.4).

Spillover of natural enemies
98
Figure 1. Plots showing the contrasting spillover of two groups of natural enemies from field
margin into their adjacent crop field. The left panels show the (a) abundance and (b) species
richness of Syrphidae, while the right panels show the (c) abundance and (d) species richness of
Tachinidae. For both groups, the fitted line was estimated by a generalized linear mixed model for
abundance and by a general linear mixed model for species richness. The points represent the
partial residuals from the respective models.
For Tachinidae abundance, two plausible models were selected (ΔAICc < 2, Table
1b). The sum of model weights for each predictor gave support for a strong effect of trap
distance and field margin on tachinid abundance (Table 1b). The effect of the trap
distance was negative (Fig. 1c), which indicated that the abundance of tachinids
decreased toward the center of the crop field (edge: 7.4 ± 1.4, 0 m: 2.7 ± 0.7, 2 m: 2.0 ±
0.5, 6 m: 1.3 ± 0.4, 15 m: 1.0 ± 0.3, 40 m: 1.0 ± 0.3). The abundance of tachinids was
slightly higher in hedgerows (2.6 ± 0.5) than in grass margins (2.5 ± 0.5). We also found
a good support for the interaction between trap distance and field margin (Fig. 2a). This
interaction indicated that the decrease in abundance of tachinids toward the center of the
crop field was less evident for grass margins, while it was more pronounced for
hedgerows. For Tachinidae species richness, only a single plausible model was selected
(ΔAICc < 2, Table 1b). Similar to the tachinid abundance, the sum of model weights for

Chapter V
99
each predictor gave support for a strong effect of trap distance and field margin on
tachinid species richness (Table 1b). The effect of the trap distance was negative (Fig.
1d), which indicated that the species richness of tachinids decreased toward the center of
the crop field (edge: 3.5 ± 0.3, 0 m: 1.5 ± 0.3, 2 m: 1.2 ± 0.3, 6 m: 0.8 ± 0.2, 15 m: 0.7 ±
0.2, 40 m: 0.7 ± 0.1). The species richness of tachinids was slightly higher in hedgerows
(1.5 ± 0.2) than in grass margins (1.3 ± 0.2). We also found a support for the interaction
between trap distance and field margin (Fig. 2b). This interaction indicates that the trend
of decrease in species richness toward the center of the crop field is less evident for grass
margins than for hedgerows.
Figure 2. Plots showing the interaction between the field margin and the spillover into their
adjacent crop field of tachinid parasitoids. The top and the bottom panel represent the relationship
between trap distance and (a) abundance and (b) species richness of tachinids separately for grass
and hedgerow. Each fitted line was estimated by a generalized linear mixed model for abundance
and by a general linear mixed model for species richness. The partial residuals from the respective
models are shown as points for grass margins and as triangles for hedgerows.

Spillover of natural enemies
100
Discussion
Our results showed that the spillover of natural enemies can be affected by field margin
type, but the response varied significantly between hoverflies and tachinids. Field
margins (both grass margins and hedgerows) appeared to not affect the movement of
hoverflies, as their abundance and species richness was slightly higher toward the center
of the crop fields. Conversely, tachinids were almost restricted to the field margins and
their spillover varied depending on the type of margin. The spillover of tachinids
appeared to be related to the degree of contrast between the structure of the margin and
the crop, as the spillover of this group was more evident on the grass margins. These
results have important implications for the conservation of natural enemies in crop fields,
as the local spillover of species can be affected by the type of field margins.
The effect of the different field margins on the diversity of natural enemies varied
considerably between tachinids and hoverflies. Although we expected that increasing the
local complexity will enhance the diversity of both groups of natural enemies, we found
only a positive effect of hedgerows on the diversity of tachinid parasitoids. This result is
in line with previous studies where increasing the complexity of field margins yielded a
higher diversity of tachinids (Olson & Wäckers 2007; Al-Dobai et al. 2012; Dainese et al.
2015). In contrast, the type field margin appeared to have no effect on the diversity of
hoverflies. In fact, the diversity of this group was always higher in the crop field rather
than in the field margin. These results are not surprising giving that hoverflies, especially
the aphidophagous species, are known to be highly associated with the abundance of prey
in the crop (Salveter 1998; Meyer et al. 2009).
The spillover also varied between the two groups of natural enemies. Tachinid
parasitoids showed a limited spillover as the abundance and species richness of this group
at 40 meters in the crop field was at least four times lower than that in the field margin.
Similar results have been found by other studies that show a high diversity of tachinids at
the field margin, contrasting with the low diversity within the crop fields (Olson &
Wäckers 2007; Inclán et al. 2015). In contrast, hoverflies showed large spillover of
individuals and species between the field margins and the crop as their abundance and
species richness at 40 meters in the crop field was only slightly higher than that in the
field margins. This result suggests a strong association of the hoverfly community with
the crop fields. A similar pattern has been found in other studies, where the abundance of

Chapter V
101
species dominated by aphidophagous hoverflies tended to increase in arable land
(Salveter 1998; Jauker et al. 2009; Meyer et al. 2009; Haenke et al. 2014). In fact,
Wratten et al. (2003) found that field boundaries within agricultural land could even
represent a barrier for the movement of hoverflies.
The increase of tachinid parasitoid diversity in hedgerows was not translated into
an increasing spillover to the adjacent crop fields. Instead, we found that tachinid
parasitoids inhabiting grass margins were more likely to move into their adjacent maize
field, contrasting with the lower spillover of tachinids from hedgerows. This result is in
line with the “edge-permeability hypothesis” (Stamps et al. 1987) that suggests that
species are more likely to move across edges of low contrast (i.e., with similar structure).
Tachinids, as many other parasitoids, are known to use diverse combination of cues to
forage for resources (i.e., host kairomones and/or visual cues). For instance, finding a
suitable habitat is the first approach for the location of host (Godfray 1994; Stireman
2002; Ichiki et al. 2013). Therefore, tachinids occurring in grass margins are likely to go
into the maize field, since the community in these margins could perceive the maize field
as a similar habitat. In contrast, tachinids occurring in hedgerows may recognize the
maize fields as a complete different habitat and they may avoid foraging. Contrary to
tachinids, we did not find any interaction between the type of field margin and the trap
distance for hoverfly diversity. Independently of the type of field margin, the diversity of
hoverflies was always higher toward the center of the crop field, suggesting that the
aphidophagous species in this group may even avoid the field margins (Salveter 1998;
Wratten et al. 2003; Jauker et al. 2009) as they search for resources (i.e. prey abundance)
in the agricultural matrix.
The reduction of the cover of arable land at the landscape scale was expected to
enhance the spillover of both groups of natural enemies, but contrary to our expectations
we did not find any effect of the increment of arable land on the diversity of tachinids and
hoverflies. This may be explained by the generalist host/prey association and the high
mobility of tachinids (Stireman 2002; Stireman et al. 2006) and hoverflies (e.g., Wratten
et al. 1995; Salveter 1998; Jauker et al. 2009; Alhmedi et al. 2008; Almohamad et al.
2009). In hoverflies, the lack of response to the semi-natural habitats in the landscape is
probably related to the response of the aphidophagous species. Several authors have
found a positive relationship between the aphidophagous species and the increment of

Spillover of natural enemies
102
arable land, as these flies are likely to find their prey mainly in arable fields (Burgio &
Sommaggio 2007; Jauker et al. 2009; Meyer et al. 2009; Haenke et al. 2014).
Pest control is an important ecosystem service that often depends on the spillover
of natural enemies from the semi-natural areas. Here we demonstrated that the spillover
of natural enemies is likely to depend not only on the environmental features such as
margin quality, but also on the related life history traits (i.e., dispersal behavior) of each
taxon. In fact, the distribution patterns of natural enemies in agricultural landscapes are
known change considerably across different taxa (Dullei & Obrist 2003; Tscharntke et al.
2005). On the one hand, tachinid parasitoids are likely to follow a “disperser” or
“ecotone-species” distribution, as these parasitoids depend mainly on non-crop habitats
and their distribution into the crop fields decrease with the distance from the non-crop
habitats. On the other hand, hoverflies, especially the aphidophagous species, are likely to
follow a “cultural species” distribution, as they depend largely on crop resources and their
distribution increases toward the crop area. However, these patterns of distribution may
change across different seasons (e.g., Haenke et al. 2014) and further research is still
needed to evaluate the temporal variability of the spillover across different taxa.
Conclusions
Our results have important implications for the conservation of natural enemies in
agricultural landscapes. In particular, the implementation of field margins to enhance the
diversity and spillover of natural enemies needs to consider the local contrast between the
field margin and the crop in relation to the dispersal and foraging behavior of the focal
taxa. Although several authors have proposed the implementation of complex field
margins to improve farmland biodiversity (e.g., Merckx et al. 2012; Dainese et al. 2015),
it is clear that this measure can enhance the diversity of some groups with little or no
effect on the diversity of crop-specialized natural enemies. While the implementation of
both simple and complex field margins clearly enhanced the diversity of tachinid
parasitoids, this measure had little effect on cultural-species like aphidophagous
hoverflies that are more affected by the management of the crop land. However, it must
be considered that species apparently restricted to crop land, like aphidophagous
hoverflies, may still use resources from the field margins in different seasons that could
Chapter V
103
vary depending on the crop phenology (Meyer et al. 2009; Haenke et al. 2014). Our
results suggest that different measures should be adopted to enhance the diversity of
different groups of natural enemies. Furthermore, farmland interventions, such as the
implementation of field boundaries, should focus not only in the enhancement of the local
diversity of natural enemies, but also in the spillover of these species into their adjacent
field crops. As the spillover of tachinid parasitoids was favored by the low contrast
between the grass margins and the maize fields, it appears that the implementation of
grass margins may have a greater impact in landscapes with annual crops, while the
implementation of hedgerows may have a greater impact in landscapes dominated by
perennial crops. However, to justify and facilitate different combinations of field margins,
future research is still needed to demonstrate effective spillover between different field
margins and crops across multiple spatial and temporal scales.
Acknowledgements
DJI was supported by a PhD Fellowship from the CARIPARO Foundation. MD was
supported by a fellowship from the University of Padova – Senior Research Grant no
GRIC12FBMS. LM was supported by the European Community's Seventh Framework
Programme under grant agreement no 311781, LIBERATION Project
(www.fp7liberation.eu).

Spillover of natural enemies
104
Supplementary Material
Table S1. Syrphidae species and their abundance in the study sites.
Species Total of individuals
Chrysotoxum festivum (Linnaeus, 1758) 2
Episyrphus balteatus (DeGeer, 1776) 85
Eristalinus aeneus (Scopoli, 1763) 29
Eristalinus sepulchralis (Linnaeus, 1758) 29
Eristalis arbustorum (Linnaeus, 1758) 109
Eristalis similis (Fallén, 1817) 2
Eristalis tenax (Linnaeus, 1758) 63
Eumerus amoenus Loew, 1848 1
Eupeodes corollae (Fabricius, 1794) 166
Eupeodes latifasciatus (Macquart, 1829) 1
Helophilus pendulus (Linnaeus, 1758) 8
Helophilus trivittatus (Fabricius, 1805) 7
Lejogaster metallina (Fabricius, 1781) 1
Lejogaster tarsata (Meigen, 1822) 6
Melanostoma mellinum (Linnaeus, 1758) 2696
Meliscaeva auricollis (Meigen, 1822) 1
Merodon avidus (Rossi, 1790) 14
Mesembrius peregrinus (Loew, 1846) 1
Myathropa florea (Linnaeus, 1758) 3
Neoascia podagrica (Fabricius, 1775) 40
Paragus constrictus Šimic, 1986 1
Paragus pecchiolii Rondani, 1857 1
Pipizella viduata (Linnaeus, 1758) 31
Riponnensia splendens (Meigen, 1822) 1
Scaeva pyrastri (Linnaeus, 1758) 1
Sphaerophoria rueppelli (Wiedemann, 1830) 9
Sphaerophoria scripta (Linnaeus, 1758) 42
Syrphus ribesii (Linnaeus, 1758) 3
Syrphus vitripennis Meigen, 1822 7
Volucella zonaria (Poda, 1761) 1
Table S2. Tachinidae species and their abundance in the study sites.
Species Total of individuals
Bithia immaculata (Herting, 1971) 1
Bithia modesta (Meigen, 1824) 1
Blondelia nigripes (Fallén, 1810) 1
Carcelia lucorum (Meigen, 1824) 1
Chetogena filipalpis Rondani, 1859 1
Compsilura concinnata (Meigen, 1824) 1
Cylindromyia bicolor (Olivier, 1812) 1

Chapter V
105
Table S2. continued
Dinera grisescens (Fallén, 1817) 117
Drino lota (Meigen, 1824) 1
Eliozeta pellucens (Fallén, 1820) 1
Erycia fatua (Meigen, 1824) 1
Erycia festinans (Meigen, 1824) 1
Exorista fasciata (Fallén, 1820) 2
Exorista larvarum (Linnaeus, 1758) 2
Exorista rustica (Fallén, 1810) 2
Lecanipa leucomelas (Meigen, 1824) 1
Linnaemya comta (Fallén, 1810) 2
Loewia setibarba Egger, 1856 1
Lydella thompsoni Herting, 1959 1
Macquartia tenebricosa (Meigen, 1824) 2
Macquartia tessellum (Meigen, 1824) 1
Medina collaris (Fallén, 1820) 1
Medina separata (Meigen, 1824) 9
Meigenia mutabilis (Fallén, 1810) 11
Meigenia uncinata Mesnil, 1967 1
Microphthalma europaea Egger, 1860 62
Nemoraea pellucida (Meigen, 1824) 4
Nilea innoxia Robineau-Desvoidy, 1863 2
Ocytata pallipes (Fallén, 1820) 7
Paratrixa polonica Brauer & Bergenstamm, 1891 1
Paratryphera barbatula (Rondani, 1859) 2
Peribaea tibialis (Robineau-Desvoidy, 1851) 4
Phania funesta (Meigen, 1824) 45
Policheta unicolor (Fallén, 1820) 3
Pseudoperichaeta palesioidea (Robineau-Desvoidy, 1830) 2
Pseudopericheta nigrolineata (Walker, 1853) 1
Siphona geniculata (De Geer, 1776) 1
Solieria vacua (Rondani, 1861) 1
Spallanzania hebes (Fallén, 1820) 1
Synactia parvula (Rondani, 1861) 1
Thelaira nigripes (Fabricius, 1794) 1
Thelaira solivaga (Harris, 1780) 1
Triarthria setipennis (Fallén, 1810) 2
Vibrissina debilitata (Pandellé, 1896) 1
Vibrissina turrita (Meigen, 1824) 2
Voria ruralis (Fallén, 1810) 47
Zaira cinerea (Fallén, 1810) 1


Chapter VI
109
Abstract
The effectiveness of conservation interventions for maximizing biodiversity benefits from
agri-environment schemes (AESs) is expected to depend on the quantity of semi-natural
habitats in the surrounding landscape. To verify this hypothesis, we developed a
hierarchical sampling design to assess the effects of field boundary type and cover of
semi-natural habitats in the landscape at two nested spatial scales. We sampled three
types of field boundaries with increasing structural complexity (grass margin – simple
hedgerow – complex hedgerow) in paired landscapes with presence or absence of semi-
natural habitats (radius 0.5 km), that in turn, were nested within 15 areas with different
proportions of semi-natural habitats at a larger spatial scale (10 × 10 km). Overall, 90
field boundaries were sampled across a Mediterranean region (NE Italy). We considered
species richness response across three different taxonomic groups: vascular plants,
butterflies, and tachinid flies. No interactions between type of field boundary and
surrounding landscape were found at either 0.5 and 10 km indicating that the quality of
field boundary had the same effect irrespective of the cover of semi-natural habitats. At
the local scale, extended-width grass margins yielded higher plant species richness, while
hedgerows yielded higher species richness of butterflies and tachinids. At the 0.5 km
landscape scale, the effect of the proportion of semi-natural habitats was neutral for plants
and tachinids, while butterflies were positively related to the proportion of forest. At the
10 km landscape scale, only butterflies responded positively to the proportion of semi-
natural habitats. Our study confirmed the importance of testing multiple scales when
considering species from different taxa and with different mobility. We showed that the
quality of field boundaries at the local scale was an important factor in enhancing
farmland biodiversity. For butterflies, AESs should focus particular attention on
preservation of forest patches in agricultural landscapes within 0.5 km as well as the
conservation of semi-natural habitats at a wider landscape scale.
Introduction
Since the second half of the 20th century, simplification of agricultural landscapes
through the removal of semi-natural habitats and agricultural management intensification
aimed at increasing crop yield have caused severe biodiversity losses (Tilman et al. 2001;

Semi-natural habitats and farmland biodiversity
110
Green et al. 2005; Norris 2008). To reverse these negative trends agri-environment
schemes (AESs) have been introduced in many European countries (Whittingham 2007),
but contrasting results on the benefits of these interventions have been found (Kleijn &
Sutherland 2003; Kleijn et al. 2006). In particular the effectiveness of AESs is expected to
depend on the quantity of semi-natural habitats in the surrounding landscape (Batáry et al.
2011; Concepción et al. 2012a; Tscharntke et al. 2012). According to the ‘intermediate
landscape complexity hypothesis’ (Tscharntke et al. 2005), the effectiveness of AESs
should be higher in intermediate-complexity than in either low- or high-complexity
landscapes (Kleijn et al. 2011). On the one hand, complex landscapes already support
high biodiversity, so that local conservation management often does not result in a
recognizable effect. On the other hand, extremely simplified landscapes with an
impoverished regional species pool do not have the capacity to respond to local
interventions. When evaluating the effectiveness of introducing high-quality boundaries
at the local scale, it is also important to consider that species from different taxa and with
different mobility may interact with the environment at different spatial scales
(Concepción et al. 2012a).
Understanding the landscape-dependent effect of conservation interventions such as
enhancing quality of field boundaries is crucially important for maximizing biodiversity
benefits from AESs (Holzschuh et al. 2008; Rundlöf et al. 2008, 2010; Gabriel et al.
2006, 2010; Kleijn et al. 2011; Concepción et al. 2012b). Since most species are
influenced by factors acting at the regional, landscape and field scale, conservation of
farmland biodiversity needs a multiple-scale perspective (Gonthier et al. 2014). So far,
this potential scale dependence has been mainly tested by measuring the proportion of
high-quality habitat in the landscape within nested circular buffers (e.g., Steffan-
Dewenter et al. 2002) that result in correlated landscape metrics between small and large
radii (but see Gabriel et al. 2010; Benjamin et al. 2014). For this reason it is crucial to
verify whether the effect of increasing the quality of field boundaries at the local spatial
scale depends on the landscape context.
Conservation and restoration of hedgerows is becoming a prominent farmland
intervention in several AESs. Indeed, these landscape elements, together with scattered
forest patches, are often the only remaining refuges for biodiversity in agricultural
landscapes (Forman & Baudry 1984). Recent studies indeed confirm that the presence of
hedgerows may help to mitigate the negative effects of agricultural intensification on
Chapter VI
111
insect diversity (Kuussaari et al. 2007; Merckx et al. 2012; Haenke et al. 2014). In
addition, the effect of changes in hedgerow structural complexity and/or plant species
diversity (e.g., Pywell et al. 2004) may be important to consider in these studies. The
effectiveness of introducing a hedgerow to improve farmland biodiversity may depend,
however, not only on the quality of the hedgerow, but also on the surrounding landscape.
In this study, we developed an innovative hierarchical sampling design to assess the
effects of field boundary quality (i.e., structural complexity and plant species diversity)
and semi-natural habitats at multiple scales on the diversity of taxa across three
taxonomic groups. Specifically, we have addressed three main questions. First, do field
boundaries with increasing complexity enhance farmland biodiversity? At the local scale,
three types of field boundary (grass margin – simple hedgerow – complex hedgerow)
were chosen to represent different levels of structural complexity and plant species
diversity. This comparison will determine if hedgerows provide a further benefit to
biodiversity conservation compared with grass margins, the most common field
boundary. Second, at which spatial scale do semi-natural habitats most strongly affect
farmland biodiversity? To address this question we have considered three nested and
uncorrelated spatial scales. Specifically, field boundaries (local scale) were nested within
landscape pairs with or without semi-natural habitats (landscape at 0.5 km radius) and
landscapes were, in turn, nested within 15 areas with different proportions of semi-natural
habitats at a larger spatial scale (landscape at 10 × 10 km). We expected that the
effectiveness of local management in terms of enhanced species richness would be
maximal at intermediate levels of landscape complexity (Tscharntke et al. 2005). Third,
do the effects of field boundary type and landscape factors differ among taxa? To address
this question, we examine the response of vascular plants, butterflies and tachinid
parasitoids. Plants as primary producers could have a bottom-up control on higher trophic
levels (Siemann et al. 1998). Butterflies that are herbivores at the larval stage or potential
pollinators in the adult stage can be considered as a sensitive indicator groups for
measuring biodiversity in terrestrial ecosystems (Thomas 2005). Tachinid parasitoids are
an important taxon for biological control of insect pests (Letourneau et al. 2012). Among
natural enemies, relatively little is know about how tachinid diversity varies at different
spatial scales. Furthermore, butterflies and tachinids are known to use multiple resources
that are spatially separated (Thomas et al. 2001; Stireman 2008; Flick et al. 2012; Inclán
et al. 2014), making these groups also ideal for multi-scale studies.
Semi-natural habitats and farmland biodiversity
112
Methods
Study area
The investigated area extends for about 10,000 km2 in the Venetian-Friulian Plain (north-
eastern Italy). The climate is humid sub-Mediterranean with annual rainfall ranging
between 1200‒1500 mm year-1 and a mean annual temperature of 13°C. About 65% of
the study area is dominated by intensive agriculture (maize, wheat, and soybean are the
dominant crops), interspersed by fragments of semi-natural habitats such as forests,
grasslands and hedgerows.
Sampling design
To identify the effect of semi-natural habitats at different spatial scales, a multi-scale
sampling design was applied (Fig. 1). At the 10 km scale, we firstly divided our study
region into a regular grid of 10 × 10 km cells where we measured the cover of semi-
natural habitats derived from a detailed vector-based land-cover map (Regione Autonoma
Friuli Venezia Giulia 2003; Regione Veneto 2009). Semi-natural habitats included forest
and open natural or semi-natural habitats. The proportion of semi-natural habitats within
the cells was quantified and ranged between 1 and 30%. We tried to verify the effects of
forest and grassland separately in the analysis, however, due to the limited cover of
grasslands (the proportion within the cells was always less than 2%), we found no effect
of grasslands alone. We then defined three classes on the basis of proportion of semi-
natural habitats: (i) simple cells characterized by a low proportion of semi-natural habitats
(< 3%); (ii) cells with intermediate characteristics between those of the previous and the
next class (8 < proportion of semi-natural habitats < 12%); (iii) complex cells
characterized by a high proportion of semi-natural habitats (> 20%). The 20% threshold
to define complex landscapes was based on earlier studies (Tscharntke et al. 2005, Batáry
et al. 2010). We could not select ‘cleared’ landscapes (< 1% of non-crop habitat), as
defined by Tscharntke et al. (2005), as these landscapes are not present in our region.
Therefore, for simple landscapes, we used a threshold of 3% to find a balanced number of
sample cells. For each class, five cells were selected (Fig. 1a). We tried to obtain an
interspersed distribution of the three classes in the study region.

Chapter VI
113
Figure 1. Hierarchical sampling design used to select the 90 field boundaries at three spatial
scales: (a) Landscape at 10 km. Fifteen cells (10 × 10 km) were sampled on the basis of
proportion of semi-natural habitat (simple, < 3%; intermediate, 8‒12%; complex, > 20%). (b)
Landscape at 0.5 km. A landscape pair of one complex and simple landscape, based on presence
or absence of semi-natural habitats, was selected within each cell. (c) Local scale. Three field
boundaries with increasing structural complexity were chosen within each landscape (grass
margin, simple hedgerow, and complex hedgerow). Overall, 30 field boundary triplets were
sampled.
At the 0.5 km scale, a landscape pair was selected within each cell on the basis of
presence or absence of semi-natural habitats (Fig. 1b, S1). In each landscape three field
boundaries were sampled. Around each field boundary, landscape composition was
assessed using a buffer with a 500 m radius. In each buffer hedgerow, forest, and
grassland (mainly hay-meadows belonging to Arrhenatherion elatioris communities)
patches were manually digitised from a visual inspection of high-resolution satellite
images (Google Earth). In GIS (Quantum GIS 1.7, Open Source Geospatial Foundation
Project, http://qgis.osgeo.org), we quantified the area of each patch and then we
calculated the proportion of the different land-use classes within the buffers.
At the local scale, three types of field boundary with increasing structural
complexity (see also the description by Sitzia et al. 2013) were chosen within each
landscape at 0.5 km: (i) grass margin, a perennial grass buffer strip without any nearby
tree; (ii) simple hedgerow, a grass buffer strip adjacent to a single storied hedge (a so-
called ‘treeline – full grown trees’, formed by a few dominant species, either plane tree
Platanus hybrida Brot., white mulberry Morus alba L., or white willow Salix alba L.);

Semi-natural habitats and farmland biodiversity
114
(iii) complex hedgerow, a grass buffer strip with a multi-storied hedgerow on the edge
(averaged number of trees and shrubs species 10.7 ± 2.9) (Fig. S2). We only selected
hedgerows having a grass margin associated with them. For each field boundary, we
obtained from interviews the number of cuts executed yearly in each grass buffer strip
and we used it as measure of management intensity. We also measured the width of the
grass buffer strip to control the unequal habitat area (Table 1), although we found no
significant difference between the three types of field boundary (Table S1). Then, within
each landscape at 0.5 km a field boundary belonging to each of the three types was
sampled (Fig. 1c). In total, 30 field boundary triplets were sampled. We focused the effort
on selecting field boundaries adjacent to the three main arable crops cultivated in the
study region, i.e. maize, wheat, and soybean. The occurrence of the adjacent arable crops
within the different scale was done to obtain an interspersed arrangement. In fact, we
found that the occurrence of the adjacent arable crops was independent of landscape at 10
km (Pearson's chi-squared test: χ2 = 6.26, P = 0.181), landscape at 0.5 km (χ2 = 0.33, P =
0.955), and field boundary type (χ2 = 1.98, P = 0.923). Overall, 90 field boundaries were
sampled across the study region.
We tested for collinearity between our local and landscape factors. The three spatial
scales (field boundary – landscape at 0.5 km – landscape at 10 km) were independent
among them (Table S1, S2). Only local factors differed significantly, with a higher
number of cuts in grass margin than both hedgerow types. As the collinearity between
local and landscape factors was very low, we included all the factors in the same models.

Chapter VI
115
Table 1. Descriptive statistics of the continuous factors used in the models.
Mean ± SD Min Max
Semi-natural 10 km (%) 11.6 ± 9.1 1 26
Hedgerow 0.5 km (%) 5.3 ± 2.3 1 12
Forest 0.5 km (%) 6.4 ± 8.4 0 33
Grassland 0.5 km (%) 5.3 ± 7.0 0 30
Margin width (cm) 237.7 ± 125.7 80 500
Plant species richnessa 14.6 ± 4.0 7 25
Number of cuts per year 1.4 ± 1.3 0 5
a Plant species richness was used as predictor for butterfly and tachinid models.
Vascular plant, butterfly and tachinid surveys
We estimated vascular plant species richness once before the first cut of the grass buffer
strip in June 2013. Sampling was conducted in the grass buffer strip along a transect
parallel to the field boundary. We established three plots of 1 × 2 m2: one plot was placed
in the middle part of the transect and the other plots at the two margins at least 10 m apart
along transect. Within each sampling plot, we recorded vascular plants to species level
(presence/absence data).
We sampled butterflies (diurnal Lepidoptera: Hesperioidea and Papilionidea) using
a linear transect survey (Pollard 1977). A transect length of 50 m was established parallel
to the field boundary and was patrolled back and forth for 10 min. We identified and
counted all of the butterflies within 2.5 m along the transect. Surveys took place between
9:30 and 17:30 under suitable weather conditions (temperature > 17° C and cloud cover <
25%). Sampling was repeated five times from mid-May to the first half of September
2013. For each survey round all the field boundaries were sampled within four or five
days. To avoid any systematic effect of time of day the sequence of surveys was
randomized.

Semi-natural habitats and farmland biodiversity
116
We sampled tachinid flies using a passive sampling with pan-traps (750 ml plastic
bowl). Within each field boundary, six pan-traps were placed in three clusters with two
traps in each cluster. Each cluster was composed of one pan-trap painted with UV-bright
yellow and one painted with standard yellow. Yellow pan-traps have been used
effectively for sampling tachinid flies (e.g., Stireman 2008; Inclán et al. 2014). The three
clusters were placed along the grass buffer strip in the plant sampling plots. The traps
were placed directly on the ground among open or low-growing vegetation and were
filled with water and a drop of detergent (2% dilution). Sampling was done under stable
sunny weather and was repeated four times from the end of May until the beginning of
September 2013. During each sampling round the pan-traps were left out for 72 h.
Tachinid specimens were kept in alcohol and later identified to species level using
Cerretti et al. (2012).
Data analysis
Species richness was calculated by pooling together the samples for each taxonomic
group within each field boundary. Vascular plant species richness was the pooled number
of species found in the three plots. Butterfly species richness was the cumulative number
of species found during the five visits. Tachinid species richness was the cumulative
number of species found in the three clusters of traps during the four visits. We used
generalized linear mixed models (GLMMs) to test the effect of field boundary, landscape
composition at the two scales on species richness of the three groups. We employed a
Poisson-distribution with log-link function. The likelihood of the models was computed
with the Laplace approximation, as suggested by Bolker et al. (2009). In each model, field
boundary type was entered as categorical fixed factor, while number of cuts, margin
width (grass buffer strip), proportion of land use classes at 0.5 km (hedgerow, forest, and
grassland), and proportion of semi-natural habitats at cell level (10 × 10 km) as
continuous fixed factors. At the cell level (10 × 10 km) we used a unique measure of
semi-natural habitats cover due to the low proportion of grasslands within each cell (<
2%). We also included plant species richness as fixed factor in butterfly and tachinid
models since we expected a positive relationship between plant diversity and species
richness of flower-visiting insects. Interactions between field boundary and landscape
variables at the two scales were also tested. A significant interaction between field
boundary type and landscape composition would indicate that the effectiveness of the
local intervention depends on the quality of landscape. In particular we expected that the

Chapter VI
117
high-quality boundaries would be more effective in intermediate complexity landscapes.
We accounted for the nested design by including the following random factors: cell
identity and landscape identity within cell. All the models showed no sign of
overdispersion (plants: χ2/residual d.f. = 0.57; butterflies: χ2/residual d.f. = 0.49;
tachinids: χ2/residual d.f. = 0.70).
We used an information-theoretic model selection procedure to evaluate alternative
competing models (Burnham & Anderson 2002). We compared the fit of all possible
candidate models obtained by the combination of the predictors using second-order
Akaike’s information criterion (AICc). The best fitting model is the one with the lowest
AICc. In a set of n models, each model i can be ranked using its difference in AICc score
with the best-fitting model (ΔAICci = AICci–AICc minimum). The difference in AICc
values indicates the relative support for the different models. We identified the best subset
of candidate models as those with a ΔAICc < 2. We also derived the model weight (wi) as
the weight of evidence in favour of each model being the best within the set. To measure
the relative importance of each predictor, we summed the wi across the models in the set
(∑wi) in which the predictor occurred. Individual predictor variables that had an Akaike
weight > 0.80 were considered as most important predictors. Tukey contrasts were
calculated from the best plausible models to test for differences between field boundary
types. All statistical analyses were performed in R version 3.0.2 (R Development Core
Team 2013). GLMMs were implemented using the ‘lme4’ package (Bates et al. 2014),
model comparison using the ‘MuMIn’ package (Barton 2013), and Tukey contrasts using
the ‘glht’ function in the ‘multcomp’ package (Hothorn et al. 2008).
Results
During the surveys, 177 plant, 42 butterfly, and 89 tachinid species were recorded in the
90 field boundaries. Overall, 1522 butterfly and 832 tachinid individuals were sampled.
The average species richness per field boundary was 14.6 (range between 7 and 25) for
plants, 7.5 (range between 3 and 17) for butterflies, and 5.1 (range between 0 and 12) for
tachinid flies.
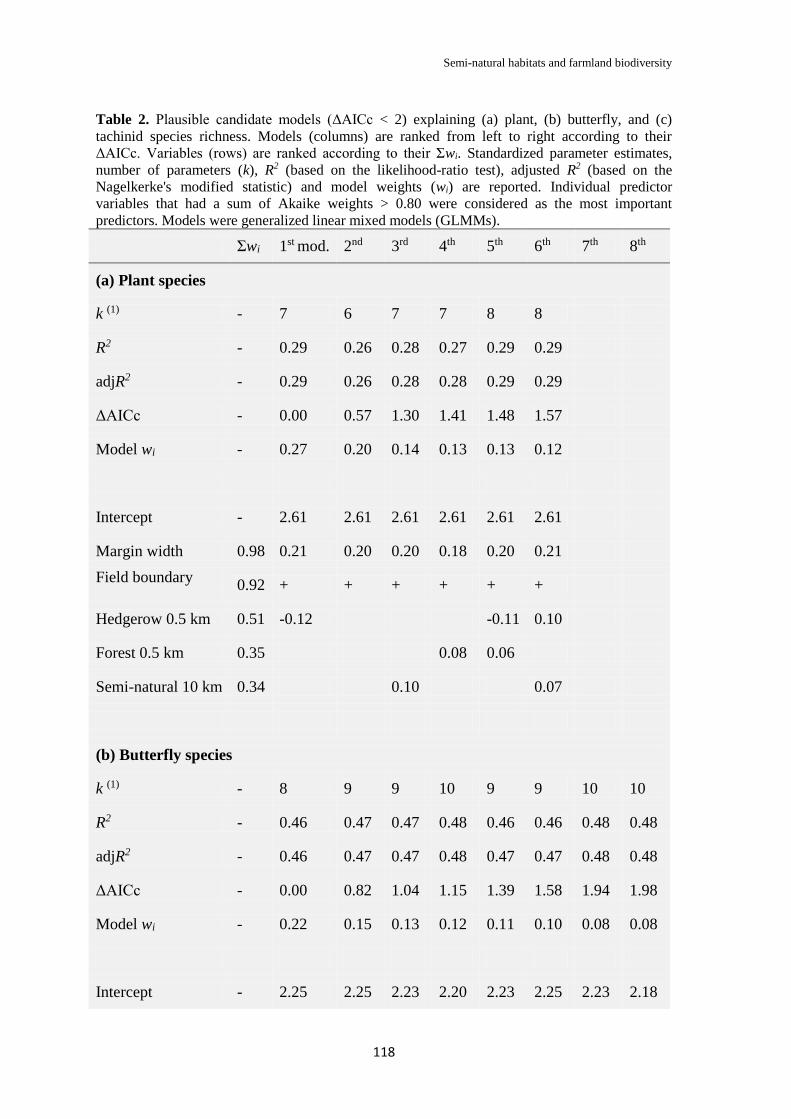
Semi-natural habitats and farmland biodiversity
118
Table 2. Plausible candidate models (ΔAICc < 2) explaining (a) plant, (b) butterfly, and (c)
tachinid species richness. Models (columns) are ranked from left to right according to their
ΔAICc. Variables (rows) are ranked according to their Σwi. Standardized parameter estimates,
number of parameters (k), R2 (based on the likelihood-ratio test), adjusted R2 (based on the
Nagelkerke's modified statistic) and model weights (wi) are reported. Individual predictor
variables that had a sum of Akaike weights > 0.80 were considered as the most important
predictors. Models were generalized linear mixed models (GLMMs).
Σwi 1st mod. 2nd 3rd 4th 5th 6th 7th 8th
(a) Plant species
k (1) - 7 6 7 7 8 8
R2 - 0.29 0.26 0.28 0.27 0.29 0.29
adjR2 - 0.29 0.26 0.28 0.28 0.29 0.29
ΔAICc - 0.00 0.57 1.30 1.41 1.48 1.57
Model wi - 0.27 0.20 0.14 0.13 0.13 0.12
Intercept - 2.61 2.61 2.61 2.61 2.61 2.61
Margin width 0.98 0.21 0.20 0.20 0.18 0.20 0.21
Field boundary
0.92 + + + + + +
Hedgerow 0.5 km 0.51 -0.12 -0.11 0.10
Forest 0.5 km 0.35 0.08 0.06
Semi-natural 10 km 0.34 0.10 0.07
(b) Butterfly species
k (1) - 8 9 9 10 9 9 10 10
R2 - 0.46 0.47 0.47 0.48 0.46 0.46 0.48 0.48
adjR2 - 0.46 0.47 0.47 0.48 0.47 0.47 0.48 0.48
ΔAICc - 0.00 0.82 1.04 1.15 1.39 1.58 1.94 1.98
Model wi - 0.22 0.15 0.13 0.12 0.11 0.10 0.08 0.08
Intercept - 2.25 2.25 2.23 2.20 2.23 2.25 2.23 2.18

Chapter VI
119
Table 2. continued
Field boundary
1.00 + + + + + + + +
Forest 0.5 km 0.89 0.21 0.28 0.19 0.17 0.21 0.22 0.25 0.18
Semi-natural 10 km 0.84 0.21 0.22 0.22 0.20 0.19 0.19 0.23 0.17
Plant richness 0.70 0.21 0.20 0.18 0.17 0.22 0.20 0.16
Margin width 0.59 0.11 0.16 0.10 0.23
Number of cuts 0.47 -0.15 -0.10 -0.16
Hedgerow 0.5 km 0.39 -0.08 -0.13
Grassland 0.5 km 0.35 -0.11 -0.11
(c) Tachinid species
k (1) - 7 6 8 8
R2 - 0.21 0.17 0.21 0.21
adjR2 - 0.21 0.17 0.21 0.21
ΔAICc - 0 1.77 1.78 1.83
Model wi - 0.45 0.19 0.18 0.18
Intercept - 1.79 1.79 1.79 1.80
Field boundary 0.93 + + + +
Forest 0.5 km 0.65 -0.22 -0.24 -0.22
Hedgerow 0.5 km 0.64 -0.23 -0.22 -0.21 -0.24
Plant richness 0.30 0.09
Number of cuts 0.29 0.09
(1) k is higher than the number of model parameters as AICc requires the estimation of sample σ2.
In multi-model inference, k is equal to the number of parameters estimated in the model (intercept
+ slopes) + 1 (for σ2) (Burnham and Anderson 2002).
+ Indicated that the categorical variable, Field boundary, was included in the model.

Semi-natural habitats and farmland biodiversity
120
In GLMMs, we found no interactions between field boundary type and landscape
variables for the three investigated groups. The interactions were then removed from the
models (P > 0.05) and only the main effects were presented. For plant species richness
there was support for six plausible models (i.e. ΔAICc < 2) including mostly margin
width and field boundary type (Table 2). For butterfly species richness, we found eight
plausible models which included mostly field boundary type, the proportion of forest
within landscape at 0.5 km, and the proportion of semi-natural habitats within landscape
at 10 km. Concerning the tachinid species richness, we found four plausible models
which included mostly field boundary type. All the three taxonomic groups were affected
by field boundary type. Plant species richness was higher in grass margins (Fig. 2a) and
responded also to the margin width positively (Fig. 3a). For butterflies and tachinids,
complex hedgerows yielded higher species richness (Fig. 2). Specifically, butterfly
species richness was significantly higher in complex hedgerows, while there was no
difference between grass margins and simple hedgerows (Fig. 2b). Tachinid species
richness significantly decreased from the complex hedgerows to grass margins while the
two woody hedgerows were similar (Fig. 2c). At the landscape scales (0.5 and 10 km),
the effect of proportion of semi-natural habitats had a marginal support for both plant and
tachinid species richness, while for butterflies we found a positive effect of the proportion
of forest within landscape at 0.5 km (Fig. 3b), and a positive effect of the proportion of
semi-natural habitats within landscape at 10 km (Fig. 3c).
Figure 2. Mean ± SE of (a) plant, (b) butterfly, and (c) tachinid species richness in relation to
field boundary type (grass margin, simple hedgerow, and complex hedgerow). Different letters
indicate significant differences according to the Tukey multiple comparison test based on the best
plausible model of Table 2.

Chapter VI
121
Figure 3. Plots showing the relationships between (a) plant species richness and grass margin
width, (b) butterfly species richness and the proportion of forest within landscape at 0.5 km, and
(c) butterfly species richness and the proportion of semi-natural habitats within landscape at 10
km. The fitted line and 0.95 confidence intervals is a generalized linear mixed models (GLMMs)
estimate calculated from the best plausible model. Plots were performed using the package
‘effects’ in R.
Discussion
In this study, we developed an innovative hierarchical sampling design that allowed us to
evaluate the effectiveness of introducing field boundaries of different quality along a
gradient of semi-natural habitats in the surrounding area. We found that the introduction
of complex field boundaries was a key intervention to support high farmland biodiversity.
Contrary to our expectations that the effectiveness of local intervention would be
maximal at intermediate levels of landscape complexity (Tscharntke et al. 2005), no
interactions between local field boundary type and proportion of semi-natural habitats at
both 0.5 and 10 km were found. This suggests that the quality of field boundary had the
same effect irrespective of the landscape context. This result could be due to the absence
of a complete landscape gradient where these interactive effects between landscape and
local management factors can be more easily detected. For instance, in our study area
there was a lack of ‘cleared’ landscapes (extremely simple and structurally
homogeneous), such as large-scale agricultural monocultures, that have been considered
in previous studies (Tscharntke et al. 2005; Batáry et al. 2011; Concepción et al. 2012a).
Hence, according to the ‘intermediate landscape complexity hypothesis’ (Tscharntke et al.
2005) the effect found in this study can be located at intermediate levels of landscape
complexity where the effectiveness of local management for improving biodiversity, such
as the introduction of high-quality boundaries, reaches its maximum (Concepción et al.
2012a).
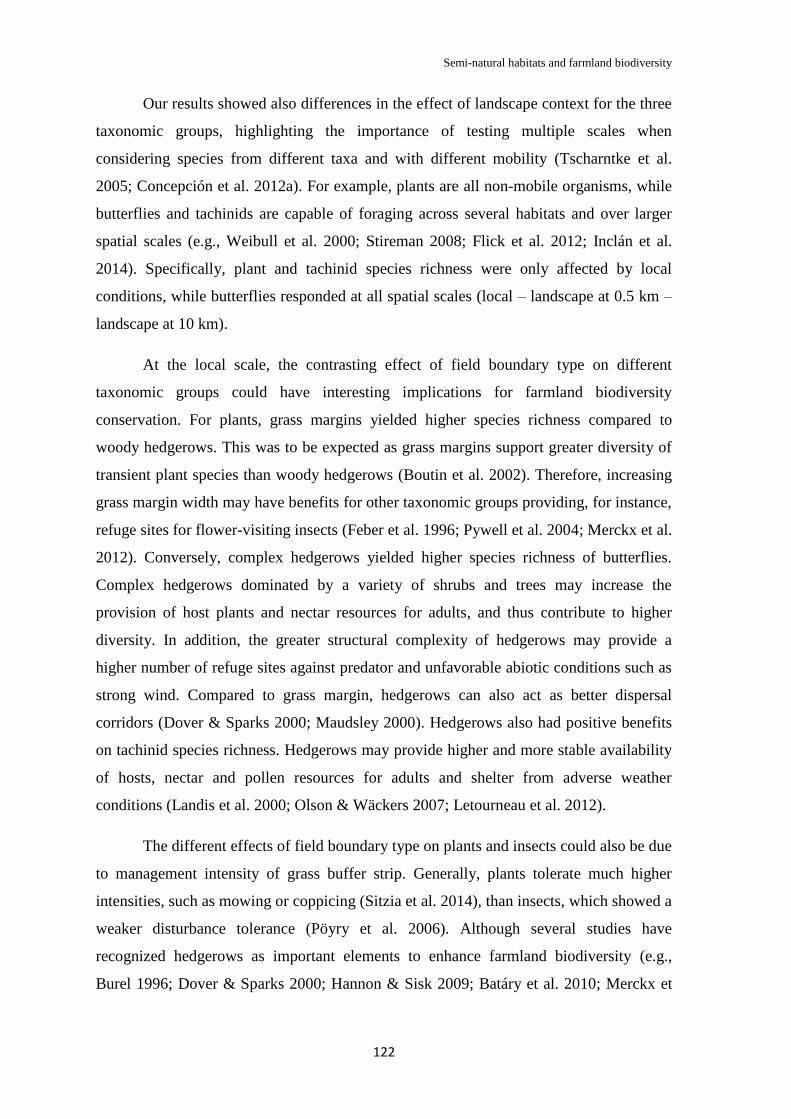
Semi-natural habitats and farmland biodiversity
122
Our results showed also differences in the effect of landscape context for the three
taxonomic groups, highlighting the importance of testing multiple scales when
considering species from different taxa and with different mobility (Tscharntke et al.
2005; Concepción et al. 2012a). For example, plants are all non-mobile organisms, while
butterflies and tachinids are capable of foraging across several habitats and over larger
spatial scales (e.g., Weibull et al. 2000; Stireman 2008; Flick et al. 2012; Inclán et al.
2014). Specifically, plant and tachinid species richness were only affected by local
conditions, while butterflies responded at all spatial scales (local – landscape at 0.5 km –
landscape at 10 km).
At the local scale, the contrasting effect of field boundary type on different
taxonomic groups could have interesting implications for farmland biodiversity
conservation. For plants, grass margins yielded higher species richness compared to
woody hedgerows. This was to be expected as grass margins support greater diversity of
transient plant species than woody hedgerows (Boutin et al. 2002). Therefore, increasing
grass margin width may have benefits for other taxonomic groups providing, for instance,
refuge sites for flower-visiting insects (Feber et al. 1996; Pywell et al. 2004; Merckx et al.
2012). Conversely, complex hedgerows yielded higher species richness of butterflies.
Complex hedgerows dominated by a variety of shrubs and trees may increase the
provision of host plants and nectar resources for adults, and thus contribute to higher
diversity. In addition, the greater structural complexity of hedgerows may provide a
higher number of refuge sites against predator and unfavorable abiotic conditions such as
strong wind. Compared to grass margin, hedgerows can also act as better dispersal
corridors (Dover & Sparks 2000; Maudsley 2000). Hedgerows also had positive benefits
on tachinid species richness. Hedgerows may provide higher and more stable availability
of hosts, nectar and pollen resources for adults and shelter from adverse weather
conditions (Landis et al. 2000; Olson & Wäckers 2007; Letourneau et al. 2012).
The different effects of field boundary type on plants and insects could also be due
to management intensity of grass buffer strip. Generally, plants tolerate much higher
intensities, such as mowing or coppicing (Sitzia et al. 2014), than insects, which showed a
weaker disturbance tolerance (Pöyry et al. 2006). Although several studies have
recognized hedgerows as important elements to enhance farmland biodiversity (e.g.,
Burel 1996; Dover & Sparks 2000; Hannon & Sisk 2009; Batáry et al. 2010; Merckx et

Chapter VI
123
al. 2012), they have not controlled for the quality of the hedgerow and the landscape
structure.
Consistent with some previous studies, landscape composition at 0.5 km seemed
to have only marginal effects on plant species richness (Dauber et al. 2003; Marini et al.
2007), although other studies have found a landscape effect (Gabriel et al. 2006, 2010;
Rundlöf et al. 2010; Concepción et al. 2012b). The lack of a landscape effect on plant
species richness could be linked to the short dispersal distance of perennial herbaceous
plants inhabiting field boundaries (Sitzia 2007), which are mostly limited by the
availability of microsites for reproduction rather than by the propagule pressure
(Tscharntke et al. 2005). As for plants, tachinids showed marginal effect of landscape at
0.5 km. In this case, the expected large dispersal capacity of dipterans and the generalist
parasitism strategy of this group (Stireman & Singer 2003; Inclán et al. 2014) may
explain the lack of a landscape effect. For butterflies we found an additive effect of the
proportion of forest at 0.5 km landscape scale on species richness. The same pattern has
been reported in other studies (e.g., Pywell et al. 2004; Kivinen et al. 2007; Marini et al.
2009). Forest habitat seems to play a key role in maintaining butterfly diversity in
agricultural landscapes dominated by arable land, as it may provide alternative food
sources and host plants, and stable microhabitats for overwintering (Dover et al. 1997;
Pywell et al. 2004).
Although the presence of complex hedgerows was associated with higher butterfly
diversity at the local scale, overall hedgerow cover at the landscape scale had no effect.
This result highlights the key importance to butterfly diversity of habitat quality rather
than habitat cover since our landscape measure of hedgerow cover did not take into
account the quality of the hedgerow margin. Indeed, the presence of high-quality field
boundary (complex hedgerows) at the local scale and forest cover at 0.5 km landscape
scale were the key determinants of butterfly species richness. Since single-storied
hedgerows are the most common woody hedges in the study region (Sitzia et al. 2013),
the absence of hedgerow cover effect may further suggest the importance of habitat
quality. The complex hedgerow may therefore be considered a surrogate of native
woodland in intensive agricultural landscapes (Hannon & Sisk 2009).
At the largest spatial scale (10 km), only butterfly species richness was affected by
the cover of semi-natural habitats. This is in accordance with the ‘regional species pool
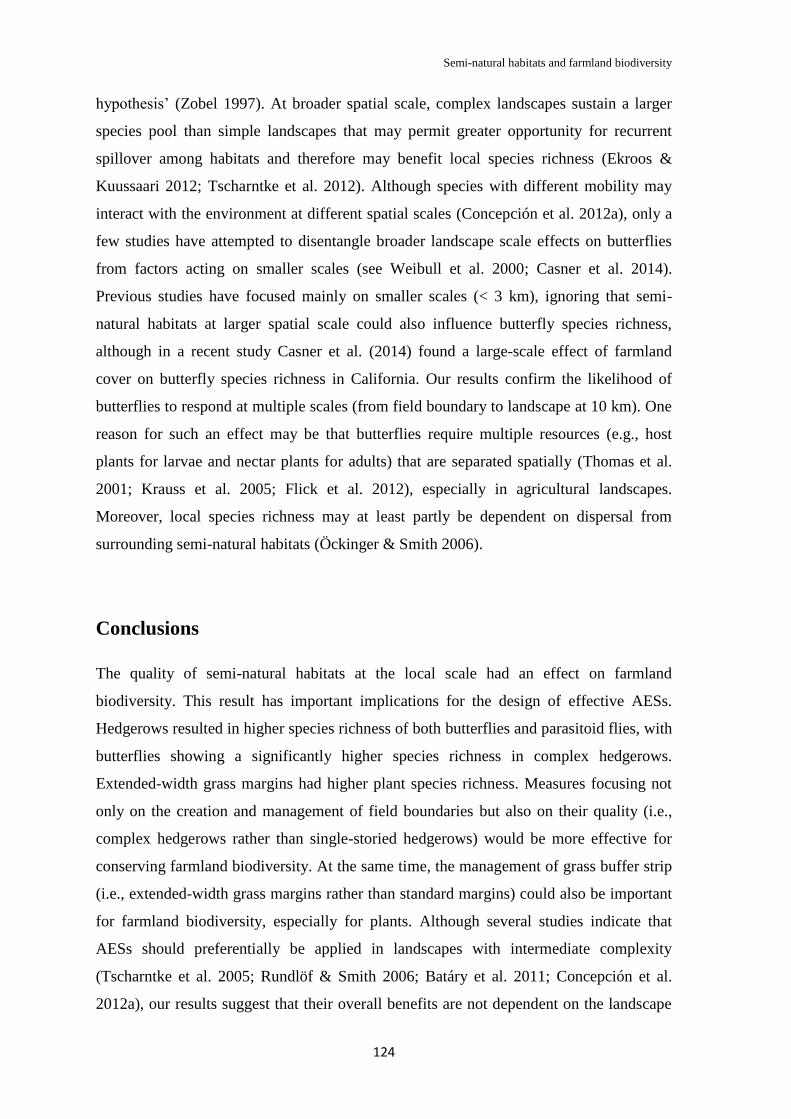
Semi-natural habitats and farmland biodiversity
124
hypothesis’ (Zobel 1997). At broader spatial scale, complex landscapes sustain a larger
species pool than simple landscapes that may permit greater opportunity for recurrent
spillover among habitats and therefore may benefit local species richness (Ekroos &
Kuussaari 2012; Tscharntke et al. 2012). Although species with different mobility may
interact with the environment at different spatial scales (Concepción et al. 2012a), only a
few studies have attempted to disentangle broader landscape scale effects on butterflies
from factors acting on smaller scales (see Weibull et al. 2000; Casner et al. 2014).
Previous studies have focused mainly on smaller scales (< 3 km), ignoring that semi-
natural habitats at larger spatial scale could also influence butterfly species richness,
although in a recent study Casner et al. (2014) found a large-scale effect of farmland
cover on butterfly species richness in California. Our results confirm the likelihood of
butterflies to respond at multiple scales (from field boundary to landscape at 10 km). One
reason for such an effect may be that butterflies require multiple resources (e.g., host
plants for larvae and nectar plants for adults) that are separated spatially (Thomas et al.
2001; Krauss et al. 2005; Flick et al. 2012), especially in agricultural landscapes.
Moreover, local species richness may at least partly be dependent on dispersal from
surrounding semi-natural habitats (Öckinger & Smith 2006).
Conclusions
The quality of semi-natural habitats at the local scale had an effect on farmland
biodiversity. This result has important implications for the design of effective AESs.
Hedgerows resulted in higher species richness of both butterflies and parasitoid flies, with
butterflies showing a significantly higher species richness in complex hedgerows.
Extended-width grass margins had higher plant species richness. Measures focusing not
only on the creation and management of field boundaries but also on their quality (i.e.,
complex hedgerows rather than single-storied hedgerows) would be more effective for
conserving farmland biodiversity. At the same time, the management of grass buffer strip
(i.e., extended-width grass margins rather than standard margins) could also be important
for farmland biodiversity, especially for plants. Although several studies indicate that
AESs should preferentially be applied in landscapes with intermediate complexity
(Tscharntke et al. 2005; Rundlöf & Smith 2006; Batáry et al. 2011; Concepción et al.
2012a), our results suggest that their overall benefits are not dependent on the landscape
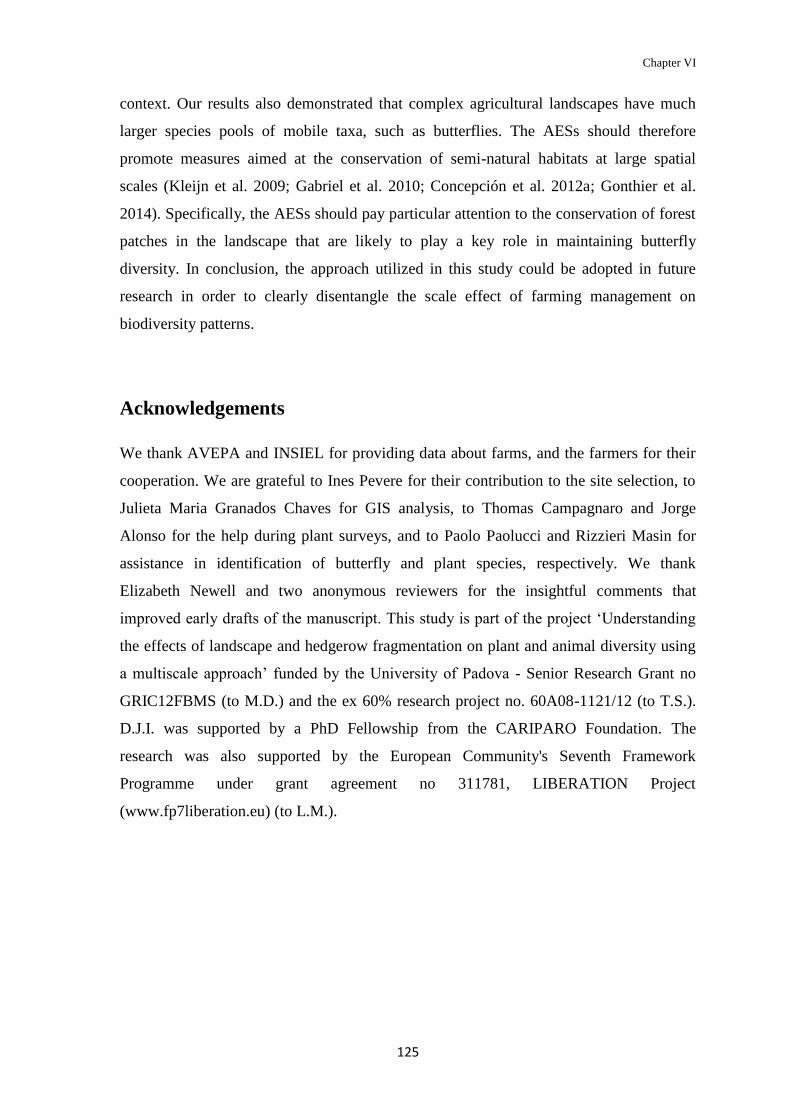
Chapter VI
125
context. Our results also demonstrated that complex agricultural landscapes have much
larger species pools of mobile taxa, such as butterflies. The AESs should therefore
promote measures aimed at the conservation of semi-natural habitats at large spatial
scales (Kleijn et al. 2009; Gabriel et al. 2010; Concepción et al. 2012a; Gonthier et al.
2014). Specifically, the AESs should pay particular attention to the conservation of forest
patches in the landscape that are likely to play a key role in maintaining butterfly
diversity. In conclusion, the approach utilized in this study could be adopted in future
research in order to clearly disentangle the scale effect of farming management on
biodiversity patterns.
Acknowledgements
We thank AVEPA and INSIEL for providing data about farms, and the farmers for their
cooperation. We are grateful to Ines Pevere for their contribution to the site selection, to
Julieta Maria Granados Chaves for GIS analysis, to Thomas Campagnaro and Jorge
Alonso for the help during plant surveys, and to Paolo Paolucci and Rizzieri Masin for
assistance in identification of butterfly and plant species, respectively. We thank
Elizabeth Newell and two anonymous reviewers for the insightful comments that
improved early drafts of the manuscript. This study is part of the project ‘Understanding
the effects of landscape and hedgerow fragmentation on plant and animal diversity using
a multiscale approach’ funded by the University of Padova - Senior Research Grant no
GRIC12FBMS (to M.D.) and the ex 60% research project no. 60A08-1121/12 (to T.S.).
D.J.I. was supported by a PhD Fellowship from the CARIPARO Foundation. The
research was also supported by the European Community's Seventh Framework
Programme under grant agreement no 311781, LIBERATION Project
(www.fp7liberation.eu) (to L.M.).

Semi-natural habitats and farmland biodiversity
126
Supplementary Material
Figure S1. Example of landscape pair of one a) simple and b) complex landscape (radius 1 km)
within each cell. The field boundary triplets for each landscape are pictured: i) grass margin in
yellow, ii) simple hedgerow in blue, and iii) complex hedgerow in red. Satellite images from
Google Earth.
a) b)

Chapter VI
127
Figure S2. Examples of a a) grass margin, b) simple hedgerow, and c) complex hedgerow. Photo
credit: Dainese M.
a)
b)
c)
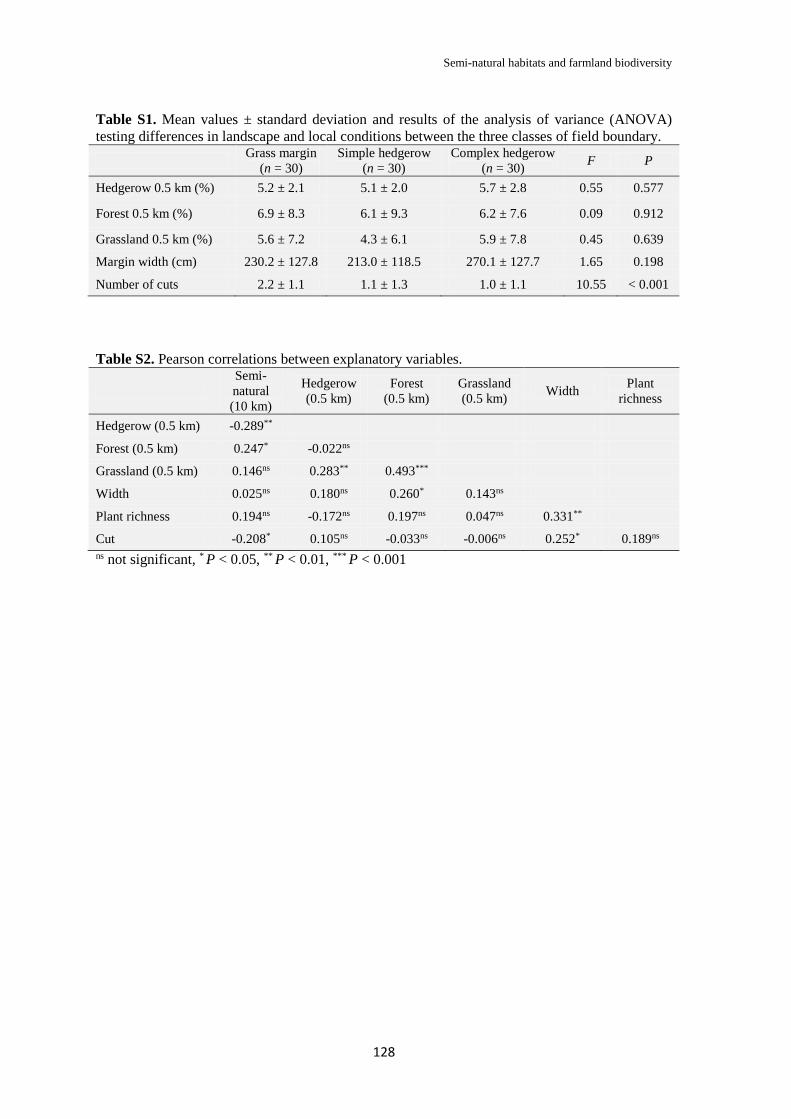
Semi-natural habitats and farmland biodiversity
128
Table S1. Mean values ± standard deviation and results of the analysis of variance (ANOVA)
testing differences in landscape and local conditions between the three classes of field boundary.
Grass margin
(n = 30)
Simple hedgerow
(n = 30)
Complex hedgerow
(n = 30) F P
Hedgerow 0.5 km (%) 5.2 ± 2.1 5.1 ± 2.0 5.7 ± 2.8 0.55 0.577
Forest 0.5 km (%) 6.9 ± 8.3 6.1 ± 9.3 6.2 ± 7.6 0.09 0.912
Grassland 0.5 km (%) 5.6 ± 7.2 4.3 ± 6.1 5.9 ± 7.8 0.45 0.639
Margin width (cm) 230.2 ± 127.8 213.0 ± 118.5 270.1 ± 127.7 1.65 0.198
Number of cuts 2.2 ± 1.1 1.1 ± 1.3 1.0 ± 1.1 10.55 < 0.001
Table S2. Pearson correlations between explanatory variables.
Semi-
natural
(10 km)
Hedgerow
(0.5 km)
Forest
(0.5 km)
Grassland
(0.5 km) Width
Plant
richness
Hedgerow (0.5 km) -0.289**
Forest (0.5 km) 0.247* -0.022ns
Grassland (0.5 km) 0.146ns 0.283** 0.493***
Width 0.025ns 0.180ns 0.260* 0.143ns
Plant richness 0.194ns -0.172ns 0.197ns 0.047ns 0.331**
Cut -0.208* 0.105ns -0.033ns -0.006ns 0.252* 0.189ns
ns not significant, * P < 0.05, ** P < 0.01, *** P < 0.001


Conclusions
131
The research presented in this dissertation makes a significant contribution to the
understanding of the landscape dynamics of tachinid parasitoids. In general, ecological
research on tachinids has been restricted to a few studies and our knowledge on the
consequences of habitat fragmentation and intensification of agricultural landscapes on
the diversity of this group is very limited. This work demonstrates how the diversity of
tachinid parasitoids is affected by diverse factors such as the habitat loss and
fragmentation of semi-natural habitats (Chapter II), the agricultural management at the
local and landscape scales (Chapter III), the proportion and type of semi-natural habitats
in the landscape (Chapter IV), and by local interventions such as the management and
implementation of field margins (Chapter V & VI). This study highlights the important
role of habitat conservation to maintain and enhance the diversity of tachinid parasitoids.
This study demonstrates the negative impact of habitat fragmentation on tachinid
parasitoids. The results from Chapter II show that the strength of this effect depends on
the degree of habitat connectivity as the processes of habitat loss and loss of connectivity
significantly interact. This suggests that management practices aimed to mitigate the
negative effect of habitat loss at the local scale need to consider the surrounding
landscape. Specifically, the conservation of habitat connectivity needs to be particularly
considered in landscapes with small remnant habitats. In addition, Chapter IV
demonstrates that the community of tachinids was affected not only by the proportion of
semi-natural habitats in the landscape, but also by the specific type of semi-natural
habitats. Therefore, strategies to conserve semi-natural habitats in agricultural landscapes
needs to take into account the area, connectivity and type of habitats.
While it is clear that the fragmentation of semi-natural habitats affected the
diversity of tachinid parasitoids (Chapter II & IV), my research also shows the
significance of considering the effects of the agricultural matrix. In Chapter III the effect
of contrasting farming systems indicates that parasitoids were affected by agricultural
management at different spatial scales. Thus, any attempt to enhance parasitoid diversity
in agricultural landscapes needs to consider the local management in relation to habitat
type, location within the field and agricultural management in the surrounding landscape.
In particularly, this study demonstrates that organic management in arable fields clearly
enhanced tachinid diversity, while the management of organic grasslands needs to be
reconsidered. To increase the biodiversity of grasslands, organic management should aim
to enhance habitat heterogeneity and to reduce practices like mowing frequency and

Conclusions
132
grazing intensity. As organic management had a positive effect also at the landscape
scale, the promotion of organic agriculture as an alternative to enhance farmland
biodiversity should aim to increase both the total extent of organic farming and the
connectivity of individual organic farms.
The recognition of the farmed-matrix as an important component of agricultural
landscapes highlights the need of alternative measures that consider the matrix to enhance
the overall diversity of these landscapes. For example, the conservation and
implementation of semi-natural elements such as field margins and hedgerows have been
proposed as a feasible alternative to work within farms. This research demonstrated the
positive effect of field margins to enhance the diversity of different taxa (Chapters V &
VI). In addition, the quality of field margins should be also considered (e.g., hedgerows
vs. grass margins, simple vs. complex hedgerows) as this could be more effective for
conserving farmland biodiversity.
The implementation of measures to enhance local farmland diversity should focus
not only on the local diversity, but also on how these measures affect the movement of
species into the crop fields. To enhance the spillover of species into the crop, the results
from Chapter V show that the local contrast between the field margin and the crop in
relation to the dispersal behavior of the focal taxa should be considered. Given that the
spillover of tachinid parasitoids was favored by the low contrast between grass margins
and maize fields, it appears that grass margins could facilitate higher spillover of species
in landscapes with annual crops. In contrast, hedgerows may enhance higher spillover of
species in landscapes dominated by perennial crops.
The diverse interactions found in this study between crop and non-crop habitats
(e.g., Chapters IV, V & VI) emphasize the importance to consider these interactions to
enhance biodiversity in agricultural landscapes. The conservation of natural and semi-
natural habitats cannot be sustained if these habitats are perceived as incompatible
systems with the agricultural matrix. The planning and design of alternative measures to
conserve biodiversity in fragmented landscapes need to take in account the ecological
dynamics of both the crop and non-crop habitats. In this way, practices implemented for
the conservation of biodiversity could also benefit with the provision of ecosystem
services to the agricultural matrix.
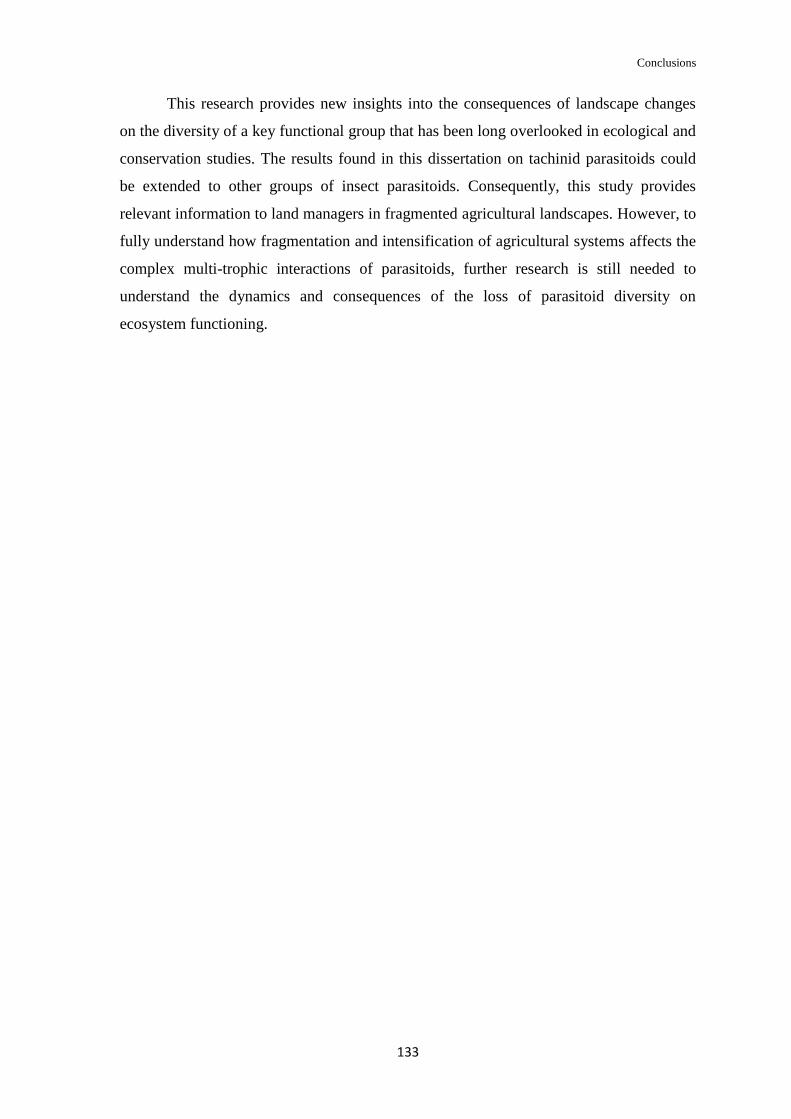
Conclusions
133
This research provides new insights into the consequences of landscape changes
on the diversity of a key functional group that has been long overlooked in ecological and
conservation studies. The results found in this dissertation on tachinid parasitoids could
be extended to other groups of insect parasitoids. Consequently, this study provides
relevant information to land managers in fragmented agricultural landscapes. However, to
fully understand how fragmentation and intensification of agricultural systems affects the
complex multi-trophic interactions of parasitoids, further research is still needed to
understand the dynamics and consequences of the loss of parasitoid diversity on
ecosystem functioning.


References
137
A
Al-Dobai, S., Reitz, S. & Sivinski, J. (2012). Tachinidae (Diptera) associated with
flowering plants: Estimating floral attractiveness. Biological Control, 61, 230–
239.
Alexandratos, N. & Bruinsma, J. (2012). World agriculture towards 2030/2050: the 2012
revision. ESA Working paper No. 12–03. FAO, Rome, IT.
Alhmedi, A., Haubruge, E. & Francis, F. (2008). Role of prey-host plant associations on
Harmonia axyridis and Episyrphus balteatus reproduction and predatory
efficiency. Entomologia Experimentalis et Applicata, 128, 49–56.
Almohamad, R., Verheggen, F. & Haubruge, É. (2009). Searching and oviposition
behavior of aphidophagous hoverflies (Diptera: Syrphidae): a review.
Biotechnology, Agronomy, Society and Environment, 13, 467–481.
Andrén, H. (1994). Effects of habitat fragmentation on birds and mammals in landscapes
with different proportions of suitable habitat: a review. Oikos, 71, 355–366.
Arnaud, P. H. Jr. (1978). A Host-Parasite Catalog of North American Tachinidae
(Diptera).USDA Misc. Publ. 1319. 860 pp.
Askew, R. R. & Shaw, M. R. (1986). Parasitoid communities: their size, structure and
development. In: Waage, J. & Greathead, D. (eds) Insect parasitoids. Academic
Press, London, pp. 237–264.
B
Bacaro, G., Gioria, M. & Ricotta, C. (2013). Beta diversity reconsidered. Ecological
Research, 28, 537–540.
Barnosky, A. D., Matzke, N., Tomiya, S., Wogan, G. O., Swartz, B., Quental, T. B.,
Marshall, C., McGuire, J. L., Lindsey, E. L., Maguire, K. C., Mersey, B. & Ferrer,
E. A. (2011). Has the Earth's sixth mass extinction already arrived? Nature, 471,
51–57.
Barton, K. (2013). MuMIn: Multi-model inference. R package version 1.9.13.
http://CRAN.R-project.org/package=MuMIn
Bartsch, H. (2009). Diptera: Syrphidae: Syrphinae. ArtDatabanken, Sweden. 406 pp.
Baselga, A. (2010). Partitioning the turnover and nestedness components of beta
diversity. Global Ecology and Biogeography, 19, 134–143.
Batáry, P., Báldi, A., Kleijn, D. & Tscharntke, T. (2011). Landscape-moderated
biodiversity effects of agri-environmental management: a meta-analysis.
Proceedings of the Royal Society of London Series B - Biological Sciences, 278,
1894–902.
Batáry, P., Holzschuh, A., Orci, K. M., Samu, F. & Tscharntke, T. (2012). Responses of
plant, insect and spider biodiversity to local and landscape scale management

References
138
intensity in cereal crops and grasslands. Agriculture, Ecosystems and
Environment, 146, 130–136.
Batáry, P., Matthiesen, T. & Tscharntke, T. (2010). Landscape-moderated importance of
hedges in conserving farmland bird diversity of organic vs. conventional
croplands and grasslands. Biological Conservation, 143, 2020–2027.
Batchelor, T. P., Hardy, I. C., Barrera, J. F. & Pérez-Lachaud, G. (2005). Insect gladiators
II: Competitive interactions within and between bethylid parasitoid species of the
coffee berry borer, Hypothenemus hampei (Coleoptera: Scolytidae). Biological
Control, 33, 194–202.
Bates, D., Maechler, M., Bolker, B. & Walker, S. (2014). lme4: Linear mixed-effects
models using Eigen and S4. R package version 1.0–6. http://CRAN.R-
project.org/package=lme4
Baudry, J., Burel, F., Aviron, S., Martin, M., Ouin, A., Pain, G. & Thenail, C. (2003).
Temporal variability of connectivity in agricultural landscapes: do farming
activities help? Landscape Ecology, 18, 303–314.
Belshaw, R. (1993). Tachinid flies. Diptera: Tachinidae. Handbooks for the identification
of British Insects 10, Part 4a (i). Royal Entomological Society of London, London.
Bengtsson, J., Ahnström, J. & Weibull, A. C. (2005). The effects of organic agriculture
on biodiversity and abundance: a meta‐analysis. Journal of Applied Ecology, 42,
261–269.
Benjamin, F. E., Reilly, J. R. & Winfree, R. (2014). Pollinator body size mediates the
scale at which land use drives crop pollination services. Journal of Applied
Ecology, 51, 440–449.
Bennett, A. B. & Gratton, C. (2013). Floral diversity increases beneficial arthropod
richness and decreases variability in arthropod community composition.
Ecological Applications, 23, 86–95.
Benton, T. G., Vickery, J. A. & Wilson, J. D. (2003). Farmland biodiversity: is habitat
heterogeneity the key? Trends in Ecology and Evolution, 18, 182–188.
Bianchi, F. J. J. A., Booij, C. J. H. & Tscharntke, T. (2006). Sustainable pest regulation in
agricultural landscapes: a review on landscape composition, biodiversity and
natural pest control. Proceedings of the Royal Society B, 273, 1715–1727.
Blackshaw, R. P. & Coll, C. (1999). Economically important leatherjackets of grassland
and cereals: biology, impact and control. Integrated Pest Management Reviews, 4,
145–162.
Blitzer, E. J., Dormann, C. F., Holzschuh, A., Klein, A. M., Rand, T. A. & Tscharntke, T.
(2012). Spillover of functionally important organisms between managed and
natural habitats. Agriculture, Ecosystems and Environment, 146, 34–43.
Boatman, N. D., Parry, H. R., Bishop, J. D. & Cuthbertson, A. G. (2007). Impacts of
agricultural change on farmland biodiversity in the UK. In: Hester, R. E. &
Harrison, R. M. (eds) Biodiversity under threat. RSC Publishing, Cambridge, UK,
pp. 1–32.
References
139
Bolker, B. M., Brooks, M. E., Clark, C. J., Geange, S. W., Poulsen, J. R., Stevens, M. H.
H. & White, J. S. (2008). Generalized linear mixed models: a practical guide for
ecology and evolution. Trends in Ecology and Evolution, 24, 127–135.
Bommarco, R., Kleijn, D. & Potts, S. G. (2013). Ecological intensification: harnessing
ecosystem services for food security. Trends in Ecology and Evolution, 28, 230–
238.
Borcard, D. & Legendre, P. (2012). Is the Mantel correlogram powerful enough to be
useful in ecological analysis? A simulation study. Ecology, 93, 1473–1481.
Boutin, C., Jobin, B., Bélanger, L. & Choinière, L. (2002). Plant diversity in three types
of hedgerows adjacent to crop fields. Biodiversity and Conservation, 11, 1–25.
Brown, B. V. (2001). Flies, gnats, and mosquitoes. In: Levin, S. A. (ed), Encyclopedia of
Biodiversity, Vol. 2. Academic Press, London, pp. 815–826.
Burel, F. (1996). Hedgerows and their role in agricultural landscapes. Critical Reviews in
Plant Sciences, 15, 169–190.
Burgio, G. & Sommaggio, D. (2007). Syrphids as landscape indicators in Italian
agroecosystems. Agriculture, Ecosystems and Environment, 120, 416–422.
Burnham, K. P. & Anderson, D. R. (2002). Model selection and multimodel inference: a
practical information-theoretic approach, 2nd ed. Springer, New York, USA.
C
Cagnolo, L., Valladares, G. R., Salvo, A., Cabido, M. & Zak, M. (2009). Habitat
fragmentation and species loss across three interacting trophic levels: effects of
life-history and food-web traits. Conservation Biology, 23, 1167–1175.
Cardinale, B. J., Duffy, J. E., Gonzalez, A., Hooper, D. U., Perrings, C., Venail, P.,
Narwani, A., Mace, G. M., Tilman, D., Wardle, D. A., Kinzig, A. P., Daily, G. C.,
Loreau, M., Grace, J. B., Larigauderie, A., Srivastava, D. S. & Naeem, S. (2012).
Biodiversity loss and its impact on humanity. Nature, 486, 59–67.
Carvalho, J. C., Cardoso, P., Borges, P. A., Schmera, D. & Podani, J. (2013). Measuring
fractions of beta diversity and their relationships to nestedness: a theoretical and
empirical comparison of novel approaches. Oikos, 122, 825–834.
Carvell, C., Meek, W. R., Pywell, R. F., Goulson, D. & Nowakowski, M. (2007).
Comparing the efficacy of agri‐environment schemes to enhance bumble bee
abundance and diversity on arable field margins. Journal of Applied Ecology, 44,
29–40.
Casner, K. L., Forister, M. L., O’Brien, J. M., Thorne, J., Waetjen, D. & Shapiro, A. M.
(2014). Contribution of urban expansion and a changing climate to decline of a
butterfly fauna. Conservation Biology, 28, 773–82.
Cerretti, P. (2010). I tachinidi della fauna italiana (Diptera Tachinidae), con chiave
interattiva dei generi ovest paleartici, Vol. I & II + CD–rom (in Italian with
English interactive key). Cierre Edizioni, Verona, IT.

References
140
Cerretti, P., O’Hara, J. E., Wood, D. M., Shima, H., Inclán, D. J. & Stireman, J. O. III
(2014). Signal through the noise? Phylogeny of the Tachinidae (Diptera) as
inferred from morphological evidence. Systematic Entomology, 39, 335–353.
Cerretti, P. & Tschorsnig, H.-P. (2010). Annotated host catalogue for the Tachinidae
(Diptera) of Italy. Stuttgarter Beiträge zur Naturkunde, A, Neue Serie, 3, 305–340.
Cerretti, P., Tschorsnig, H.-P., Lopresti, M. & Di Giovanni, F. (2012). MOSCHweb - A
matrix-based interactive key to the genera of the Palaearctic Tachinidae (Insecta,
Diptera). Zookeys, 205, 5–18.
Clough, Y., Holzschuh, A., Gabriel, D., Purtauf, T., Kleijn, D., Kruess, A., Steffan-
Dewenter, I., Kleijn, D. & Tscharntke, T. (2007). Alpha and beta diversity of
arthropods and plants in organically and conventionally managed wheat fields.
Journal of Applied Ecology, 44, 804–812.
Colwell, R. K. (2013). EstimateS: statistical estimation of species richness and shared
species from samples. Version 9. Available from: http://purl.oclc.org/estimates
(accessed November 2012).
Concepción, E. D., Díaz, M., Kleijn, D., Báldi, A., Batáry, P., Clough, Y., Gabriel, D.,
Herzog, F., Holzschuh, A., Knop, E., Marshall, E. J. P., Tscharntke, T. &
Verhulst, J. (2012a). Interactive effects of landscape context constrain the
effectiveness of local agri-environmental management. Journal of Applied
Ecology, 49, 695–705.
Concepción, E. D., Fernández-González, F. & Díaz, M. (2012b). Plant diversity
partitioning in Mediterranean croplands: effects of farming intensity, field edge
and landscape context. Ecological Applications, 22, 1005–1014.
Coudrain, V., Herzog, F. & Entling, M. H. (2013). Effects of habitat fragmentation on
abundance, larval food and parasitism of a spider-hunting wasp. PLoS ONE, 8,
e59286.
Cronin, J. T. (2007). From population sources to sieves: the matrix alters host-parasitoid
source-sink structure. Ecology, 88, 2966–2976.
Cronin, J. T. & Reeve, J. D. (2005). Host-parasitoid spatial ecology: a plea for a
landscape-level synthesis. Proceedings of the Royal Society B: Biological
Sciences, 272, 2225–2235.
Crowder, D. W., Northfield, T. D., Strand, M. R. & Snyder, W. E. (2010). Organic
agriculture promotes evenness and natural pest control. Nature, 466, 109–112.
D
Dainese, M., Inclán, D. J., Sitzia, T. & Marini, L. (2015). Testing scale-dependent effects
of semi-natural habitats on farmland biodiversity. Ecological Applications (in
press).
Dauber, J., Hirsch, M., Simmering, D., Waldhardt, R., Otte, A. & Wolters V. (2003).
Landscape structure as an indicator of biodiversity: matrix effects on species
richness. Agriculture, Ecosystems and Environment, 98, 321–329.
References
141
Deguines, N., Jono, C., Baude, M., Henry, M., Julliard, R. & Fontaine, C. (2014). Large-
scale trade-off between agricultural intensification and crop pollination services.
Frontiers in Ecology and the Environment, 12, 212–217.
Díaz, S., Fargione, J., Chapin, F. S. III & Tilman, D. (2006). Biodiversity Loss Threatens
Human Well-Being. PLoS Biology, 4, e277.
Dodson, C. H. (1962). The importance of pollination in the evolution of the orchids of
tropical America. American Orchid Society Bulletin, 31, 525–735.
Donald, R. F., Green, R. E. & Heath, M. F. (2001). Agricultural intensification and the
collapse of Europe's farmland bird populations. Proceedings of the Royal Society
of London. Series B: Biological Sciences, 268, 25–29.
Dover, J. W. & Sparks T. H. (2000). A review of the ecology of butterflies in British
hedgerows. Journal of Environmental Management, 60, 51–63.
Dover, J. W., Sparks, T. H. & Greatorex-Davies, J. (1997). The importance of shelter for
butterflies in open landscapes. Journal of Insect Conservation, 1, 89–97.
Duelli, P. & Obrist, M. K. (2003). Regional biodiversity in an agricultural landscape: the
contribution of seminatural habitat islands. Basic and Applied Ecology, 4, 129–
138.
Dunning, J. B., Danielson, B. J. & Pulliam, H. R. (1992). Ecological processes that affect
populations in complex landscapes. Oikos, 65, 169–175.
E
Eggleton, P. & Belshaw, R. (1993). Comparisons of dipteran, hymenopteran and
coleopteran parasitoids: provisional phylogenetic explanations. Biological Journal
of the Linnean Society, 48, 213–26.
Eggleton, P. & Gaston, K. J. (1992). Tachinid host ranges: a reappraisal (Diptera:
Tachinidae). Entomologist's Gazette, 43, 139–43.
Ekroos, J., Rundlöf, M. & Smith, H. G. (2013). Trait-dependent responses of flower-
visiting insects to distance to semi-natural grasslands and landscape heterogeneity.
Landscape Ecology, 28, 1–10.
Ekroos, J. & Kuussaari M. (2012). Landscape context affects the relationship between
local and landscape species richness of butterflies in semi-natural habitats.
Ecography, 35, 232–238.
Elsen van, T. (2000). Species diversity as a task for organic agriculture in Europe.
Agriculture, Ecosystems and Environment, 77, 101–109.
Elzinga, J. A., van Nouhuys, S., van Leeuwen, D. J. & Biere, A. (2007). Distribution and
colonization ability of three parasitoids and their herbivorous host in a fragmented
landscape. Basic and Applied Ecology, 8, 75–88.
References
142
Ewers, R. M. & Didham, R. K. (2006). Confounding factors in the detection of species
responses to habitat fragmentation. Biological Reviews, 81, 117–142.
Eyre, M. D. & Leifert, C. (2011). Crop and field boundary influences on the activity of a
wide range of beneficial invertebrate groups on a split conventional/organic farm
in northern England. Bulletin of Entomological Research, 101, 135–144.
Eyre, M. D., Luff, M. L. & Leifert, C. (2013). Crop, field boundary, productivity and
disturbance influences on ground beetles (Coleoptera, Carabidae) in the
agroecosystem. Agriculture, Ecosystems and Environment, 165, 60–67.
F
FAOSTAT (2014). FAO statistics division. Available from: http://faostat3.fao.org
(accessed on 09 Dicember 2014).
Feber, R. E., Smith, H. & Macdonald, D. W. (1996). The effects on butterfly abundance
of the management of uncropped edges of arable fields. Journal of Applied
Ecology, 33, 1191–1205.
Fenoglio, M. S., Salvo, A., Videla, M. & Valladares, G. R. (2010). Plant patch structure
modifies parasitoid assemblage richness of a specialist herbivore. Ecological
Entomology, 35, 594–601.
Fenoglio, M. S., Srivastava, D., Valladares, G., Cagnolo, L. & Salvo, A. (2012). Forest
fragmentation reduces parasitism via species loss at multiple trophic levels.
Ecology, 93, 2407–2420.
Ferraz, G., Russell, G. J., Stouffer, P. C., Bierregaard, R. O., Pimm, S. L. & Lovejoy, T.
E. (2003). Rates of species loss from Amazonian forest fragments. Proceedings of
the National Academy of Sciences, 100, 14069–14073.
Finke, D. L. & Denno, R. F. (2004). Predator diversity dampens trophic cascades. Nature,
429, 407–410.
Fischer, J. & Lindenmayer, D. B. (2007). Landscape modification and habitat
fragmentation: a synthesis. Global Ecology and Biogeography, 16, 265–280.
Flick, T., Feagan, S. & Fahrig, L. (2012). Effects of landscape structure on butterfly
species richness and abundance in agricultural landscapes in eastern Ontario,
Canada. Agriculture, Ecosystems and Environment, 156, 123–133.
Foley, J. A., DeFries, R., Asner, G. P., Barford, C., Bonan, G., Carpenter, S. R., Chapin,
F. S., Coe, M. T., Daily, G. C., Gibbs, H. K., Helkowski, J. H., Holloway, T.,
Howard, E. A., Kucharik, C. J., Monfreda, C., Patz, J. A., Prentice, I. C.,
Ramankutty, N. & Snyder, P. K. (2005). Global consequences of land use.
Science, 309, 570–574.
Forman, R. T. T. & Baudry, J. (1984). Hedgerows and hedgerow networks in landscape
ecology. Environmental Management, 8, 495–510.
Fournier, D. A., Skaug, H. J., Ancheta, J., Ianelli, J., Magnusson, A., Maunder, M.,
Nielsen, A. & Sibert, J. (2012). AD Model Builder: using automatic

References
143
differentiation for statistical inference of highly parameterized complex nonlinear
models. Optimization Methods and Software, 27, 233–249.
Frost, C. M., Didham, R. K., Rand, T. A., Peralta, G. & Tylianakis, J. M. (in press).
Community-level net spillover of natural enemies from managed to natural forest.
Ecology.
Fuller, R. J., Norton, L. R., Feber, R. E., Johnson, P. J., Chamberlain, D. E., Joys, A. C.,
Mathews, F., Stuart, R. C., Townsend, M. C., Manley, W. J., Wolfe, M. S.,
Macdonald, D. W. & Firbank, L. G. (2005). Benefits of organic farming to
biodiversity vary among taxa. Biology Letters, 1, 431–434.
G
Gabriel, D., Carver, S. J., Durham, H., Kunin, W. E., Palmer, R. C., Sait, S. M., Stagl, S.
& Benton, T. G. (2009). The spatial aggregation of organic farming in England
and its underlying environmental correlates. Journal of Applied Ecology, 46, 323–
333.
Gabriel, D., Roschewitz, I., Tscharntke, T. & Thies, C. (2006). Beta diversity at different
spatial scales: plant communities in organic and conventional agriculture.
Ecological Applications, 16, 2011–2021.
Gabriel, D., Sait, S. M., Hodgson, J. A., Schmutz, U., Kunin, W. E. & Benton, T. G.
(2010). Scale matters: the impact of organic farming on biodiversity at different
spatial scales. Ecology Letters, 13, 858–869.
Gagic, V., Hänke, S., Thies, C. & Tscharntke, T. (2014). Community variability in aphid
parasitoids versus predators in response to agricultural intensification. Insect
Conservation and Diversity, 7, 103–112.
Gaujour, E., Amiaud, B., Mignolet, C. & Plantureux, S. (2012). Factors and processes
affecting plant biodiversity in permanent grasslands. A review. Agronomy for
Sustainable Development, 32, 133–160.
Geiger, F., Bengtsson, J., Berendse, F., Weisser, W. W., Emmerson, M., Morales, M. B.,
Ceryngier, P., Liira, J., Tscharntke, T., Winqvist, C., Eggers, S., Bommarco, R.,
Pärt, T., Bretagnolle, V., Plantegenest, M., Clement, L. W., Dennis, C., Palmer,
C., Oñate, J. J., Guerrero, I., Hawro, V., Aavik, T., Thies, C., Flohre, A., Hänke,
S., Fischer, C., Goedhart, P. W. & Inchausti, P. (2010). Persistent negative effects
of pesticides on biodiversity and biological control potential on European
farmland. Basic and Applied Ecology, 11, 97–105.
Geiger, F., Wäckers, F. L. & Bianchi, F. J. J. A. (2008). Hibernation of predatory
arthropods in semi-natural habitats. Biocontrol, 54, 529–535.
Géneau, C. E., Wäckers, F. L., Luka, H., Daniel, C. & Balmer, O. (2012). Selective
flowers to enhance biological control of cabbage pests by parasitoids. Basic and
Applied Ecology, 13, 85–93.
Godfray, H. C. J. (1994). Parasitoids: behavioral and evolutionary ecology. Princeton
University Press, Princeton.

References
144
Godfray, H. C. J., Beddington, J. R., Crute, I. R., Haddad, L., Lawrence, D., Muir, J. F.,
Pretty, J., Robinson, S., Thomas, S. M. & Toulmin, C. (2010). Food security: the
challenge of feeding 9 billion people. Science, 327, 812–818.
Gonthier, D. J., Ennis, K. K., Farinas, S., Hsieh, H.-Y., Iverson, A. L., Batáry, P.,
Rudolphi, J., Tscharntke, T., Cardinale, B. J. & Perfecto, I. (2014). Biodiversity
conservation in agriculture requires a multi-scale approach. Proceedings of the
Royal Society of London Series B - Biological Sciences, 281, 20141358.
Green, R. E., Cornell, S. J., Scharlemann, J. P. W. & Balmford, A. (2005). Farming and
the fate of wild nature. Science, 307, 550–555.
Grenier, S. (1988). Applied biological control with tachinid flies (Diptera, Tachinidae): a
review. Anzeiger für Schädlingskunde, Pflanzenschutz, Umweltschutz, 61, 49–56.
H
Haaland, C., Naisbit, R. E. & Bersier, L. F. (2011). Sown wildflower strips for insect
conservation: a review. Insect Conservation and Diversity, 4, 60–80.
Haenke, S., Kovács-Hostyánszki, A., Fründ, J., Batáry, P., Jauker, B., Tscharntke, T. &
Holzschuh, A. (2014). Landscape configuration of crops and hedgerows drives
local syrphid fly abundance. Journal of Applied Ecology, 51, 505–513.
Hance, T. (1997). Do aphids survive over summer in maize crops in Belgium? A test of
the “aphid reservoir” hypothesis. Biological Agriculture & Horticulture, 15, 191–
201.
Hannon, L. E. & Sisk, T. D. (2009). Hedgerows in an agri-natural landscape: Potential
habitat value for native bees. Biological Conservation, 142, 2140–2154.
Hanski, I. (1999). Metapopulation Ecology. Oxford University Press, New York.
Hanski, I. (2011). Habitat loss, the dynamics of biodiversity, and a perspective on
conservation. Ambio, 40, 248–255.
Hanski, I. & Ovaskainen, O. (2002). Extinction debt at extinction threshold. Conservation
Biology, 16, 666–673.
Haraldseide, H. & Tschorsnig, H. P. (2014). On the biology of Loewia foeda (Meigen)
(Diptera: Tachinidae). Tachinid Times, 27, 15–19.
Heisswolf, A., Reichmann, S., Poethke, H. J., Schrader, B. & Obermaier, E. (2009).
Habitat quality matters for the distribution of an endangered leaf beetle and its egg
parasitoid in a fragmented landscape. Journal of Insect Conservation, 13, 165–
175.
Holland, J. M., Winder, L. & Perry, J. N. (2000). The impact of dimethoate on the spatial
distribution of beneficial arthropods in winter wheat. Annals of Applied Biology,
136, 93–105.
Holt, R. D., Lawton, J. H., Polis, G. A. & Martinez, N. D. (1999). Trophic rank and the
species–area relationship. Ecology, 80, 1495–1504.

References
145
Holzschuh, A., Steffan‐Dewenter, I. & Tscharntke, T. (2008). Agricultural landscapes
with organic crops support higher pollinator diversity. Oikos, 117, 354–361.
Holzschuh, A., Steffan‐Dewenter, I. & Tscharntke, T. (2010). How do landscape
composition and configuration, organic farming and fallow strips affect the
diversity of bees, wasps and their parasitoids? Journal of Animal Ecology, 79,
491–500.
Hooper, D. U., Chapin, F. S., Ewel, J. J., Hector, A., Inchausti, P., Lavorel, S., Lawton, J.
H., Lodge, D. M., Loreau, M., Naeem, S., Schmid, B., Setala, H., Symstad, A. J.,
Vandermeer, J. & Wardle, D. A. (2005). Effects of biodiversity on ecosystem
functioning: A consensus of current knowledge. Ecological Monographs, 75, 3–
35.
Hothorn, T., Bretz, F. & Westfall, P. (2008). Simultaneous inference in general
parametric models. Biometrical Journal, 50, 346–363.
Humbert, J. Y., Ghazoul, J. & Walter, T. (2009). Meadow harvesting techniques and their
impacts on field fauna. Agriculture, Ecosystems and Environment, 130, 1–8.
I
Ichiki, R. T., Kainoh, Y., Yamawaki, Y. & Nakamura, S. (2011). The parasitoid fly
Exorista japonica uses visual and olfactory cues to locate herbivore‐infested
plants. Entomologia Experimentalis et Applicata, 138, 175–183.
Inclán, D. J., Cerretti, P. & Marini, L. (2014). Interactive effects of area and connectivity
on the diversity of tachinid parasitoids in highly fragmented landscapes.
Landscape Ecology, 29, 879–889.
Inclán, D. J., Cerretti, P., Gabriel, D., Benton, T. G., Sait, S. M., Kunin, W. E., Gillespie,
M. A. K. & Marini, L. (accepted for publication). Organic farming enhances
parasitoid diversity at the local and landscape scale. Journal of Applied Ecology.
J
Jauker, F. & Wolters, V. (2008). Hoverflies are efficient pollinators of oilseed rape.
Oecologia, 156, 819–823.
Johnson, M. T. J., Lajeunesse, M. J. & Agrawal, A. A. (2006). Additive and interactive
effects of plant genotypic diversity on arthropod communities and plant fitness.
Ecology Letters, 9, 24–34.
Johnson, P. C. D. (2014). Extension of Nakagawa & Schielzeth’s R2GLMM to random
slopes models. Methods in Ecology and Evolution, 5, 944–946.
Jonsson, M., Buckley, H. L., Case, B. S., Wratten, S. D., Hale, R. J. & Didham, R. K.
(2012). Agricultural intensification drives landscape‐context effects on host–
parasitoid interactions in agroecosystems. Journal of Applied Ecology, 49, 706–
714.

References
146
K
Karp, D. S., Rominger, A. J., Zook, J., Ranganathan, J., Ehrlich, P. R. & Daily, G. C.
(2012). Intensive agriculture erodes β-diversity at large scales. Ecology Letters,
15, 963–970.
Kindt, R. & Coe, R. (2005). Tree diversity analysis. A manual and software for common
statistical methods for ecological and biodiversity studies. World Agroforestry
Centre (ICRAF), Nairobi
Kivinen, S., Luoto, M., Kuussaari, M. & Saarinen, K. (2007). Effects of land cover and
climate on species richness of butterflies in boreal agricultural landscapes.
Agriculture, Ecosystems and Environment, 122, 453–460.
Klapwijk, M. J. & Lewis, O. T. (2012). Host–parasitoid dynamics in a fragmented
landscape: Holly trees, holly leaf miners and their parasitoids. Basic and Applied
Ecology, 13, 94–105.
Kleijn, D., Baquero, R. A., Clough, Y., Díaz, M., De Esteban, J., Fernández, F., Gabriel,
D., Herzog, F., Holzschuh, A., Jöhl, R., Knop, E., Kruess, A., Marshall, E. J. P.,
Steffan-Dewenter, I., Tscharntke, T., Verhulst, J., West, T. M. & Yela, J. L.
(2006). Mixed biodiversity benefits of agri-environment schemes in five European
countries. Ecology Letters, 9, 243–54.
Kleijn, D., Kohler, F., Báldi, A., Batáry, P., Concepción, E. D., Clough, Y., Díaz, M.,
Gabriel, D., Holzschuh, A., Knop, E., Kovács, A., Marshall, E. J. P., Tscharntke,
T. & Verhulst, J. (2009). On the relationship between farmland biodiversity and
land-use intensity in Europe. Proceedings of the Royal Society of London Series B
- Biological Sciences, 276, 903–9.
Kleijn, D., Rundlof, M., Scheper, J., Smith, H. G. & Tscharntke, T. (2011). Does
conservation on farmland contribute to halt biodiversity decline? Trends in
Ecology and Evolution, 26, 474–481.
Kleijn, D. & Sutherland, W. J. (2003). How effective are European agri-environment
schemes in conserving and promoting biodiversity? Journal of Applied Ecology,
40, 947–969.
Klein, A., Steffan-Dewenter, I. & Tscharntke, T. (2003). Fruit set of highland coffee
depends on the diversity of pollinating bees. Proceedings of the Royal Society of
London Series B - Biological Sciences, 270, 955–961.
Krauss, J., Steffan-Dewenter, I., Müller, C. B. & Tscharntke, T. (2005). Relative
importance of resource quantity, isolation and habitat quality for landscape
distribution of a monophagous butterfly. Ecography, 28, 465–474.
Kruess, A. (2003). Effects of landscape structure and habitat type on a plant-herbivore-
parasitoid community. Ecography, 26, 283–290.
Kruess, A. & Tscharntke, T. (1994). Habitat fragmentation, species loss, and biological
control. Science, 264, 1581–84.

References
147
Kruess, A. & Tscharntke, T. (2002). Contrasting responses of plant and insect diversity to
variation in grazing intensity. Biological Conservation, 106, 293–302.
Kuussaari, M., Heliölä, J., Luoto, M. & Pöyry, J. (2007). Determinants of local species
richness of diurnal Lepidoptera in boreal agricultural landscapes. Agriculture,
Ecosystems and Environment, 122, 366–376.
L
Lambin, E. & Geist, H. (2006). Land Use and Land Cover Change: Local Processes,
Global Impacts. Springer, New York.
Landis, D. A., Menalled, F. D., Costamagna, A.C. & Wilkinson, T. K. (2005).
Manipulating plant resources to enhance beneficial arthropods in agricultural
landscapes. Weed Science, 53, 902–908.
Landis, D. A., Wratten, S. D. & Gurr, G. M. (2000). Habitat management to conserve
natural enemies of arthropod pests in agriculture. Annual Review of Entomology,
45, 175–201.
Legendre, P. (2014). Interpreting the replacement and richness difference components of
beta diversity. Global Ecology and Biogeography, 23, 1324–1334.
Legendre, P., Borcard, D. & Peres-Neto, P. R. (2005). Analyzing beta diversity:
partitioning the spatial variation of community composition data. Ecological
Monographs, 75, 435–450.
Legendre, P. & Legendre, L. (1998). Numerical ecology. Elsevier, Amsterdam.
Lenteren van, J. C., & Bueno, V. H. (2003). Augmentative biological control of
arthropods in Latin America. BioControl, 48, 123–139.
Lenth, R. V. (2013). lsmeans: least-squares means. R package version 1.10-4.
Letourneau, D. K. & Bothwell, S. G. (2008). Comparison of organic and conventional
farms: challenging ecologists to make biodiversity functional. Frontiers in
Ecology and the Environment, 6, 430–438.
Letourneau, D. K., Bothwell-Allen, S. G. & Stireman, J. O. III (2012). Perennial habitat
fragments, parasitoid diversity and parasitism in ephemeral crops. Journal of
Applied Ecology, 49, 1405–1416.
Lohaus, K., Vidal, S. & Thies, C. (2013). Farming practices change food web structures
in cereal aphid-parasitoid-hyperparasitoid communities. Oecologia, 171, 249–259.
Longley, M. (1999). A review of pesticide effects upon immature aphid parasitoids within
mummified hosts. International Journal of Pest Management, 45, 139–145.
M
MacArthur, R. H. (1967). The theory of island biogeography (Vol. 1). Princeton
University Press.

References
148
Maccherini, S., Chiarucci, A. & De Dominicis, V. (2000). Structure and species diversity
of Bromus erectus grasslands of biancana badlands. Belgian Journal of Botany,
133, 3–14.
Macfadyen, S. & Muller, W. (2013). Edges in agricultural landscapes: species
interactions and movement of natural enemies. PloS ONE, 8, e59659.
Macfadyen, S., Craze, P. G., Polaszek, A., van Achterberg, K. & Memmott, J. (2011).
Parasitoid diversity reduces the variability in pest control services across time on
farms. Proceedings of the Royal Society B: Biological Sciences, 278, 3387–3394.
Macfadyen, S., Gibson, R., Polaszek, A., Morris, R. J., Craze, P. G., Planqué, R.,
Symondson, W. O. C. & Memmott, J. (2009). Do differences in food web
structure between organic and conventional farms affect the ecosystem service of
pest control? Ecology Letters, 12, 229–238.
Magurran, A. E. & McGill, B. J. (2010). Biological diversity: frontiers in measurement
and assessment. Oxford University Press, Oxford.
Marini, L., Fontana, P., Klimek, S., Battisti, A. & Gaston, K. J. (2009). Impact of farm
size and topography on plant and insect diversity of managed grasslands in the
Alps. Biological Conservation, 142, 394–403.
Marini, L., Bommarco, R., Fontana, P. & Battisti, A. (2010). Disentangling effects of
habitat diversity and area on orthopteran species with contrasting mobility.
Biological Conservation, 143, 2164–2171.
Marini, L., Fontana P., Scotton, M. & Klimek, S. (2007). Vascular plant and Orthoptera
diversity in relation to grassland management and landscape composition in the
European Alps. Journal of Applied Ecology, 45, 361–370.
Marini, L., Quaranta, M., Fontana, P., Biesmeijer, J. B. & Bommarco, R. (2012).
Landscape context and elevation affect wild bee communities in intensive apple
orchards. Basic and Applied Ecology, 13, 681–689.
Marini, L., Scotton, M., Klimek, S. & Pecile, A, (2008). Patterns of plant species richness
in Alpine hay meadows: Local vs. landscape controls. Basic and Applied Ecology,
9, 365–372.
Marshall, E. J. R. & Moonen, A. C. (2002). Field margins in northern Europe: their
functions and interactions with agriculture. Agriculture, Ecosystems and
Environment, 89, 5–21.
Martinson, H. M. & Fagan, W. F. (2014). Trophic disruption: a meta‐analysis of how
habitat fragmentation affects resource consumption in terrestrial arthropod
systems. Ecology Letters, 17, 1178–1189.
Matesanz, S., Gimeno, T. E., de la Cruz, M., Escudero, A. & Valladares, F. (2011).
Competition may explain the fine-scale spatial patterns and genetic structure of
two co-occurring plant congeners. Journal of Ecology, 99, 838–848.
Matson, P. A., Parton, W. J., Power, A. G. & Swift, M. J. (1997). Agricultural
intensification and ecosystem properties. Science, 277, 504–509.

References
149
Maudsley, M. J. (2000). A review of the ecology and conservation of hedgerow
invertebrates in Britain. Journal of Environmental Management, 60, 65–76.
Mendenhall, C. D., Karp, D. S., Meyer, C. F., Hadly, E. A. & Daily, G. C. (2014).
Predicting biodiversity change and averting collapse in agricultural landscapes.
Nature, 509, 213–217.
Merckx, T., Marini L., Feber R. E. & Macdonald, D. W. (2012). Hedgerow trees and
extended-width field margins enhance macro-moth diversity: implications for
management. Journal of Applied Ecology, 49, 1396–1404.
Meyer, B., Jauker, F. & Steffan-Dewenter, I. (2009). Contrasting resource-dependent
responses of hoverfly richness and density to landscape structure. Basic and
Applied Ecology, 10, 178–186.
Millenium Ecosystem Assessment (2005). Ecosystems and Human Well-Being. World
Resources Institute, Washington, DC.
Moilanen, A. & Nieminen, M. (2002). Simple connectivity measures in spatial ecology.
Ecology, 83, 1131–1145.
N
Nakagawa, S. & Schielzeth, H. (2013). A general and simple method for obtaining R2
from generalized linear mixed-effects models. Methods in Ecology and Evolution,
4, 133–142.
Nihei, S. S. & Schwarz, E. D. A. (2011). On the first tachinid fly (Diptera, Tachinidae)
carrying Asclepiadoideae pollinaria in the Neotropical Region. Revista Brasileira
de Entomologia, 55, 441–444.
Norris, K. (2008). Agriculture and biodiversity conservation: opportunity knocks.
Conservation Letters, 1, 2–11.
Nouhuys van, S. (2005). Effects of habitat fragmentation at different trophic levels in
insect communities. Annales Zoologici Fennici, 42, 433–447.
O
Ó hUallacháin, D., Anderson, A., Fritch, R., McCormack, S., Sheridan, H. & Finn, J. A.
(2013). Field margins: a comparison of establishment methods and effects on
hymenopteran parasitoid communities. Insect Conservation and Diversity, 7, 289–
307.
O’Hara, J. E. (2012). World genera of the Tachinidae (Diptera) and their regional
occurrence. Version 7.0. PDF document, 75 pp. Available from:
http://www.nadsdiptera.org/Tach/Genera/Gentach_ver7.pdf (accessed November
2013).
O’Hara, J. E. (2013). History of tachinid classification (Diptera, Tachinidae). ZooKeys,
316, 1–34.

References
150
O’Hara, J. E. (2014). World genera of the Tachinidae (Diptera) and their regional
occurrence. Version 8.0. PDF document, 87 pp. Available from:
http://www.nadsdiptera.org/Tach/WorldTachs/Genera/Gentach_ver8.pdf
(accessed December 9, 2014).
Öckinger, E. & Smith, H. G. (2006). Semi-natural grasslands as population sources for
pollinating insects in agricultural landscapes. Journal of Applied Ecology, 44, 50–
59.
Oksanen, J., Blanchet, G., Kindt, R., Legendre, P., Minchin, P. R., O'Hara, R. B.,
Simpson, G. L., Solymos, P., Stevens, M. H. H., Wagner, H. (2013). Vegan:
Community Ecology Package. R package version 2.0-10. http://CRAN.R-
project.org/package=vegan
Oksanen, J., Kindt, R., Legendre, P., O’Hara, B. & Stevens, M. (2007). Vegan:
community ecology package. R package version 1.15–4. (http://r-forge.r-
project.org/projects/vegan).
Ollerton, J. & Liede, S. (2014). The ASCLEPOL Database. Available from:
http://www.bio.uni-bayreuth.de/planta2/research/pollina/as_pol_d.html (accessed
December 9, 2014).
Olson, D. M., Takasu, K. & Lewis, W. J. (2005). Food needs of adult parasitoids:
behavioral adaptations and consequences. In: Wäckers, F. L., van Rijn, P. C. J. &
Bruin, J. (eds), Plant-provided Food for Carnivorous Insects. Cambridge
University Press, Cambridge, pp. 137–147.
Olson, D. M. & Wäckers, F. L. (2007). Management of field margins to maximize
multiple ecological services. Journal of Applied Ecology, 44, 13–21.
P
Pardini, R., Bueno, A. A., Gardner, T. A., Prado, P. I. & Metzger, J. P. (2010). Beyond
the fragmentation threshold hypothesis: regime shifts in biodiversity across
fragmented landscapes. PLoS ONE, 5, e13666.
Paston, S. & Rotheray, G. E. (2009). Eriothrix rufomaculata (De Geer, 1776) (Diptera,
Tachinidae) reared from Chrysoteuchia culmella (Linnaeus) (Lepidoptera,
Pyralidae) – a first British host record. Dipterists Digest, 16, 3–6.
Pereira, H. M., Leadley, P. W., Proença, V., Alkemade, R., Scharlemann, J. P. W.,
Fernandez-Manjarrés, J. F., Araújo, M. B., Balvanera, P., Biggs, R., Cheung, W.
W. L., Chini, L., Cooper, H. D., Gilman, E. L., Guénette, S., Hurtt, G. C.,
Huntington, H. P., Mace, G. M., Oberdorff, T., Revenga, C., Rodrigues, P.,
Acholes, R. J., Sumaila, U. R. & Walpole, M. (2010). Scenarios for global
biodiversity in the 21st century. Science, 330, 1496–1501.
Pérez-Lachaud, G., Batchelor, T. P. & Hardy, I. C. (2004). Wasp eat wasp: facultative
hyperparasitism and intra-guild predation by bethylid wasps. Biological Control,
30, 149–155.

References
151
Perfecto, I. & Vandermeer, J. (2010). The agroecological matrix as alternative to the land
sparing/agriculture intensification model. Proceedings of the National Academy of
Sciences, 197, 5786–5791.
Pinheiro, J., Bates, D., DebRoy, S., Sarkar, D. & R Development Core Team (2013).
nlme: Linear and Nonlinear Mixed Effects Models. R package version 3.1–111,
http://CRAN.R-project.org/package=nlme.
Pinheiro, J., Bates, D., DebRoy, S., Sarkar, D. & R Core Team (2015). nlme: Linear and
Nonlinear Mixed Effects Models. R package version 3.1-119, http://CRAN.R-
project.org/package=nlme.
Podani, J. & Schmera, D. (2011). A new conceptual and methodological framework for
exploring and explaining pattern in presence–absence data. Oikos, 120, 1625–
1638.
Podani, J. & Schmera, D. (2012). A comparative evaluation of pairwise nestedness
measures. Ecography, 35, 889–900.
Polis, G. A., Anderson, W. B. & Holt, R. D. (1997). Toward an integration of landscape
and food web ecology: the dynamics of spatially subsidized food webs. Annual
Review of Ecology and Systematics, 28, 289–316.
Pollard, E. (1977). A method for assessing changes in the abundance of butterflies.
Biological Conservation, 12, 115–134.
Pöyry, J., Luoto, M., Paukkunen, J., Pykälä, J., Raatikainen, K. & Kuussaari, M. (2006).
Different responses of plants and herbivore insects to a gradient of vegetation
height: an indicator of the vertebrate grazing intensity and successional age.
Oikos, 115, 401–412.
Pulliam, H. R. (1988). Sources, sinks, and population regulation. American Naturalist,
132, 652–661.
Pywell, R., Warman, E., Sparks, T., Greatorex-Davies, J., Walker, K., Meek, W., Carvell
C., Petit, S. & Firbank, L. (2004). Assessing habitat quality for butterflies on
intensively managed arable farmland. Biological Conservation, 118, 313–325.
R
R Development Core Team (2013). The R foundation for Statistical Computing, ver 3.0.2
Vienna University of Technology, Vienna. Available at: http://www.r–project.org/
Radford, J. Q., Bennett, A. F. & Cheers, G. J. (2005). Landscape-level thresholds of
habitat cover for woodland-dependent birds. Biological conservation, 124, 317–
337.
Rand, T. A. & Louda, S. M. (2006). Spillover of agriculturally subsidized predators as a
potential threat to native insect herbivores in fragmented landscapes. Conservation
Biology, 20, 1720–1729.
Rand, T.A. & Tscharntke, T. (2007). Contrasting effects of natural habitat loss on
generalist and specialist aphid natural enemies. Oikos, 116, 1353–1362.
References
152
Rand, T. A., Tylianakis, J. M. & Tscharntke, T. (2006). Spillover edge effects: the
dispersal of agriculturally subsidized insect natural enemies into adjacent natural
habitats. Ecology Letters, 9, 603–614.
Regione Autonoma Friuli Venezia Giulia (2003). Uso del suolo aggiornato all'anno 2000
realizzato nell'ambito del Progetto "MOLAND FVG - Consumo ed uso del
territorio del Friuli Venezia Giulia" (2001-2002). Regione Autonoma Friuli
Venezia Giulia, Servizio Pianificazione Territoriale, Trieste, IT.
Regione Veneto (2009). Banca Dati della Copertura del Suolo della Regione Veneto.
Regione del Veneto, Unità di Progetto per il SIT e la cartografia, Venezia, IT.
Robinson, R. A. & Sutherland, W. J. (2002). Post-war changes in arable farming and
biodiversity in Great Britain. Journal of Applied Ecology, 39, 157–176.
Roland, J. & Taylor, P. (1997). Insect parasitoid species respond to forest structure at
different spatial scales. Nature, 386, 710–713.
Rösch, V., Tscharntke, T., Scherber, C. & Batáry, P. (2013). Landscape composition,
connectivity and fragment size drive effects of grassland fragmentation on insect
communities. Journal of Applied Ecology, 50, 387–394.
Rosen, C. (ed) (2000). World Resources 2000-2001: People and ecosystems: The fraying
web of life. Elsevier, Oxford, UK.
Rosenzweig, M. L. (1995). Species Diversity in Space and Time. Cambridge University
Press, Cambridge.
Rundlöf, M., Bengtsson J. & Smith, H. G. (2008). Local and landscape effects of organic
farming on butterfly species richness and abundance. Journal of Applied Ecology,
45, 813–820.
Rundlöf, M., Edlund, M. & Smith H. G. (2010). Organic farming at local and landscape
scales benefits plant diversity. Ecography, 33, 514–522.
Rundlöf, M. & Smith, H. G. (2006). The effect of organic farming on butterfly diversity
depends on landscape context. Journal of Applied Ecology, 43, 1121–1127.
Rusch, A., Valantin-Morison, M., Sarthou, J. P. & Roger-Estrade, J. (2010). Biological
control of insect pests in agroecosystems: effects of crop management, farming
systems, and semi natural habitats at the landscape scale: a review. Advances in
Agronomy, 109, 219–389.
S
Sala, O. E., Chapin, F. S., Armesto, J. J., Berlow, R., Bloomfield, J., Dirzo, R., Huber-
Sanwald, E., Huenneke, L. F., Jackson, R. B., Kinzig, A., Leemans, R., Lodge, D.,
Mooney, H. A., Oesterheld, M., Poff, N. L., Sykes, M. T., Walker, B. H., Walker,
M. & Wall, D. H. (2000). Biodiversity – global biodiversity scenarios for the year
2100. Science, 287, 1770–1774.

References
153
Salveter, R. (1998). The influence of sown herb strips and spontaneous weeds on the
larval stages of aphidophagous hoverflies (Dipt., Syrphidae). Journal of Applied
Entomology, 122, 103–114.
Schellhorn, N. A., Bianchi, F. J. J. A. & Hsu, C. L. (2014). Movement of entomophagous
arthropods in agricultural landscapes: links to pest suppression. Annual Review of
Entomology, 59, 559–581.
Scheper, J., Holzschuh, A., Kuussaari, M., Potts, S.G., Rundlöf, M., Smith, H.G. &
Kleijn, D. (2013). Environmental factors driving the effectiveness of European
agri‐environmental measures in mitigating pollinator loss–a meta‐analysis.
Ecology Letters, 16, 912–920.
Scherber, C., Eisenhauer, N., Weisser, W. W., Schmid, B., Voigt, W., Schulze, E. D.,
Roscher, C., Weigelt, A., Allan, E., Beßler, H., Bonkowski, M., Buchmann, N.,
Buscot, F., Clement, L. W., Ebeling, A., Engels, C., Fischer, M. S., Halle, S.,
Kertscher, I., Klein, A.-M., Koller, R., König, S., Kowalski, E., Kummer, V., Kuu,
A., Lange, M., Lauterbach, D., Middelhoff, C., Migunova, V. D., Milcu, A.,
Müller, R., Partsch, S., Petermann, J. S., Renker, C., Rottstock, T., Sabais, A.,
Scheu, S., Schumacher, J., Temperton, V. M. & Tscharntke, T. (2010). Bottom-up
effects of plant diversity on multitrophic interactions in a biodiversity experiment.
Nature, 468, 553–556.
Schröter, L. & Irmler, U. (2013). Organic cultivation reduces barrier effect of arable
fields on species diversity. Agriculture, Ecosystems and Environment, 164, 176–
180.
Segoli, M. & Rosenheim, J. A. (2013). The link between host density and egg production
in a parasitoid insect: comparison between agricultural and natural habitats.
Functional Ecology, 27, 1224–1232.
Shaw, M. (2006). Habitat Considerations for Parasitic Wasps (Hymenoptera). Journal of
Insect Conservation, 10, 117–127.
Showers, W. B. (1993). Diversity and variation of European corn borer populations. In:
Kim, K. C. & McPheron, B. A. (eds) Evolution of Insect Pests/Patterns of
Variation. John Wiley and Sons, New York, pp. 287–309.
Siemann, E., Tilman, D., Haarstad, J. & Ritchie, M. (1998). Experimental tests of the
dependence of arthropod diversity on plant diversity. The American Naturalist,
152, 738–750.
Sitzia, T. (2007). Hedgerows as corridors for woodland plants: a test on the Po Plain,
northern Italy. Plant Ecology, 188, 235–252.
Sitzia, T., Trentanovi, G., Marini, L., Cattaneo, D. & Semenzato, P. (2013). Assessment
of hedge stand types as determinants of woody species richness in rural field
margins. iForest - Biogeosciences and Forestry, 6, 201–208.
Sitzia, T., Dainese, M. & McCollin, D. (2014). Environmental factors interact with spatial
processes to determine herbaceous species richness in woody field margins. Plant
Ecology, 215, 1323–1335.

References
154
Soares-Filho, B. S., Nepstad, D. C., Curran, L. M., Cerqueira, G. C., Garcia, R. A.,
Ramos, C. A., Voll, E., McDonald, A., Lefebvre, P. & Schlesinger, P. (2006).
Modelling conservation in the Amazon basin. Nature, 440, 520–523.
Sotherton, N. W. (1998). Land-use changes and the decline of farmland wildlife: an
appraisal of the set-aside approach. Biological Conservation, 83, 259–268.
Speight, M. C. D. (2013). Species accounts of European Syrphidae (Diptera), 2013. Syrph
the Net, the database of European Syrphidae, vol.72, Syrph the Net publications,
Dublin, 316 pp.
Speight, M. C. D. & Sarthou, J.-P. (2010). StN keys for the identification of adult
European Syrphidae (Diptera). Syrph the Net, the database of European
Syrphidae, Vol. 60, Syrph the Net publications, Dublin, 107 pp.
Stamps, J. A., Buechner, M. & Krishnan, V. V. (1987). The effects of edge permeability
and habitat geometry on emigrations from patches of habitat. American Naturalist,
129, 533–552.
Steffan-Dewenter, I. & Tscharntke, T. (2002). Insect communities and biotic interaction
on fragmented calcareous grasslands—a mini review. Biological Conservation,
104, 275–284.
Steffan-Dewenter, I., Münzenberg, U., Bürger C., Thies, C. & Tscharntke, T. (2002).
Scale-dependent effects of landscape context on three pollinator guilds. Ecology,
83, 1421–1432.
Stireman, J. O. III (2002). Host location and selection cues in a generalist tachinid
parasitoid. Entomologia Experimentalis et Applicata, 103, 23–34.
Stireman, J. O. III (2005). The evolution of generalization? Host range in parasitoid flies.
Journal of Evolutionary Biology, 18, 325–336.
Stireman, J. O. III (2008). α and β diversity of a tachinid parasitoid community over space
and time. Annals of the Entomological Society of America, 101, 362–370.
Stireman, J. O. III, Cerretti P., Whitmore, D., Hardersen, S. & Gianelle, D. (2012).
Composition and stratification of a tachinid (Diptera: Tachinidae) parasitoid
community in a European temperate plain forest. Insect Conservation and
Diversity, 5, 346–357.
Stireman, J. O. III & Singer, M. S. (2003). What determines host range in parasitoids? An
analysis of a tachinid parasitoid community. Oecologia, 135, 629–638.
Stireman, J. O. III, O'Hara, J. E. & Wood, D. M. (2006). Tachinidae: evolution, behavior,
and ecology. Annual Review of Entomology, 51, 525–555.
Stoate, C., Boatman, N. D., Borralho, R. J., Carvalho, C., De Snoo, G. R. & Eden, P.
(2001). Ecological impacts of arable intensification in Europe. Journal of
Environmental Management, 63, 337–365.
Swift, M. J., Vandermeer, J., Ramakrishnan, P. S., Anderson, J. M., Ong, C. K. &
Hawkins, B. A. (1996). Biodiversity and agroecosystem function. In: Cushman, J.

References
155
H., Mooney, H. A., Medina, E., Sala, O. E. & Schulze, E. D. (eds) Functional
Roles of Biodiversity: A Global Perspective. Wiley, Chichester, pp. 261–298.
T
Taylor, P. D., Fahrig, L., Henein, K. & Merriam, G. (1993). Connectivity is a vital
element of landscape structure. Oikos, 68, 571–573.
Tews, J., Brose, U., Grimm, V., Tielbörger, K., Wichmann, M. C., Schwager, M. &
Jeltsch, F. (2004). Animal species diversity driven by habitat
heterogeneity/diversity: the importance of keystone structures. Journal of
Biogeography, 31, 79–92.
Thies, C., Haenke, S., Scherber, C., Bengtsson, J., Bommarco, R., Clement, L. W.,
Ceryngier, P., Dennis, C., Emmerson, M., Gagic, V., Hawro, V., Liira, J.,
Weisser, W. W., Winqvist, C. & Tscharntke, T. (2011). The relationship between
agricultural intensification and biological control: experimental tests across
Europe. Ecological Applications, 21, 2187–2196.
Thies, C., Steffan-Dewenter, I. & Tscharntke, T. (2003). Effects of landscape context on
herbivory and parasitism at different spatial scales. Oikos, 101, 18–25.
Thies, C. & Tscharntke, T. (1999). Landscape structure and biological control in
agroecosystems. Science, 285, 893–895.
Thies, C., Steffan-Dewenter, I. & Tscharntke, T. (2008). Interannual landscape changes
influence plant-herbivore-parasitoid interactions. Agriculture, Ecosystems and
Environment, 125, 266–268.
Thomas, J. A. (2005). Monitoring change in the abundance and distribution of insects
using butterflies and other indicator groups. Philosophical Transactions of the
Royal Society of London Series B - Biological Sciences, 360, 339–57.
Thomas, J. A., Bourn, N. A., Clarke, R. T., Stewart, K. E., Simcox, D. J., Pearman, G. S.,
Curtis, R. & Goodger, B. (2001). The quality and isolation of habitat patches both
determine where butterflies persist in fragmented landscapes. Proceedings of the
Royal Society of London Series B - Biological Sciences, 268, 1791–1796.
Tilman, D., Fargione, J., Wolff, B., D’Antonio, C., Dobson, A., Howarth, R., Schindler,
D., Schlesinger, W. H., Simberloff, D. & Swackhamer, D. (2001). Forecasting
agriculturally driven global environmental change. Science, 292, 281–284.
Tooker, J. F., Hauser, M. & Hanks, L. M. (2006). Floral host plants of Syrphidae and
Tachinidae (Diptera) of central Illinois. Annals of the Entomological Society of
America, 99, 96–112.
Tscharntke, T., Bommarco, R., Clough, Y., Crist, T. O., Kleijn, D., Rand, T. A.,
Tylianakis, J. M., van Nouhuys, S. & Vidal, S. (2007). Conservation biological
control and enemy diversity on a landscape scale. Biological Control, 43, 294–
309.
References
156
Tscharntke, T., Clough, Y., Wanger, T.C., Jackson, L., Motzkea, I., Perfecto, I.,
Vandermeer, J. & Whitbread, A. (2012). Global food security, biodiversity
conservation and the future of agricultural intensification. Biological
Conservation, 151, 53–59.
Tscharntke, T., Klein, A. M., Kruess, A., Steffan-Dewenter, I. & Thies, C. (2005).
Landscape perspectives on agricultural intensification and biodiversity -
ecosystem service management. Ecology Letters, 8, 857–874.
Tscharntke, T., Rand, A. T. & Bianchi, J. J. A. F. (2005). The landscape context of
trophic interactions: insect spillover across the crop-noncrop interface. Annales
Zoologici Fennici, 42, 421–432.
Tscharntke, T., Sekercioglu, C. H., Dietsch, T. V., Sodhi, N. S., Hoehn, P. & Tylianakis,
J. M. (2008). Landscape constraints on functional diversity of birds and insects in
tropical agroecosystems. Ecology, 89, 944–951.
Tscharntke, T., Tylianakis, J. M., Rand, T. A., Didham, R. K., Fahrig, L., Batáry, P.,
Bengtsson, J., Clough, Y., Crist, T. O., Dormann, C. F., Ewers, R. M., Fründ, J.,
Holt, R. D., Holzschuh, A., Klein, A. M., Kleijn, D., Kremen, C., Landis, D. A.,
Laurance, W., Lindenmayer, D., Scherber, C., Sodhi, N., Steffan-Dewenter, I.,
Thies, C., van der Putten, W. H. & Westphal, C. (2012). Landscape moderation of
biodiversity patterns and processes - eight hypotheses. Biological Reviews, 87,
661–85.
Tuck, S. L., Winqvist, C., Mota, F., Ahnström, J., Turnbull, L. A. & Bengtsson, J. (2014).
Land‐use intensity and the effects of organic farming on biodiversity: a
hierarchical meta‐analysis. Journal of Applied Ecology, 51, 746–755.
Tylianakis, J. M., Klein, A.-M. & Tscharntke, T. (2005). Spatiotemporal variation in the
diversity of Hymenoptera across a tropical habitat gradient. Ecology, 86, 3296–
3302.
V
Valladares, G., Salvo, A. & Cagnolo, L. (2006). Habitat fragmentation effects on trophic
processes of insect–plant food webs. Conservation Biology, 20, 212–217.
Veres, A., Petit, S., Conord, C. & Lavigne, C. (2013). Does landscape composition affect
pest abundance and their control by natural enemies? A review. Agriculture,
Ecosystems and Environment, 166, 110–117.
Vickery, J. A., Feber, R. E. & Fuller, R. J. (2009). Arable field margins managed for
biodiversity conservation: a review of food resource provision for farmland birds.
Agriculture, Ecosystems and Environment, 133, 1–13.
Vinatier, F., Gosme, M. & Valantin-Morison, M. (2013). Explaining host–parasitoid
interactions at the landscape scale: a new approach for calibration and sensitivity
analysis of complex spatio-temporal models. Landscape Ecology, 28, 217–231.

References
157
W
Weibull, A.-C., Bengtsson, J. & Nohlgren, E. (2000). Diversity of butterflies in the
agricultural landscape: the role of farming system and landscape heterogeneity.
Ecography, 23, 743–750.
Whittingham, M. J. (2007). Will agri-environment schemes deliver substantial
biodiversity gain, and if not why not? Journal of Applied Ecology, 44, 1–5.
Whittingham, M. J., Stephens, P. A., Bradbury, R. B. & Freckleton, R. P. (2006). Why do
we still use stepwise modelling in ecology and behaviour? Journal of Animal
Ecology, 75, 1182–1189.
Wilby, A. & Thomas, M. B. (2002). Natural enemy diversity and pest control: patterns of
pest emergence with agricultural intensification. Ecology Letters, 5, 353–360.
Williams, S. C., Arnaud, P.H. & Lowe, G. (1990). Parasitism of Anuroctonus
phaiodactylus (Wood) and Vaejovis spinigerus (Wood) (Scorpiones: Vaejovidae)
by Spilochaetosoma californicum Smith (Diptera: Tachinidae), and a review of
parasitism in scorpions. Myia, 5, 11–27.
Wratten, S. D., Bowie, M. H., Hickman, J. M., Evans, A. M., Sedcole, J. R. & Tylianakis,
J. M. (2003). Field boundaries as barriers to movement of hover flies (Diptera:
Syrphidae) in cultivated land. Oecologia, 134, 605–611.
Wratten, S. D., White, A. J., Bowie, M. H., Berry, N. A. & Weigmann, U. (1995).
Phenology and ecology of hoverflies (Diptera: Syrphidae) in New Zealand.
Environmental Entomology, 24, 595–600.
Wright, H. L., Lake, I. R. & Dolman, P. M. (2012). Agriculture — a key element for
conservation in the developing world. Conservation Letters, 5, 11–19.
Z
Zobel, M. (1997). The relative of species pools in determining plant species richness: an
alternative explanation of species coexistence? Trends in Ecology and Evolution,
12, 266–269.


co-authors affiliations
159
Current affiliations of co-authors
Benton Tim G.
School of Biology, Faculty of Biological Sciences, University of Leeds, Leeds,
LS2 9JT, UK
Cerretti Pierfilippo
DAFNAE-Entomology, University of Padova, Viale dell’Università 16, 35020
Legnaro (Padova), Italy
Department of Biology and Biotechnology “Charles Darwin”, University of Rome
“La Sapienza”, Piazzale A. Moro 5, 00185 Rome, Italy
Dainese Matteo
DAFNAE-Entomology, University of Padova, Viale dell’Università 16, 35020
Legnaro, Padova, Italy
Gabriel Doreen
Institute of Crop and Soil Science, Julius Kühn-Institut (JKI), Federal Research
Centre for Cultivated Plants, Bundesallee 50, D-38116 Braunschweig, Germany
Gillespie Mark A.K.
School of Biology, Faculty of Biological Sciences, University of Leeds, Leeds,
LS2 9JT, UK
Kunin William E.
School of Biology, Faculty of Biological Sciences, University of Leeds, Leeds,
LS2 9JT, UK
Marini Lorenzo
DAFNAE-Entomology, University of Padova, Viale dell’Università 16, 35020
Legnaro, Padova, Italy
Paniccia Dino
Via Colle 13, 03100 Frosinone, Italy
co-authors affiliations
160
Sait Steven M.
School of Biology, Faculty of Biological Sciences, University of Leeds, Leeds,
LS2 9JT, UK
Sitzia Tommaso
Department of Land, Environment, Agriculture and Forestry, University of
Padova, Viale dell’Università 16, 35020 Legnaro, Padova, Italy
Publications
161
Publications
Dissertation
Inclán, D. J., Cerretti, P. & Marini, L. (2014). Interactive effects of area and connectivity
on the diversity of tachinid parasitoids in highly fragmented landscapes.
Landscape Ecology, 29, 879–889.
Dainese, M., Inclán, D. J., Sitzia, T. & Marini, L. (in press). Testing scale-dependent
effects of semi-natural habitats on farmland biodiversity. Ecological Applications.
Inclán, D. J., Cerretti, P., Gabriel, D., Benton, T. G., Sait, S. M., Kunin, W. E., Gillespie,
M. A. K. & Marini, L. (accepted). Organic farming enhances parasitoid diversity
at the local and landscape scale. Journal of Applied Ecology.
Inclán, D. J., Cerretti, P. & Marini, L. (submited). Landscape effect on parasitoid
spillover between crop and non-crop habitats.
Inclán, D. J., Dainese, M., Cerretti, P., Paniccia, D. & Marini, L. (submited). Spillover of
natural enemies between contrasting field margins and crops.
Other publications
Inclán, D. J. & Stireman J. O. III (2014). A new species and synonymy of the
Neotropical Eucelatoria Townsend and redescription of Myiodoriops
Townsend. ZooKeys, 464, 63–97.
Inclán, D. J. (2014). A new range extension for Erythromelana distincta Inclan
(Tachinidae). The Tachinid Times, 27, 32–33.
Cerretti, P., Di Giulio, A., Romani, R., Inclán, D. J., Whitmore, D., Di Giovanni, F.,
Scalici, M. & Minelli, A. (2014). First report of exocrine epithelial glands in
oestroid flies: the tachinid sexual patches (Diptera: Oestroidea: Tachinidae).
Acta Zoologica. (online first).
Cerretti, P., O’Hara, J., Wood, M., Shima, H., Inclán, D. J. & Stireman, J. O. III (2014).
Signal through the noise? Phylogeny of the Tachinidae (Diptera) as inferred
from morphological evidence. Systematic Entomology, 39, 335–353.
Inclán, D. J. & Stireman, J. O. III (2013). Revision of the genus Erythromelana
Townsend (Diptera: Tachinidae) and analysis of its phylogeny and
diversification. Zootaxa, 3621: 1–82.
Inclán, D. J. & Stireman, J. O. III (2011). Tachinid (Diptera: Tachinidae) parasitoid
diversity and temporal abundance at a single site in the Northeastern United
States. Annals of the Entomological Society of America, 104, 287–296.
Publications
162
Inclán, D. J. (2010). Revisión del Género Erythromelana Townsend, 1919 (Díptera:
Tachinidae) con notas en su filogenia y diversificación. M.S. Thesis, Wright
State University, Dayton, OH, USA.
Inclán, D. J. & Stireman, J. O. III (2009). A preliminary study of the diversity and
temporal patterns of abundance of Tachinidae in Southwestern OH. The
Tachinid Times, 22, 1–4.
Inclán, D. J., Bermúdez, F. J., Alvarado, E., Ellis, M. A., Williams, R. N. & Acosta, N.
(2008). Comparison of biological and conventional insecticide treatments for the
management of the pineapple fruit borer, Strymon megarus (LEPIDOPTERA:
LYCAENIDAE) in Costa Rica. Ecological Engineering, 34, 328–331.
Inclán, D. J., Alvarado, E. & Williams, R. N. (2007). Evaluación de cuatro insecticidas
naturales para el control de Tecla, Strymon megarus (Godart) (LEPIDOPTERA:
LYCAENIDAE), en el cultivo de la piña. Tierra Tropical, 3, 199–210.
Inclán, D. J. (2006). Evaluación de Insecticidas Naturales en el Control de Strymon
megarus. (LEPIDOPTERA: LYCAENIDAE) en Piña. Proyecto de Graduación,
Universidad EARTH. Guácimo, Limón, Costa Rica.
Inclán, D. J., Williams, R. N., Ellis, M. A., Fickle, D. S. & McClure, K. B. (2006).
Managing the multicoloured Asian lady beetle in grapes, 2005. Arthropod
Manag Tests, 31, L7.
Williams, R. N., Fickle, D. S., McClure, K. B., Inclán, D. J. (2006). Chemical
evaluations for control of the multicoloured Asian lady beetle on grapes.
Arthropod Manag Tests, 31, C11.
Recommended