Uncertainty quantification in modeling of microfluidic T-sensor based diffusionimmunoassayAman Kumar Jha and Supreet Singh Bahga Citation Biomicrofluidics 10 014105 (2016) doi 10106314940040 View online httpdxdoiorg10106314940040 View Table of Contents httpscitationaiporgcontentaipjournalbmf101ver=pdfcov Published by the AIP Publishing Articles you may be interested in Inducing chemotactic and haptotactic cues in microfluidic devices for three-dimensional in vitro assays Biomicrofluidics 8 064122 (2014) 10106314903948 Modeling and validation of autoinducer-mediated bacterial gene expression in microfluidic environments Biomicrofluidics 8 034116 (2014) 10106314884519 Planar lens integrated capillary action microfluidic immunoassay device for the optical detection of troponin I Biomicrofluidics 7 064112 (2013) 10106314837755 Optimum drift velocity for single molecule fluorescence bursts in micronano-fluidic channels Appl Phys Lett 101 043120 (2012) 10106314739471 Studying enzymatic bioreactions in a millisecond microfluidic flow mixer Biomicrofluidics 6 012803 (2012) 10106313665717
This article is copyrighted as indicated in the article Reuse of AIP content is subject to the terms at httpscitationaiporgtermsconditions Downloaded to IP
103279253 On Wed 13 Jan 2016 165946
Uncertainty quantification in modeling of microfluidicT-sensor based diffusion immunoassay
Aman Kumar Jha and Supreet Singh Bahgaa)
Department of Mechanical Engineering Indian Institute of Technology DelhiNew Delhi 110016 India
(Received 28 November 2015 accepted 5 January 2016 published online 13 January 2016)
Comparison of experimental data with modeling predictions is essential for making
quantitative measurements of species properties such as diffusion coefficients and
species concentrations using a T-sensor To make valid comparisons between
experimental data and model predictions it is necessary to account for uncertainty
in model predictions due to uncertain values of model parameters We present
an analysis of uncertainty induced in model predictions of a T-sensor based
competitive diffusion immunoassay due to uncertainty in diffusion constants
binding reaction rate constants and inlet flow speed We use a non-intrusive
stochastic uncertainty quantification method employing polynomial chaos
expansions to represent the dependence of uncertain species concentrations on the
uncertainty in model parameters Our simulations show that the uncertainties in
model parameters lead to significant spatially varying uncertainty in predicted con-
centration In particular the diffusivity of fluorescently labeled probe antigen domi-
nates the overall uncertainty The predicted uncertainty in fluorescence intensity is
minimum near the centerline of T-sensor and relatively high in the regions with
gradients in fluorescence intensity We show that using centerline fluorescence in-
tensity instead of first derivative of fluorescence intensity as the system response
for measuring sample antigen concentration in T-sensor based competitive diffu-
sion immunoassay leads to lower uncertainty and higher detection sensitivityVC 2016 AIP Publishing LLC [httpdxdoiorg10106314940040]
I INTRODUCTION
The field of microfluidics has ushered the development of lab-on-a-chip systems wherein
laboratory operations such as mixing reaction and detection of chemical species can be inte-
grated on a single chip1ndash3 The T-sensor is one of the simplest microfluidic devices which
leverages low Reynolds number laminar flow and controlled diffusive mixing of reactants for
chemical sensing4ndash8 In a T-sensor shown schematically in Fig 1(a) two fluid streams enter
from separate inlets and flow parallel to each other in the main channel The chemical species
dissolved in these two co-flowing fluid streams diffuse into the adjacent streams creating a
narrow inter-diffusion zone where they react The reactions in this inter-diffusion zone can be
quantified using several signal transduction mechanisms including fluorescence4 and electro-
chemical detection9 T-sensors have found several applications in chemistry and biochemistry
such as determination of species concentrations5 diffusion coefficients610 monitoring reaction
kinetics11 and performing immunoassays712
Early work on T-sensors was limited to qualitative estimation of unknown analyte concen-
trations through basic comparisons Subsequently Kamholz et al4 extended the applicability of
T-sensor for making quantitative measurements through comparison of experimental data
with predictions from a mathematical model for convection diffusion and reactions of chemi-
cal species Kamholz et al4 performed fluorescence visualization of binding reaction between a
a)bahgamechiitdacin and URL webiitdacin~bahga
1932-1058201610(1)01410515$3000 VC 2016 AIP Publishing LLC10 014105-1
BIOMICROFLUIDICS 10 014105 (2016)
This article is copyrighted as indicated in the article Reuse of AIP content is subject to the terms at httpscitationaiporgtermsconditions Downloaded to IP
103279253 On Wed 13 Jan 2016 165946
fluorophore (Albumin Blue 580) and human serum albumin in T-sensor and compared the
experimental data with the mathematical model to determine the diffusivity of fluorophore In a
following study Kamholz et al6 fitted experimental data of species diffusion in a T-sensor
with an analytical model to determine diffusion coefficients of fluorescently labeled biotin insu-
lin ovalbumin and streptavidin These studies underline the importance of modeling and simu-
lation of physico-chemical processes in T-sensor for extending its usefulness for quantitative
analysis As is true for other microfluidic systems modeling and simulations can also help in
optimizing the design of T-sensor to obtain desired results such as the width of inter-diffusion
zone and signal intensity
The existing modeling and simulation analyses of T-sensor are based on solving determin-
istic convection-diffusion-reaction equations wherein the model parameters such as species dif-
fusivities reaction constants and flow rates are assumed to be deterministic constants413 In
practice these model parameters are not known exactly due to experimental measurement
uncertainty or inherent variabilities Therefore deterministic models are unable to quantify
uncertainty in the model predictions due to uncertainty in model parameters Since experimental
data fitted with model predictions is used for quantitative analysis using T-sensor neglecting
uncertainty in simulation predictions can lead to errors in estimation of physical quantities such
as species concentrations diffusivities and reaction rates Therefore to make proper compari-
son between experimental data and modeling predictions it is necessary to account for uncer-
tainty in modeling and simulation results due to uncertainty in model parameters Moreover
uncertainty quantification in simulations of T-sensor can provide valuable information regarding
spatial distribution of uncertainty in measured signals Such information can be used for choos-
ing the detection location and developing quantification methods to minimize uncertainty in
experimental measurements
In the current work we present uncertainty quantification in model predictions of transport
and reactions of chemical species in a T-sensor As a practical example we consider the case
of a T-sensor based competitive diffusion immunoassay described by Hatch et al7 The working
FIG 1 Schematic illustrating the operation of a T-sensor based competitive diffusion immunoassay (a) Fluorescently
labeled antigen and unlabeled sample antigen molecules are mixed in the upper stream whereas the lower stream contains
antibody molecules specific to the antigen (b) The antigen and the antibody molecules diffuse into the adjacent flow
streams and bind with each other in the narrow inter-diffusion zone (c) The binding of labeled-antigen and antibody slows
down the diffusive transport of labeled-antigen into the lower stream resulting in a peak in the fluorescence intensity meas-
ured along the lateral direction (y-direction) Since labeled-antigen and sample antigen compete for the same binding sites
on the antibody the peak in fluorescence signal decreases with increase in sample antigen concentration
014105-2 A K Jha and S S Bahga Biomicrofluidics 10 014105 (2016)
This article is copyrighted as indicated in the article Reuse of AIP content is subject to the terms at httpscitationaiporgtermsconditions Downloaded to IP
103279253 On Wed 13 Jan 2016 165946
principle of a T-sensor based competitive diffusion immunoassay illustrated in Fig 1 is based
on the changes in diffusive transport of a fluorescently labeled probe antigen upon binding with
antibody molecules while the probe antigen competes with the unlabeled sample antigen (SA)
for common binding sites We elucidate the effect of uncertainty in model parameters such as
inlet flow speed diffusivities and reaction rate constants on spatial variation of uncertainty in
the species concentration and fluorescence intensity Using the spatial variation of uncertainty
in model predictions we provide guidelines for performing quantitative measurements in
experiments so as to improve the detection sensitivity and resolution while reducing
uncertainty
The uncertainty in model parameters which is associated with measurement errors or inher-
ent variability in experiments can be accounted for using stochastic uncertainty quantification
techniques14 In particular we employ a non-intrusive stochastic uncertainty propagation
approach based on Polynomial Chaos (PC) expansions14ndash17 as described by Reagan et al17
Unlike deterministic simulations in this method the model parameters are treated as uncertain
For each uncertain parameter a new stochastic dimension is used to describe its probability den-
sity function PC expansions are used to describe the dependence of model predictions on these
stochastic dimensions The coefficients or the spectral mode strengths of the PC expansions are
then evaluated using numerical quadrature through multiple solutions of the deterministic
model Such an approach readily provides the uncertainty propagation information in terms of
PC expansions of model predictions Knowing the PC expansions of model predictions the
spatial variation of uncertainty and the individual contribution of each uncertain parameter to
the overall uncertainty can be computed We note that uncertainty propagation analysis
can also be performed through Monte Carlo (MC) simulations albeit with unacceptably large
number of simulations18 Moreover unlike PC expansion based methods MC simulations do
not provide the coupled contribution of uncertainty in model parameters to the overall uncer-
tainty in model predictions19
While PC expansions have been used extensively for uncertainty quantification in several
fields such as structural mechanics20 gas dynamics21 aerodynamics22 and combustion17 its
potential for designing and improving microfluidic systems has not been fully utilized Xiu and
Karniadakis18 used the example of pressure-driven microchannel flow with non-uniform random
boundary conditions to illustrate the application of generalized PC expansion for uncertainty
quantification Debusschere et al19 analyzed uncertainty in protein-labeling reactions in electro-
kinetic flow in microchannels due to uncertainty in model parameters using PC expansions
Debusschere et al simulated a nonlinear system in which electrokinetic transport of bands of a
protein and a dye at different speeds result in band crossing and reaction Their results provided
interesting insights into the spatial variation of predicted uncertainty in species concentrations
For a similar electrokinetic system preceding the work of Debusschere et al19 Gleeson23 quan-
tified uncertainty in electroosmotic flows and associated transport of uncharged-solute due to
random zeta potential Due to the linearity of flow at low Reynolds number Gleeson23 used
superposition of fluid flows due to different random modes of zeta potential for uncertainty
quantification
The overall focus of existing work on uncertainty quantification of microfluidic systems
has been on propagation of uncertainty from model parameters to model predictions However
these studies do not focus on applying uncertainty quantification for designing or improving a
microfluidic system In contrast the focus of current work is to elucidate the spatial variation
of predicted uncertainty in a microfluidic T-sensor and use uncertainty quantification to provide
guidelines for performing quantitative measurements in experiments to minimize uncertainty
We begin by presenting the deterministic equations for modeling transport and reactions of
chemical species in a microfluidic T-sensor based diffusion immunoassay Next we provide a
description of the stochastic uncertainty quantification methodology using PC expansions We
then present results for uncertainty quantification of convection and diffusion of chemical
species in T-sensor with and without accounting for chemical reactions Based on the results
we explain the spatial variation and composition of uncertainty in predicted values of species
concentrations Thereafter we present a comparative analysis of uncertainty associated with
014105-3 A K Jha and S S Bahga Biomicrofluidics 10 014105 (2016)
This article is copyrighted as indicated in the article Reuse of AIP content is subject to the terms at httpscitationaiporgtermsconditions Downloaded to IP
103279253 On Wed 13 Jan 2016 165946
various methodologies for quantifying analyte concentrations in a T-sensor We also provide
practical guidelines for quantifying analyte concentration in T-sensor to minimize uncertainty
and hence maximize detection sensitivity and resolution
II PHYSICAL MODEL FORMULATION
A T-sensor based competitive diffusion immunoassay
In the current work we present stochastic uncertainty quantification in simulations of a
microfluidic T-sensor based competitive diffusion immunoassay shown schematically in Fig 1
As shown in Fig 1(a) fluorescently labeled-antigen and unlabeled sample antigen molecules are
mixed in the upper flow stream while the antibody molecules specific to the antigen are mixed
in the lower flow stream The low Reynolds number ethRe 1THORN laminar flow conditions in the
T-sensor result in controlled diffusive mixing of the antigen and antibody molecules into the
adjacent streams forming a narrow inter-diffusion zone In this inter-diffusion zone the labeled-
antigen (LA) and unlabeled sample antigen molecules compete to bind with the antibody mole-
cules as shown in Fig 1(b) Upon binding the diffusivity of the labeled-antigen bound with
antibody decreases drastically owing to the large size of antibody molecule This decreases the
downward diffusive transport of the complex of labeled-antigen and antibody resulting in a
peak in the fluorescence signal as shown in Fig 1(c) Since labeled-antigen and sample antigen
compete for the same binding sites on the antibody the peak in fluorescence signal decreases
with an increase in sample antigen concentration
B Mathematical modeling
Simulations of T-sensor based immunoassay require mathematical models for fluid
flow species transport due to convection and diffusion and binding of antigen and antibody
molecules Fluid flow in a microfluidic T-sensor is characterized by low Reynolds number
ethRe frac14 quh=l 1THORN where inertial effects can be neglected Here h is the depth of the channel
and u q and l respectively denote the flow speed fluid density and fluid viscosity Further
simplification comes from the shallow geometry of T-sensor as the depth h is usually signifi-
cantly smaller than the width w of the channel h=w 1 For a shallow rectangular cross-
section channel with h=w 1 the depth-averaged velocity is uniform across the width of the
channel except for narrow regions of OethhTHORN thickness near the side walls where velocity gra-
dients exist to satisfy the no-slip conditions24 Since the inter-diffusion zone at the centerline of
T-sensor is relatively small compared with the width of channel it is reasonable to assume in
our analysis that the average flow velocity is uniform
The transport of antigen and antibody molecules in a T-sensor can be described by three-
dimensional mass conservation equations taking into account convective-diffusive transport and
production (or elimination) terms due to binding reactions The three-dimensional species trans-
port equations can be simplified noting that the time scale associated with diffusion of species
into the depth of T-sensor ethh2=DTHORN is significantly smaller than the convection time scale ethL=uTHORNTherefore the concentration of i-th species ci in the T-sensor can be conveniently described
using two-dimensional species transport equations given by
uci
xfrac14 Di
2ci
x2thorn
2ci
y2
thorn Ri (1)
Here u is the depth-averaged flow speed Di the diffusivity of i-th species and Ri the production
or elimination term to account for binding reactions We assume that flow speed u and diffusiv-
ities Di are spatially constant In a T-sensor the lateral gradients in species concentration occur
over narrow inter-diffusion zone with thickness d ffiffiffiffiffiffiffiffiffiffiffiDL=u
p whereas the axial gradients in
species concentration occur over longer distance of OethLTHORN Therefore the ratio of axial diffusion
ethDi2x ciTHORN to lateral diffusion ethDi
2y ciTHORN scales as d2=L2 frac14 D=ethuLTHORN frac14 Pe1 where Pe is the Peclet
number For a typical T-sensor with u 500 lm s1 L 1 mm and D 5 1010 m2 s1
014105-4 A K Jha and S S Bahga Biomicrofluidics 10 014105 (2016)
This article is copyrighted as indicated in the article Reuse of AIP content is subject to the terms at httpscitationaiporgtermsconditions Downloaded to IP
103279253 On Wed 13 Jan 2016 165946
the Peclet number Pe 1000 Since the axial diffusion is three orders of magnitude lower than
lateral diffusion Equation (1) can be simplified to
uci
xfrac14 Di
2ci
y2thorn Ri (2)
C Binding kinetics
The production or elimination rate Ri of various species in Equation (1) depends on the
binding kinetics Following Hatch et al7 we assume that each antibody molecule contains two
identical binding sites for the antigens Moreover all binding sites are identical and have identi-
cal kinetics for the LA and SA given by
LAthorn AbLAndashAb (3)
SAthorn Ab SAndashAb (4)
The rates of elimination of labeled-antigen and sample antigen are given by
RLA frac14 k1 cAbcLA cLAAb
Keq
(5)
RSA frac14 k1 cAbcSA cSAAb
Keq
(6)
where k1 is the rate constant for forward reaction and Keq is the equilibrium constant for the
binding reactions (3) and (4) The subscripts LA SA Ab LA-Ab and SAndashAb respectively
denote labeled-antigen sample antigen antibody binding sites complex of labeled-antigen and
antibody and complex of sample antigen and antibody We note that cAb denotes the concentra-
tion of antibody binding sites Since every antibody molecule has two binding sites cAb is twice
the concentration of antibody molecules From Equations (3) and (4) we note that the rate of
elimination of binding sites on antibody molecules is ethRLA thorn RSATHORN and the production rates of
the two complexes are RLAndashAb frac14 RLA and RSAndashAb frac14 RSA To quantify the uncertainty in our
simulations we use the solutions to deterministic governing equations (2) and the above model
for binding kinetics at different values of uncertain model parameters to construct the PC
expansions for species concentrations Next we present the methodology for construction of PC
expansions from deterministic simulations
III STOCHASTIC MODEL FORMULATION
We use a non-intrusive stochastic uncertainty quantification method based on PC expan-
sions for propagation of uncertainty from model parameters to model predictions This method
has been presented in detail by Reagan et al17 and we briefly summarize it here In this
technique we introduce an additional stochastic dimension n corresponding to each uncertain
parameter For normally distributed model parameters n Neth0 1THORN is chosen as a random
variable with standard normal probability density function Hence a normally distributed model
parameter b can be described in terms of n as
b frac14 lb thorn rbn (7)
where lb is the mean value of parameter b and rb is the standard deviation The species con-
centrations now have an additional dependence on n besides their spatial variation The species
concentrations ci are described using spectral PC expansions as
ciethx y nTHORN frac14X1kfrac140
cikethx yTHORNwkethnTHORN (8)
014105-5 A K Jha and S S Bahga Biomicrofluidics 10 014105 (2016)
This article is copyrighted as indicated in the article Reuse of AIP content is subject to the terms at httpscitationaiporgtermsconditions Downloaded to IP
103279253 On Wed 13 Jan 2016 165946
where wk are the basis functions of PC expansion and cik are the corresponding spectral mode
strengths for i-th species If the model has only one uncertain parameter the basis functions wk
are one-dimensional Hermite polynomials
w0 frac14 1 w1 frac14 n w2 frac14 n2 1 w3 frac14 n3 3nhellip (9)
In practice the infinite series in Equation (8) can be truncated to a specific order p which is
the highest order polynomial used in the PC expansion Therefore the total number of terms in
PC expansion for the case of one uncertain parameter is pthorn 1
In general for d number of uncertain model parameters a d-dimensional stochastic space
is required for which the basis functions WkethhTHORN are d-dimensional Hermite polynomials in
h frac14 fn1 n2hellip ndg
ciethx y n1 n2hellip ndTHORN frac14XP
kfrac140
cikethx yTHORNWkethn1 n2hellip ndTHORN (10)
Here we have assumed that all stochastic dimensions are uncorrelated The total number of
terms in PC expansion in Equation (10) is ethPthorn 1THORN which depends on the dimensions d and
highest order of polynomial p as
Pthorn 1 frac14 d thorn peth THORNdp
(11)
The d-dimensional Hermite polynomials WkethhTHORN are the product of one dimensional Hermite pol-
ynomials involving multi-index mik
WkethhTHORN frac14Yn
ifrac141
wmikethniTHORN (12)
For example for two uncertain parameters (dfrac14 2) the first few two-dimensional Hermite poly-
nomials are given by
W0ethhTHORN frac14 w0ethn1THORNw0ethn2THORN frac14 1
W1ethhTHORN frac14 w1ethn1THORNw0ethn2THORN frac14 n1
W2ethhTHORN frac14 w0ethn1THORNw1ethn2THORN frac14 n2
W3ethhTHORN frac14 w2ethn1THORNw0ethn2THORN frac14 n21 1
W4ethhTHORN frac14 w1ethn1THORNw1ethn2THORN frac14 n1n2
W5ethhTHORN frac14 w0ethn1THORNw2ethn2THORN frac14 n22 1
(13)
To describe the effect of uncertain model parameters on the species concentrations ci we
compute the coefficients cik of the corresponding PC expansion using a non-intrusive
approach17 To this end we use the orthogonality of Hermite polynomials with respect to the
standard normal probability density function f ethhTHORN and project the PC expansions onto the PC
basis to get
cik x yeth THORN frac14
eth11
ci x y heth THORNWk heth THORNf heth THORN dheth11
W2k heth THORNf heth THORN dh
frac14 hciWkihW2
ki (14)
The integrals in the numerator and denominator can be evaluated by numerical Gauss-Hermite
quadrature which approximates the integrals using weighted average of functional values at
014105-6 A K Jha and S S Bahga Biomicrofluidics 10 014105 (2016)
This article is copyrighted as indicated in the article Reuse of AIP content is subject to the terms at httpscitationaiporgtermsconditions Downloaded to IP
103279253 On Wed 13 Jan 2016 165946
specific points within the domain of integration For example for a single uncertain parameter
(dfrac14 1) the coefficients (or spectral mode strengths) cikethx yTHORN of the PC expansion given by
Equation (8) can be calculated as
cik x yeth THORN frac14
PNjfrac141
ci x y n jeth THORN
wk n jeth THORN
w jeth THORN
PNjfrac141
w2k n jeth THORN
w jeth THORN (15)
Here wethjTHORN is the weight corresponding to the quadrature point hethjTHORN and N is the total number of
quadrature points required to accurately approximate the integral integrals consisting of a poly-
nomial integrand of order up to 2N 1 can be exactly evaluated using N quadrature points
Therefore the calculation of coefficients of PC expansion requires solutions for concentration
field using the deterministic model for various realizations of the random model parameters cor-
responding to quadrature points nethjTHORN j frac14 1hellipN This approach for uncertainty quantification is
non-intrusive in nature as the numerical solver for deterministic model need not be modified to
account for uncertain model parameters
In general for d number of uncertain parameters the quadrature points at which determinis-
tic calculations are performed are given by the d-dimensional tensor product of one-dimensional
quadrature points Therefore as the number of uncertain parameters increases the number
of solutions of the deterministic model required to perform numerical integration increases
exponentially as Nd To overcome this limitation in the current work we use Gauss-Hermite
quadrature over Smolyak grid2526 which requires significantly less number of quadrature points
to perform numerical integration with reasonable accuracy For example Gauss-Hermite quadra-
ture with tensor product of quadrature points for Nfrac14 5 and dfrac14 6 requires Nd frac14 15625 solutions
of the deterministic model whereas same accuracy of numerical integration can be obtained
using Gauss-Hermite quadrature over Smolyak grid with only 85 solutions of the deterministic
model We note that in practice PC expansions are truncated as large number of computations
is required to accurately calculate higher order terms using numerical quadrature
Having obtained the spectral mode strengths or the coefficients of PC expansions we can
compute various statistical moments such as the mean and standard deviation in species
concentrations As noted by Debusschere et al19 the zeroth-order coefficient ci0 represents the
mean concentration field for i-th species because the expectations hWki frac14 0 k gt 0 whereas
the higher order coefficients account for the uncertainty around this mean value The standard
deviation in concentration of i-th species is given by
r2i frac14 hethci hciiTHORN2i frac14
XP
kfrac141
c2ikhW2
ki (16)
The PC expansions also provide the contribution of uncertainty of individual parameters to
the overall uncertainty The contribution of each uncertain parameter to the overall uncertainty
can be obtained by grouping the terms in Equation (16) which correspond to same stochastic
dimension For example consider a second order PC expansion of concentration field with basis
functions given by Equation (13) for the case of two uncertain parameters (dfrac14 2) The individ-
ual contribution of first uncertain parameter (corresponding to n1) to the overall uncertainty is
given by the sum of terms corresponding to W1 and W3 in Equation (16) whereas the term
corresponding to W4 in Equation (16) accounts for the coupled contribution of both uncertain
parameters to the overall uncertainty This feature of uncertainty quantification based on PC
expansions can be used to identify the parameters that are major contributors to the overall
uncertainty in model results
IV RESULTS AND DISCUSSION
We solved the deterministic convection-diffusion-reaction equations (2) for species concen-
trations numerically using a finite difference method The governing Equations (2) were
014105-7 A K Jha and S S Bahga Biomicrofluidics 10 014105 (2016)
This article is copyrighted as indicated in the article Reuse of AIP content is subject to the terms at httpscitationaiporgtermsconditions Downloaded to IP
103279253 On Wed 13 Jan 2016 165946
semi-discretized by approximating the derivatives along the lateral direction (y-direction) using
the second-order central differencing scheme The resulting ordinary differential equations in
x-domain were solved using the fourth-order Runge-Kutta scheme The numerical solutions to
the deterministic model were used for calculating spectral mode strengths cik using stochastic
collocation method discussed in Section III
For all our simulations we considered a T-sensor based diffusion immunoassay system
described by Hatch et al7 The dimensions of T-sensor and the mean values of model parame-
ters were same as those used by Hatch et al for experimental validation of their theoretical
model The width of the T-sensor was 1200 lm and the length was 6400 lm The sample anti-
gen was phenytoin (DSA frac14 58 1010 m2 s1) the labeled-antigen was fluorescein-phenytoin
conjugate (DLA frac14 32 1010 m2 s1) and the antibody was phenytoin-specific polyclonal anti-
body (DAb frac14 43 1011 m2 s1) Since the antibody molecule is significantly larger than the
antigen molecule we assume that the diffusivities of antibody-antigen complexes are the same
as the diffusivity of unbound antibody The forward reaction rate k1 for the binding reactions
was 4 106 M1 s1 and the equilibrium constant Keq was 4 1010 M1 Both inlet flow
streams of T-sensor were assumed to have same average flow speed u of 03475 mm s1
For our calculations we assumed that the model parameters were independent normally
distributed random variables with above mentioned mean values We assumed that the standard
deviation of all diffusion coefficients was 5 of their respective mean values The uncertainty
in species diffusivity is representative of the systematic uncertainty arising from a 62 C tem-
perature fluctuation as diffusivity varies with temperature as D1=D2 frac14 T1l2=ethT2l1THORN27 where l1
and l2 are the viscosity values of water at temperatures T1 and T2 respectively The standard
deviation of flow speed u was taken as 016 of the mean value which is in accordance with
typical resolution of a syringe pump Under the assumption that both upper and lower streams
originate from a dual channel syringe pump the two stream velocities are equal and perfectly
correlated Hence we assigned only one stochastic dimension to account for the uncertainty in
inlet stream velocity We note that uncertainty in microchannel dimensions can also affect the
flow speed For a typical microchannel fabricated using etching the tolerance of channel
dimensions is about 01 of the channel thickness28 For a shallow microchannel with fixed
flow rate this can lead to an uncertainty of 01 in the flow speed This is comparable with
the 016 standard deviation in flow speed which we have assumed in our analysis The stand-
ard deviation in k1 and Keq were taken as 1 of their respective mean values In our analysis
we have neglected the uncertainty due to surface roughness as typical surface roughness of
order 10 nm for etched microchannels2829 has negligible effect on fluid flow30
We performed simulations in a rectangular domain corresponding to the main channel of
T-sensor shown in Fig 1(a) The computational domain was discretized using a uniform grid of
1500 200 grid points This grid size was chosen as doubling the grid points in both x and ydirections resulted in a variation of 01 in the predicted values of concentrations For all our
computations we have represented the species concentrations using third-order PC expansions
The third-order expansions were sufficiently accurate in describing the uncertainty as higher
order spectral mode strengths were significantly smaller than the lower order mode strengths
A Convection and diffusion of single species
To illustrate the application of uncertainty quantification methodology based on PC expan-
sions we begin by considering a simple case of convection-diffusion of a single species in
T-sensor We performed simulations for a T-sensor system in which labeled-antigen with inlet
concentration of 19 nM flows in from the upper inlet and water flows in from the lower inlet
For this case we assumed that sample antigen and antibody are not present Therefore diffusiv-
ity of labeled-antigen and inlet flow speed were the only uncertain parameters The third-order
PC expansion for antigen concentration consisted of 10 coefficients Computation of these 10
coefficients required 29 simulations using Smolyak quadrature based stochastic collocation
Fig 2(a) shows the mean concentration field of labeled-antigen The labeled-antigen
flows into the T-sensor from the upper inlet and diffuses into the lower stream This process is
014105-8 A K Jha and S S Bahga Biomicrofluidics 10 014105 (2016)
This article is copyrighted as indicated in the article Reuse of AIP content is subject to the terms at httpscitationaiporgtermsconditions Downloaded to IP
103279253 On Wed 13 Jan 2016 165946
analogous to transient one-dimensional species diffusion with the axial direction acting as a
ldquotime-likerdquo variable The total predicted standard deviation in the concentration field due to
uncertainty in flow speed and diffusivity of labeled-antigen is shown in Fig 2(b) The uncer-
tainty in concentration field in this case is minimum along the centerline and highest on either
side of the centerline at nearly half the diffusion length The uncertainty tends to ldquodiffuserdquo
along y-direction as the zone of uncertainty grows at downstream locations Fig 2(c) shows the
lateral variation of mean and standard deviation (63r) of the concentration of labeled-antigen
at the exit of T-sensor (xfrac14 64 mm) As expected the mean lateral concentration variation is
sigmoidal in shape The uncertainties in model parameters induce considerable uncertainty in
the simulated labeled-antigen concentration For example at y frac14 500 lm the uncertainty in
concentration is nearly 5
In Figs 2(b) and 2(c) we have shown the predicted values of overall uncertainty
However the PC formalism described in Section III also provides the contribution of each
uncertain parameter to the overall uncertainty Fig 2(d) shows the spatial variation of contribu-
tion of uncertainty in inlet flow speed and diffusivity to the overall uncertainty in exit concen-
tration of labeled-antigen In the current case diffusivity of labeled-antigen is the major
contributor to the overall uncertainty at all locations However the contribution of diffusivity
nearly vanishes near the center Such a trend is expected since the variation in diffusivity tends
to flatten or steepen the lateral concentration distribution without affecting the concentration at
the center The contribution of uncertainty in flow speed follows a similar trend although its
magnitude is low due to lower uncertainty in inlet flow speed compared with that in diffusivity
Since the top and bottom stream velocities are equal variation in inlet flow speed simply
affects the residence time of molecules in the system without affecting the concentration at
the center Consequently the overall uncertainty in concentration is minimum near the center
Fig 2(d) also shows the contribution of coupled effects of flow speed u and diffusivity of
FIG 2 Predicted mean and standard deviation of concentration of labeled-antigen for the case when sample antigen and
antibody are absent (a) Mean concentration field of labeled-antigen for inlet labeled-antigen concentration of 19 nM (b)
Spatial variation of total standard deviation of labeled-antigen concentration The uncertainty is minimum along the center-
line and is highest at nearly half of the diffusion length from the centerline The uncertainty ldquodiffusesrdquo further in the y-
direction at downstream locations (c) Lateral concentration variation with 63r uncertainty bars at the T-sensor exit
(xfrac14 64 mm) The sigmoidal shape of concentration profile is characteristic of transient one-dimensional diffusion here x-
coordinate is the ldquotime-likerdquo variable (d) Individual contributions of uncertainty in model parameters to the overall uncer-
tainty in concentration at xfrac14 64 mm The diffusivity of labeled-antigen DLA is the major contributor to uncertainty The
contributions of uncertainty in flow speed u and diffusivity of labeled-antigen DLA dip near the centerline resulting in a min-
ima in the overall standard deviation
014105-9 A K Jha and S S Bahga Biomicrofluidics 10 014105 (2016)
This article is copyrighted as indicated in the article Reuse of AIP content is subject to the terms at httpscitationaiporgtermsconditions Downloaded to IP
103279253 On Wed 13 Jan 2016 165946
labeled-antigen DLA apart from their individual uncertainty to the overall uncertainty Even
though this coupled contribution is small in comparison with individual contributions of the
uncertain parameters it reinforces the fact that stochastically independent uncertain parameters
interact and give rise to coupled effects which contribute to the uncertainty in model
predictions
B Convection diffusion and reaction of multiple species Competitive diffusion
immunoassay
Next we quantify the uncertainty in simulation of competitive diffusion immunoassay in a
T-sensor The simulated system is similar to the T-sensor system described in Section IV A
However in this case in addition to the labeled-antigen in the upper stream an unlabeled sam-
ple antigen flows into the T-sensor through the upper inlet and an antibody flows in through the
lower inlet The antibody molecules bind with sample and labeled-antigen molecules forming
complexes in the narrow inter-diffusion zone leading to accumulation of labeled-antigen-anti-
body complexes The inlet concentrations of labeled-antigen and antibody binding sites are
19 nM and 74 nM respectively In this case the uncertain parameters are the inlet velocity u
diffusivities of antibody sample antigen and labeled-antigen (DAb DSA and DLA) forward
reaction rate constant k1 and equilibrium constant Keq We performed a series of simulations to
analyze the uncertainty in concentration field of labeled molecules for four values of sample
antigen concentration ranging from 0 to 573 nM For these simulations we expressed the simu-
lation output using third-order PC expansions in six stochastically independent dimensions
there were 84 coefficients in the PC expansion Computation of these 84 coefficients required
389 simulations using Smolyak quadrature
Fig 3(a) shows the mean concentration field of labeled molecules (labeled-antigen and
complex of labeled-antigen and antibody) for inlet sample antigen concentration of 328 nM
Here we have chosen to plot the combined concentration of labeled-antigen and the complex
of labeled-antigen and antibody because in experiments both molecules will contribute to the
measured fluorescence signal Assuming that the fluorescence signal is proportional to the con-
centration of fluorescently labeled molecules the results shown in Fig 3 can also be interpreted
in terms of predicted fluorescence intensity The binding of antibody and labeled-antigen is
evidenced by the appearance of a high concentration band near the center instead of a smooth
sigmoidal lateral variation in concentration of labeled molecules (see also Fig 3(d)) The spatial
variation of standard deviation in the concentration field of labeled molecules is shown in
Fig 3(b) In this case we observe an asymmetry in the standard deviation across the centerline
That is the uncertainty in concentration of labeled molecules is higher on the antibody side
compared with that on the antigen side This is because the diffusion of smaller antigen
molecules into the antibody stream is quicker as compared with the diffusion of bulky antibody
molecules into the antigen stream resulting in higher uncertainty on the antibody side
However similar to the case of single species diffusion discussed in Section IV A the standard
deviation in concentration field near the centerline is conspicuously smaller compared with that
in the neighboring regions
To get further insight into the physico-chemical processes contributing to uncertainty of
T-sensor based diffusion immunoassay we separate out the contributions of model parameters
to the overall uncertainty As shown in Fig 3(c) the diffusivity of labeled-antigen is the major
contributor to uncertainty in concentration of labeled molecules at all locations except near the
center where its contribution nearly vanishes The contribution of antibody diffusivity to the
total standard deviation follows a similar bimodal variation albeit with lower magnitude In
contrast the diffusivity of sample antigen has negligible contribution since sample antigen
molecules do not interact directly with labeled-antigen molecules and sample antigen concentra-
tion of 328 nM is not large enough to significantly affect the labeled-antigen concentration
The contribution of uncertainty in inlet flow speed to the overall uncertainty also shows
bimodal lateral variation which nearly vanishes at the center similar to the case of single
species diffusion discussed in Section IV A The contribution of forward reaction rate constant
014105-10 A K Jha and S S Bahga Biomicrofluidics 10 014105 (2016)
This article is copyrighted as indicated in the article Reuse of AIP content is subject to the terms at httpscitationaiporgtermsconditions Downloaded to IP
103279253 On Wed 13 Jan 2016 165946
to overall uncertainty attains a maxima in the antibody stream due to higher rate of reaction in
that region Lastly the contribution of equilibrium constant Keq is negligible since the rate of
dissociation is extremely small as compared with the forward reaction rate The coupled effect
of uncertainty in different parameters taken two and three at a time apart from their individual
contributions to the overall uncertainty is negligible as shown in Fig 3(c)
In Fig 3(d) we present the mean and uncertainty in lateral concentration variation of
labeled molecules (or fluorescence signal) at the T-sensor exit (xfrac14 64 mm) for varying sample
antigen concentrations The peak in the signal diminishes with increasing sample antigen con-
centration as less number of binding sites is available on the antibody for labeled-antigen when
faced with competition from higher concentration of sample antigen Therefore at high sample
antigen concentrations such as at 573 nM labeled-antigen diffuses without notable binding
That is at high sample antigen concentrations the labeled-antigen concentration variation is
similar to the case shown in Fig 2 when antibody and sample antigen are absent Irrespective
of the sample antigen concentration we note that the uncertainty represented by 63r uncer-
tainty bars in Fig 3(d) is lowest around the center and highest in the neighborhood The pre-
dicted uncertainty reduces very far from the center where the effects of diffusion and reaction
are absent This lateral variation in uncertainty is particularly relevant for deciding the method
of quantification in experiments to minimize the uncertainty In Section IV D we compare
different quantification methods and show that using centerline fluorescence intensity to
quantify antigen concentration leads to higher detection sensitivity and resolution due to lower
uncertainty in that region whereas using the first derivative of normalized fluorescence signal
as proposed by Hatch et al7 leads to lower sensitivity and resolution as uncertainty in signal is
relatively high in the regions where first derivative of signal achieves extreme values
FIG 3 Predicted mean and standard deviation of total concentration of labeled molecules (labeled-antigen in bound and
unbound state) in T-sensor based competitive diffusion immunoassay In these calculations the inlet concentrations of
labeled-antigen and antibody binding sites were 19 nM and 74 nM respectively (a)ndash(c) show results for the case when sam-
ple antigen concentration is 328 nM (a) Mean concentration field of labeled molecules The marked departure from
smooth sigmoidal lateral variation in concentration is due to the accumulation of labeled molecules (b) Total standard
deviation in concentration of labeled molecules The standard deviation is asymmetrically distributed about the centerline
and is significantly low at the centerline (c) Individual contribution of uncertainty in model parameters to overall uncer-
tainty in labeled molecule concentration The diffusivity of labeled-antigen DLA is the dominant contributor to overall
uncertainty throughout the T-sensor Since small antigen molecules diffuse faster than bulky antibody molecules the rate
of binding reactions and hence the uncertainties are higher in the antibody stream (d) Lateral variation of concentration of
labeled molecules with 63r uncertainty bars at T-sensor exit (xfrac14 64 mm) for four values of sample antigen concentration
The accumulation of antigen molecules is evident from the peak near the center which subsides upon increase in sample
antigen concentration
014105-11 A K Jha and S S Bahga Biomicrofluidics 10 014105 (2016)
This article is copyrighted as indicated in the article Reuse of AIP content is subject to the terms at httpscitationaiporgtermsconditions Downloaded to IP
103279253 On Wed 13 Jan 2016 165946
C Effect of sample antigen concentration on uncertainty
We now consider the effect of sample antigen concentration on the spatial variation of pre-
dicted uncertainty Varying the sample antigen concentration affects the binding interaction of
labeled-antigen and antibody This in turn affects the convection-diffusion transport of labeled
species Therefore the contribution of various uncertain parameters to the overall uncertainty
can vary with the concentration of sample antigen
In Fig 4 we compare the lateral variation in contributions of various uncertain parameters
to the total standard deviation at two extreme values of sample antigen concentration (0 nM and
573 nM) Fig 4(a) shows the lateral variation of standard deviation contributions at the
T-sensor exit (xfrac14 64 mm) when no sample antigen is added to the T-sensor The predicted
uncertainty when the sample antigen is absent qualitatively resembles the case shown in
Fig 3(c) when the sample antigen concentration is low (328 nM) That is the uncertainty in
diffusivity of labeled-antigen and antibody dominates the overall uncertainty in concentration of
labeled molecules When the sample antigen is present in excess (573 nM) the overall uncer-
tainty in major part of the inter-diffusion region decreases as shown in Fig 4(b) Moreover
the contribution of diffusivity of antibody is negligible as opposed to the cases of low sample
antigen concentration shown in Figs 3(c) and 4(a) At high sample antigen concentration the
contribution of uncertainty in diffusivity of sample antigen to overall uncertainty increases
appreciably Interestingly at high sample antigen concentration the spatial variation in uncer-
tainty shown in Fig 4(b) resembles that shown in Fig 2(d) for the case of convection-diffusion
of labeled-antigen in absence of sample antigen and antibody This is because at high sample
antigen concentrations the sample antigen dominates the competition for binding with the anti-
body Consequently very less amount of labeled-antigen binds with the antibody Therefore
the labeled-antigen simply convects and diffuses as is the case shown in Fig 2 Nevertheless
the results presented in Figs 3(c) 4(a) and 4(b) show that the overall uncertainty for all values
of sample antigen concentrations is dominated by the diffusivity of labeled-antigen and the
minimum uncertainty occurs around the centerline of T-sensor
D Comparison of analyte concentration quantification methodologies
The results presented in Sections IV AndashIV C show that stochastic uncertainty propagation
provides us with valuable information regarding the spatial variation of uncertainty in concen-
tration field in a T-sensor This information can be employed for devising strategies for quanti-
fication of sample antigen concentration from measured signal while minimizing uncertainty In
FIG 4 Effect of sample antigen concentration on uncertainty in T-sensor based diffusion immunoassay Shown here are
the contributions of various model parameters to the overall uncertainty for two cases (a) when sample antigen is absent
and (b) when inlet sample antigen concentration is 573 nM (a) In the absence of sample antigen the uncertainty variation
is qualitatively similar to the case shown in Fig 3(c) when antigen concentration is low (b) At high concentration of sam-
ple antigen the overall uncertainty decreases in most of the inter-diffusion region Less binding sites are available for the
labeled-antigen on the antibody causing the labeled-antigen to diffuse without appreciable binding Thus the spatial varia-
tion of uncertainty shown in (b) is qualitatively similar to the case shown in Fig 2(d) where labeled-antigen diffuses in ab-
sence of antibody and sample antigen
014105-12 A K Jha and S S Bahga Biomicrofluidics 10 014105 (2016)
This article is copyrighted as indicated in the article Reuse of AIP content is subject to the terms at httpscitationaiporgtermsconditions Downloaded to IP
103279253 On Wed 13 Jan 2016 165946
a typical T-sensor based competitive diffusion immunoassay the fluorescence signals from the
labeled molecules at known sample antigen concentrations are used to generate a calibration
curve The fluorescence signal from immunoassay of unknown sample antigen concentration is
then compared with the calibration curve to predict the antigen concentration In order to accu-
rately determine the unknown analyte concentration in the immunoassay it is essential that the
fluorescence signals used for calibration and comparison have low uncertainty
Hatch et al7 presented a calibration technique for T-sensor based diffusion immunoassay
which employs the first derivative of normalized fluorescence intensity along the lateral
direction The difference between maxima and minima in the first derivative of normalized fluo-
rescence intensity is plotted against the known sample antigen concentrations to obtain the
calibration curve We note that here the normalized fluorescence intensity curve is the same as
the normalized concentration curve of labeled molecules since fluorescence intensity of labeled
molecules is assumed to be directly proportional to their concentration Fig 5 shows the first
derivative of normalized fluorescence intensity for various sample antigen concentrations com-
puted from the simulation data presented in Fig 3(d) Also shown in Fig 5 is the predicted
uncertainty in the first derivative of normalized fluorescence intensity using 63r uncertainty
bars We calculated the uncertainty in the derivative of normalized fluorescence intensity by
differentiating the PC expansion for concentration field (Equation (10)) as
ci x y n1 n2hellip ndeth THORNy
frac14XP
kfrac140
cik x yeth THORNy
Wk n1 n2hellip ndeth THORN (17)
The uncertainty bars shown in Fig 5 clearly indicate that significant uncertainty is
introduced in the first derivative of normalized fluorescence intensity due to uncertainty in
model parameters For example in absence of sample antigen Fig 5 shows that the point of
local minima in the derivative of normalized fluorescence signal has almost four-fold higher
uncertainty than that in the model parameters whereas the normalized fluorescence intensity
at the center has relatively low uncertainty as shown in Fig 3(d) This suggests that using the
centerline fluorescence intensity as opposed to the difference in local extrema values of first
derivative in normalized fluorescence intensity for calibration would result in lower overall
uncertainty
To quantify the uncertainty in the calibration technique proposed by Hatch et al7 we
calculate the standard deviations in the difference in local extrema values of first derivative of
FIG 5 Lateral variation of mean and uncertainty (63r) of first derivative of normalized fluorescence intensity at T-sensor
exit (xfrac14 64 mm) for four values of inlet sample antigen concentration Uncertainty in model parameters leads to signifi-
cantly higher uncertainty in the first derivative of fluorescence signal In particular the uncertainty is highest at locations of
extrema in the first derivative of normalized fluorescence intensity profile
014105-13 A K Jha and S S Bahga Biomicrofluidics 10 014105 (2016)
This article is copyrighted as indicated in the article Reuse of AIP content is subject to the terms at httpscitationaiporgtermsconditions Downloaded to IP
103279253 On Wed 13 Jan 2016 165946
normalized fluorescence intensity for various sample antigen concentrations We denote the
points of local minima (depletion) and maxima (accumulation) with D and A respectively and
the standard deviation in the difference in local extrema values with rDA To compute rDA we
replace the PC coefficients cik in Equation (16) with the coefficients for PC expansion of the
difference in first derivative of normalized fluorescence intensity at points D and A
Fig 6(a) shows the variation in difference in local extrema values of first derivative along
with 63r uncertainty bars for four values of sample antigen concentrations The coefficient of
variation for these four cases ranges from 47 for cSA frac14 0 nM to 175 for cSA frac14 573 nM
Clearly such high degree of uncertainty in the system response will induce equally high inac-
curacy in the prediction of sample antigen concentration We note that the uncertainty bars for
the cases with cSAfrac14 0 nM and 328 nM significantly overlap indicating that the minimum value
of sample antigen concentration that can be unambiguously and accurately quantified (the limit
of detection) is appreciably higher than 328 nM Moreover relatively high uncertainty for all
sample antigen concentrations leads to reduced detection resolution Therefore using the differ-
ence in extrema values of first derivative of normalized fluorescence intensity as a response of
the system to generate the calibration curve is not preferable
On the other hand as shown in Figs 3(d) 4(a) and 4(b) the uncertainty in concentration
of labeled molecules near the center of T-sensor is minimum In Fig 6(b) we compare these
central concentration values along with their associated uncertainty eth63rTHORN for four values of
sample antigen concentrations The minimum and maximum coefficient of variations are 01
and 04 for cases with cSAfrac14 573 nM and 328 nM respectively As opposed to the case shown
in Fig 6(a) here the uncertainty bars for cSAfrac14 0 nM and 328 nM do not overlap Hence for a
T-sensor based competitive diffusion immunoassay using the centerline concentration for gener-
ating the response signal improves the detection sensitivity Moreover lower uncertainty for all
sample antigen concentrations compared with the calibration scheme involving the first deriva-
tive of signal results in better detection resolution
V CONCLUSIONS
We have quantified uncertainty in modeling predictions of a T-sensor based competitive
diffusion immunoassay due to the uncertainty in parameters of the mathematical model In par-
ticular we considered individual and coupled effects of uncertainty in species diffusivities
binding reaction rates and inlet flow speed on spatial distribution of uncertainty in predicted
concentrations To quantify uncertainty we modeled the dependence of solution variables (spe-
cies concentrations) on stochastic dimensions associated with uncertain model parameters using
FIG 6 Comparison of uncertainties induced in system response between two methods for quantifying sample antigen con-
centration in T-sensor based diffusion immunoassay (a) using the difference between values of extrema in first derivative
of normalized fluorescence intensity and (b) using centerline fluorescence intensity (or concentration of labeled molecules)
(a) Since the uncertainty is high at the locations of extrema in first derivative of intensity the uncertainty bars eth63rTHORN are
large The overlapping uncertainty bars indicate low detection sensitivity and resolution (b) Using centerline fluorescence
intensity (or concentration) as the response signal leads to reduced uncertainty which improves detection sensitivity and
resolution
014105-14 A K Jha and S S Bahga Biomicrofluidics 10 014105 (2016)
This article is copyrighted as indicated in the article Reuse of AIP content is subject to the terms at httpscitationaiporgtermsconditions Downloaded to IP
103279253 On Wed 13 Jan 2016 165946
PC expansions We then evaluated the coefficients of the PC expansions using Smolyak sparse
grid quadrature which essentially involved a series of deterministic simulations for different
realizations of uncertain model parameters
Our simulations of T-sensor based competitive immunoassay show that the uncertainty in
diffusivity of fluorescently labeled analyte has the maximum contribution to the overall uncer-
tainty in predicted fluorescence signal In practice the uncertainty in species diffusivities can
arise from even small temperature fluctuations Therefore our analysis suggests that precise
temperature control during T-sensor operation can lead to significant reduction in uncertainty
Our simulations also show that for all sample antigen concentrations the uncertainty in fluores-
cence signal is minimum near the centerline of T-sensor whereas high uncertainty prevails in
the regions with large gradients in fluorescence intensity Therefore using the extreme values
of first derivative of fluorescence intensity profile for quantification of antigen concentration
leads to higher uncertainty thereby reducing the detection sensitivity and resolution On the
other hand using centerline fluorescence intensity as the system response yields reduced uncer-
tainty and hence higher detection sensitivity and resolution Our simulations results are there-
fore directly applicable for practical T-sensor based assays wherein quantitative analysis is
performed by comparing experimental data with simulation results
Although the current work is specific to T-sensor based diffusion immunoassay the non-
intrusive stochastic uncertainty quantification methodology presented here is equally applicable
for analyzing other microfluidic systems Since the method involves a series of deterministic
simulations uncertainty propagation in microfluidic systems can be performed by post-
processing simulation data obtained from existing simulation tools Such analysis would ensure
proper comparison of experimental and simulation data Moreover PC expansion based uncer-
tainty quantification can elucidate the individual and coupled effects of uncertainty in model
parameters to the predicted overall uncertainty
1G M Whitesides Nature 442 368 (2006)2P S Dittrich and A Manz Nat Rev Drug Discovery 5 210 (2006)3T M Squires and S R Quake Rev Mod Phys 77 977 (2005)4A E Kamholz B H Weigl B A Finlayson and P Yager Anal Chem 71 5340 (1999)5B H Weigl and P Yager Science 283 346 (1999)6A E Kamholz E A Schilling and P Yager Biophys J 80 1967 (2001)7A Hatch A E Kamholz K R Hawkins M S Munson E A Schilling B H Weigl and P Yager Nat Biotechnol 19461 (2001)
8J L Osborn B Lutz E Fu P Kauffman D Y Stevens and P Yager Lab Chip 10 2659 (2010)9R B Darling P Yager B Weigl J Kriebel and K Mayes in Micro Total Analysis Systemsrsquo98 (Springer BanffCanada 1998) pp 105ndash108
10M D Tarn M J Lopez-Martinez and N Pamme Anal Bioanal Chem 406 139 (2014)11T Robinson P Valluri G Kennedy A Sardini C Dunsby M A Neil G S Baldwin P M French and A J de
Mello Anal Chem 86 10732 (2014)12L Gervais N De Rooij and E Delamarche Adv Mater 23 H151 (2011)13A E Kamholz and P Yager Biophys J 80 155 (2001)14L Maıtre and O M Knio Spectral Methods for Uncertainty Quantification (Springer 2010)15N Wiener Amer J Math 60 897 (1938)16D Xiu and G E Karniadakis SIAM J Sci Comput 24 619 (2002)17M T Reagan H N Najm R G Ghanem and O M Knio Combust Flame 132 545 (2003)18D Xiu and G E Karniadakis J Comput Phys 187 137 (2003)19B J Debusschere H N Najm A Matta O M Knio R G Ghanem and O P Le Maıtre Phys Fluids 15 2238 (2003)20R G Ghanem and P D Spanos J Eng Mech Div Am Soc Civ Eng 117 2351 (1991)21G Lin C Su and G Karniadakis Proc Natl Acad Sci U S A 101 15840 (2004)22M Dodson and G T Parks J Aircr 46 635 (2009)23J P Gleeson J Colloid Interface Sci 249 217 (2002)24H A Stone in CMOS Biotechnology edited by H Lee R Westervelt and D Ham (Springer USA 2007) pp 5ndash3025S A Smolyak Dokl Akad Nauk SSSR 4 240 (1963)26T Gerstner and M Griebel Numer Algorithms 18 209 (1998)27P Walden H Ulich and B G Z Phys Chem 123 429 (1926)28C-H Lin G-B Lee Y-H Lin and G-L Chang J Micromech Microeng 11 726 (2001)29B Xu K Ooti N Wong and W Choi Int Commun Heat Mass Transfer 27 1165 (2000)30J Koo and C Kleinstreuer J Micromech Microeng 13 568 (2003)
014105-15 A K Jha and S S Bahga Biomicrofluidics 10 014105 (2016)
This article is copyrighted as indicated in the article Reuse of AIP content is subject to the terms at httpscitationaiporgtermsconditions Downloaded to IP
103279253 On Wed 13 Jan 2016 165946
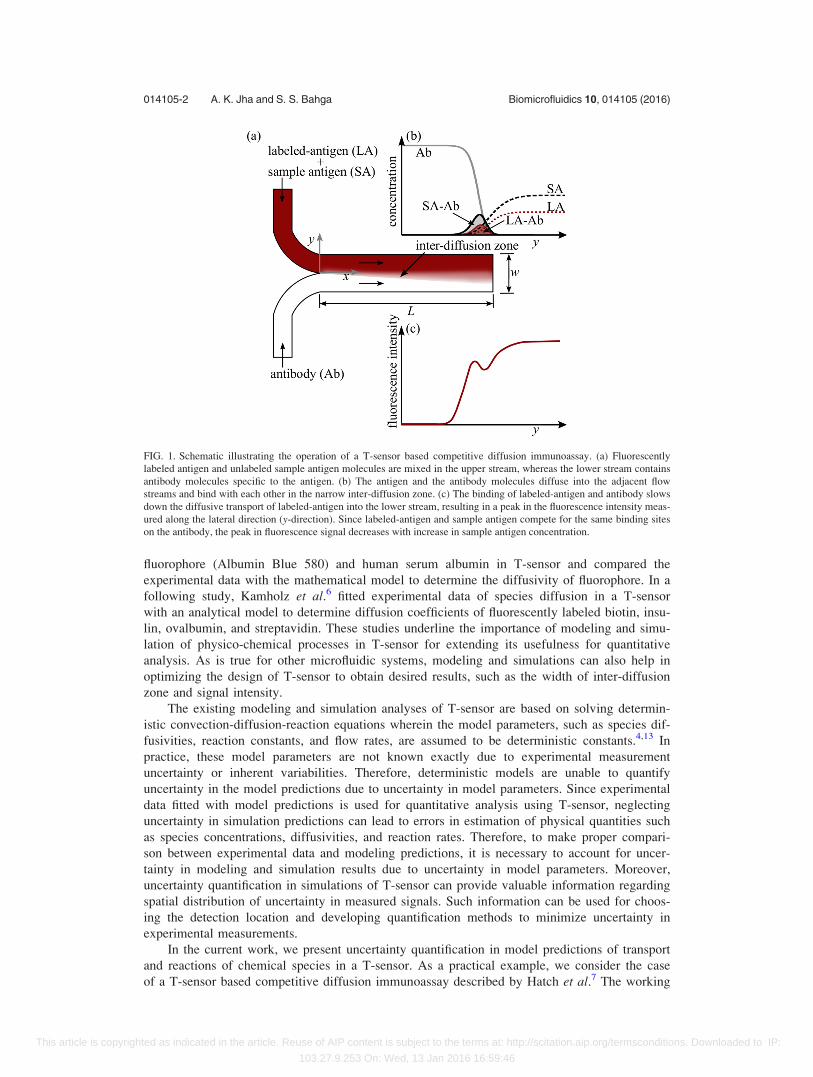
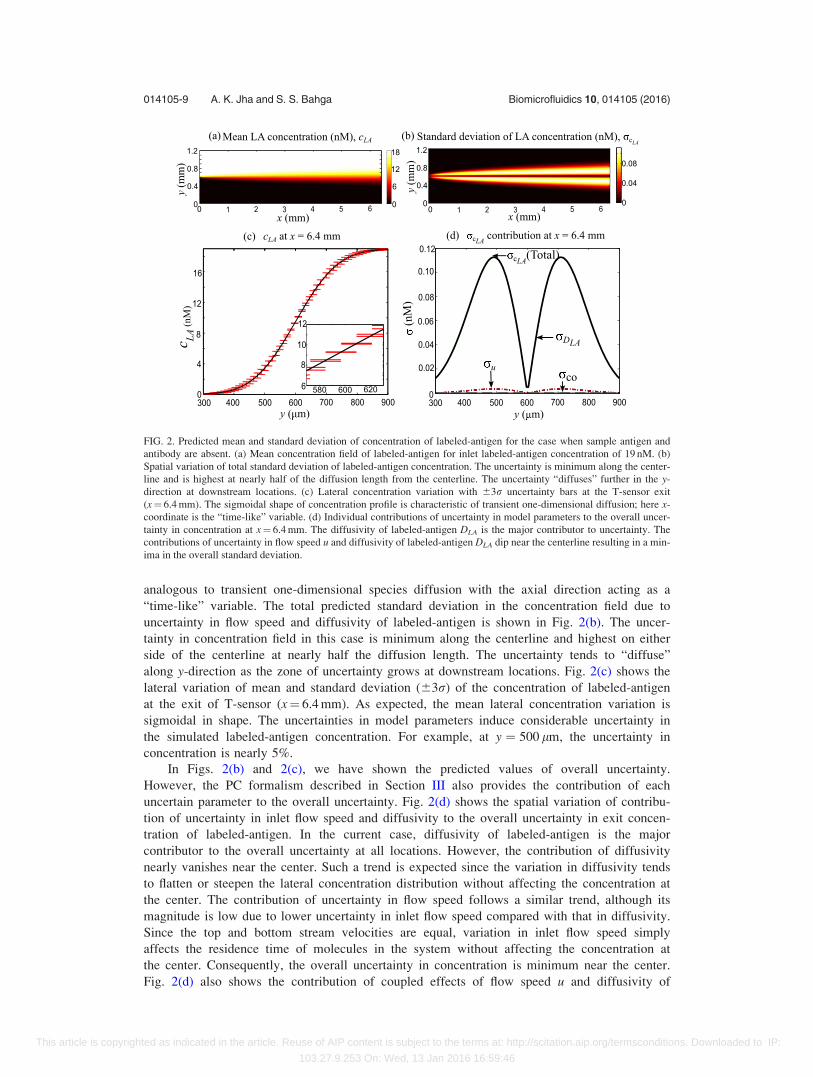
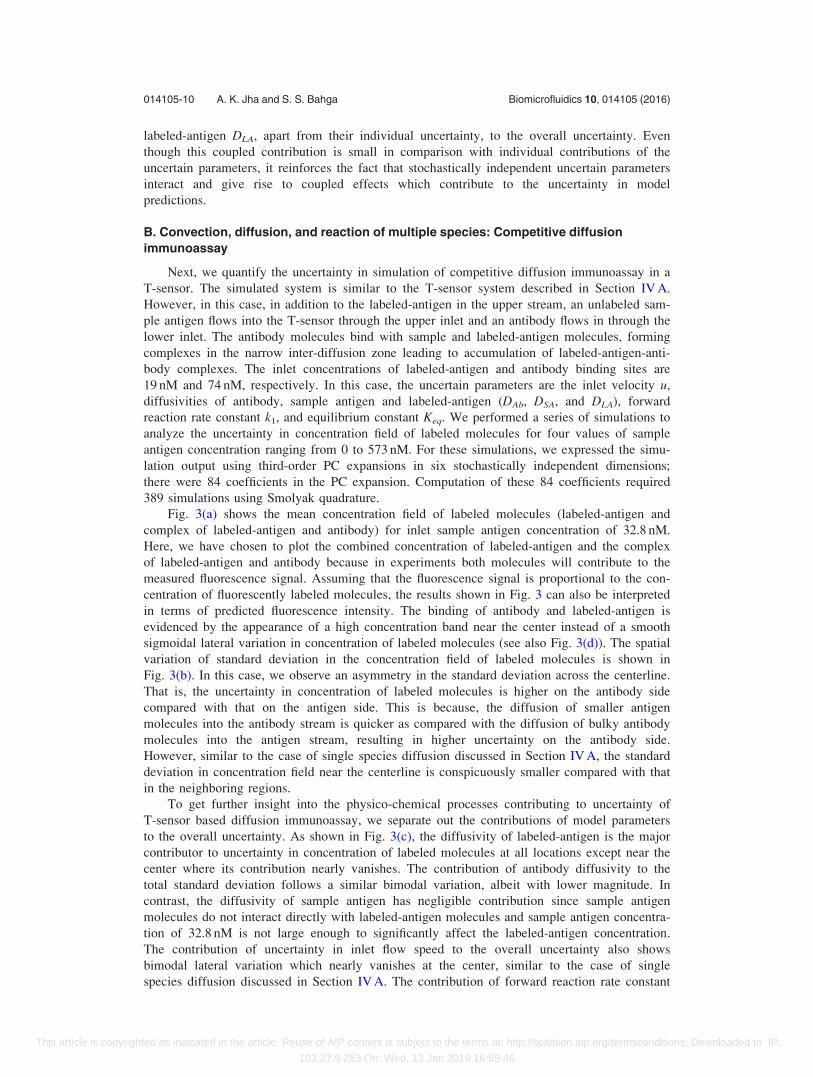
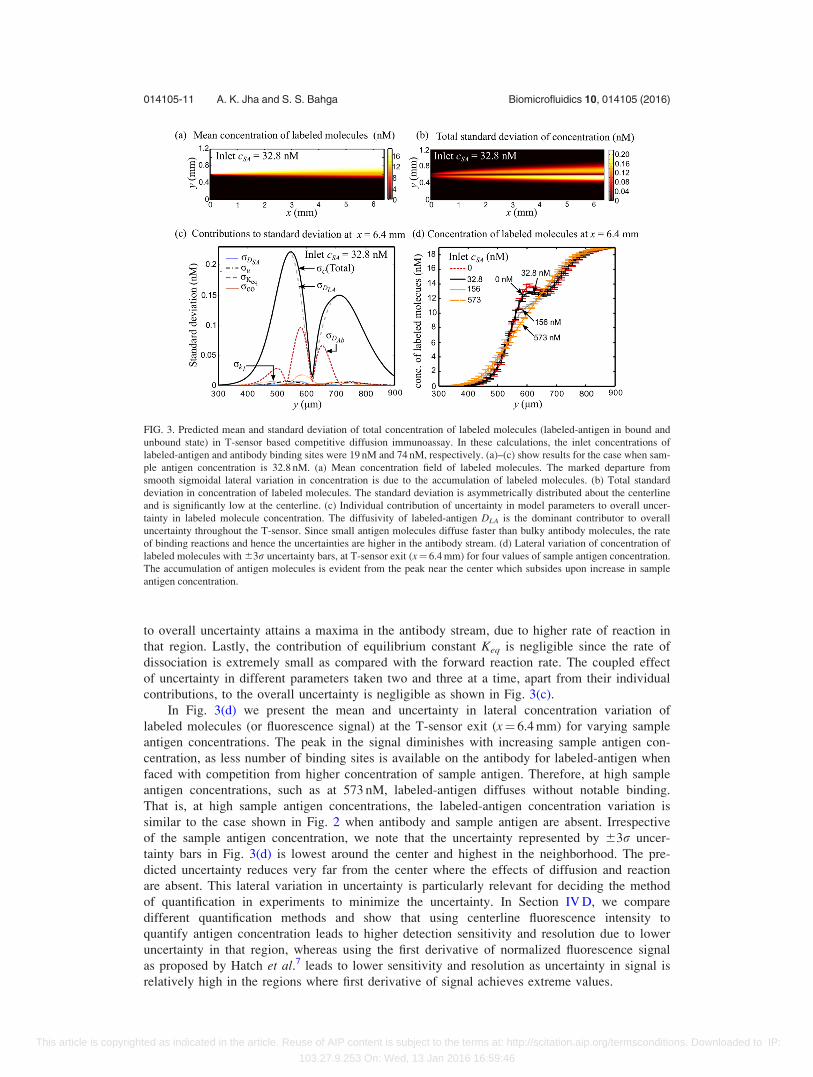
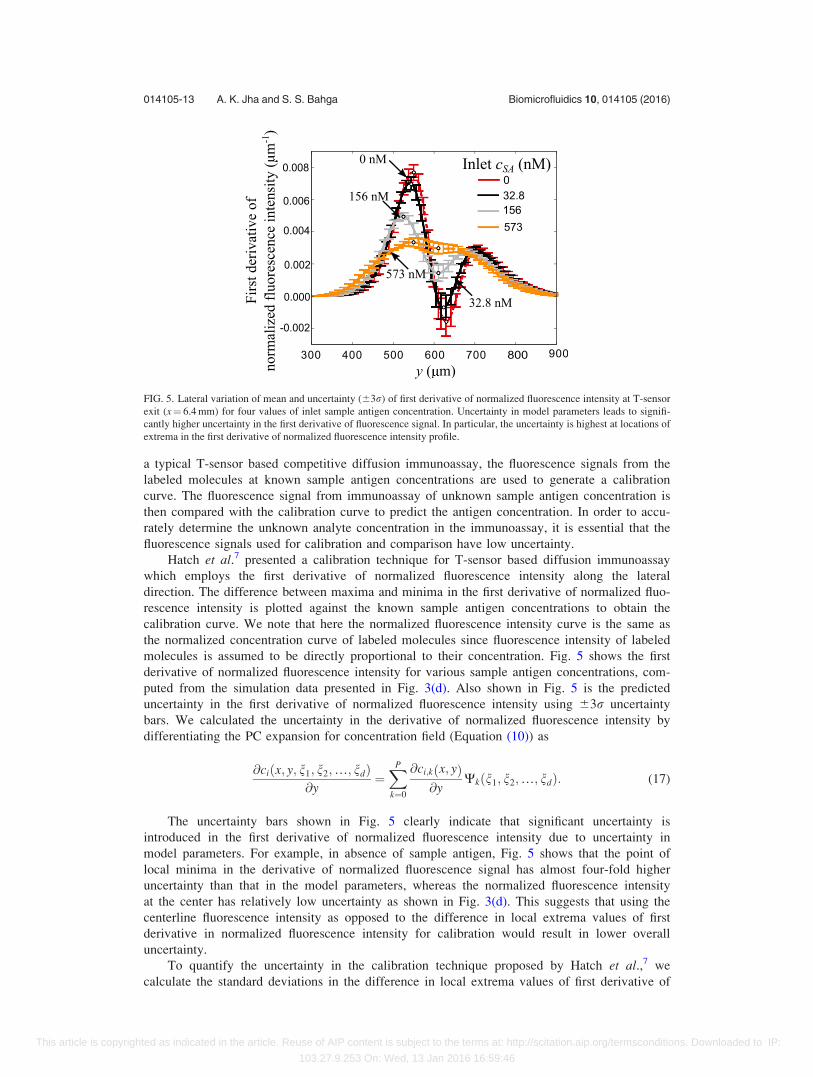
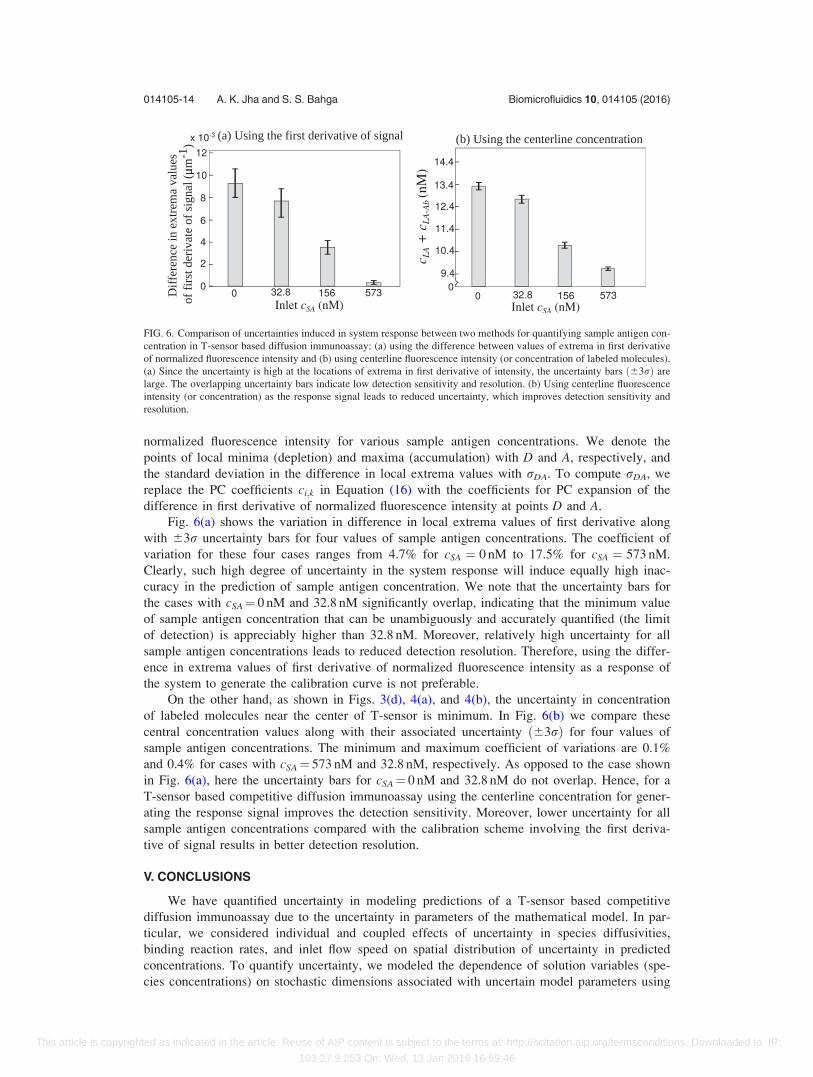
Recommended