Embed Size (px)
Citation preview
Uncertainty Quantification
and Validation AssessmentBen Thacker
Southwest Research Institute
San Antonio, TX
FAA Workshop on
Use of Dynamic Analysis Methods in Aircraft Certification
Blacksburg, VA
10 -11 August 2016
Outline
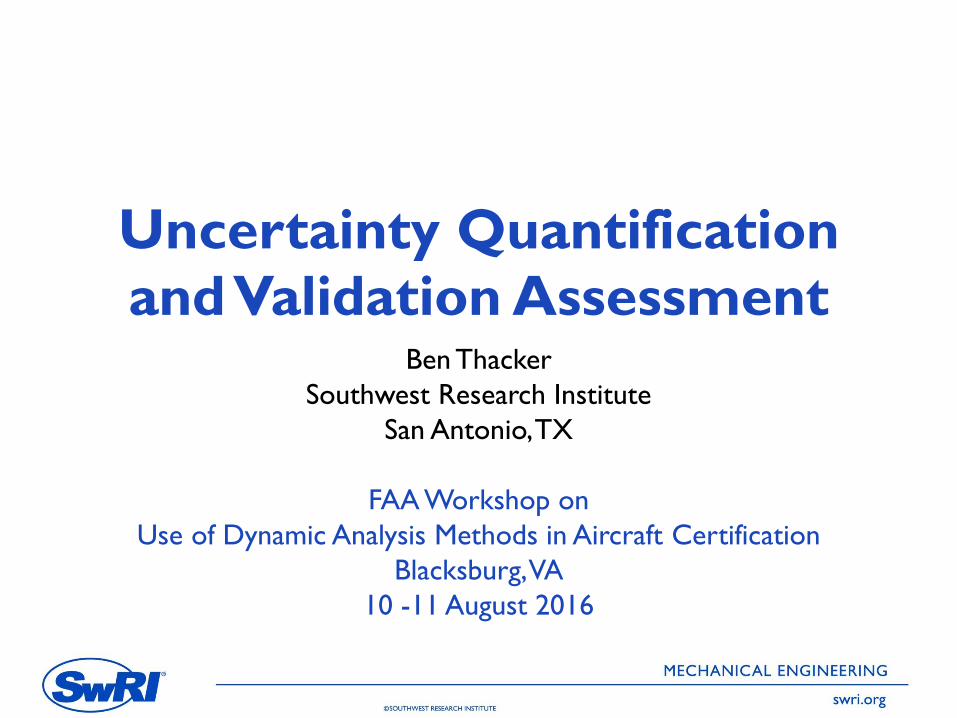
Background and motivation for V&V
ASME V&V Standards Committees
Verification and Validation Topics
– V&V Plan
– V&V Process
– Validation Hierarchy
– Validation Experiments
– Uncertainty Quantification
– Validation Metrics
– Predictive Accuracy
– Documentation and Tracking
Summary
2
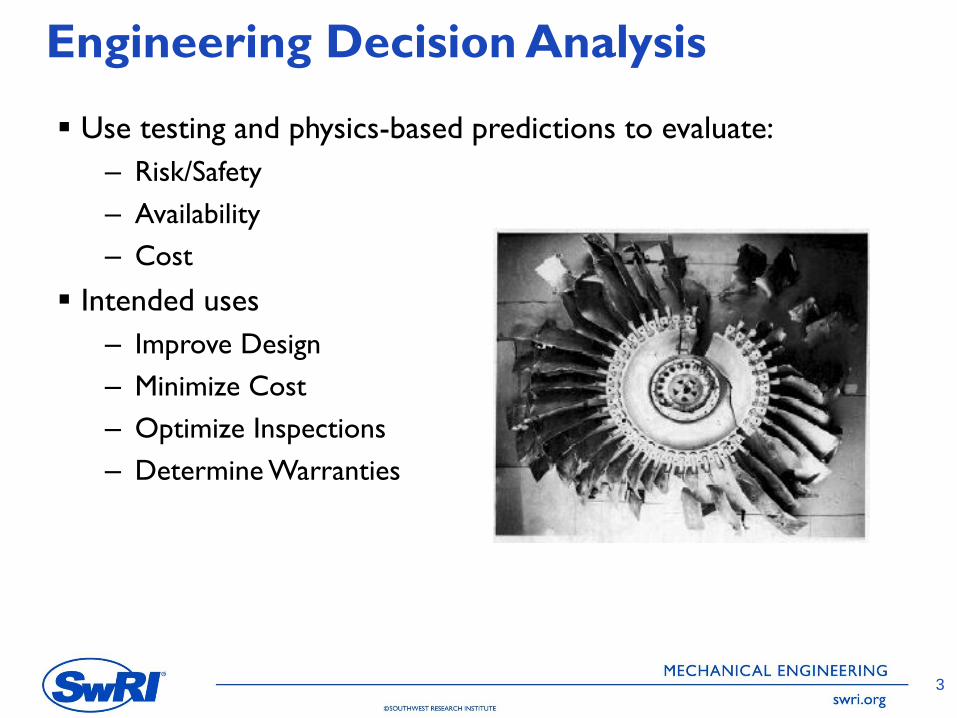
Engineering Decision Analysis
Use testing and physics-based predictions to evaluate:
– Risk/Safety
– Availability
– Cost
Intended uses
– Improve Design
– Minimize Cost
– Optimize Inspections
– Determine Warranties
3
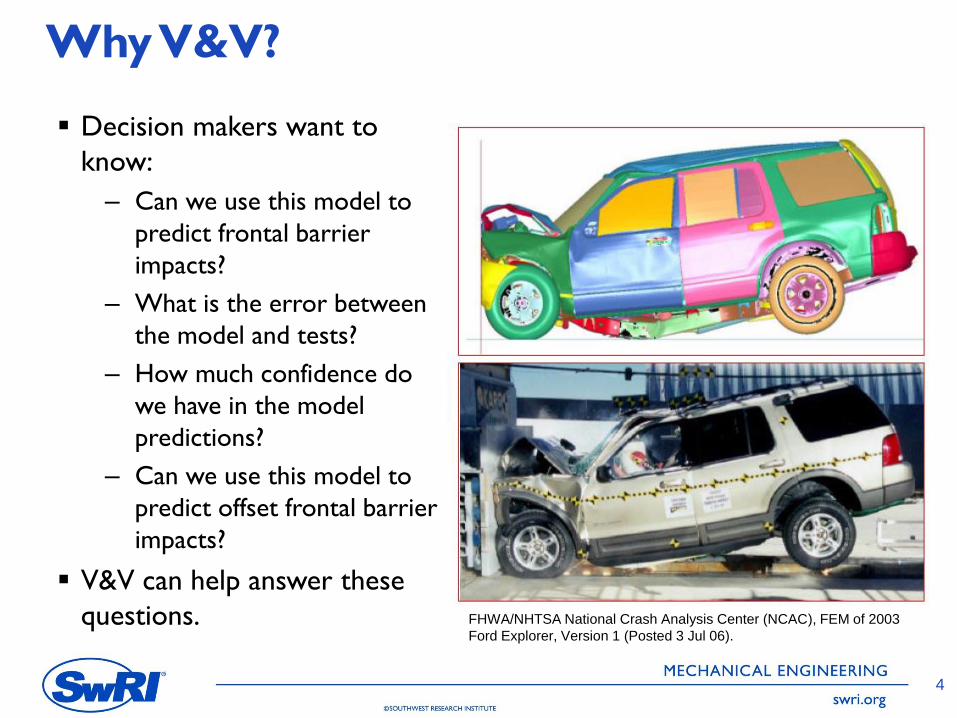
Why V&V?
Decision makers want to
know:
– Can we use this model to
predict frontal barrier
impacts?
– What is the error between
the model and tests?
– How much confidence do
we have in the model
predictions?
– Can we use this model to
predict offset frontal barrier
impacts?
V&V can help answer these
questions.
4
FHWA/NHTSA National Crash Analysis Center (NCAC), FEM of 2003
Ford Explorer, Version 1 (Posted 3 Jul 06).
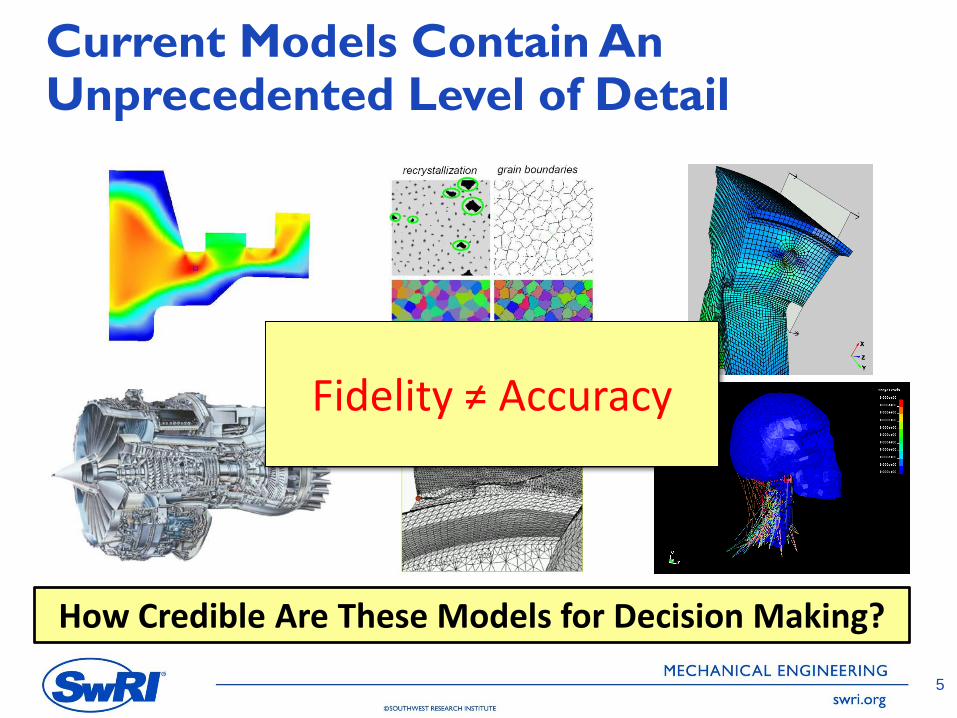
Current Models Contain An Unprecedented Level of Detail
Fidelity ≠ Accuracy
How Credible Are These Models for Decision Making?
55
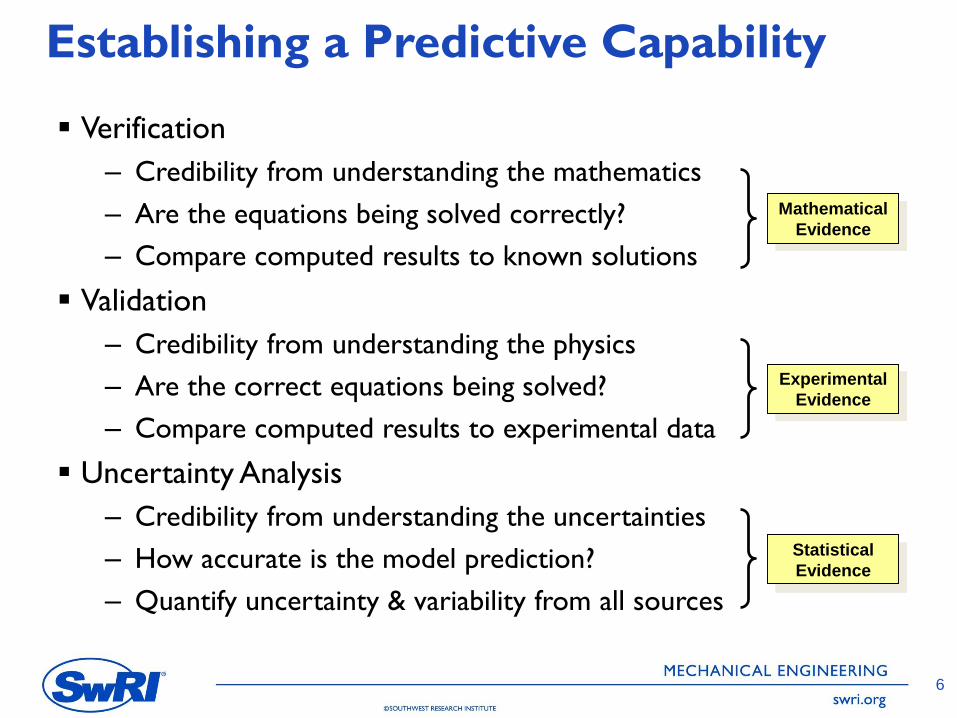
Establishing a Predictive Capability
Verification
– Credibility from understanding the mathematics
– Are the equations being solved correctly?
– Compare computed results to known solutions
Validation
– Credibility from understanding the physics
– Are the correct equations being solved?
– Compare computed results to experimental data
Uncertainty Analysis
– Credibility from understanding the uncertainties
– How accurate is the model prediction?
– Quantify uncertainty & variability from all sources
6
Mathematical
Evidence
Experimental
Evidence
Statistical
Evidence
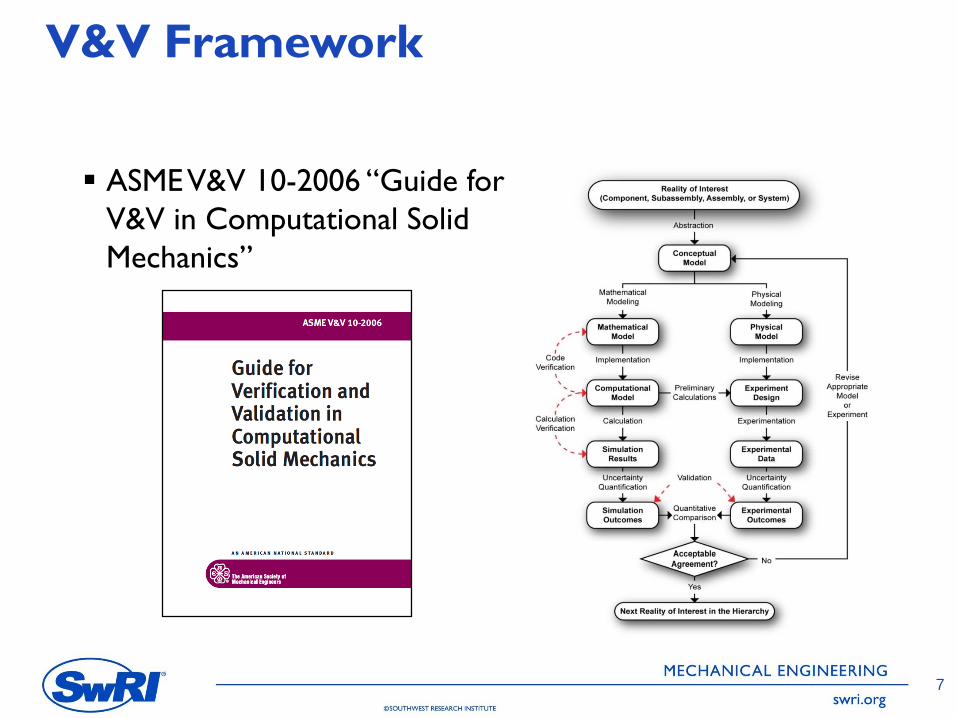
V&V Framework
ASME V&V 10-2006 “Guide for
V&V in Computational Solid
Mechanics”
7
Model Verification & Validation
Verification: Process of determining that a model
implementation accurately represents the developer’s
conceptual description of the model and the solution to the
model
•Math issue: “Solving the equations right”
Validation: Process of determining the degree to which a model
is an accurate representation of the real world from the
perspective of the intended uses of the model
•Physics issue: “Solving the right equations”
8
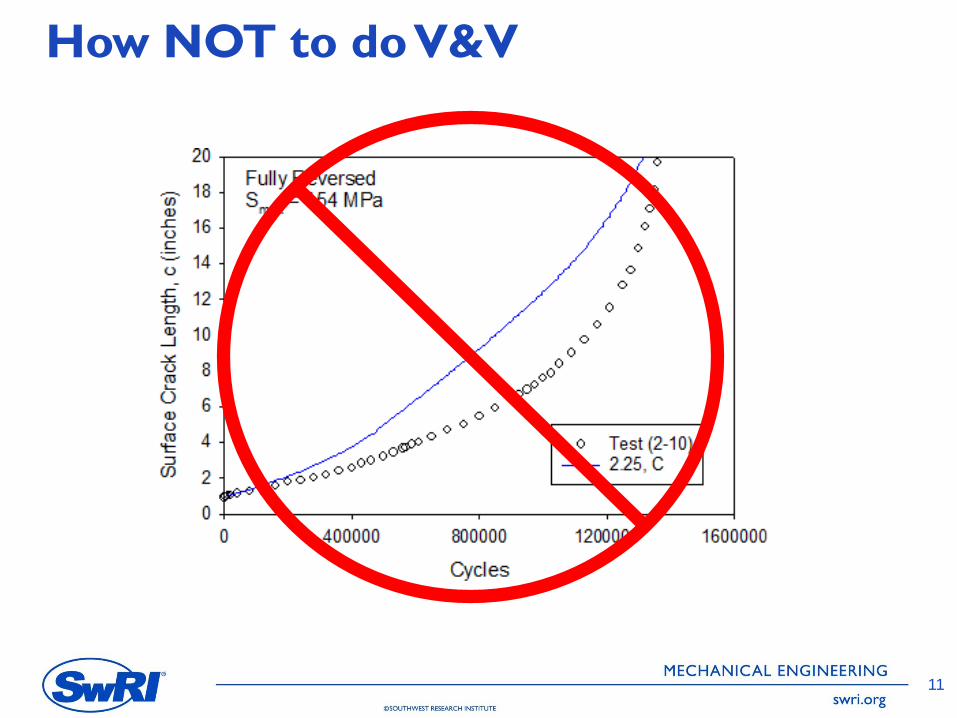
How NOT to do V&V
11
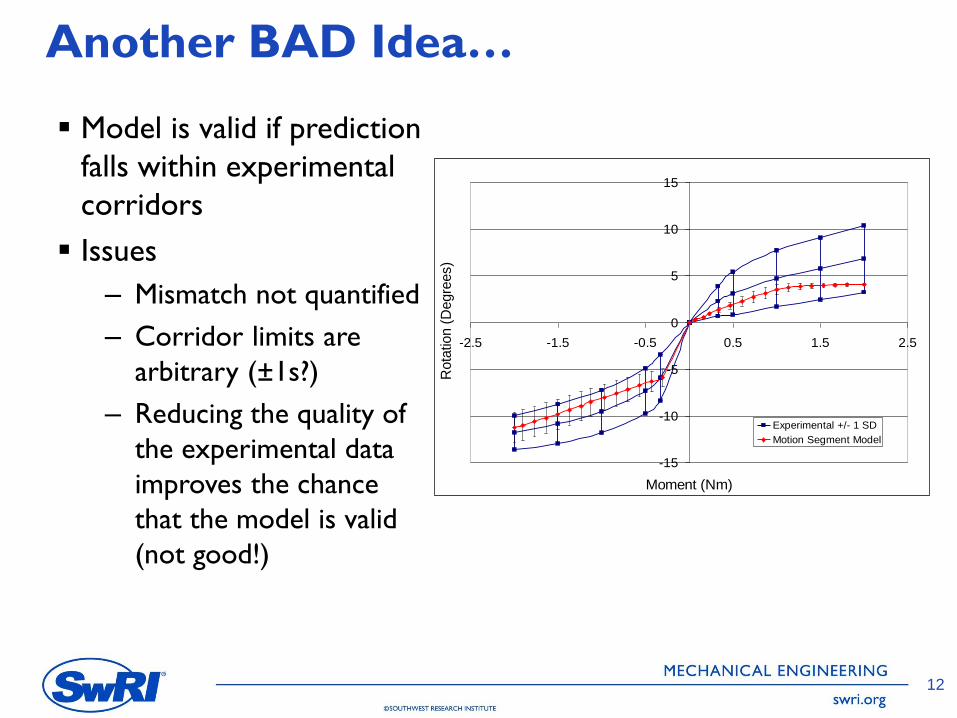
Another BAD Idea…
Model is valid if prediction
falls within experimental
corridors
Issues
– Mismatch not quantified
– Corridor limits are
arbitrary (±1s?)
– Reducing the quality of
the experimental data
improves the chance
that the model is valid
(not good!)
12
-15
-10
-5
0
5
10
15
-2.5 -1.5 -0.5 0.5 1.5 2.5
Moment (Nm)
Rota
tion (
Degre
es)
Experimental +/- 1 SD
Motion Segment Model
Is a Model the Same as a Code?
Code ≠ Model
A code is the computer implementation of algorithms
developed to facilitate the solution of a class of problems (e.g.,
LS-DYNA)
A model includes the conceptual, mathematical, and numerical
representation of physical phenomena needed to represent a
given scenario (e.g., stress analysis of a turbine blade using LS-
DYNA)
Codes are involved, but our focus is on models
13
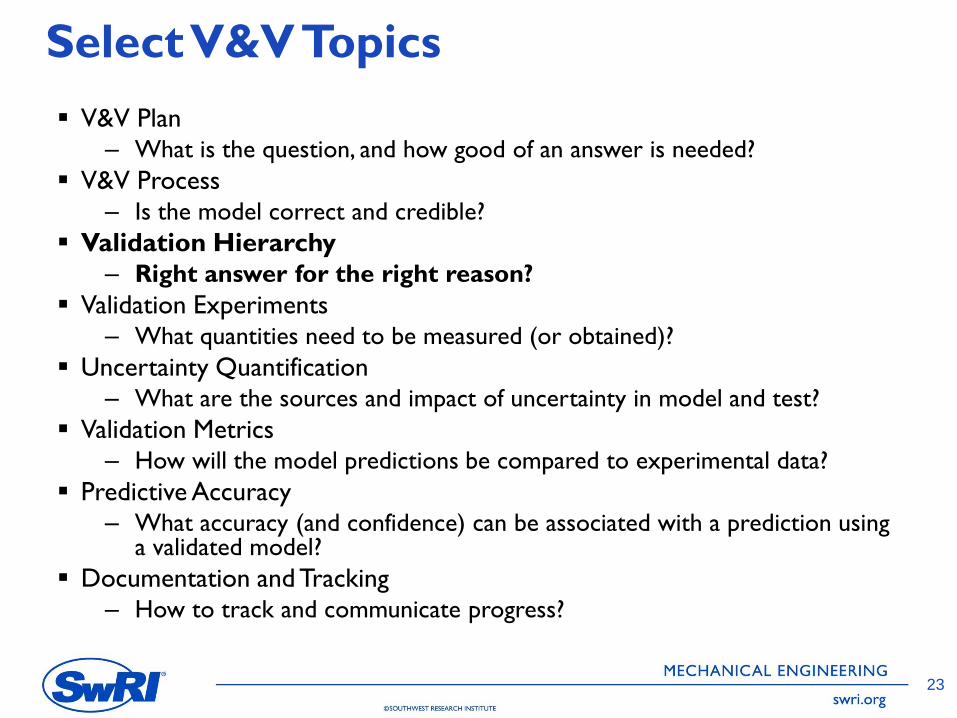
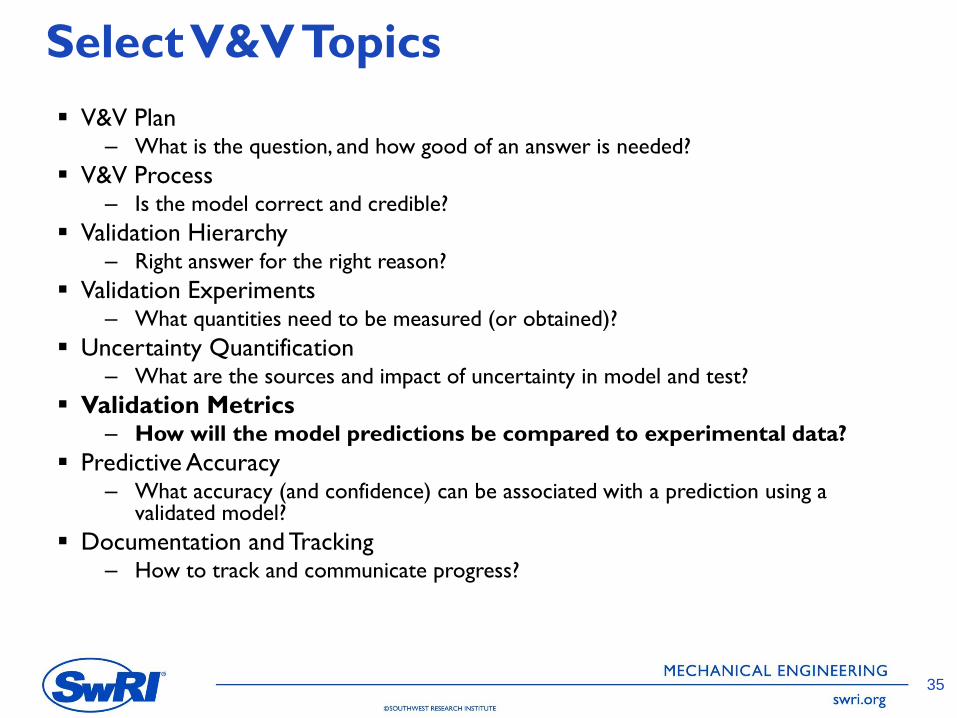
Select V&V Topics
14
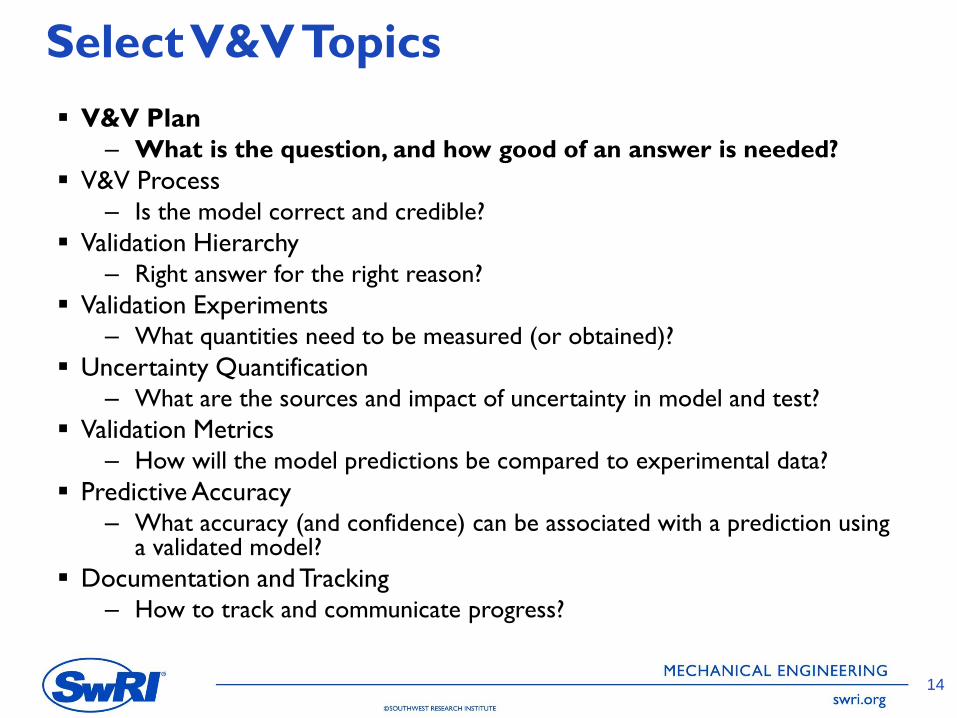
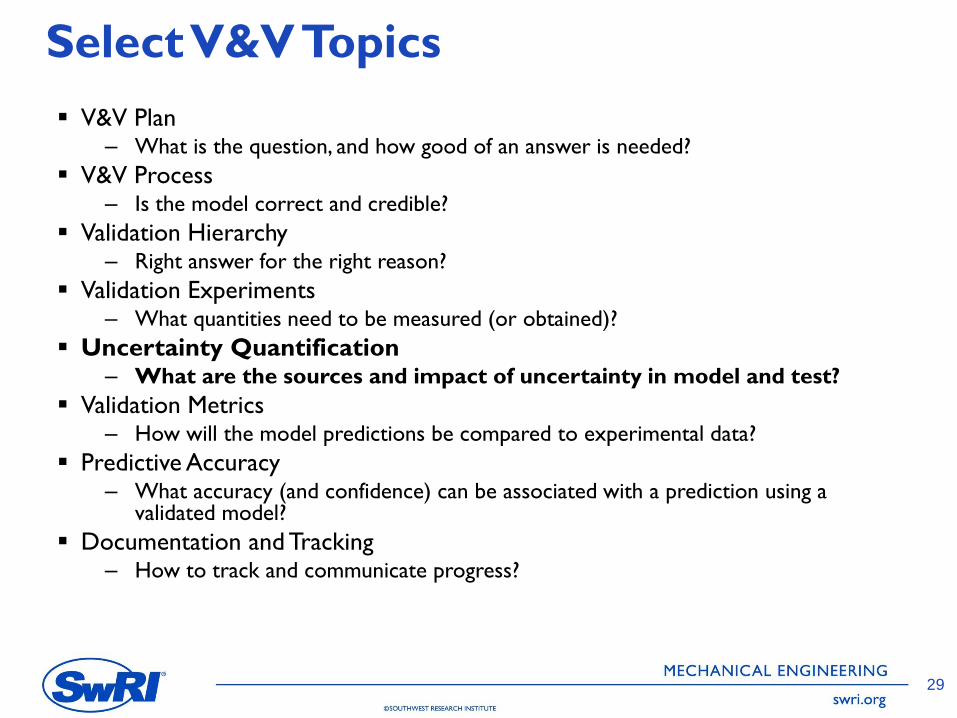
V&V Plan– What is the question, and how good of an answer is needed?
V&V Process– Is the model correct and credible?
Validation Hierarchy– Right answer for the right reason?
Validation Experiments– What quantities need to be measured (or obtained)?
Uncertainty Quantification– What are the sources and impact of uncertainty in model and test?
Validation Metrics– How will the model predictions be compared to experimental data?
Predictive Accuracy– What accuracy (and confidence) can be associated with a prediction using
a validated model?
Documentation and Tracking– How to track and communicate progress?
V&V Plan
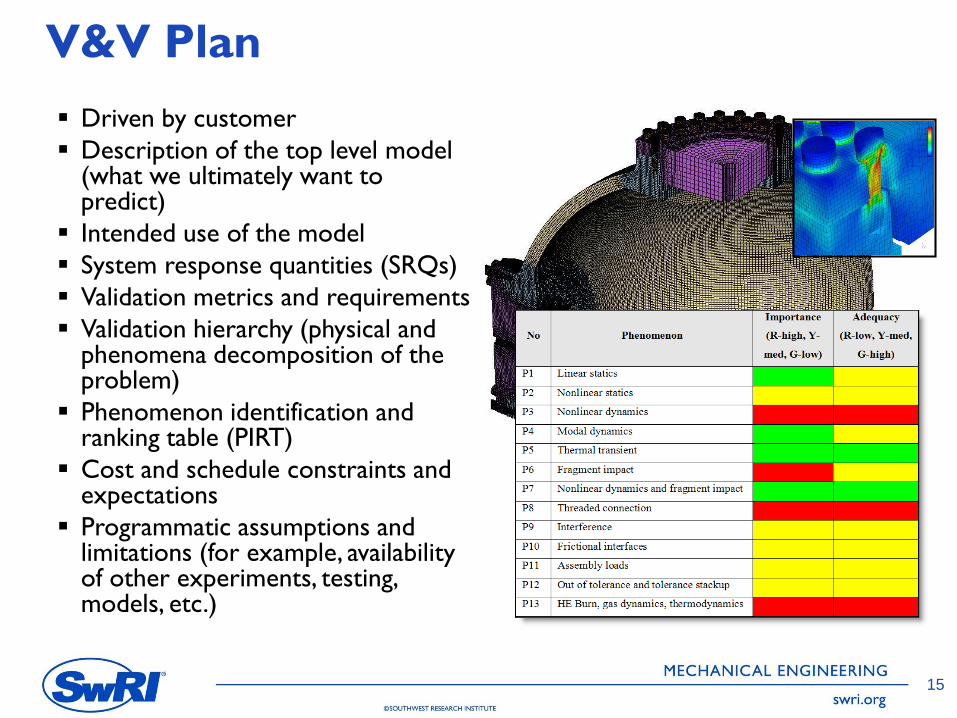
Driven by customer
Description of the top level model (what we ultimately want to predict)
Intended use of the model
System response quantities (SRQs)
Validation metrics and requirements
Validation hierarchy (physical and phenomena decomposition of the problem)
Phenomenon identification and ranking table (PIRT)
Cost and schedule constraints and expectations
Programmatic assumptions and limitations (for example, availability of other experiments, testing, models, etc.)
15
Select V&V Topics
16
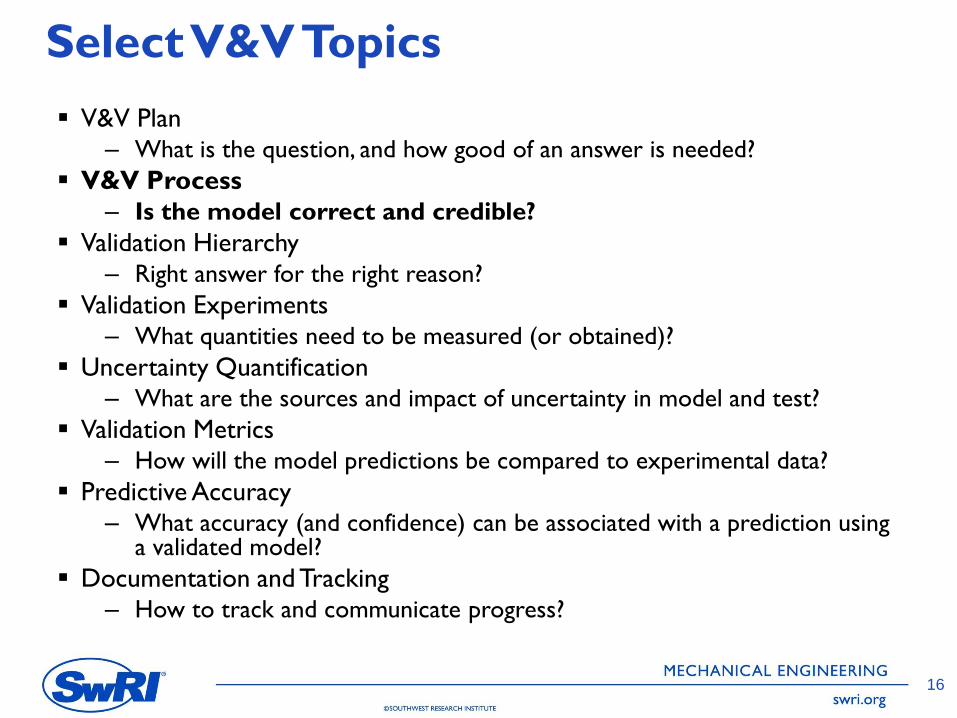
V&V Plan– What is the question, and how good of an answer is needed?
V&V Process– Is the model correct and credible?
Validation Hierarchy– Right answer for the right reason?
Validation Experiments– What quantities need to be measured (or obtained)?
Uncertainty Quantification– What are the sources and impact of uncertainty in model and test?
Validation Metrics– How will the model predictions be compared to experimental data?
Predictive Accuracy– What accuracy (and confidence) can be associated with a prediction using
a validated model?
Documentation and Tracking– How to track and communicate progress?
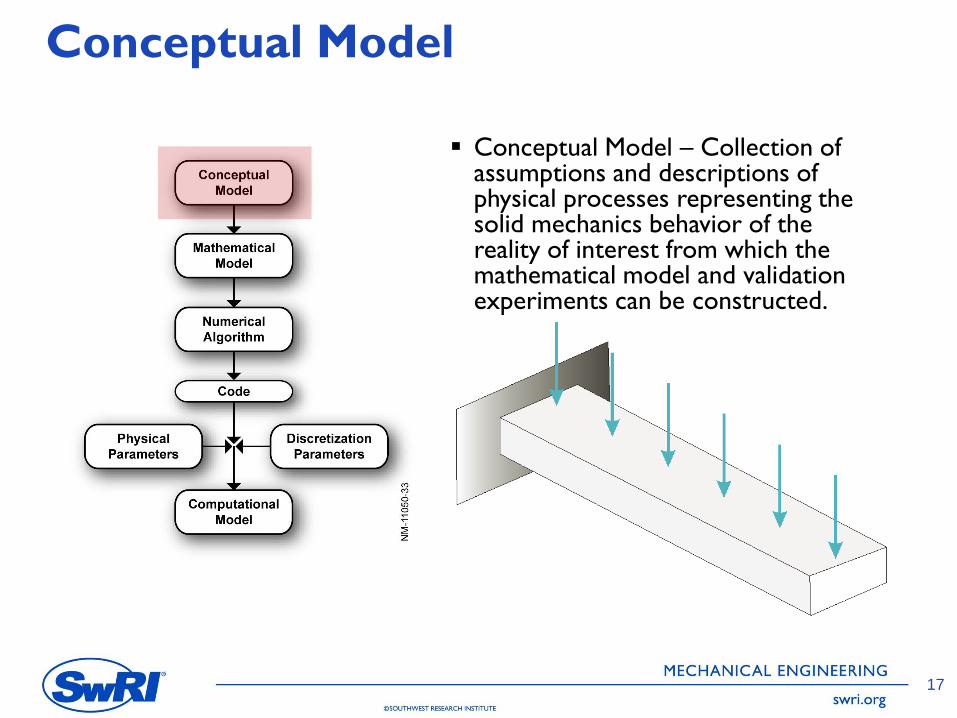
Conceptual Model
17
Conceptual Model – Collection of assumptions and descriptions of physical processes representing the solid mechanics behavior of the reality of interest from which the mathematical model and validation experiments can be constructed.
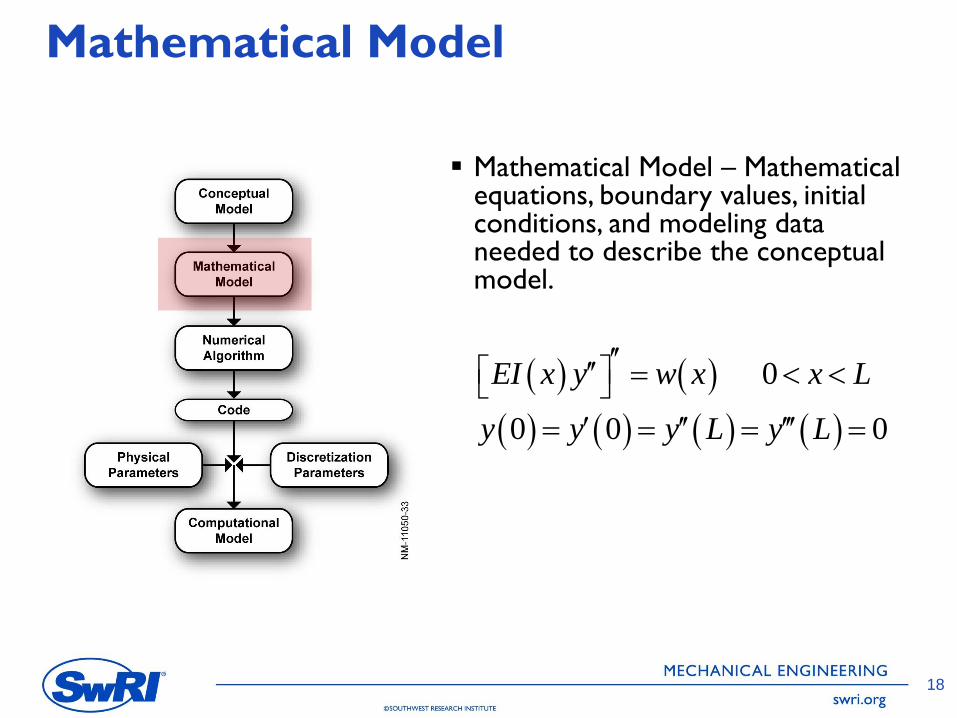
Mathematical Model
18
Mathematical Model – Mathematical equations, boundary values, initial conditions, and modeling data needed to describe the conceptual model.
0
0 0 0
EI x y w x x L
y y y L y L
Mathematical Model
19
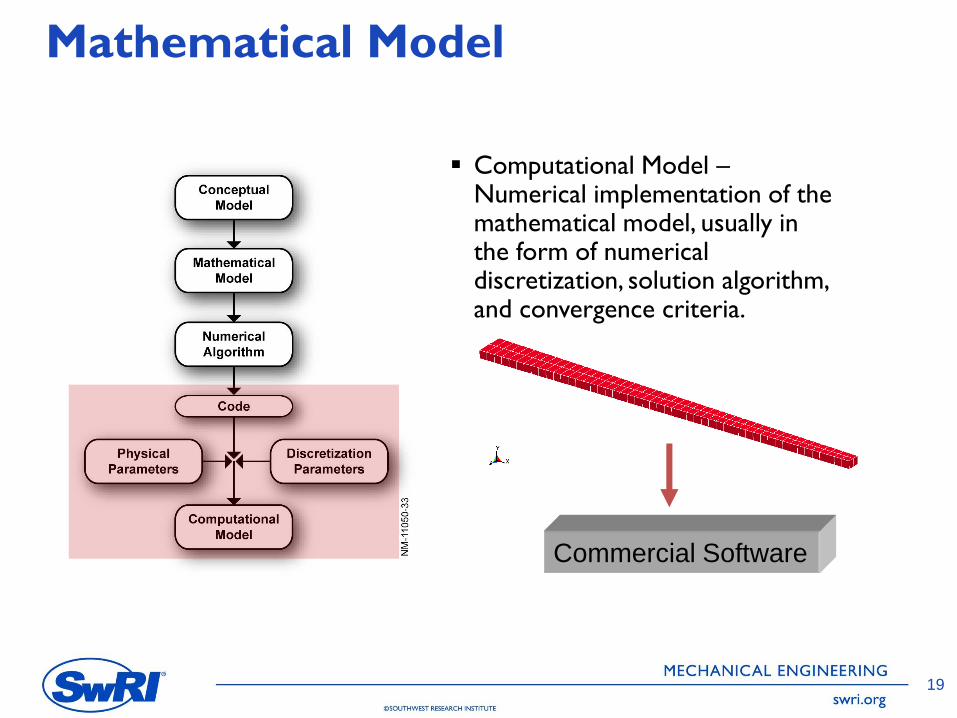
Computational Model –Numerical implementation of the mathematical model, usually in the form of numerical discretization, solution algorithm, and convergence criteria.
Commercial Software
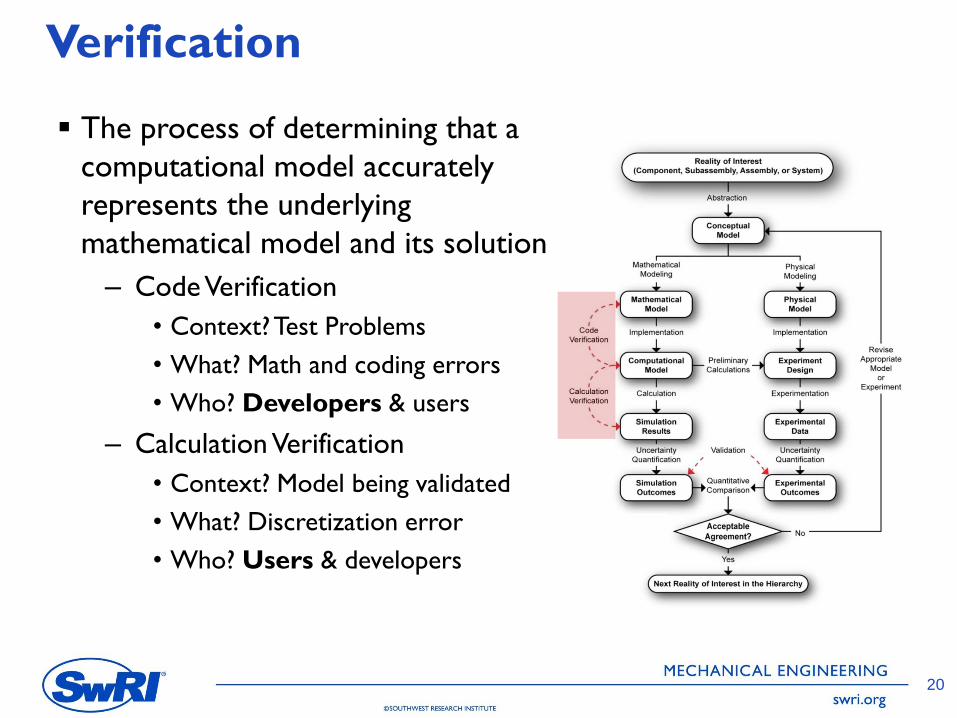
Verification
The process of determining that a
computational model accurately
represents the underlying
mathematical model and its solution
– Code Verification
• Context? Test Problems
• What? Math and coding errors
• Who? Developers & users
– Calculation Verification
• Context? Model being validated
• What? Discretization error
• Who? Users & developers
20
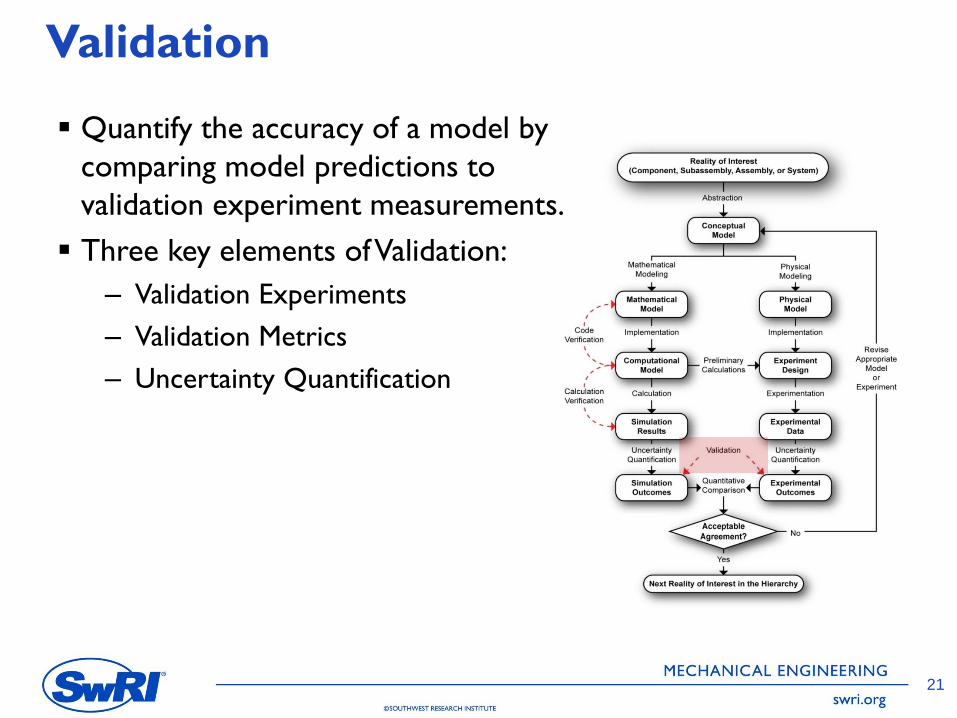
Validation
Quantify the accuracy of a model by
comparing model predictions to
validation experiment measurements.
Three key elements of Validation:
– Validation Experiments
– Validation Metrics
– Uncertainty Quantification
21
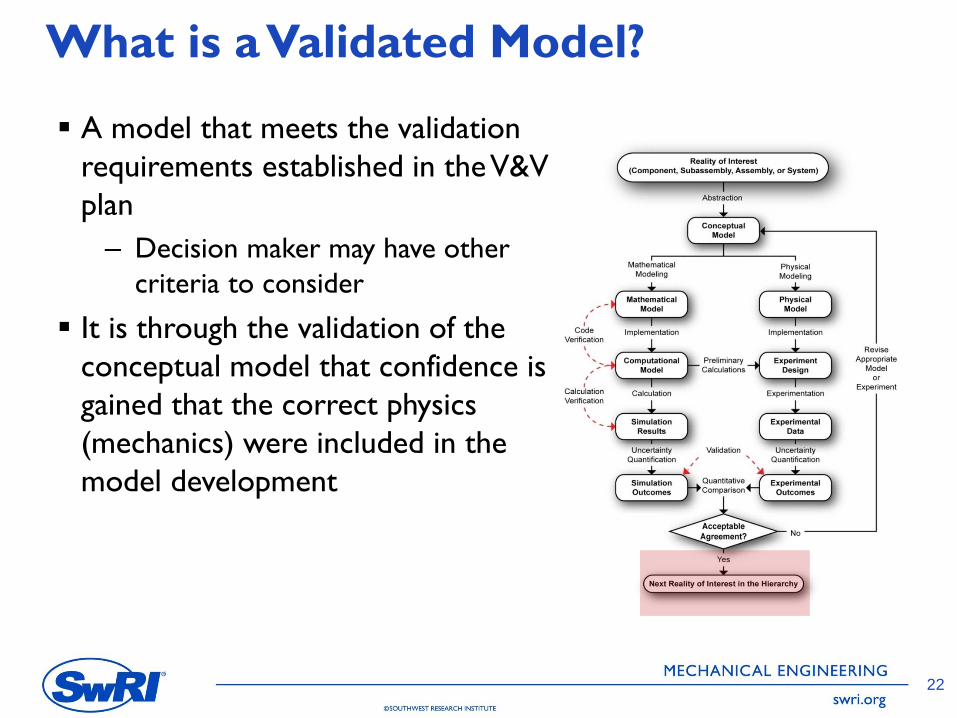
What is a Validated Model?
A model that meets the validation
requirements established in the V&V
plan
– Decision maker may have other
criteria to consider
It is through the validation of the
conceptual model that confidence is
gained that the correct physics
(mechanics) were included in the
model development
22
Select V&V Topics
23
V&V Plan– What is the question, and how good of an answer is needed?
V&V Process– Is the model correct and credible?
Validation Hierarchy– Right answer for the right reason?
Validation Experiments– What quantities need to be measured (or obtained)?
Uncertainty Quantification– What are the sources and impact of uncertainty in model and test?
Validation Metrics– How will the model predictions be compared to experimental data?
Predictive Accuracy– What accuracy (and confidence) can be associated with a prediction using
a validated model?
Documentation and Tracking– How to track and communicate progress?
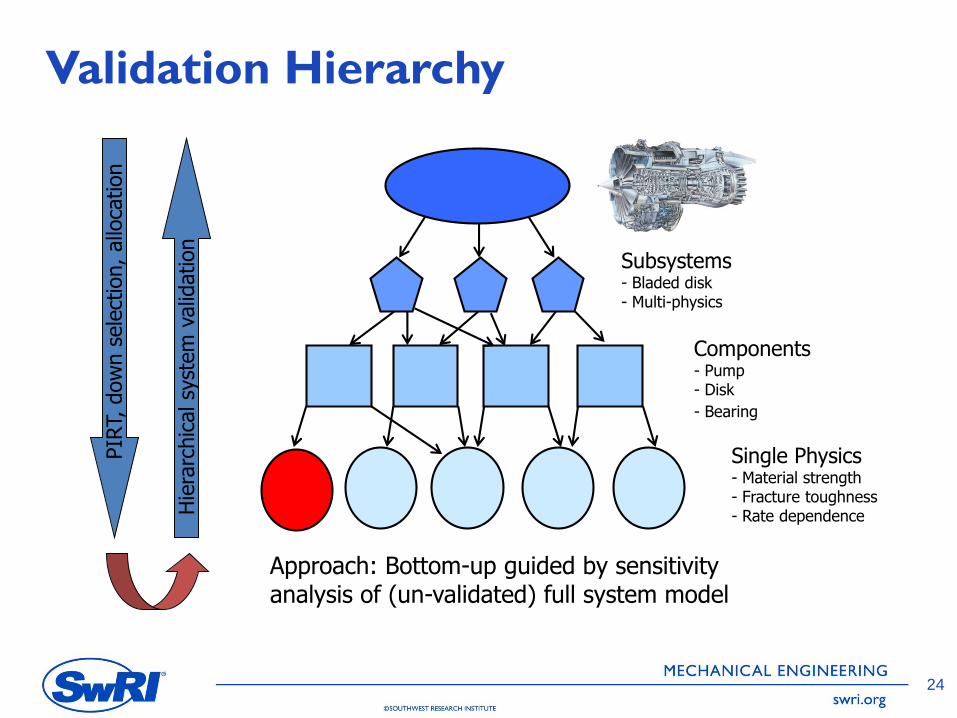
Validation Hierarchy
Subsystems- Bladed disk- Multi-physics
Components- Pump- Disk
- Bearing
Single Physics- Material strength- Fracture toughness- Rate dependence
PIR
T, d
ow
n s
ele
ctio
n,
allo
cation
Hie
rarc
hic
al sy
stem
valid
ation
Approach: Bottom-up guided by sensitivity analysis of (un-validated) full system model
2424
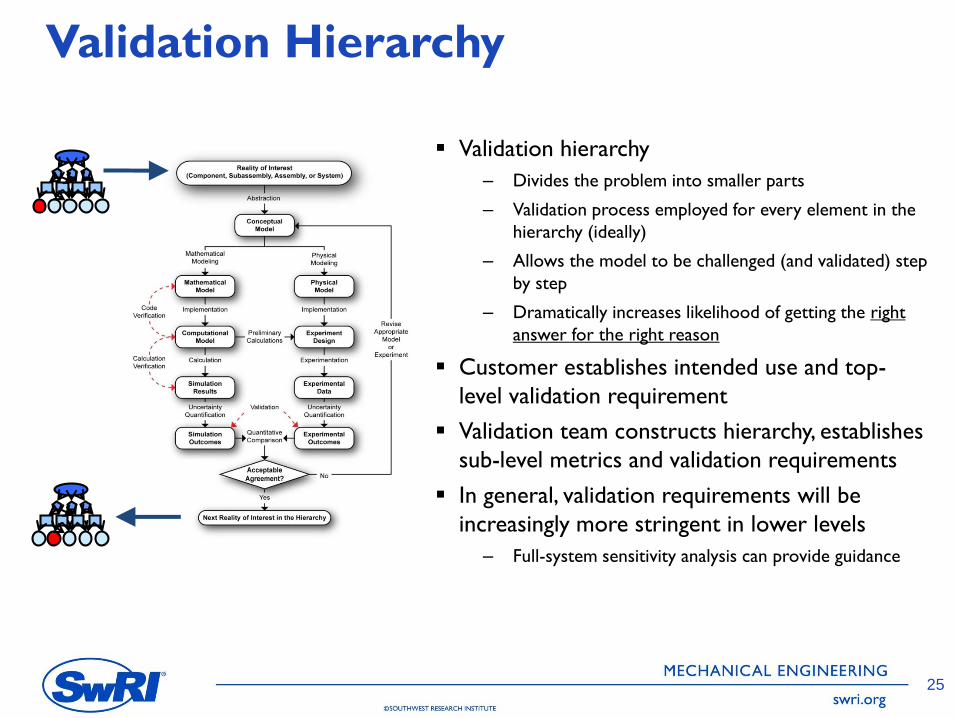
Validation Hierarchy
Validation hierarchy
– Divides the problem into smaller parts
– Validation process employed for every element in the
hierarchy (ideally)
– Allows the model to be challenged (and validated) step
by step
– Dramatically increases likelihood of getting the right
answer for the right reason
Customer establishes intended use and top-
level validation requirement
Validation team constructs hierarchy, establishes
sub-level metrics and validation requirements
In general, validation requirements will be
increasingly more stringent in lower levels
– Full-system sensitivity analysis can provide guidance
25
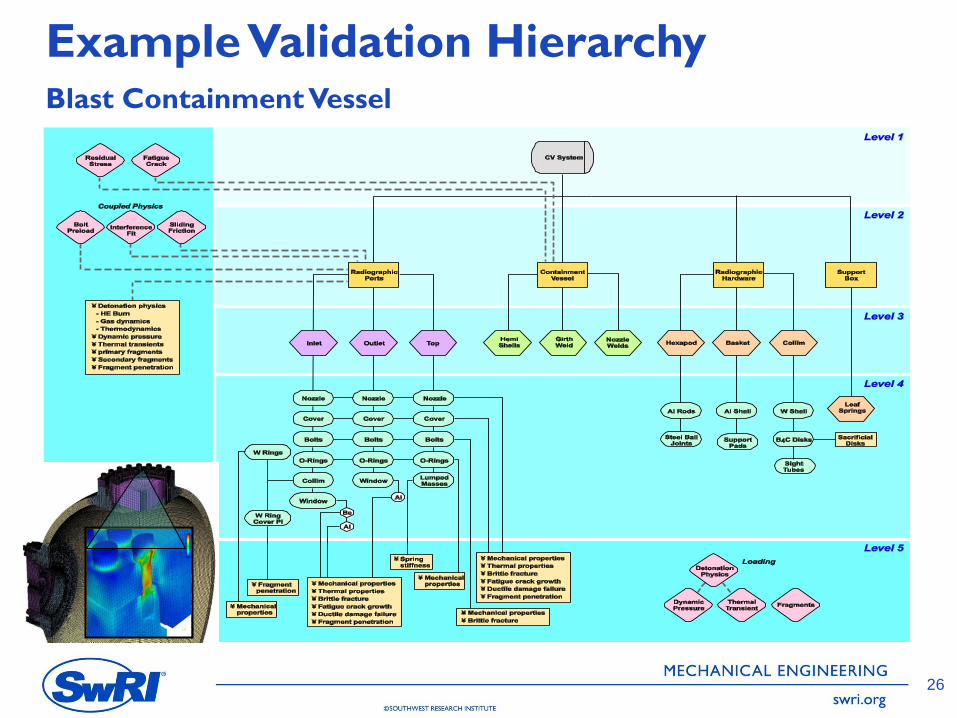
Example Validation HierarchyBlast Containment Vessel
26
Select V&V Topics
27
V&V Plan– What is the question, and how good of an answer is needed?
V&V Process– Is the model correct and credible?
Validation Hierarchy– Right answer for the right reason?
Validation Experiments– What quantities need to be measured (or obtained)?
Uncertainty Quantification– What are the sources and impact of uncertainty in model and test?
Validation Metrics– How will the model predictions be compared to experimental data?
Predictive Accuracy– What accuracy (and confidence) can be associated with a prediction using
a validated model?
Documentation and Tracking– How to track and communicate progress?
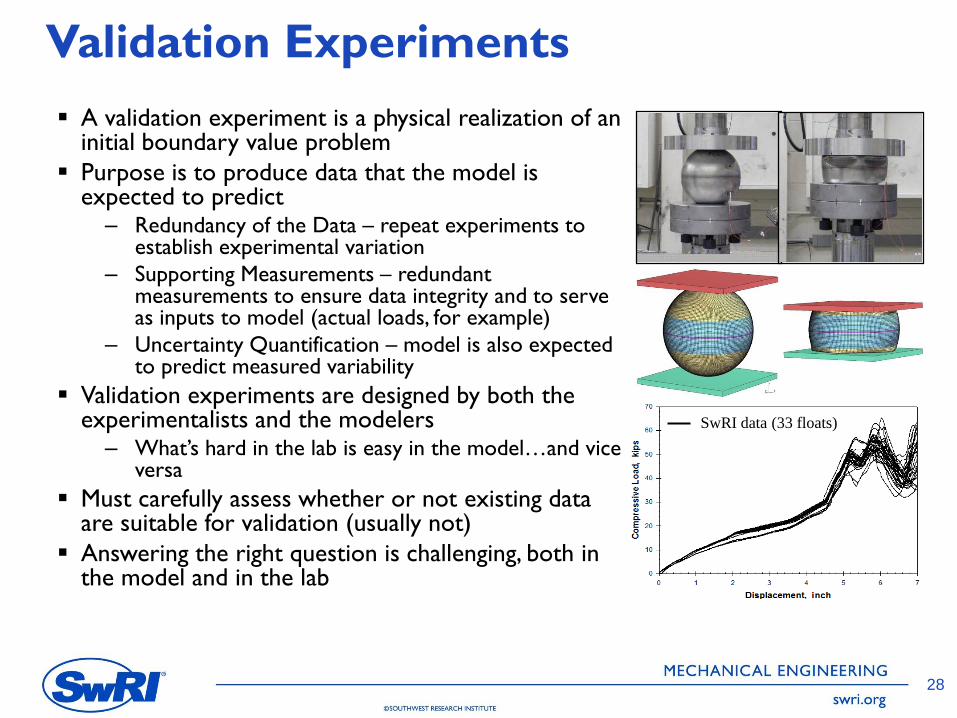
Validation Experiments
A validation experiment is a physical realization of an initial boundary value problem
Purpose is to produce data that the model is expected to predict– Redundancy of the Data – repeat experiments to
establish experimental variation
– Supporting Measurements – redundant measurements to ensure data integrity and to serve as inputs to model (actual loads, for example)
– Uncertainty Quantification – model is also expected to predict measured variability
Validation experiments are designed by both the experimentalists and the modelers– What’s hard in the lab is easy in the model…and vice
versa
Must carefully assess whether or not existing data are suitable for validation (usually not)
Answering the right question is challenging, both in the model and in the lab
28
SwRI data (33 floats)
Select V&V Topics
29
V&V Plan– What is the question, and how good of an answer is needed?
V&V Process– Is the model correct and credible?
Validation Hierarchy– Right answer for the right reason?
Validation Experiments– What quantities need to be measured (or obtained)?
Uncertainty Quantification– What are the sources and impact of uncertainty in model and test?
Validation Metrics– How will the model predictions be compared to experimental data?
Predictive Accuracy– What accuracy (and confidence) can be associated with a prediction using a
validated model?
Documentation and Tracking– How to track and communicate progress?
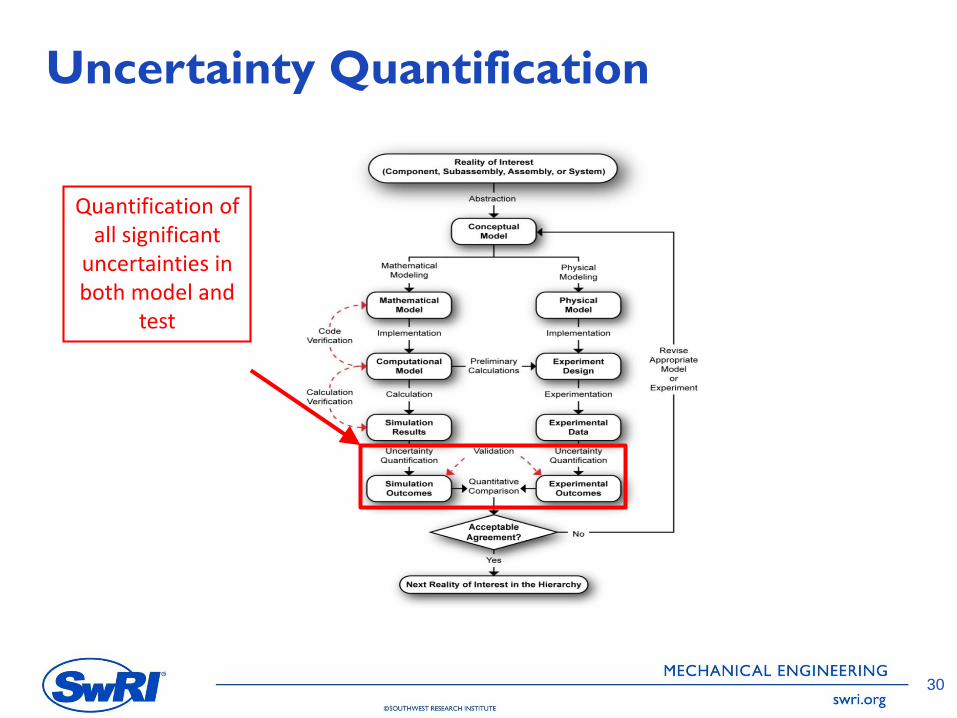
Uncertainty Quantification
Quantification of all significant
uncertainties in both model and
test
3030
Uncertainty Quantification
Quantify all sources of significant uncertainty
– Uncertainties exist in both the model and experiment
– Reducible uncertainty (epistemic uncertainty)
• Deficiencies that result from a lack of complete information
– Irreducible uncertainty (aleatory uncertainty)
• Inherent property of all physical systems
Help design validation experiments (what to control, what not
to control, what to measure, and what to let vary)
Validation metrics will also operate on uncertain quantities
31
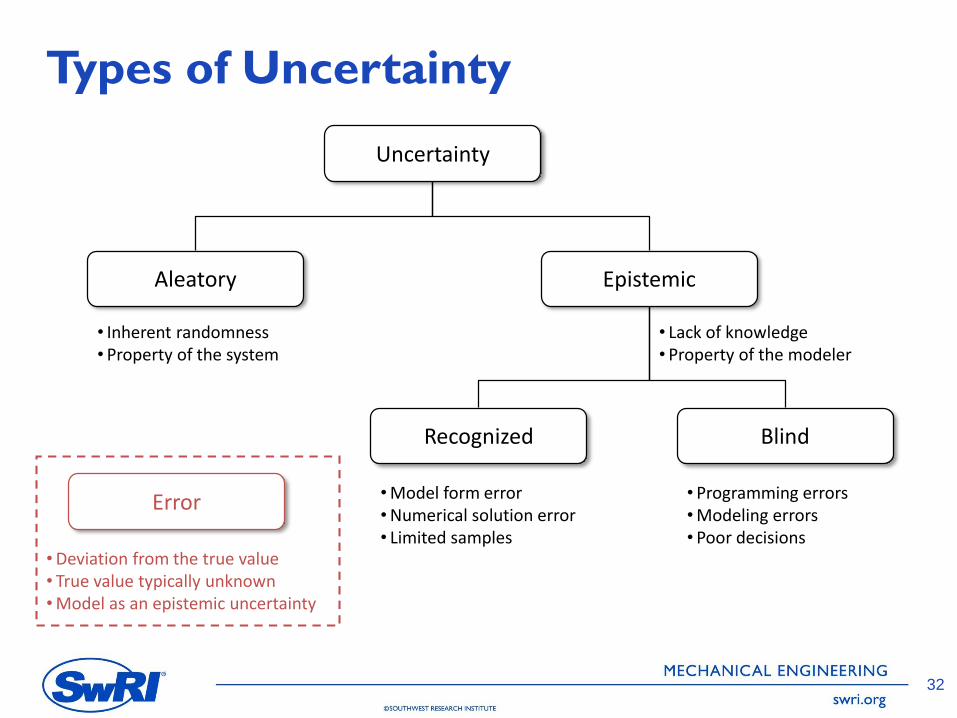
Types of Uncertainty
Uncertainty
Aleatory Epistemic
BlindRecognized
•Model form error•Numerical solution error• Limited samples
• Programming errors•Modeling errors• Poor decisions
• Inherent randomness• Property of the system
• Lack of knowledge• Property of the modeler
Error
•Deviation from the true value• True value typically unknown•Model as an epistemic uncertainty
32
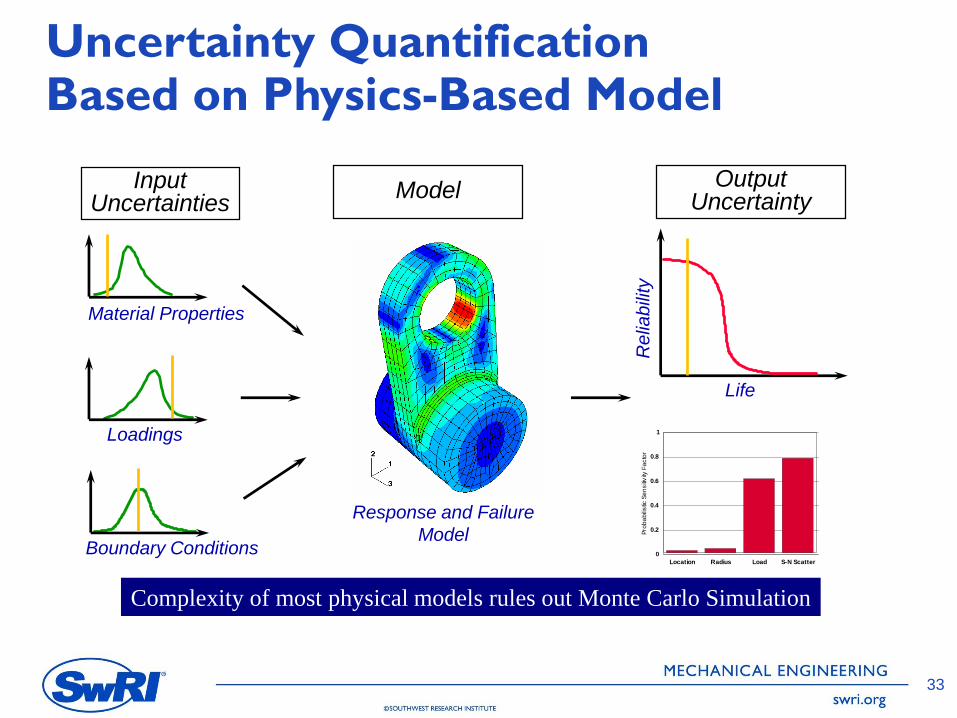
Uncertainty Quantification Based on Physics-Based Model
Complexity of most physical models rules out Monte Carlo Simulation
Input Uncertainties
Model
Material Properties
Loadings
Boundary Conditions
Output Uncertainty
Response and Failure
Model
Re
liab
ility
Life
Location Radius Load S-N Scatter
0
0.2
0.4
0.6
0.8
1
Pro
ba
bili
stic
Se
ns
itiv
ity F
ac
tor
33
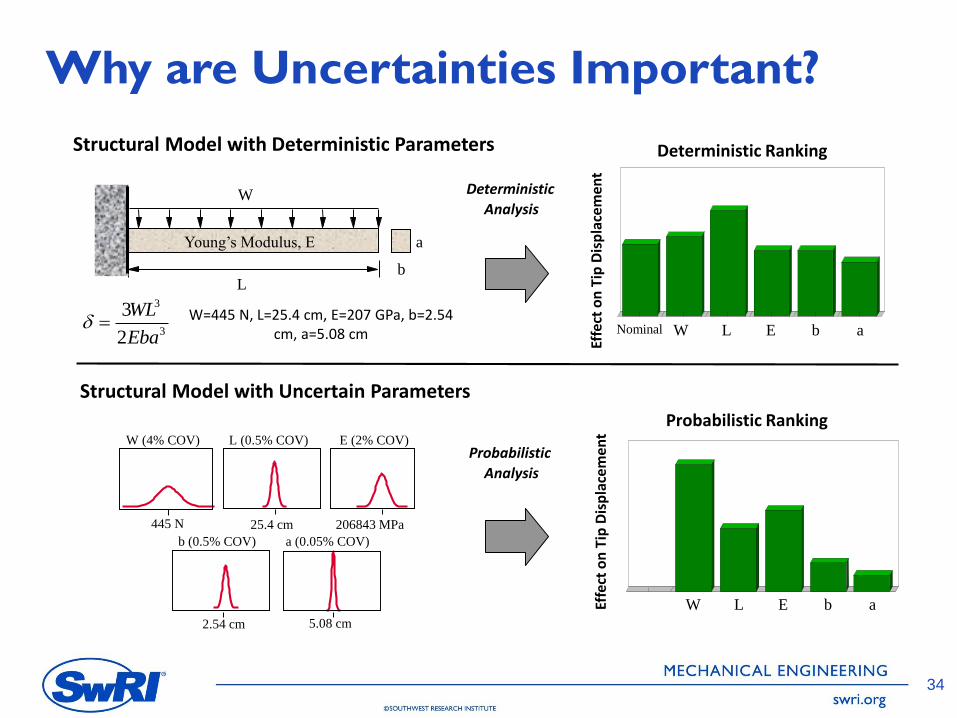
Probabilistic
Analysis
Deterministic
Analysis
W (4% COV) L (0.5% COV) E (2% COV)
445 N 25.4 cm 206843 MPa
b (0.5% COV) a (0.05% COV)
2.54 cm 5.08 cm
Structural Model with Uncertain Parameters
Structural Model with Deterministic Parameters
W=445 N, L=25.4 cm, E=207 GPa, b=2.54 cm, a=5.08 cm
L
W
a
b
Young’s Modulus, E
W L E b a
Probabilistic Ranking
Effe
ct o
n T
ip D
isp
lace
men
t
Nominal
Effe
ct o
n T
ip D
isp
lace
men
t
Deterministic Ranking
W L E b a
Why are Uncertainties Important?
3
3
3
2
WL
Eba
34
Select V&V Topics
35
V&V Plan– What is the question, and how good of an answer is needed?
V&V Process– Is the model correct and credible?
Validation Hierarchy– Right answer for the right reason?
Validation Experiments– What quantities need to be measured (or obtained)?
Uncertainty Quantification– What are the sources and impact of uncertainty in model and test?
Validation Metrics– How will the model predictions be compared to experimental data?
Predictive Accuracy– What accuracy (and confidence) can be associated with a prediction using a
validated model?
Documentation and Tracking– How to track and communicate progress?
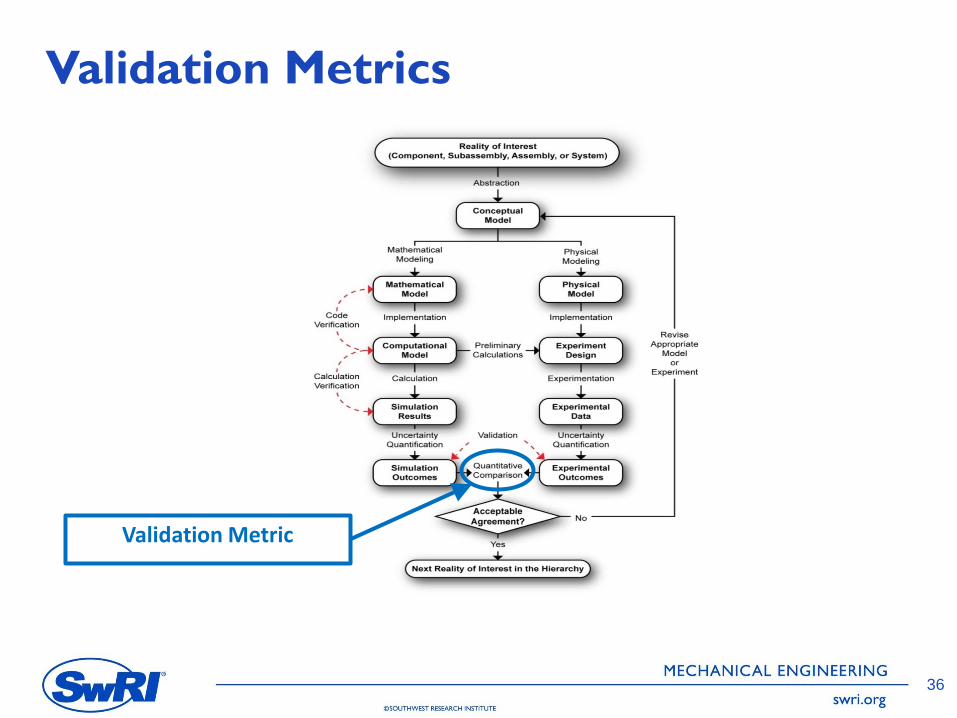
Validation Metrics
Validation Metric
3636
Validation Metrics
A validation metric quantifies the discrepancy between model
predictions and experimental data
Typically some type of a difference measure in quantities of
interest (statistics, probability distributions, etc.)
Generally, multiple response quantities and associated metrics
are better than one (right answer for the right reason)
37
One Example: Area Metric
38
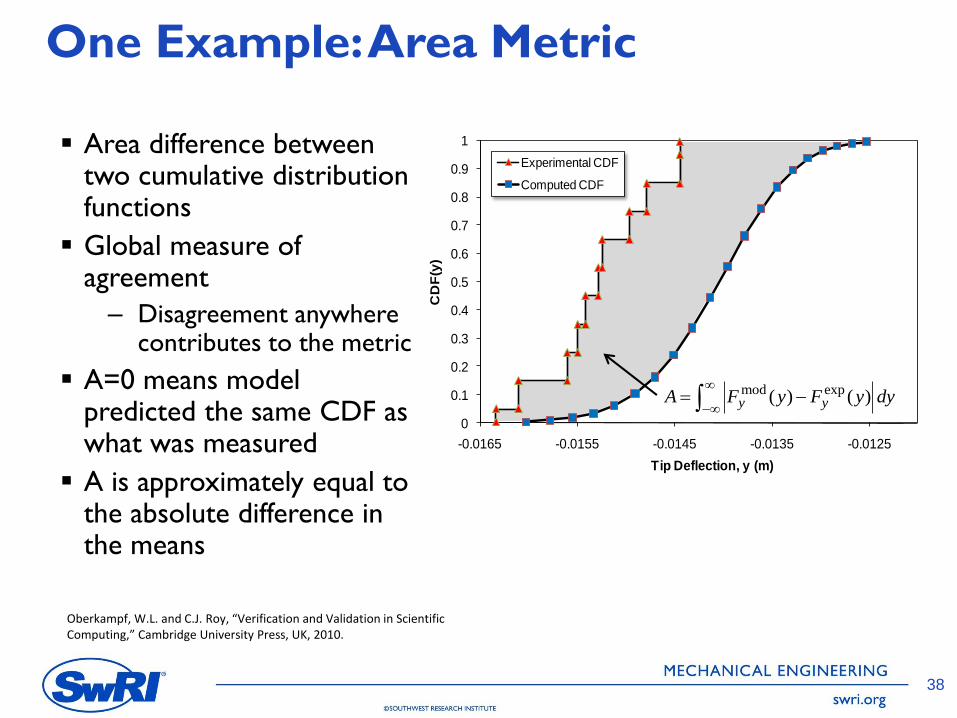
Area difference between two cumulative distribution functions
Global measure of agreement
– Disagreement anywhere contributes to the metric
A=0 means model predicted the same CDF as what was measured
A is approximately equal to the absolute difference in the means
0
0.1
0.2
0.3
0.4
0.5
0.6
0.7
0.8
0.9
1
-0.0165 -0.0155 -0.0145 -0.0135 -0.0125C
DF
(y)
Tip Deflection, y (m)
Experimental CDF
Computed CDF
mod exp( ) ( )y yA F y F y dy
Oberkampf, W.L. and C.J. Roy, “Verification and Validation in Scientific Computing,” Cambridge University Press, UK, 2010.
Area Metric
39
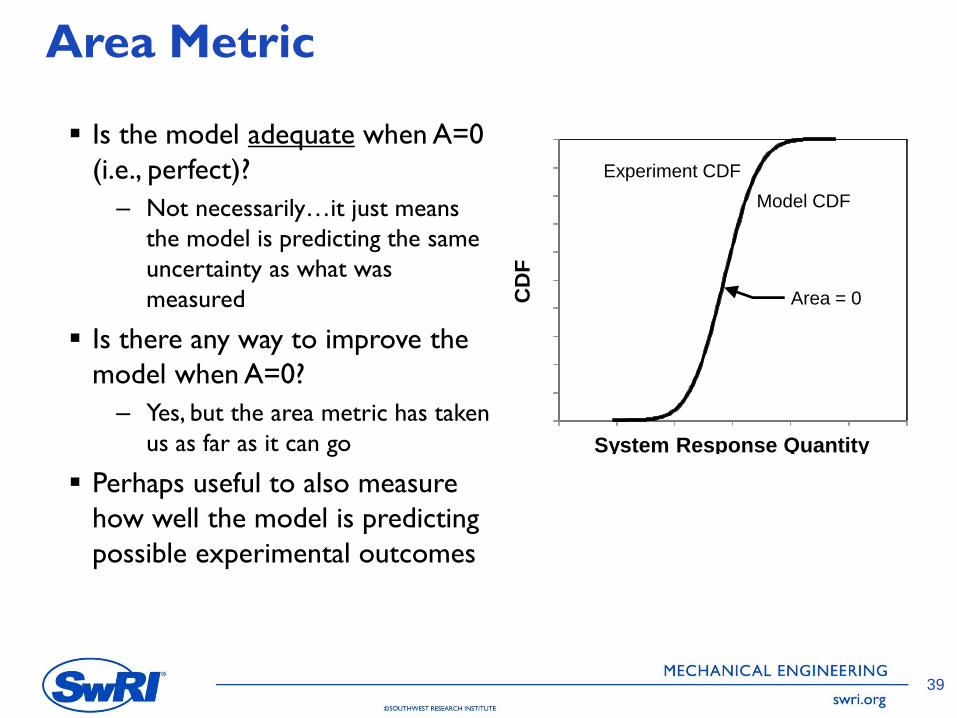
Is the model adequate when A=0
(i.e., perfect)?
– Not necessarily…it just means
the model is predicting the same
uncertainty as what was
measured
Is there any way to improve the
model when A=0?
– Yes, but the area metric has taken
us as far as it can go
Perhaps useful to also measure
how well the model is predicting
possible experimental outcomes
System Response Quantity
(b)
CD
F
Experiment CDF
Model CDF
Area = 0
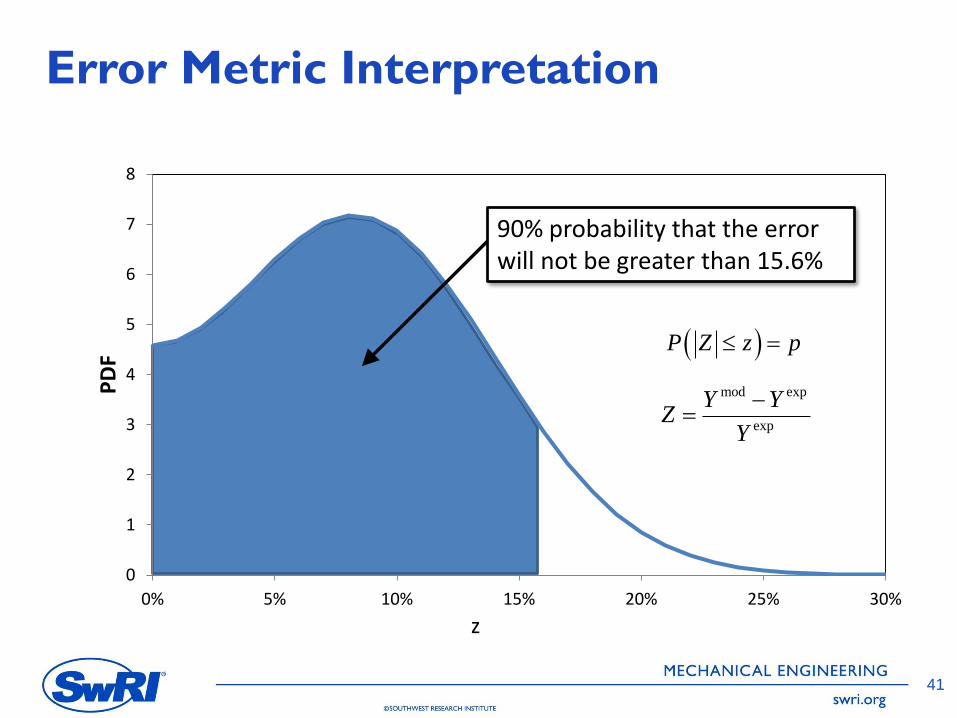
Second Example: Error Metric
40
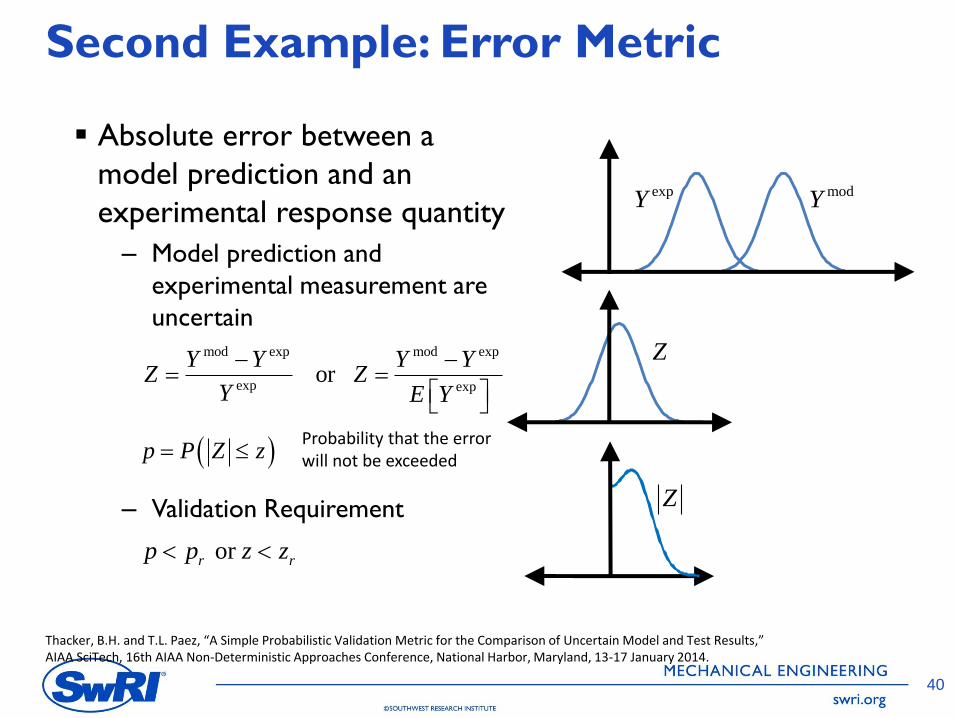
Absolute error between a
model prediction and an
experimental response quantity
– Model prediction and
experimental measurement are
uncertain
– Validation Requirement
mod exp mod exp
exp exp or
Y Y Y YZ Z
Y E Y
p P Z z Probability that the error will not be exceeded
or r rp p z z
expY modY
Z
Z
Thacker, B.H. and T.L. Paez, “A Simple Probabilistic Validation Metric for the Comparison of Uncertain Model and Test Results,” AIAA SciTech, 16th AIAA Non-Deterministic Approaches Conference, National Harbor, Maryland, 13-17 January 2014.
0
1
2
3
4
5
6
7
8
0% 5% 10% 15% 20% 25% 30%
PD
F
z0 (error)
Error Metric Interpretation
41
90% probability that the error will not be greater than 15.6%
P Z z p
mod exp
exp
Y YZ
Y
z
41
0
0.1
0.2
0.3
0.4
0.5
0.6
0.7
0.8
0.9
1
0 1 2 3 4 5 6
CD
F (p
rob
abili
ty)
Z-metric (error) value
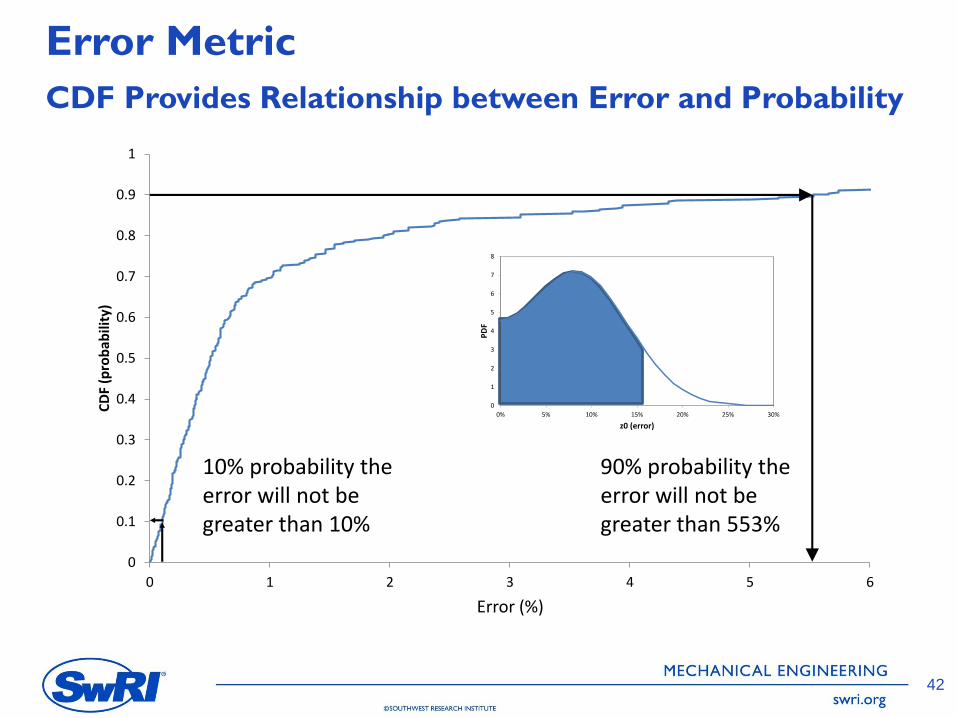
Error Metric
CDF Provides Relationship between Error and Probability
42
90% probability the error will not be greater than 553%
10% probability the error will not be greater than 10%
0
1
2
3
4
5
6
7
8
0% 5% 10% 15% 20% 25% 30%
PD
F
z0 (error)
Error (%)
42
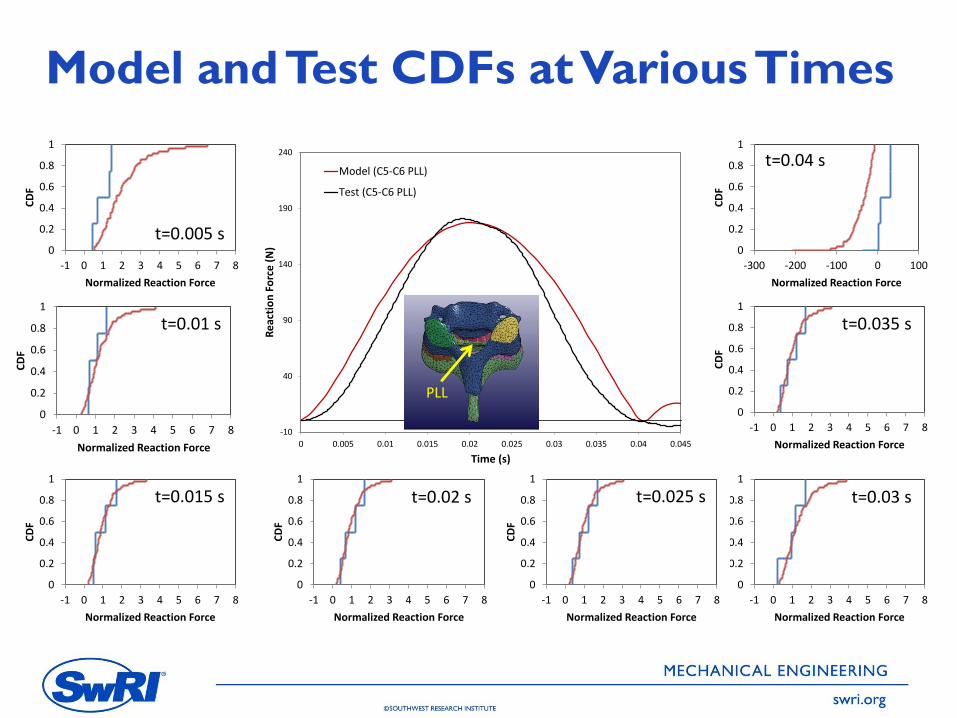
Model and Test CDFs at Various Times
43
0
0.2
0.4
0.6
0.8
1
-1 0 1 2 3 4 5 6 7 8
CD
F
Normalized Reaction Force
0
0.2
0.4
0.6
0.8
1
-1 0 1 2 3 4 5 6 7 8
CD
F
Normalized Reaction Force
0
0.2
0.4
0.6
0.8
1
-1 0 1 2 3 4 5 6 7 8
CD
F
Normalized Reaction Force
0
0.2
0.4
0.6
0.8
1
-1 0 1 2 3 4 5 6 7 8
CD
F
Normalized Reaction Force
0
0.2
0.4
0.6
0.8
1
-1 0 1 2 3 4 5 6 7 8
CD
F
Normalized Reaction Force
0
0.2
0.4
0.6
0.8
1
-1 0 1 2 3 4 5 6 7 8
CD
F
Normalized Reaction Force
0
0.2
0.4
0.6
0.8
1
-300 -200 -100 0 100
CD
F
Normalized Reaction Force
t=0.005 s
t=0.01 s
t=0.015 s t=0.02 s t=0.03 s
t=0.035 s
t=0.04 s
0
0.2
0.4
0.6
0.8
1
-1 0 1 2 3 4 5 6 7 8
CD
F
Normalized Reaction Force
t=0.025 s
-10
40
90
140
190
240
0 0.005 0.01 0.015 0.02 0.025 0.03 0.035 0.04 0.045
Re
acti
on
Fo
rce
(N
)
Time (s)
Model (C5-C6 PLL)
Test (C5-C6 PLL)
PLL
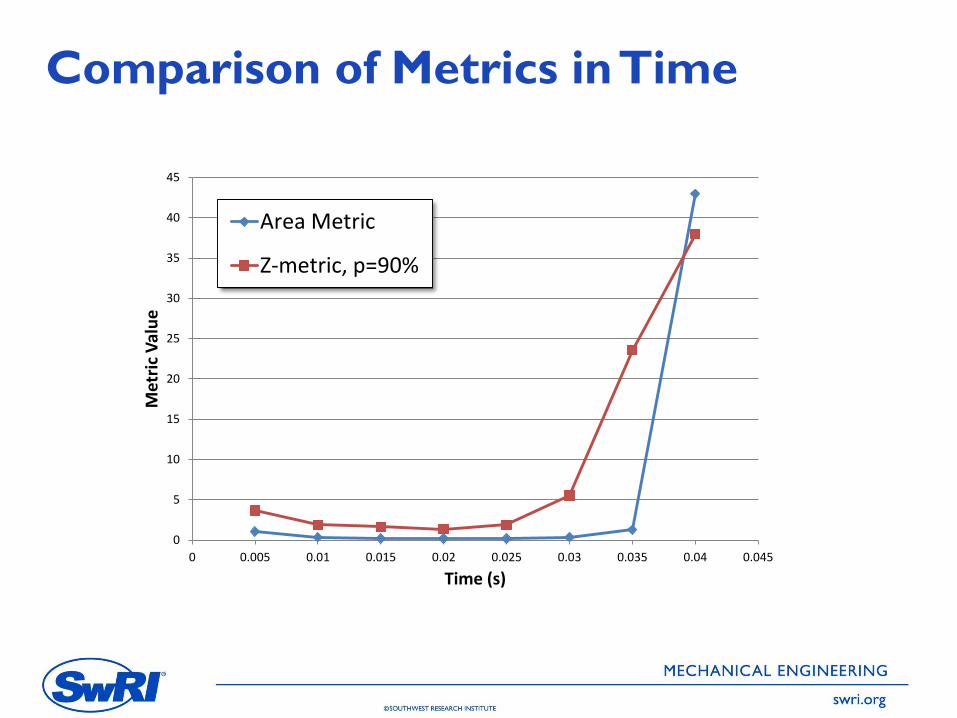
Comparison of Metrics in Time
44
0
5
10
15
20
25
30
35
40
45
0 0.005 0.01 0.015 0.02 0.025 0.03 0.035 0.04 0.045
Met
ric
Val
ue
Time (s)
Area Metric
Z-metric, p=90%
Select V&V Topics
45
V&V Plan– What is the question, and how good of an answer is needed?
V&V Process– Is the model correct and credible?
Validation Hierarchy– Right answer for the right reason?
Validation Experiments– What quantities need to be measured (or obtained)?
Uncertainty Quantification– What are the sources and impact of uncertainty in model and test?
Validation Metrics– How will the model predictions be compared to experimental data?
Predictive Accuracy– What accuracy (and confidence) can be associated with a
prediction using a validated model?
Documentation and Tracking– How to track and communicate progress?
Predictive Accuracy
Validation: the process of determining the degree to which a
model is an accurate representation of the experiment.
Prediction: Use of a model to calculate a response where
corresponding experimental data are not available.
Predictions are made during the course of performing
validation.
– Once compared to experimental data, however, it is no longer a
prediction
46
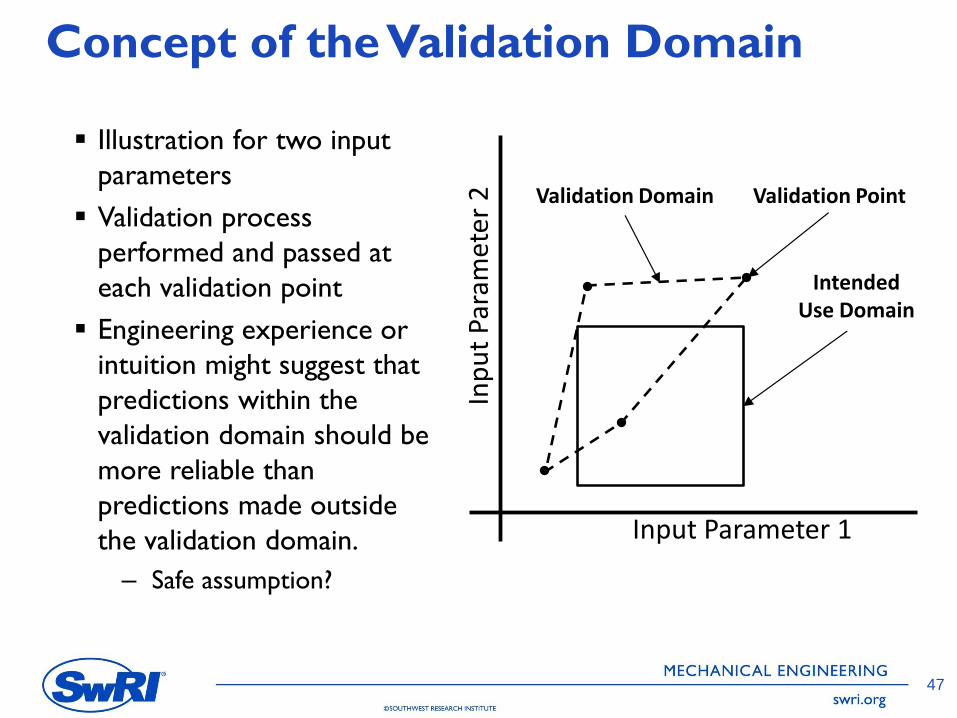
Concept of the Validation Domain
47
Illustration for two input
parameters
Validation process
performed and passed at
each validation point
Engineering experience or
intuition might suggest that
predictions within the
validation domain should be
more reliable than
predictions made outside
the validation domain.
– Safe assumption?
Validation Point
Intended Use Domain
Input Parameter 1
Inp
ut
Para
met
er 2 Validation Domain
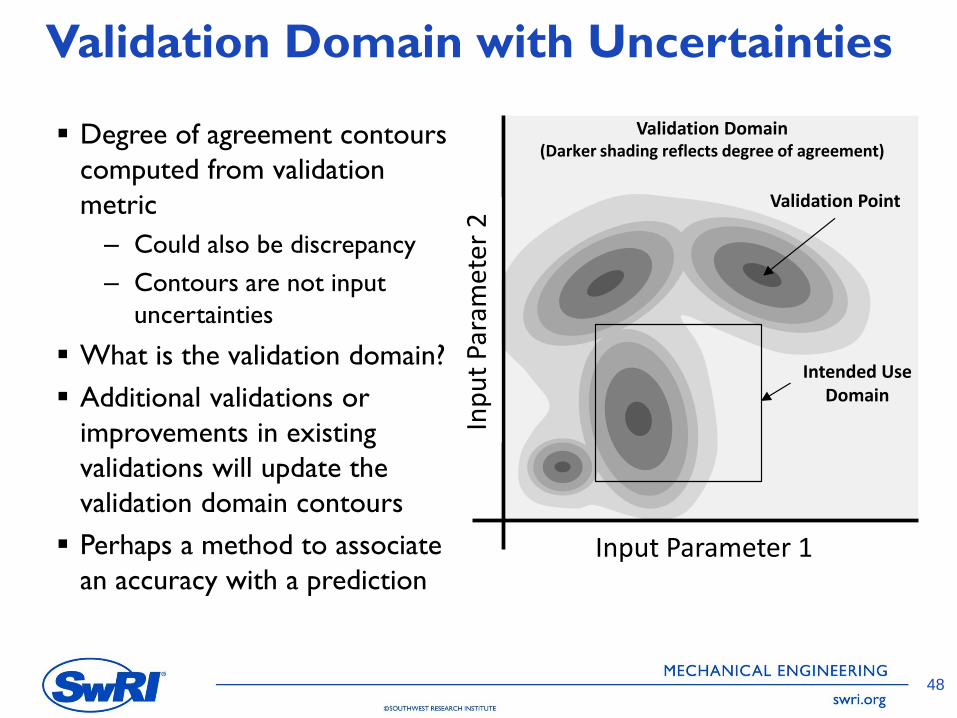
Validation Domain with Uncertainties
48
Degree of agreement contours
computed from validation
metric
– Could also be discrepancy
– Contours are not input
uncertainties
What is the validation domain?
Additional validations or
improvements in existing
validations will update the
validation domain contours
Perhaps a method to associate
an accuracy with a prediction
Intended Use Domain
Validation Domain(Darker shading reflects degree of agreement)
Input Parameter 1
Inp
ut
Para
met
er 2
Validation Point
Select V&V Topics
49
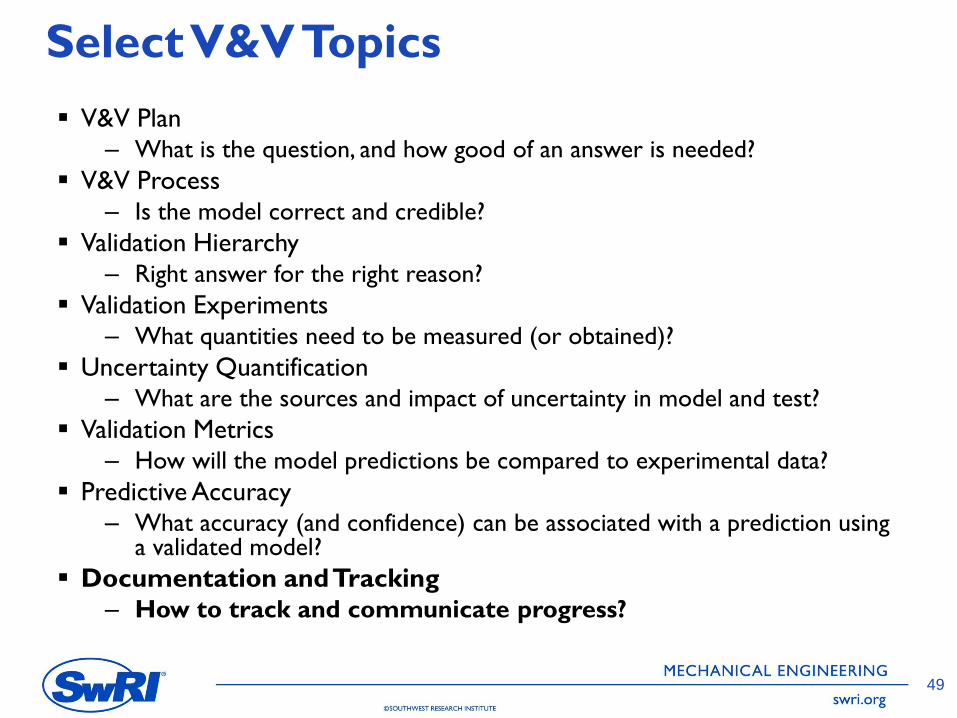
V&V Plan– What is the question, and how good of an answer is needed?
V&V Process– Is the model correct and credible?
Validation Hierarchy– Right answer for the right reason?
Validation Experiments– What quantities need to be measured (or obtained)?
Uncertainty Quantification– What are the sources and impact of uncertainty in model and test?
Validation Metrics– How will the model predictions be compared to experimental data?
Predictive Accuracy– What accuracy (and confidence) can be associated with a prediction using
a validated model?
Documentation and Tracking– How to track and communicate progress?
Target
Current
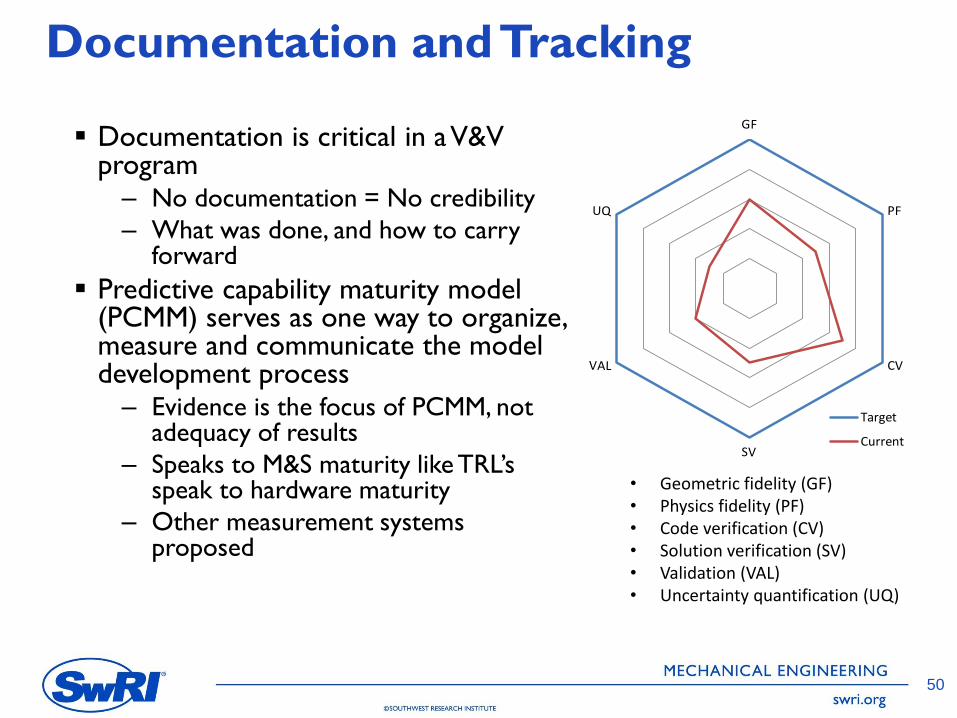
Documentation and Tracking
Documentation is critical in a V&V program– No documentation = No credibility
– What was done, and how to carry forward
Predictive capability maturity model (PCMM) serves as one way to organize, measure and communicate the model development process– Evidence is the focus of PCMM, not
adequacy of results
– Speaks to M&S maturity like TRL’s speak to hardware maturity
– Other measurement systems proposed
50
• Geometric fidelity (GF)• Physics fidelity (PF)• Code verification (CV)• Solution verification (SV)• Validation (VAL)• Uncertainty quantification (UQ)
Summary
51
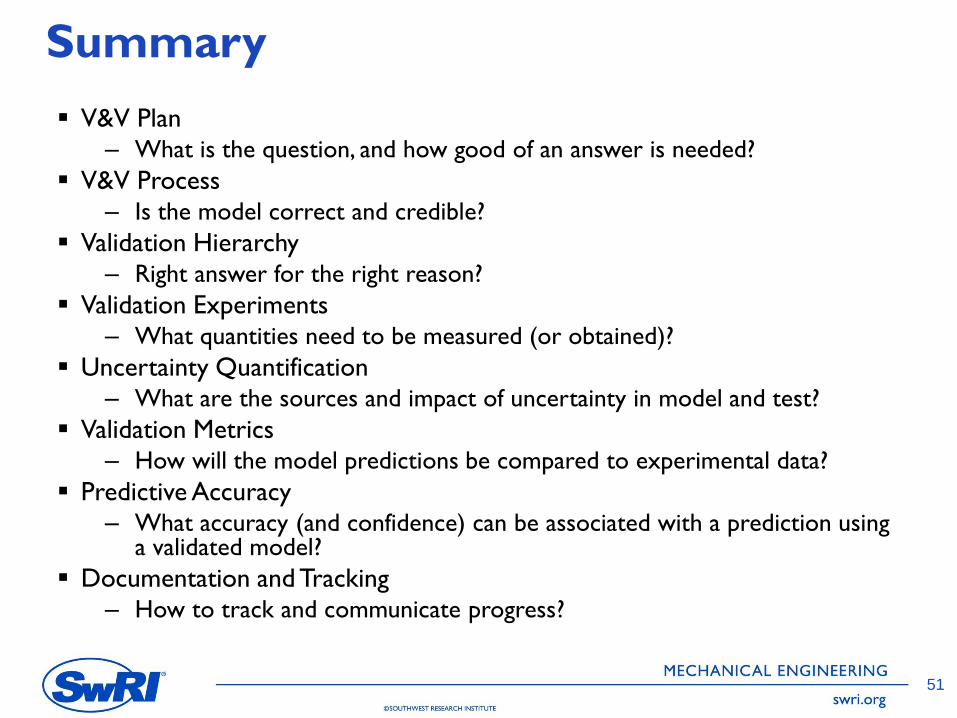
V&V Plan– What is the question, and how good of an answer is needed?
V&V Process– Is the model correct and credible?
Validation Hierarchy– Right answer for the right reason?
Validation Experiments– What quantities need to be measured (or obtained)?
Uncertainty Quantification– What are the sources and impact of uncertainty in model and test?
Validation Metrics– How will the model predictions be compared to experimental data?
Predictive Accuracy– What accuracy (and confidence) can be associated with a prediction using
a validated model?
Documentation and Tracking– How to track and communicate progress?

Southwest Research Institute®
Benefiting government, industry and the public through innovative science and technology
Thank You
52
Contact: [email protected]