Trends in HealthcareInvestments and Exits 2016
Investor Confidence and Innovation Drive
Healthcare Venture to New Heights
Written by
Jonathan Norris
Managing Director
Silicon Valley Bank
M 650.575.1377
@jonnysvb
Paul Schuber
Valuations Associate
SVB Analytics
Caitlin Tolman
Senior Associate
Silicon Valley Bank
2
Table of Contents
3 Overview
4 Healthcare Venture Fundraising and Investment: A Year of Record Highs
16 Crossover Activity Peaks in Q3, Slows in Q4
19 Healthcare Venture Exits: M&A Climate Improves as IPOs Slow
34 2016 Outlook
35 Glossary
36 Authors
3
2015: Another Banner Year for Healthcare
At the start of 2015, it was hard to imagine that we would have another year as successful as 2014. And yet, by most measures, 2015 came very close.
• Led by a blockbuster M&A deal at the end of the year, potential returns to investors in 2015 rocketed to a new
high. By SVB estimates, three years of strong performance has generated more than $55 billion in potential value
back to investors.
• With record investments in biopharma, 2015 saw more capital invested in healthcare VC-backed companies
than in any other year.
• Non-traditional “crossover investors” increased activity, participating in large mezzanine rounds to take advantage
of the biopharma IPO market.
• While IPOs dipped versus 2014, the public markets continued to be receptive to healthcare companies. Also,
many companies going public in the past two years had very successful public follow-on fundings.
• Biopharma M&A activity increased, culminating in AstraZeneca’s $4 billion payment to Acerta in
December 2015.
• Higher returns, greater investor confidence and faster investment cycles led some funds to raise again within two
years of their previous fund.
• Such a speedy fundraising cycle means venture healthcare has fresh capital to support existing investments and
create new ones, and create a critical cash cushion as IPOs decline and crossover investors pull back.
Despite the slowdown in Q4, the healthcare industry is poised for a strong 2016, though activity likely will not match 2015.
4
Healthcare Venture Fundraising and Investment: A Year of Record Highs
5
0%
2%
4%
6%
8%
10%
12%
14%
16%
18%
20%
$0
$5
$10
$15
$20
$25
$30
$35
$40
$45
$50
$55
$60
2000 2001 2002 2003 2004 2005 2006 2007 2008 2009 2010 2011 2012 2013 2014 3Q'15
$ B
illi
on
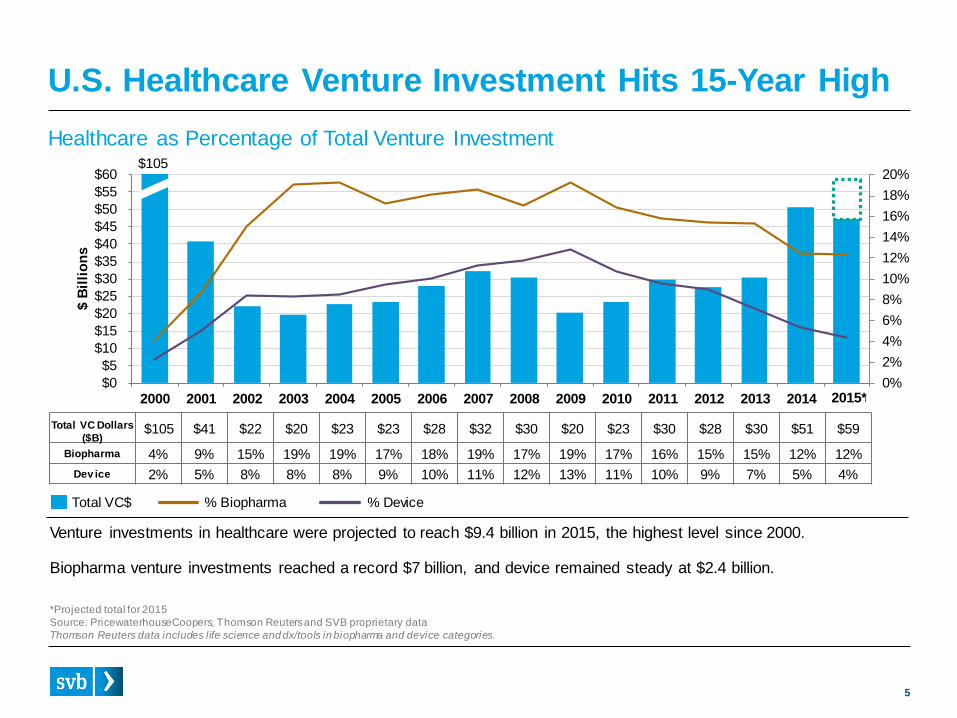
sU.S. Healthcare Venture Investment Hits 15-Year High
Healthcare as Percentage of Total Venture Investment
Venture investments in healthcare were projected to reach $9.4 billion in 2015, the highest level since 2000.
Biopharma venture investments reached a record $7 billion, and device remained steady at $2.4 billion.
Total VC Dollars
($B)$105 $41 $22 $20 $23 $23 $28 $32 $30 $20 $23 $30 $28 $30 $51 $59
Biopharma 4% 9% 15% 19% 19% 17% 18% 19% 17% 19% 17% 16% 15% 15% 12% 12%
Dev ice 2% 5% 8% 8% 8% 9% 10% 11% 12% 13% 11% 10% 9% 7% 5% 4%
$105
Total VC$ % Biopharma % Device
*Projected total for 2015
Source: PricewaterhouseCoopers, Thomson Reuters and SVB proprietary data
Thomson Reuters data includes life science and dx/tools in biopharma and device categories.
2015*
6
Strong Biopharma M&A and IPO Market Drive Investment and Fundraising
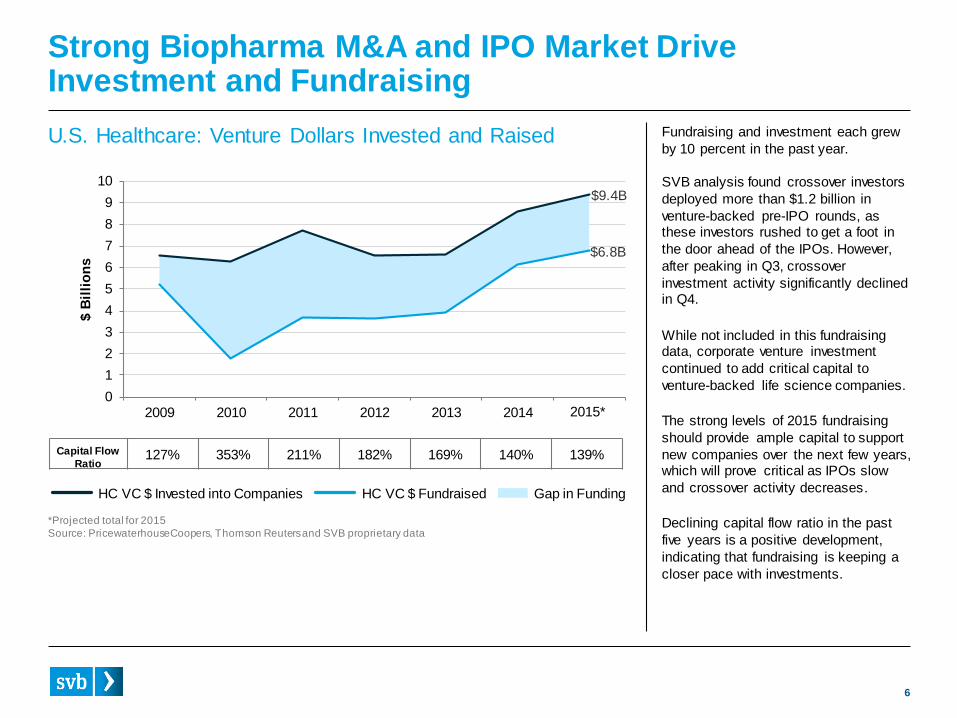
U.S. Healthcare: Venture Dollars Invested and Raised Fundraising and investment each grew
by 10 percent in the past year.
SVB analysis found crossover investors
deployed more than $1.2 billion in
venture-backed pre-IPO rounds, as these investors rushed to get a foot in
the door ahead of the IPOs. However,
after peaking in Q3, crossover
investment activity significantly declined in Q4.
While not included in this fundraising data, corporate venture investment
continued to add critical capital to
venture-backed life science companies.
The strong levels of 2015 fundraising
should provide ample capital to support
new companies over the next few years, which will prove critical as IPOs slow
and crossover activity decreases.
Declining capital flow ratio in the past
five years is a positive development,
indicating that fundraising is keeping a
closer pace with investments.
Capital Flow
Ratio127% 353% 211% 182% 169% 140% 139%
*Projected total for 2015
Source: PricewaterhouseCoopers, Thomson Reuters and SVB proprietary data
$9.4B
$6.8B
0
1
2
3
4
5
6
7
8
9
10
2009 2010 2011 2012 2013 2014 2015 Proj
$ B
illi
on
s
HC VC $ Invested into Companies HC VC $ Fundraised Gap in Funding
2015*
7
46 45 4517
0
40
80
120
# o
f D
ea
ls
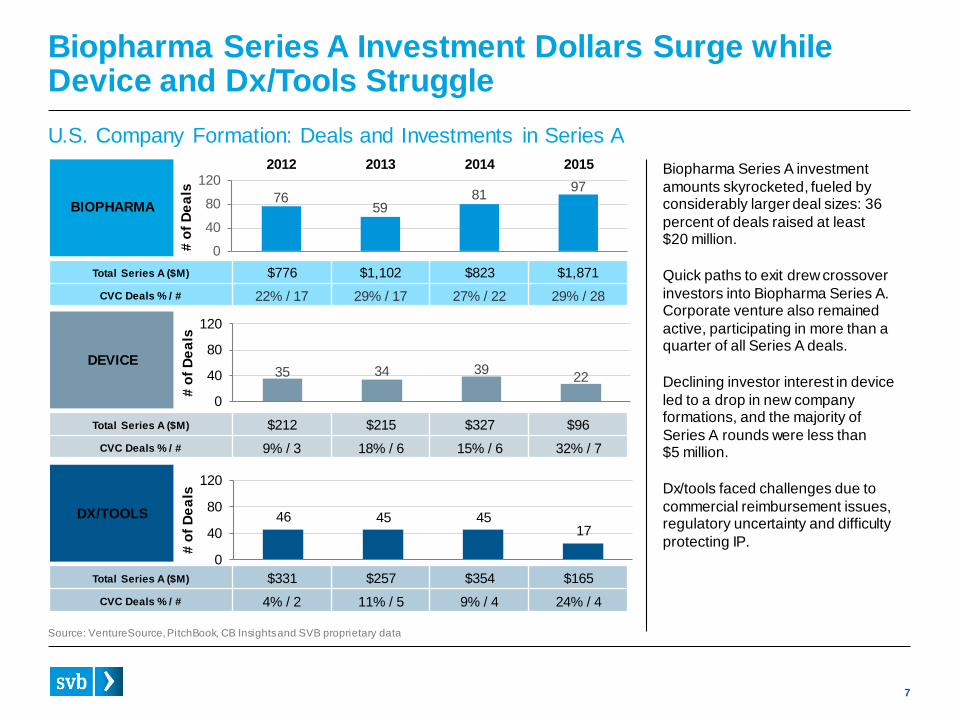
Biopharma Series A Investment Dollars Surge while Device and Dx/Tools Struggle
Source: VentureSource, PitchBook, CB Insights and SVB proprietary data
Biopharma Series A investment
amounts skyrocketed, fueled by considerably larger deal sizes: 36
percent of deals raised at least$20 million.
Quick paths to exit drew crossover
investors into Biopharma Series A. Corporate venture also remained
active, participating in more than a quarter of all Series A deals.
Declining investor interest in device
led to a drop in new company formations, and the majority of
Series A rounds were less than $5 million.
Dx/tools faced challenges due to
commercial reimbursement issues, regulatory uncertainty and difficulty
protecting IP.
7659
8197
0
40
80
1202012 2013 2014 2015
# o
f D
ea
ls
Total Series A ($M) $776 $1,102 $823 $1,871
CVC Deals % / # 22% / 17 29% / 17 27% / 22 29% / 28
BIOPHARMA
35 34 3922
0
40
80
120
# o
f D
ea
ls
Total Series A ($M) $212 $215 $327 $96
CVC Deals % / # 9% / 3 18% / 6 15% / 6 32% / 7
DEVICE
Total Series A ($M) $331 $257 $354 $165
CVC Deals % / # 4% / 2 11% / 5 9% / 4 24% / 4
DX/TOOLS
U.S. Company Formation: Deals and Investments in Series A
8
Venture Capital and Corporate VentureAccelerate Investing Pace
*Most active defined as top 60 investors based on new investments
Source: CB Insights, press releases, PitchBook and SVB proprietary data
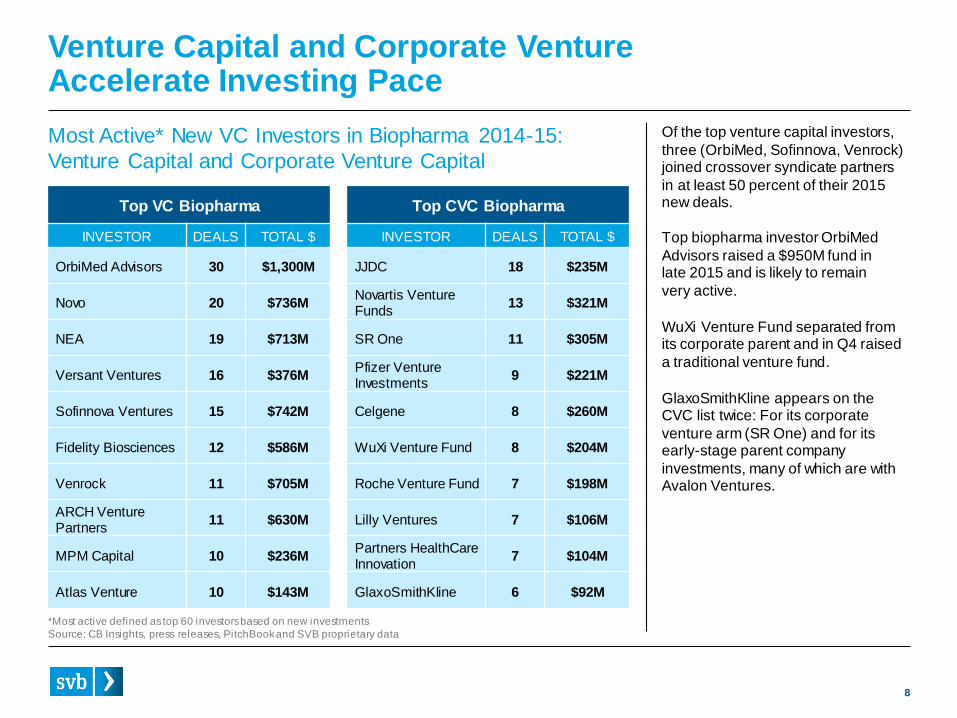
Of the top venture capital investors,
three (OrbiMed, Sofinnova, Venrock) joined crossover syndicate partners
in at least 50 percent of their 2015 new deals.
Top biopharma investor OrbiMed
Advisors raised a $950M fund in late 2015 and is likely to remain
very active.
WuXi Venture Fund separated from its corporate parent and in Q4 raised
a traditional venture fund.
GlaxoSmithKline appears on the CVC list twice: For its corporate
venture arm (SR One) and for its early-stage parent company
investments, many of which are with Avalon Ventures.
Top VC Biopharma
INVESTOR DEALS TOTAL $
OrbiMed Advisors 30 $1,300M
Novo 20 $736M
NEA 19 $713M
Versant Ventures 16 $376M
Sofinnova Ventures 15 $742M
Fidelity Biosciences 12 $586M
Venrock 11 $705M
ARCH Venture Partners
11 $630M
MPM Capital 10 $236M
Atlas Venture 10 $143M
Top CVC Biopharma
INVESTOR DEALS TOTAL $
JJDC 18 $235M
Novartis Venture Funds
13 $321M
SR One 11 $305M
Pfizer Venture Investments
9 $221M
Celgene 8 $260M
WuXi Venture Fund 8 $204M
Roche Venture Fund 7 $198M
Lilly Ventures 7 $106M
Partners HealthCare Innovation
7 $104M
GlaxoSmithKline 6 $92M
Most Active* New VC Investors in Biopharma 2014-15:
Venture Capital and Corporate Venture Capital
9
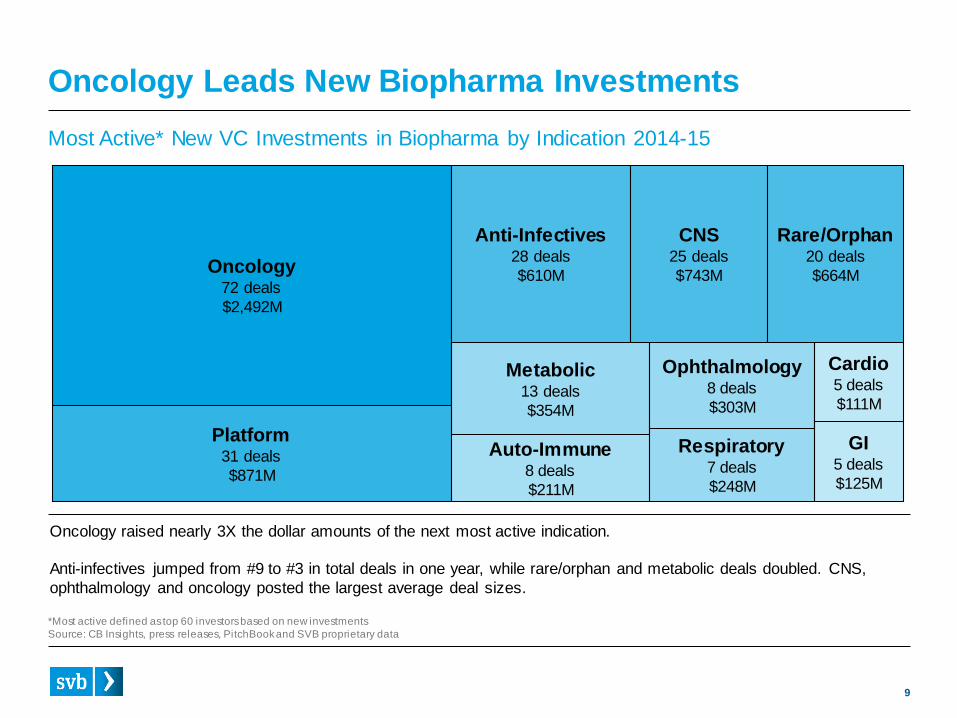
Oncology Leads New Biopharma Investments
Oncology72 deals
$2,492M
Platform31 deals
$871M
Anti-Infectives28 deals
$610M
CNS25 deals
$743M
Rare/Orphan20 deals
$664M
Metabolic13 deals
$354M
Auto-Immune8 deals
$211M
Respiratory7 deals
$248M
Ophthalmology8 deals
$303M
GI5 deals
$125M
Cardio5 deals
$111M
Most Active* New VC Investments in Biopharma by Indication 2014-15
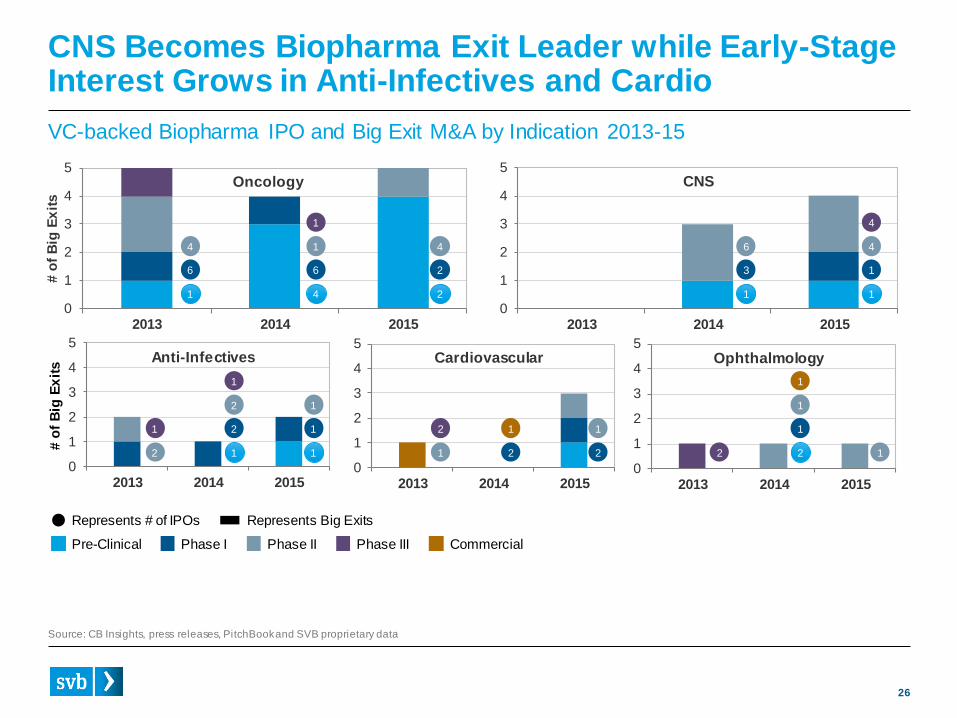
Oncology raised nearly 3X the dollar amounts of the next most active indication.
Anti-infectives jumped from #9 to #3 in total deals in one year, while rare/orphan and metabolic deals doubled. CNS,
ophthalmology and oncology posted the largest average deal sizes.
*Most active defined as top 60 investors based on new investments
Source: CB Insights, press releases, PitchBook and SVB proprietary data
10
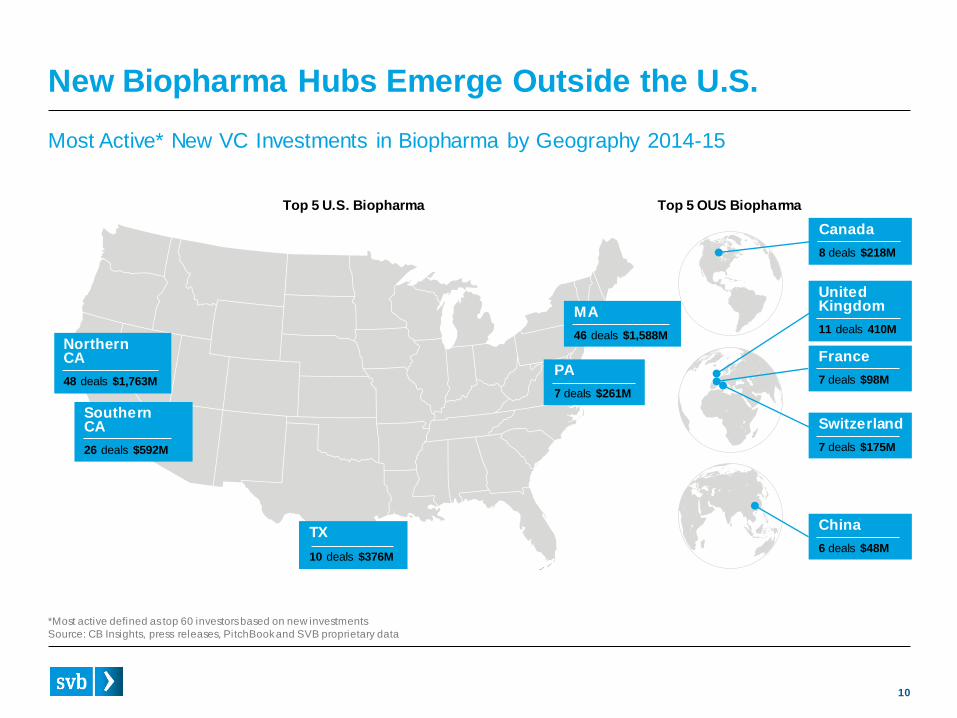
New Biopharma Hubs Emerge Outside the U.S.
Most Active* New VC Investments in Biopharma by Geography 2014-15
NorthernCA
48 deals $1,763M
Southern CA
26 deals $592M
Canada
8 deals $218M
Top 5 U.S. Biopharma Top 5 OUS Biopharma
United Kingdom
11 deals 410M
France
7 deals $98M
China
6 deals $48M
Switzerland
7 deals $175M
MA
46 deals $1,588M
TX
10 deals $376M
PA
7 deals $261M
*Most active defined as top 60 investors based on new investments
Source: CB Insights, press releases, PitchBook and SVB proprietary data
11
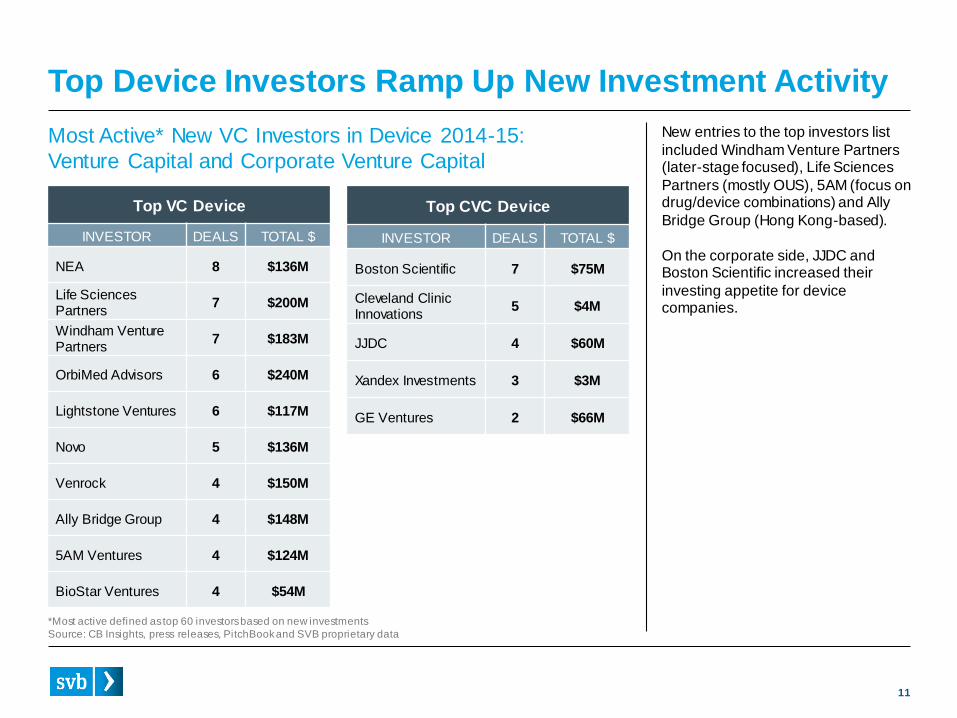
Top Device Investors Ramp Up New Investment Activity
Top VC Device
INVESTOR DEALS TOTAL $
NEA 8 $136M
Life Sciences Partners
7 $200M
Windham Venture Partners
7 $183M
OrbiMed Advisors 6 $240M
Lightstone Ventures 6 $117M
Novo 5 $136M
Venrock 4 $150M
Ally Bridge Group 4 $148M
5AM Ventures 4 $124M
BioStar Ventures 4 $54M
Top CVC Device
INVESTOR DEALS TOTAL $
Boston Scientific 7 $75M
Cleveland Clinic Innovations
5 $4M
JJDC 4 $60M
Xandex Investments 3 $3M
GE Ventures 2 $66M
Most Active* New VC Investors in Device 2014-15:
Venture Capital and Corporate Venture Capital
New entries to the top investors list
included Windham Venture Partners (later-stage focused), Life Sciences
Partners (mostly OUS), 5AM (focus on drug/device combinations) and Ally
Bridge Group (Hong Kong-based).
On the corporate side, JJDC and Boston Scientific increased their
investing appetite for device companies.
*Most active defined as top 60 investors based on new investments
Source: CB Insights, press releases, PitchBook and SVB proprietary data
12
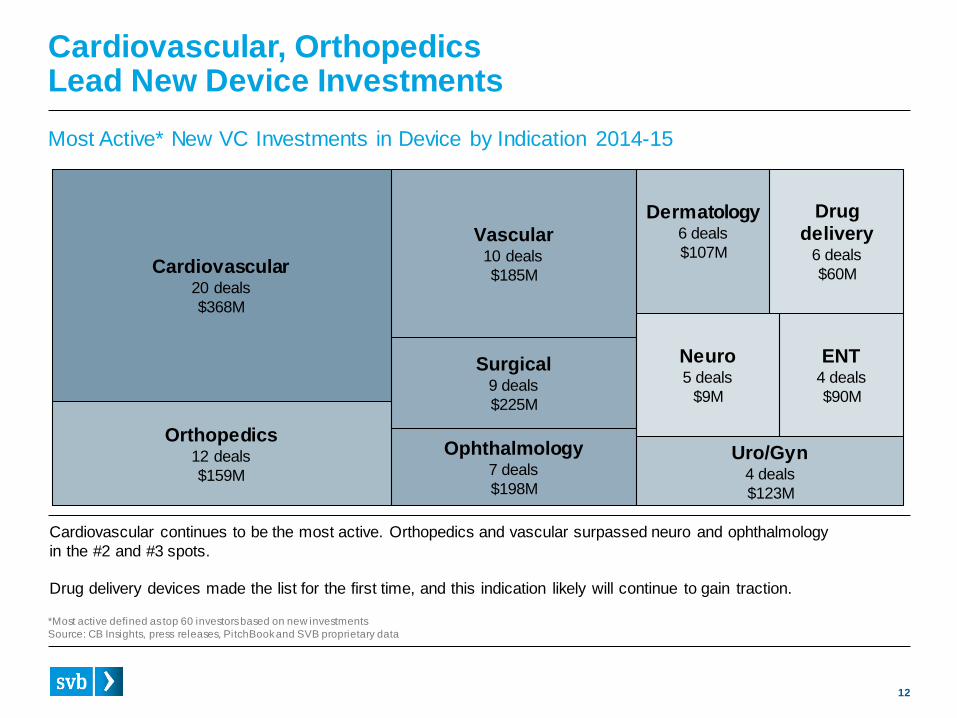
Cardiovascular continues to be the most active. Orthopedics and vascular surpassed neuro and ophthalmology
in the #2 and #3 spots.
Drug delivery devices made the list for the first time, and this indication likely will continue to gain traction.
Cardiovascular, OrthopedicsLead New Device Investments
Most Active* New VC Investments in Device by Indication 2014-15
Cardiovascular20 deals
$368M
Orthopedics12 deals
$159M
Dermatology6 deals
$107M
Drug delivery
6 deals
$60M
Vascular10 deals
$185M
Surgical9 deals
$225M
Ophthalmology7 deals
$198M
Uro/Gyn4 deals
$123M
Neuro5 deals
$9M
*Most active defined as top 60 investors based on new investments
Source: CB Insights, press releases, PitchBook and SVB proprietary data
ENT4 deals
$90M
13
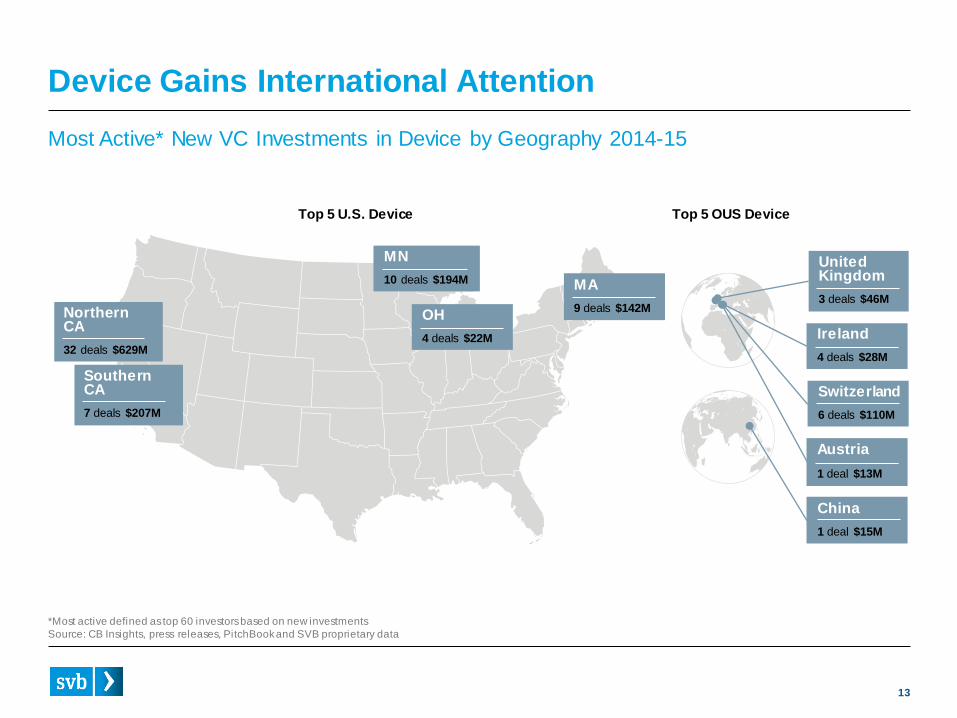
Device Gains International Attention
Most Active* New VC Investments in Device by Geography 2014-15
Top 5 U.S. Device Top 5 OUS Device
NorthernCA
32 deals $629M
SouthernCA
7 deals $207M
MN
10 deals $194M
OH
4 deals $22M
MA
9 deals $142M
United Kingdom
3 deals $46M
Ireland
4 deals $28M
Switzerland
6 deals $110M
Austria
1 deal $13M
China
1 deal $15M
*Most active defined as top 60 investors based on new investments
Source: CB Insights, press releases, PitchBook and SVB proprietary data
14
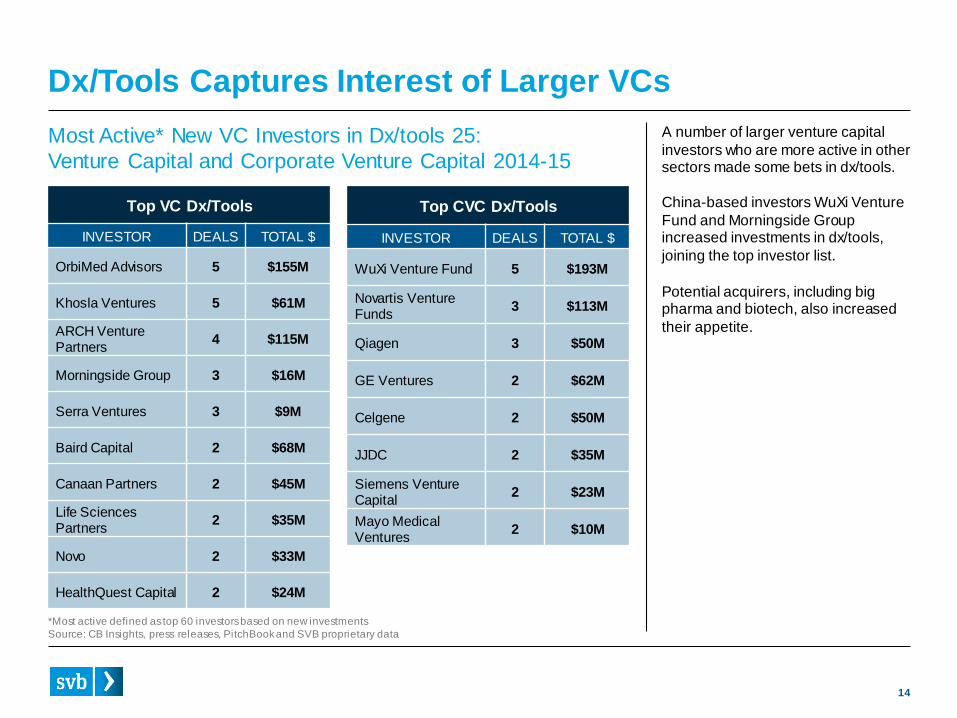
Top CVC Dx/Tools
INVESTOR DEALS TOTAL $
WuXi Venture Fund 5 $193M
Novartis Venture Funds
3 $113M
Qiagen 3 $50M
GE Ventures 2 $62M
Celgene 2 $50M
JJDC 2 $35M
Siemens Venture Capital
2 $23M
Mayo Medical Ventures
2 $10M
Dx/Tools Captures Interest of Larger VCs
Top VC Dx/Tools
INVESTOR DEALS TOTAL $
OrbiMed Advisors 5 $155M
Khosla Ventures 5 $61M
ARCH Venture Partners
4 $115M
Morningside Group 3 $16M
Serra Ventures 3 $9M
Baird Capital 2 $68M
Canaan Partners 2 $45M
Life SciencesPartners
2 $35M
Novo 2 $33M
HealthQuest Capital 2 $24M
Most Active* New VC Investors in Dx/tools 25:
Venture Capital and Corporate Venture Capital 2014-15
A number of larger venture capital
investors who are more active in other sectors made some bets in dx/tools.
China-based investors WuXi Venture
Fund and Morningside Group increased investments in dx/tools,
joining the top investor list.
Potential acquirers, including big pharma and biotech, also increased
their appetite.
*Most active defined as top 60 investors based on new investments
Source: CB Insights, press releases, PitchBook and SVB proprietary data
15
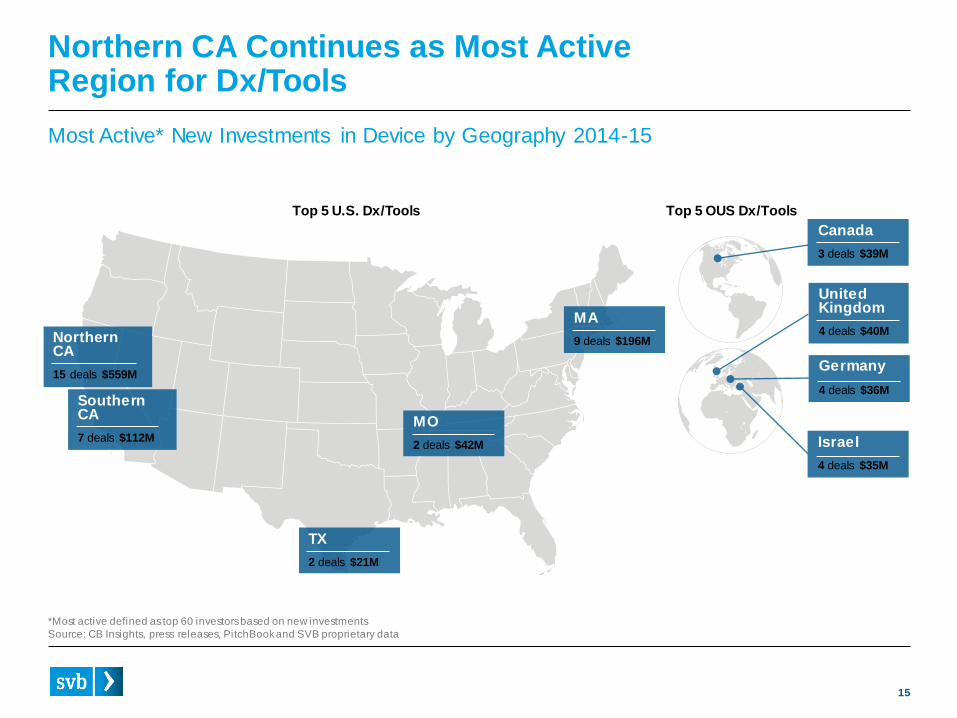
Canada
3 deals $39M
United Kingdom
4 deals $40M
Northern CA Continues as Most Active Region for Dx/Tools
Top 5 U.S. Dx/Tools Top 5 OUS Dx/Tools
Most Active* New Investments in Device by Geography 2014-15
NorthernCA
15 deals $559M
SouthernCA
7 deals $112M
TX
2 deals $21M
MO
2 deals $42M
MA
9 deals $196M
Germany
4 deals $36M
Israel
4 deals $35M
*Most active defined as top 60 investors based on new investments
Source: CB Insights, press releases, PitchBook and SVB proprietary data
16
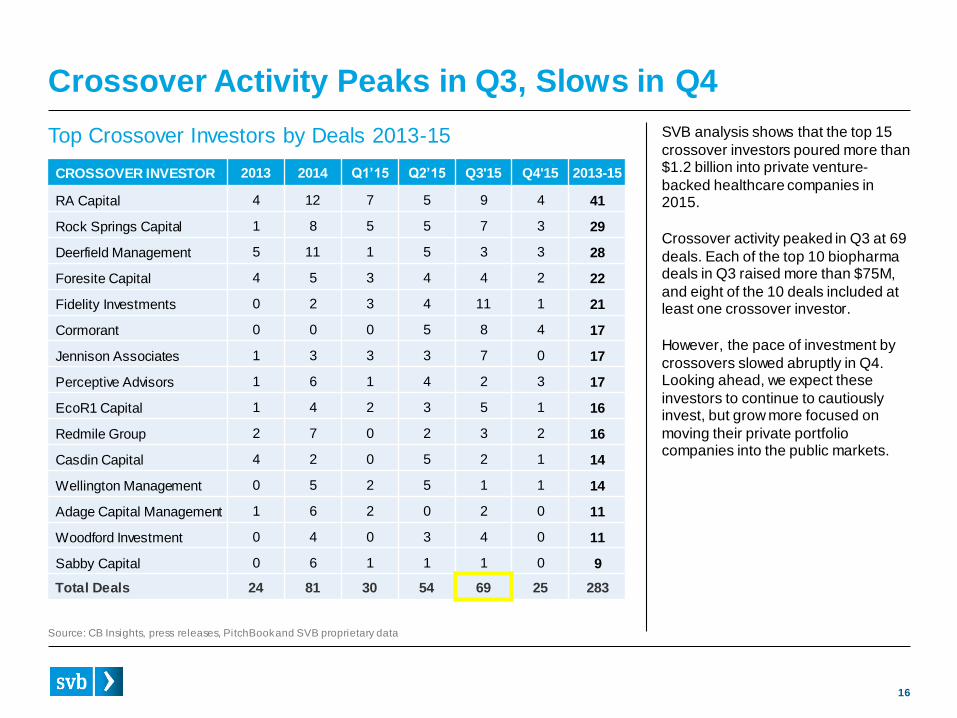
Crossover Activity Peaks in Q3, Slows in Q4
CROSSOVER INVESTOR 2013 2014 Q1’15 Q2’15 Q3'15 Q4'15 2013-15
RA Capital 4 12 7 5 9 4 41
Rock Springs Capital 1 8 5 5 7 3 29
Deerfield Management 5 11 1 5 3 3 28
Foresite Capital 4 5 3 4 4 2 22
Fidelity Investments 0 2 3 4 11 1 21
Cormorant 0 0 0 5 8 4 17
Jennison Associates 1 3 3 3 7 0 17
Perceptive Advisors 1 6 1 4 2 3 17
EcoR1 Capital 1 4 2 3 5 1 16
Redmile Group 2 7 0 2 3 2 16
Casdin Capital 4 2 0 5 2 1 14
Wellington Management 0 5 2 5 1 1 14
Adage Capital Management 1 6 2 0 2 0 11
Woodford Investment 0 4 0 3 4 0 11
Sabby Capital 0 6 1 1 1 0 9
Total Deals 24 81 30 54 69 25 283
Top Crossover Investors by Deals 2013-15 SVB analysis shows that the top 15
crossover investors poured more than $1.2 billion into private venture-
backed healthcare companies in 2015.
Crossover activity peaked in Q3 at 69
deals. Each of the top 10 biopharma deals in Q3 raised more than $75M,
and eight of the 10 deals included at least one crossover investor.
However, the pace of investment by
crossovers slowed abruptly in Q4. Looking ahead, we expect these
investors to continue to cautiously invest, but grow more focused on
moving their private portfolio companies into the public markets.
Source: CB Insights, press releases, PitchBook and SVB proprietary data
17
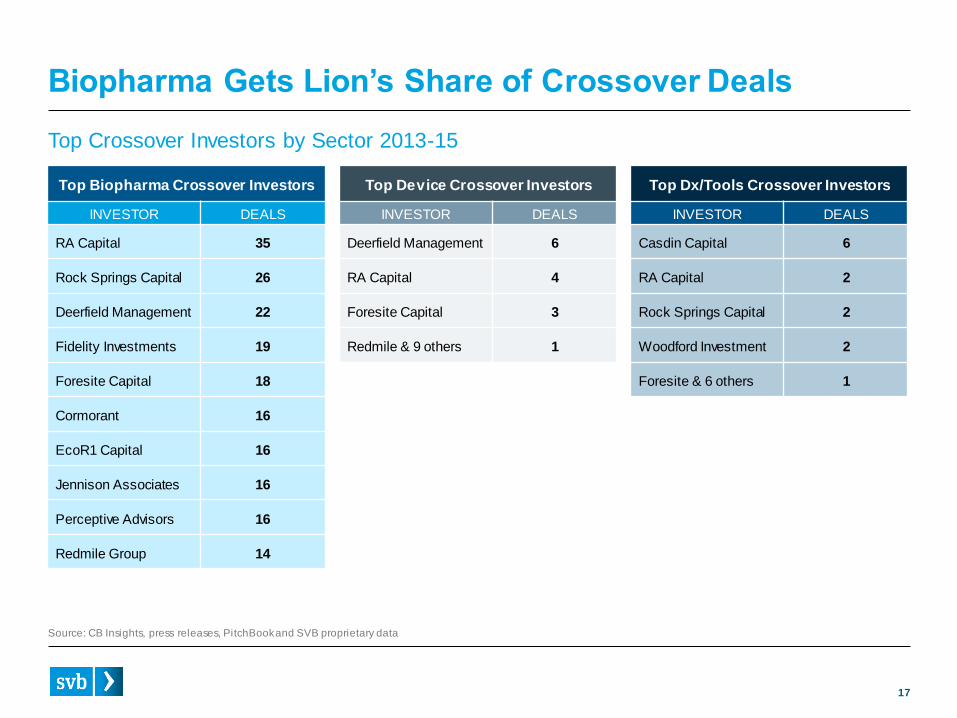
Biopharma Gets Lion’s Share of Crossover Deals
Top Crossover Investors by Sector 2013-15
Source: CB Insights, press releases, PitchBook and SVB proprietary data
Top Biopharma Crossover Investors
INVESTOR DEALS
RA Capital 35
Rock Springs Capital 26
Deerfield Management 22
Fidelity Investments 19
Foresite Capital 18
Cormorant 16
EcoR1 Capital 16
Jennison Associates 16
Perceptive Advisors 16
Redmile Group 14
Top Device Crossover Investors
INVESTOR DEALS
Deerfield Management 6
RA Capital 4
Foresite Capital 3
Redmile & 9 others 1
Top Dx/Tools Crossover Investors
INVESTOR DEALS
Casdin Capital 6
RA Capital 2
Rock Springs Capital 2
Woodford Investment 2
Foresite & 6 others 1
18
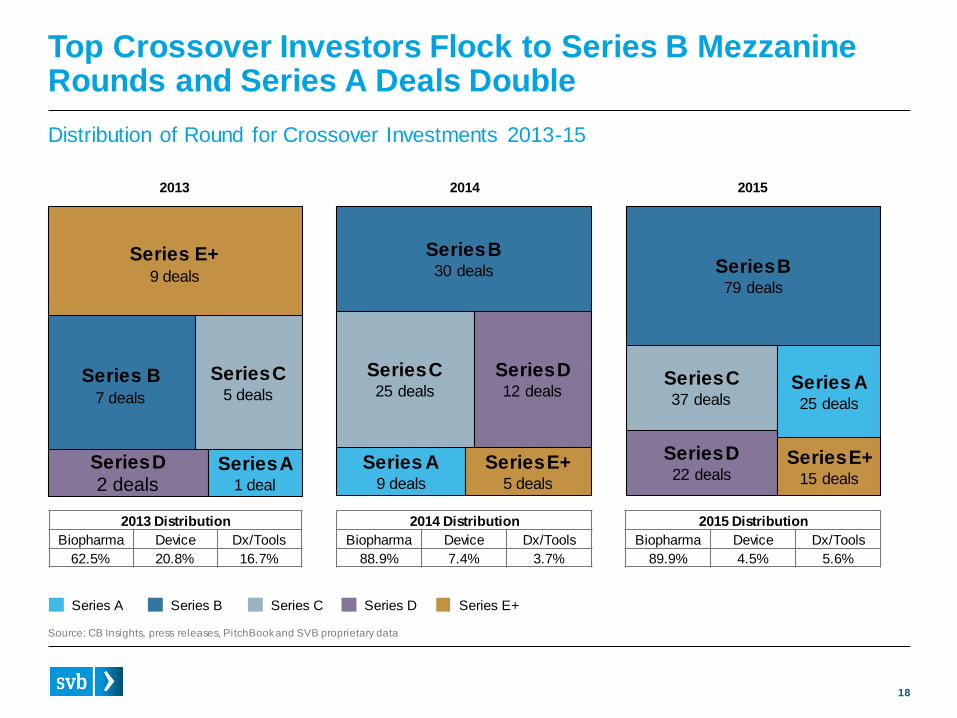
Series B30 deals
Series C25 deals
Series D12 deals
Series A9 deals
Series E+5 deals
Series E+9 deals
Series B7 deals
Series C5 deals
Series D2 deals
Series A1 deal
Top Crossover Investors Flock to Series B Mezzanine Rounds and Series A Deals Double
Distribution of Round for Crossover Investments 2013-15
Source: CB Insights, press releases, PitchBook and SVB proprietary data
2013 Distribution
Biopharma Device Dx/Tools
62.5% 20.8% 16.7%
2014 Distribution
Biopharma Device Dx/Tools
88.9% 7.4% 3.7%
2015 Distribution
Biopharma Device Dx/Tools
89.9% 4.5% 5.6%
2013
Series B79 deals
Series D22 deals
Series C37 deals
Series A25 deals
Series E+15 deals
2014 2015
Series A Series B Series C Series D Series E+
19
Healthcare Venture Exits:M&A Climate Improves as IPOs Slow
20
0.0
2.0
4.0
6.0
8.0
10.0
12.0
14.0
16.0
18.0
20.0
22.0
24.0
2009 2010 2011 2012 2013 2014 2015
To
tal V
alu
e ($ B
illi
on
s)
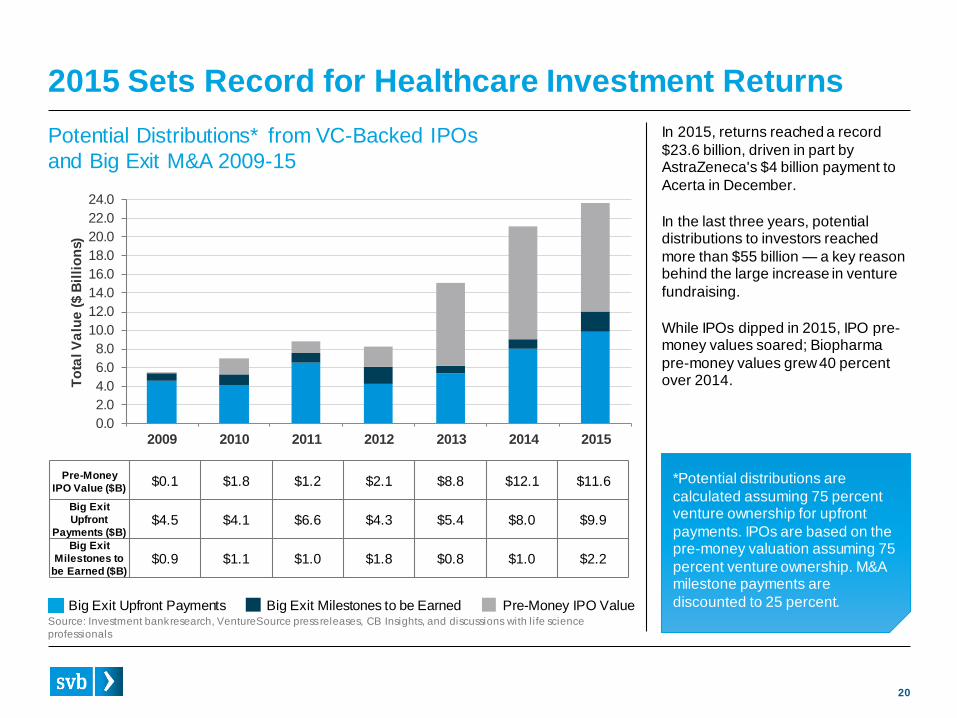
2015 Sets Record for Healthcare Investment Returns
Pre-Money
IPO Value ($B)$0.1 $1.8 $1.2 $2.1 $8.8 $12.1 $11.6
Big Exit
Upfront
Payments ($B)$4.5 $4.1 $6.6 $4.3 $5.4 $8.0 $9.9
Big Exit
Milestones to
be Earned ($B)$0.9 $1.1 $1.0 $1.8 $0.8 $1.0 $2.2
Pre-Money IPO ValueBig Exit Milestones to be EarnedBig Exit Upfront PaymentsSource: Investment bank research, VentureSource press releases, CB Insights, and discussions with life science
professionals
Potential Distributions* from VC-Backed IPOs
and Big Exit M&A 2009-15
In 2015, returns reached a record
$23.6 billion, driven in part by AstraZeneca's $4 billion payment to
Acerta in December.
In the last three years, potential distributions to investors reached
more than $55 billion — a key reason behind the large increase in venture
fundraising.
While IPOs dipped in 2015, IPO pre-money values soared; Biopharma
pre-money values grew 40 percent over 2014.
*Potential distributions are
calculated assuming 75 percent venture ownership for upfront
payments. IPOs are based on the pre-money valuation assuming 75
percent venture ownership. M&A milestone payments are
discounted to 25 percent.
21
Biopharma M&A Grows as IPO Market Slows
Q1 Q2 Q3 Q4 Total
2013
IPO 3 10 11 8 32
M&A 3 3 4 3 13
2014
IPO 24 12 17 13 66
M&A 3 4 6 1 14
2015
IPO 11 13 9 10 43
M&A 7 4 6 4 21
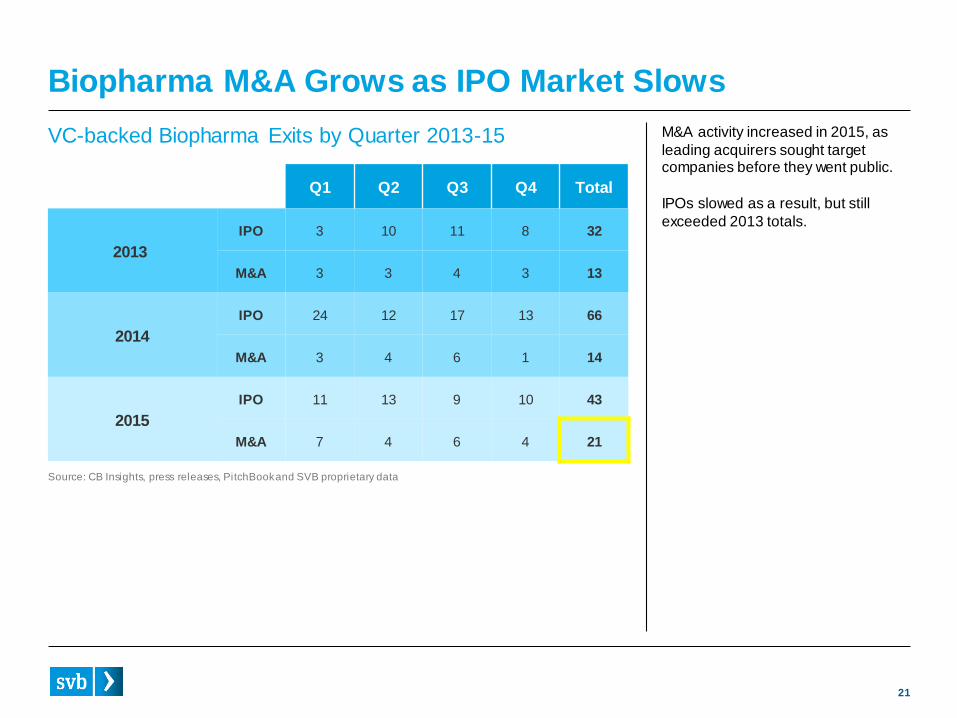
VC-backed Biopharma Exits by Quarter 2013-15 M&A activity increased in 2015, as
leading acquirers sought target companies before they went public.
IPOs slowed as a result, but still
exceeded 2013 totals.
Source: CB Insights, press releases, PitchBook and SVB proprietary data
22
Early-Stage Companies Dominate Biopharma IPOs
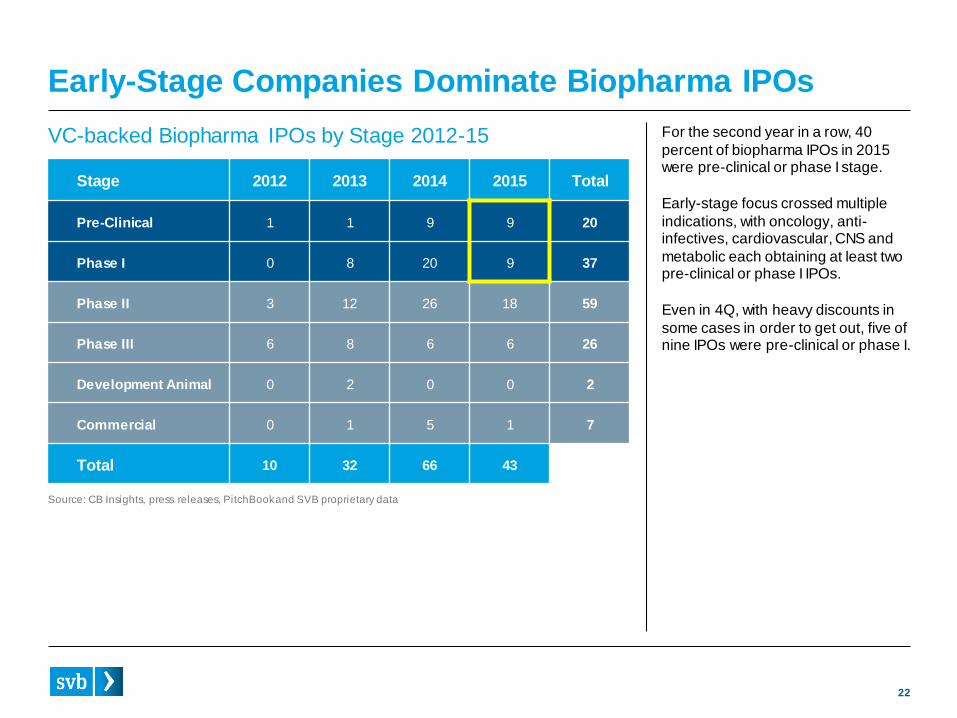
VC-backed Biopharma IPOs by Stage 2012-15 For the second year in a row, 40
percent of biopharma IPOs in 2015 were pre-clinical or phase I stage.
Early-stage focus crossed multiple
indications, with oncology, anti-infectives, cardiovascular, CNS and
metabolic each obtaining at least two pre-clinical or phase I IPOs.
Even in 4Q, with heavy discounts in
some cases in order to get out, five of nine IPOs were pre-clinical or phase I.
Stage 2012 2013 2014 2015 Total
Pre-Clinical 1 1 9 9 20
Phase I 0 8 20 9 37
Phase II 3 12 26 18 59
Phase III 6 8 6 6 26
Development Animal 0 2 0 0 2
Commercial 0 1 5 1 7
Total 10 32 66 43
Source: CB Insights, press releases, PitchBook and SVB proprietary data
23
$61 $72
$62 $50
$70
$106
$63
$202
$174
$141
$95
$166
$266
$220
$-
$50
$100
$150
$200
$250
$300
2012 2013 2014 Q1 2015 Q2 2015 Q3 2015 Q4 2015
Me
dia
n V
alu
e ($ M
illi
on
s)
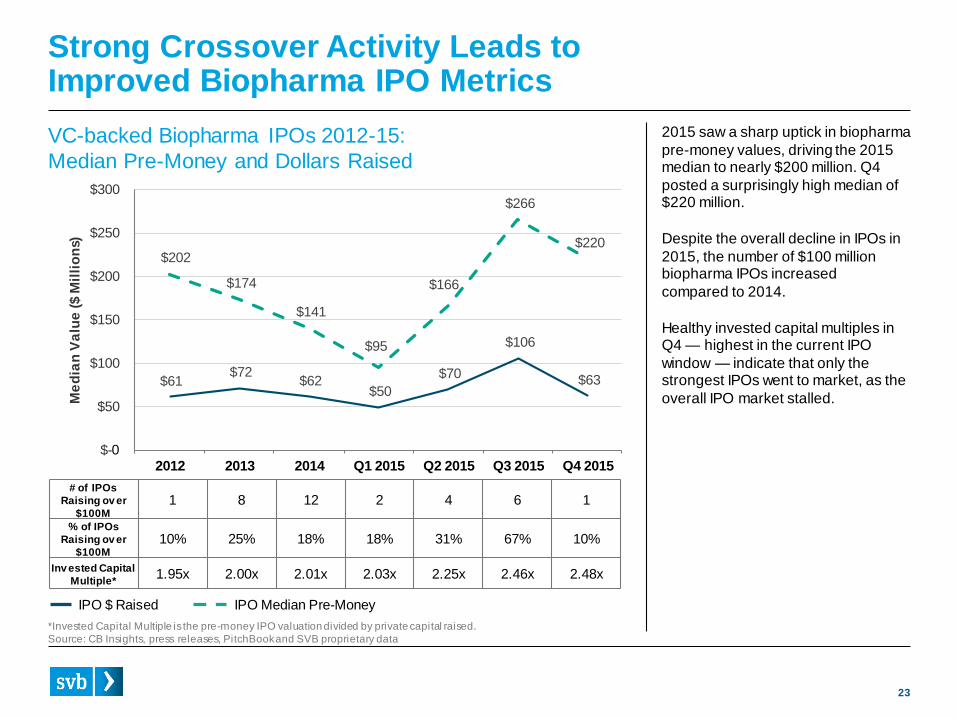
2015 saw a sharp uptick in biopharma
pre-money values, driving the 2015 median to nearly $200 million. Q4
posted a surprisingly high median of $220 million.
Despite the overall decline in IPOs in
2015, the number of $100 million biopharma IPOs increased
compared to 2014.
Healthy invested capital multiples in Q4 — highest in the current IPO
window — indicate that only the strongest IPOs went to market, as the
overall IPO market stalled.
Strong Crossover Activity Leads toImproved Biopharma IPO Metrics
# of IPOs
Raising ov er
$100M1 8 12 2 4 6 1
% of IPOs
Raising ov er
$100M10% 25% 18% 18% 31% 67% 10%
Inv ested Capital
Multiple*1.95x 2.00x 2.01x 2.03x 2.25x 2.46x 2.48x
*Invested Capital Multiple is the pre-money IPO valuation divided by private capital raised.
Source: CB Insights, press releases, PitchBook and SVB proprietary data
VC-backed Biopharma IPOs 2012-15:
Median Pre-Money and Dollars Raised
0
IPO $ Raised IPO Median Pre-Money
24
0
5
10
15
20
25
2005 2006 2007 2008 2009 2010 2011 2012 2013 2014 2015
# o
f B
ig E
xit
s
Biopharma M&A Activity Reaches Highest Level in a Decade
# of Structured Deals # of All-In Deals
Median
Upfront ($M)$230 $410 $346 $200 $200 $148 $208 $125 $200 $225 $200
Median Total
Deal ($M)$230 $435 $346 $285 $403 $325 $407 $375 $440 $413 $580
Median
Years to Exit4.9 4.9 6.5 4.8 5.0 4.1 5.8 5.1 6.2 4.0 4.2
Source: CB Insights, press releases, PitchBook and SVB proprietary data
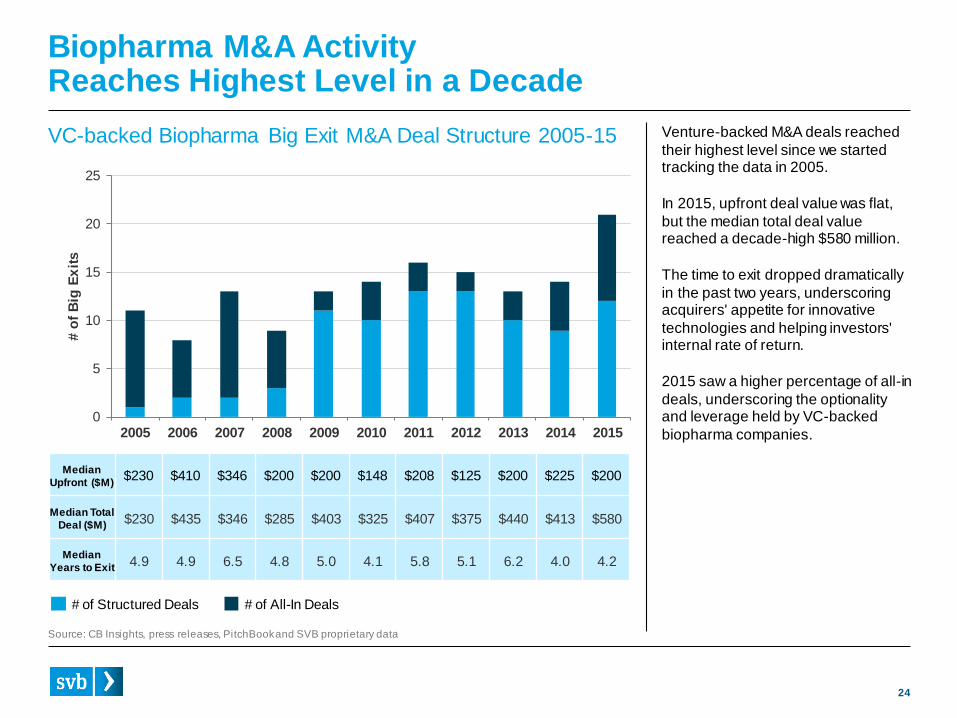
VC-backed Biopharma Big Exit M&A Deal Structure 2005-15 Venture-backed M&A deals reached
their highest level since we started tracking the data in 2005.
In 2015, upfront deal value was flat,
but the median total deal value reached a decade-high $580 million.
The time to exit dropped dramatically
in the past two years, underscoring acquirers' appetite for innovative
technologies and helping investors' internal rate of return.
2015 saw a higher percentage of all-in
deals, underscoring the optionality and leverage held by VC-backed
biopharma companies.
25
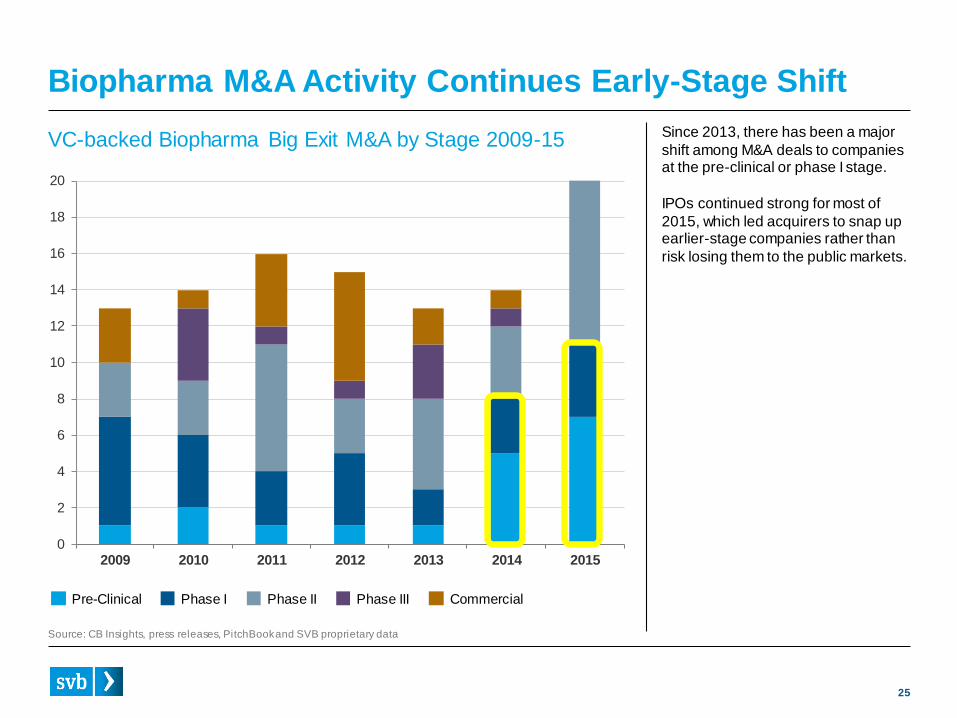
Biopharma M&A Activity Continues Early-Stage Shift
VC-backed Biopharma Big Exit M&A by Stage 2009-15
Pre-Clinical Phase I Phase II Phase III Commercial
Source: CB Insights, press releases, PitchBook and SVB proprietary data
0
2
4
6
8
10
12
14
16
18
20
2009 2010 2011 2012 2013 2014 2015
Since 2013, there has been a major
shift among M&A deals to companies at the pre-clinical or phase I stage.
IPOs continued strong for most of
2015, which led acquirers to snap up earlier-stage companies rather than
risk losing them to the public markets.
26
0
1
2
3
4
5
2013 2014 2015
# o
f B
ig E
xit
s
Oncology
CNS Becomes Biopharma Exit Leader while Early-Stage Interest Grows in Anti-Infectives and Cardio
Source: CB Insights, press releases, PitchBook and SVB proprietary data
0
1
2
3
4
5
2013 2014 2015
CNS
0
1
2
3
4
5
2013 2014 2015
Anti-Infectives
0
1
2
3
4
5
2013 2014 2015
Cardiovascular
0
1
2
3
4
5
2013 2014 2015
Ophthalmology
VC-backed Biopharma IPO and Big Exit M&A by Indication 2013-15
Pre-Clinical Phase I Phase II Phase III Commercial
Represents # of IPOs Represents Big Exits
1
6
4
4
6
1
1
2
2
4
1
3
6
1
1
4
4
2
1
1
2
2
1
1
1
1
1
2
2
1
2
1
2 2
1
1
1
1
# o
f B
ig E
xit
s
27
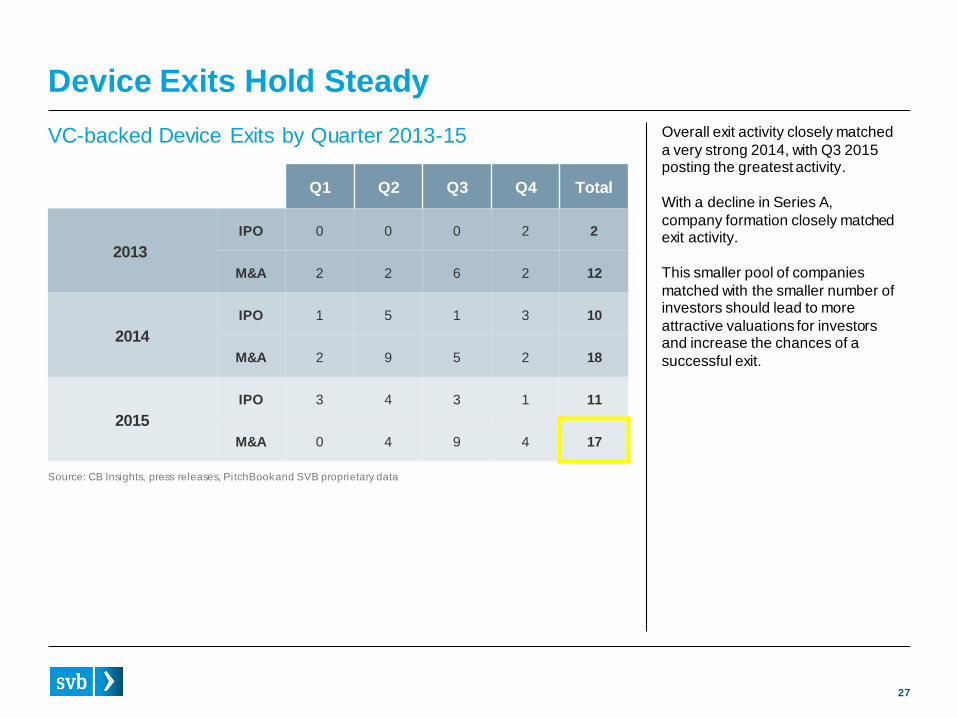
Device Exits Hold Steady
Q1 Q2 Q3 Q4 Total
2013
IPO 0 0 0 2 2
M&A 2 2 6 2 12
2014
IPO 1 5 1 3 10
M&A 2 9 5 2 18
2015
IPO 3 4 3 1 11
M&A 0 4 9 4 17
VC-backed Device Exits by Quarter 2013-15 Overall exit activity closely matched
a very strong 2014, with Q3 2015 posting the greatest activity.
With a decline in Series A,
company formation closely matched exit activity.
This smaller pool of companies
matched with the smaller number of investors should lead to more
attractive valuations for investors and increase the chances of a
successful exit.
Source: CB Insights, press releases, PitchBook and SVB proprietary data
28
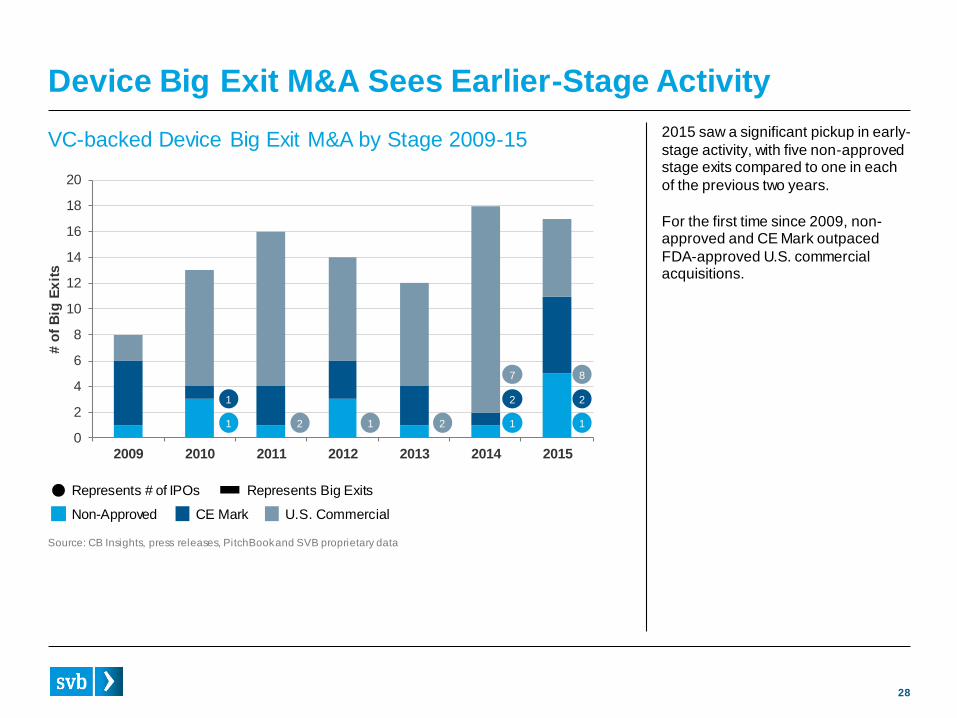
Device Big Exit M&A Sees Earlier-Stage Activity
Non-Approved CE Mark U.S. Commercial
Source: CB Insights, press releases, PitchBook and SVB proprietary data
0
2
4
6
8
10
12
14
16
18
20
2009 2010 2011 2012 2013 2014 2015
# o
f B
ig E
xit
s
Represents # of IPOs Represents Big Exits
1
1
2 1 2 1
2
7
1
2
8
VC-backed Device Big Exit M&A by Stage 2009-15 2015 saw a significant pickup in early-
stage activity, with five non-approved stage exits compared to one in each
of the previous two years.
For the first time since 2009, non-approved and CE Mark outpaced
FDA-approved U.S. commercial acquisitions.
29
0
2
4
6
8
10
12
14
16
18
20
2005 2006 2007 2008 2009 2010 2011 2012 2013 2014 2015
# o
f E
xit
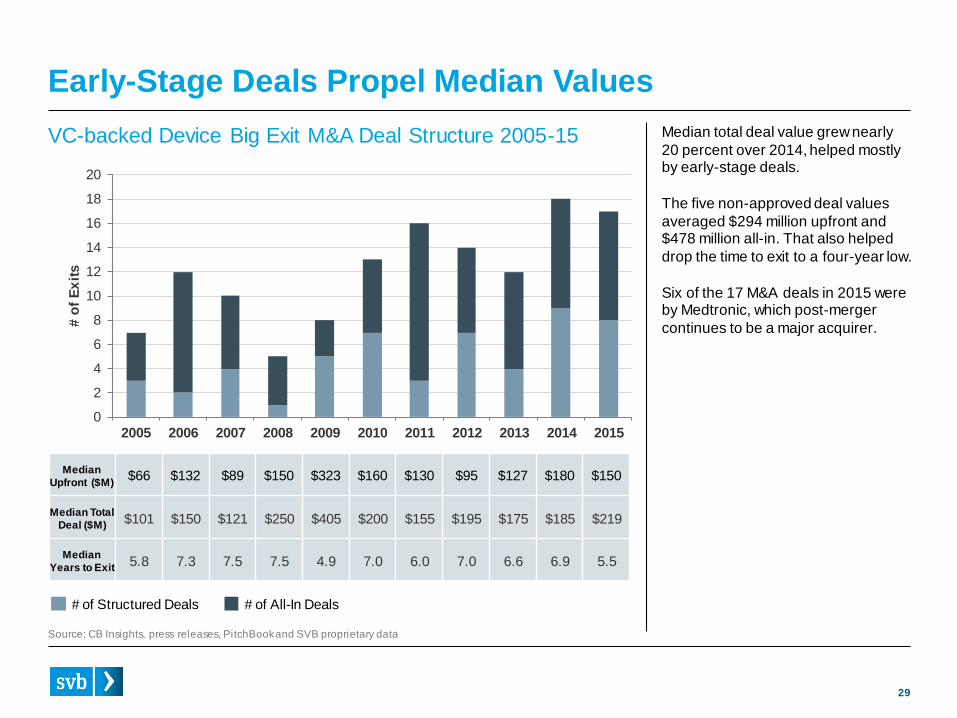
sEarly-Stage Deals Propel Median Values
Source: CB Insights, press releases, PitchBook and SVB proprietary data
VC-backed Device Big Exit M&A Deal Structure 2005-15 Median total deal value grew nearly
20 percent over 2014, helped mostly by early-stage deals.
The five non-approved deal values
averaged $294 million upfront and $478 million all-in. That also helped
drop the time to exit to a four-year low.
Six of the 17 M&A deals in 2015 were by Medtronic, which post-merger
continues to be a major acquirer.
Median
Upfront ($M)$66 $132 $89 $150 $323 $160 $130 $95 $127 $180 $150
Median Total
Deal ($M)$101 $150 $121 $250 $405 $200 $155 $195 $175 $185 $219
Median
Years to Exit5.8 7.3 7.5 7.5 4.9 7.0 6.0 7.0 6.6 6.9 5.5
# of Structured Deals # of All-In Deals
30
0
1
2
3
4
5
6
7
8
9
10
11
# o
f C
om
pa
nie
s
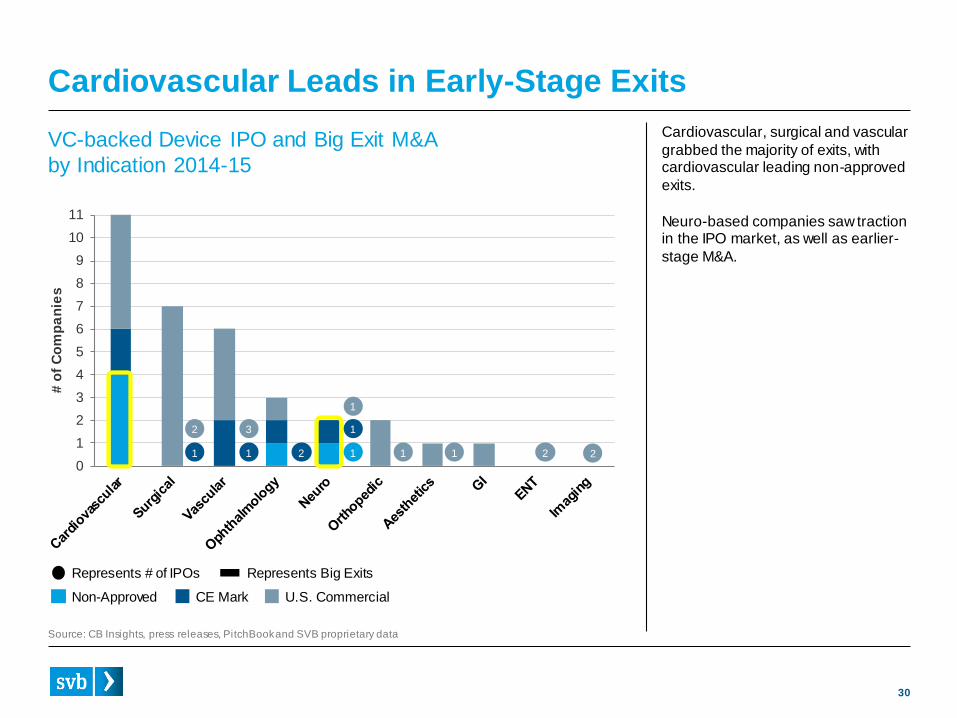
Cardiovascular Leads in Early-Stage Exits
VC-backed Device IPO and Big Exit M&A
by Indication 2014-15
Source: CB Insights, press releases, PitchBook and SVB proprietary data
1
2
Cardiovascular, surgical and vascular
grabbed the majority of exits, with cardiovascular leading non-approved
exits.
Neuro-based companies saw traction in the IPO market, as well as earlier-
stage M&A.
Non-Approved CE Mark U.S. Commercial
Represents # of IPOs Represents Big Exits
1
3
2 1
1
1
1 1 2 2
31
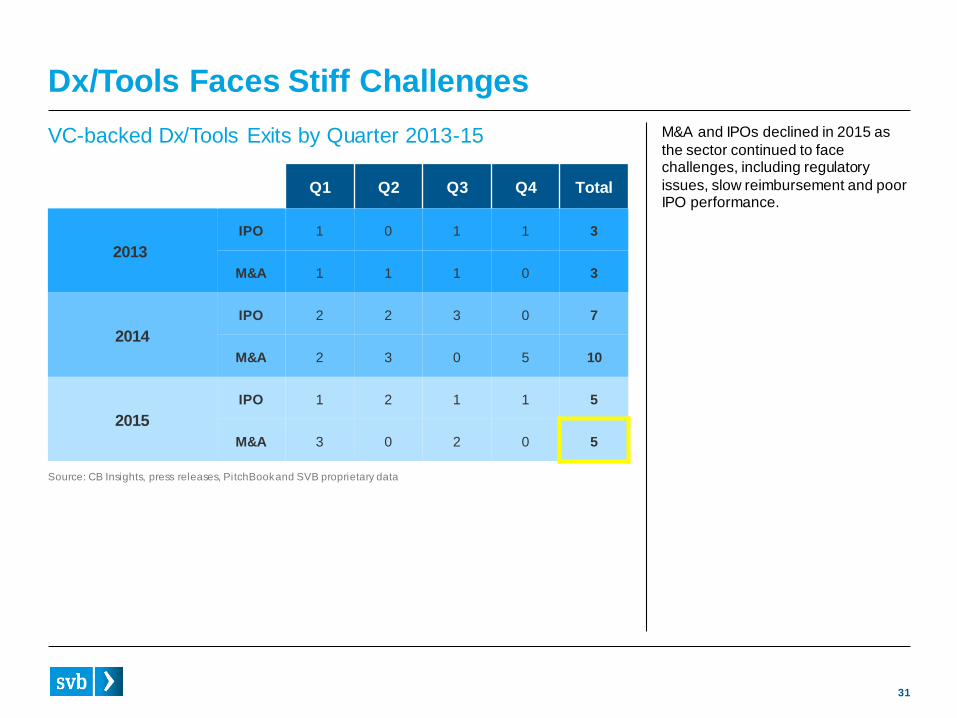
Dx/Tools Faces Stiff Challenges
Q1 Q2 Q3 Q4 Total
2013
IPO 1 0 1 1 3
M&A 1 1 1 0 3
2014
IPO 2 2 3 0 7
M&A 2 3 0 5 10
2015
IPO 1 2 1 1 5
M&A 3 0 2 0 5
VC-backed Dx/Tools Exits by Quarter 2013-15 M&A and IPOs declined in 2015 as
the sector continued to face challenges, including regulatory
issues, slow reimbursement and poor IPO performance.
Source: CB Insights, press releases, PitchBook and SVB proprietary data
32
0
1
2
3
4
5
6
7
8
9
10
2009 2010 2011 2012 2013 2014 2015
# o
f C
om
pa
nie
s
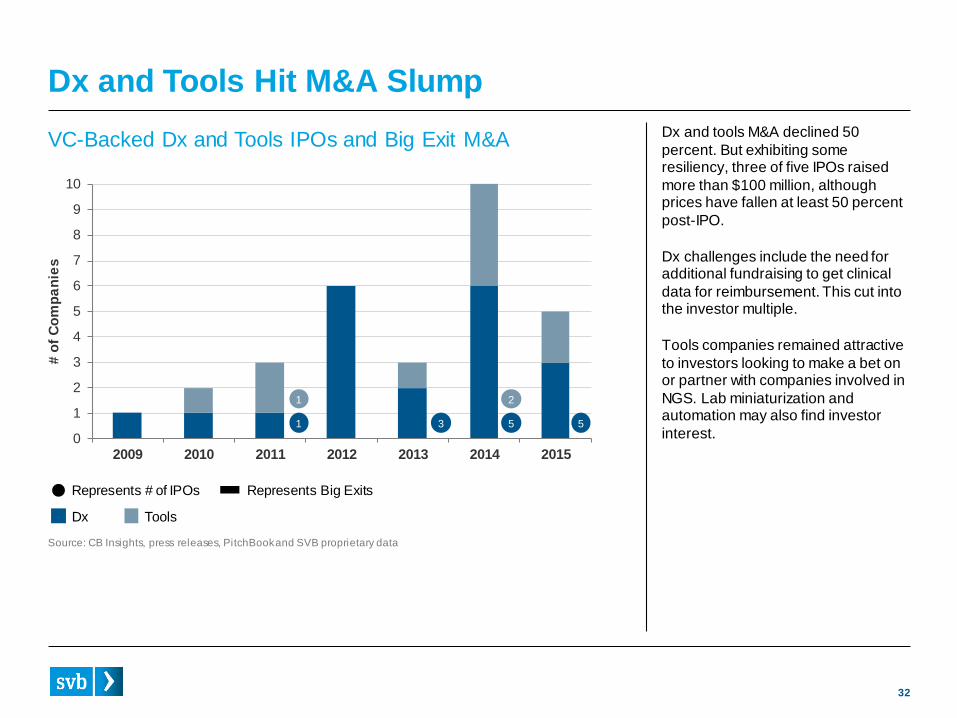
Dx and Tools Hit M&A Slump
Dx Tools
Source: CB Insights, press releases, PitchBook and SVB proprietary data
Represents # of IPOs Represents Big Exits
1
1
3 5
2
5
VC-Backed Dx and Tools IPOs and Big Exit M&A Dx and tools M&A declined 50
percent. But exhibiting some resiliency, three of five IPOs raised
more than $100 million, although prices have fallen at least 50 percent
post-IPO.
Dx challenges include the need for additional fundraising to get clinical
data for reimbursement. This cut into the investor multiple.
Tools companies remained attractive
to investors looking to make a bet on or partner with companies involved in
NGS. Lab miniaturization and automation may also find investor
interest.
33
0
2
4
6
8
10
12
2008 2009 2010 2011 2012 2013 2014 2015
# o
f E
xit
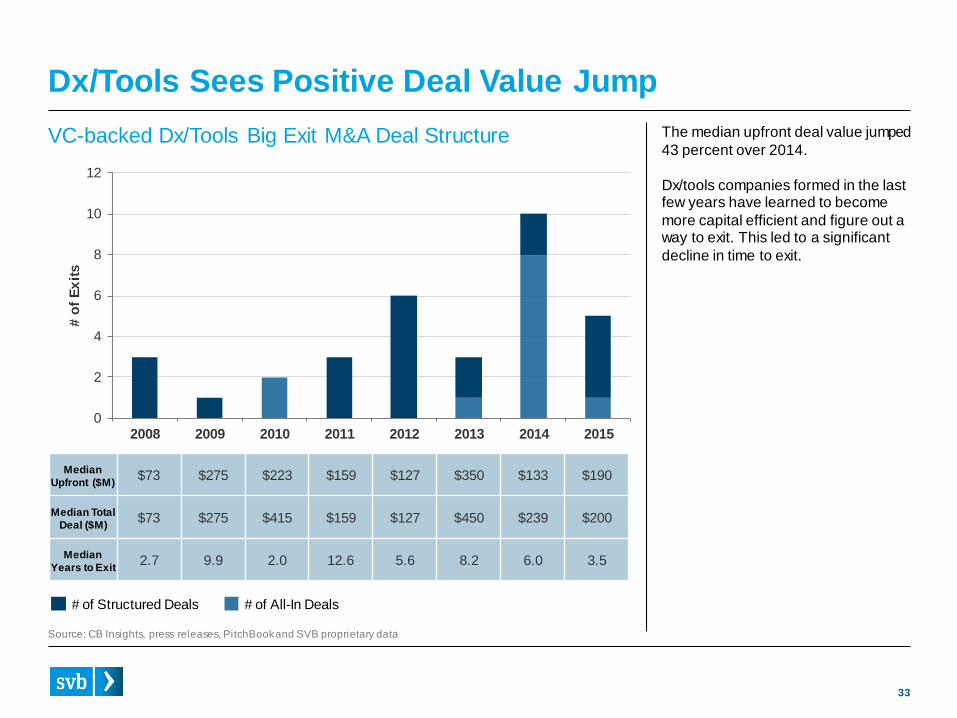
sDx/Tools Sees Positive Deal Value Jump
Source: CB Insights, press releases, PitchBook and SVB proprietary data
VC-backed Dx/Tools Big Exit M&A Deal Structure The median upfront deal value jumped
43 percent over 2014.
Dx/tools companies formed in the last few years have learned to become
more capital efficient and figure out a way to exit. This led to a significant
decline in time to exit.
Median
Upfront ($M)$73 $275 $223 $159 $127 $350 $133 $190
Median Total
Deal ($M)$73 $275 $415 $159 $127 $450 $239 $200
Median
Years to Exit2.7 9.9 2.0 12.6 5.6 8.2 6.0 3.5
# of Structured Deals # of All-In Deals
34
2016 Outlook: 2015 Will Be a Hard Act to Follow
As 2015 closed, we saw some decline in exit activity and investor interest that indicate things are slowing.
Here are our predictions for 2016:
• Investment levels are poised to decline as crossover investors pull back from involvement in large mezzanine
biopharma rounds and traditional investors slow their investment pace.
• Fundraising, too, will fall off as most investors in this “up-cycle” have already raised new funds.
• Series A investments in biopharma will drop slightly, but device may see an uptick to take advantage of the healthy
ratio of Series A companies to exits. Dx/tools likely will stabilize after a challenging 2015.
• The biopharma IPO window should remain open, but there will be fewer IPOs, about seven to eight per quarter in
2016. As a result, M&A will continue on pace as acquirers seek biopharma companies to replenish their pipeline,
and high-fliers from the IPO boom now become acquirers.
• Device IPO activity will decline. But as the pool of private device companies shrinks and acquirers look to innovate,
M&A activity will likely remain stable. We believe this will lead to increased deal values and returns to investors.
We anticipate continued acquisition flurries, similar to Q3 2015, as acquirers are pressured to innovate.
• Dx/tools IPO activity will be difficult given ongoing challenges. M&A should pick up, and will include a mix of
commercial stage companies without enough revenue to be IPO candidates and emerging tool companies that are
able to leverage NGS, lab miniaturization and automation innovations.
35
Glossary
Big Exit
Big Exits are defined as private, venture-backed merger and acquisition transactions in which the upfront payment is $75 million or more for biopharma deals and $50 million or more for device and dx/tools deals.
Initial Public Offering
IPO defined as venture-backed company raising IPO proceeds more than $25 million.
Deal Descriptions:
• Structured DealThis is a pay-for-performance system that pays some of the consideration upfront, but sets milestones in development that must be achieved before the full value of the transaction will be realized.
• All-in DealAll consideration for the deal is paid when deal closes.
• Big Exit Upfront PaymentsThe upfront payment refers to payments in a structured deal that are made at the close of the deal; it does not include milestones.
• Big Exit Milestones to be EarnedThe milestones to be earned refer to payments in a structured deal that are made after the pre-determined goals are met.
• Total Deal ValueThe total deal value of a structured deal includes both the upfront payment and the milestones to be earned.
Regulatory Definitions:
• Non-approvedNon-approved refers to a device company that has no regulatory approval for its product.
• CE MarkCE Mark refers to a device company that has a CE Mark-only product. CE Mark is a European Union designation that is less difficult to obtain than FDA approval, and the approval process typically has a faster timeline.
• U.S. CommercialCommercial refers to a device company that has an FDA-approved product, and typically is in commercial stage.
• Series ASeries A companies are defined as U.S. companies raising their first round greater than $2 million in equity or backed by institutional or corporate venture capital.
36
Paul Schuber
Paul Schuber is an associate with SVB Analytics leading valuation engagements
and specializing in the life sciences. Prior to SVB Analytics, Schuber facilitated
clinical trials on behalf of pharmaceutical sponsors and pre-clinical trials to
advance medical school research, which included writing and implementing IRB
and IACUC protocols. Schuber’s healthcare experience also consists of working
as an emergency medical technician and an electrocardiogram technician. He has
a background in technology as well, working in many roles, including chief
technology officer of an e-commerce company.
Schuber earned a master’s degree in the business of bioscience from Keck
Graduate Institute of Applied Life Sciences while also studying at Claremont
McKenna College at the Robert Day School of Economics and Finance.
Authors
Jonathan Norris
Jonathan Norris is a managing director for SVB's Healthcare practice. Norris
oversees business development efforts for banking and lending opportunities as
well as spearheading strategic relationships with many healthcare venture capital
firms. He also helps SVB Capital through sourcing and advising on limited
partnership allocations.
In addition, he speaks at major investor and industry conferences and authors
widely cited analyses of healthcare venture capital trends. Norris has more than
sixteen years of banking experience working with healthcare companies and
venture capital firms. Norris earned a bachelor's degree in business
administration from the University of California, Riverside and a juris doctorate
from Santa Clara University.
Managing Director,
Silicon Valley [email protected]
Valuations Associate,
37
About Silicon Valley Bank
For more than 30 years, Silicon Valley Bank (SVB) has helped innovative companies and their investors
move bold ideas forward, fast. SVB provides targeted financial services and expertise through its offices in
innovation centers around the world. With commercial, international and private banking services, SVB
helps address the unique needs of innovators. Forbes named SVB one of America’s best banks (2015)
and one of America’s best-managed companies (2014). Learn more at svb.com.
This material, including w ithout limitation to the statistical information herein, is provided for informational purposes only. The material is based in part on information from third-party sources that w e believe to be reliable, but w hich have not been independently verif ied by us and for this reason w e do not represent that the information is accurate or complete. The information should not be view ed as tax, investment, legal or other advice nor is it to be relied on in making an investment or other decision. You should obtain relevant and specif ic professional advice before making any investment decision. Nothing re lating to the material should be
construed as a solicitation, offer or recommendation to acquire or dispose of any investment or to engage in any other transaction.
©2016 SVB Financial Group. All rights reserved. Silicon Valley Bank is a member of FDIC and Federal Reserve System. SVB>, SVB Financial Group, and Silicon Valley Bank are registered trademarks.
Recommended