Trends in Global Manufacturing, Goods
Movement and Consumption, and Their Effect
on the Growth of United States Ports and
Distribution
Curtis D. Spencer and Steve Schellenberg
IMS Worldwide, Inc.
Webster, Texas
Prepared for and Funded by
the NAIOP Research Foundation
September 2010

Help ensure that the NAIOP Research Foundationcontinues to promote industry success.
Thank you for your choosing to download this report. Foundation research and analysis gives industryprofessionals unique insights in to the current business environment and emerging trends that lead to successfuldevelopment and communities.
Traditional sources of revenue cover only a portion of the costs of producing these reports. Additional support,provided by end users of this research through the Foundation’s Sustainer Fund, helps to ensure that the Foundationwill have the funds to continue to proactively address the many research project requests it receives each year.
Donate to the Sustainers Fund today!
Learn how to become involved in the work of the Foundation.
Contact Information
Amount:
Gift LevelsBenefactor Gifts of $2,500 and aboveLeader Gifts of $1,000-$2,499Donor Gifts of $500-$999Sustainer Gifts of $250-$499
Yes, I am interested in ways I cansupport the work of the Foundation.
Please call me to discussPlease send me information about
Becoming a Foundation GovernorUnderwriting a Foundation project, or major initiative
Area of interest __________________________Making an annual giftHow to apply for a research grant
*Make checks payable to NAIOP Research Foundation
NAME COMPANY TITLE
ADDRESS CITY STATE ZIP
PHONE E-MAIL
Contribution Information
CARD HOLDER NAME CREDIT CARD TYPE
NUMBER EXPIRATION DATE
(Contributions to the NAIOP Research Foundationare tax deductible to the extent allowed by law.)
Please see below for contribution information.
Call Bennett Gray at (703) 674-1436 to make a contribution by telephone.
Mail or fax your donation to: NAIOP Research Foundation (Sustainers Fund)2201 Cooperative WaySuite 300Herndon, VA 20171-3034Fax: (703) 674-1486
Trends in Global Manufacturing, Goods Movement and
Consumption, and Their Effect on the Growth of United States
Ports and Distribution
September 2010
Prepared for and Funded by The NAIOP Research Foundation
By Curtis D. Spencer and Steve Schellenberg IMS Worldwide, Inc. Webster, Texas
2 Trends in Global Manufacturing NAIOP Research Foundation September 2010
About NAIOP
NAIOP, the Commercial Real Estate Development Association, is the leading organization for developers, owners and related professionals in office, industrial and mixed-use real estate. NAIOP comprises 15,500 members in North America. NAIOP advances responsible commercial real estate development and advocates for effective public policy. For more information, visit www.naiop.org. The NAIOP Research Foundation was established in 2000 as a 501(c)(3) organization to support the work of individuals and organizations engaged in real estate development, investment and operations. The Foundation’s core purpose is to provide these individuals and organizations with the highest level of research information on how real properties, especially office, industrial and mixed-use properties, impact and benefit communities throughout North America. The initial funding for the Research Foundation was underwritten by NAIOP and its Founding Governors with an endowment fund established to fund future research. For more information, visit www.naioprf.org.
© 2010 NAIOP Research Foundation There are many ways to give to the Foundation and support projects and initiatives that advance the commercial real estate industry. If you would like to do your part in helping this unique and valuable resource, please contact Bennett Gray, senior director, at (703) 904-7100, ext. 168, or [email protected]. Requests for funding should be submitted to [email protected]. For additional information, please contact Sheila Vertino, NAIOP Research Foundation, 2201 Cooperative Way, Herndon, VA, 20171, at (703) 904-7100, ext. 121, or [email protected].
About This Report
This project is intended to provide information and insight to industry practitioners and does not constitute advice or recommendations. NAIOP disclaims any liability for action taken as a result of this project and its findings.
3 Trends in Global Manufacturing NAIOP Research Foundation September 2010
Table of Contents
Executive Summary 4 Prologue: A Manufacturing Story 9 Trends in Manufacturing, Goods Movement and Consumption and Their Effect on Growth 11 Manufacturing Shifts to Emerging Countries 14 Manufacturing: A Perspective on Labor and Costs 18 Manufacturing: Perspective on Policy 23 Offshore Manufacturing Perspective on Transportation 26 Manufacturing and Distribution Impact on U.S. Industrial Real Estate 30 Manufacturing: Perspective on Supply Chain Efficiencies 32 The Impact of Brazil, Russia, India and China (BRIC) 34 Projections and Conclusions: Impact of Mega-Trends 39 Unpredictable Factors Impacting Global Trade 40
4 Trends in Global Manufacturing NAIOP Research Foundation September 2010
Executive Summary The process of manufacturing and distributing goods from the point of origin (manufacturer) to the consumer is known as the supply chain. Changes in the supply chain are occurring as a result of global shifts in emerging countries (Brazil, Russia, India and China), population trends, the expansion of the Panama Canal and consumption patterns. Manufacturing trends can affect the efficiency of goods delivered to the consumer and the amount of warehouse/distribution space that is needed. This research whitepaper provides:
• An overview of manufacturing as an industry and the competitive issues facing domestic
and foreign manufacturing. • The accommodations being made in the logistics industry to support manufacturing. • An array of drivers that impact site selection for warehouses and distribution centers.
(These facilities are destination points for goods in one transportation mode of the logistics cycle and origin points for the “last mile” of delivery in another transportation mode to stores or to consumers.)
• A perspective on the headwinds facing the United States manufacturing industry and the challenges that they will face from global competition.
• Finally, insights into the inter-relationships and demands that exist between
manufacturing, distribution and warehousing and how they may create new leasing, sales,
development and construction opportunities.
Manufacturing Trends
Global shifts in manufacturing have occurred as supply chain tracking systems (electronic seals on containers and GPS in trucks) and logistics networks provide a means to reach remote production sites that offer lower labor costs. Companies are quick to adjust their supply chain systems to locate manufacturing to lower cost labor centers and to take advantage of countries whose policies favor production growth. However, getting parts into a production center and getting finished products out of the same remote production center create two very real challenges for the manufacturer. First, the extra distance makes it more difficult to retain predictability in the supply chain. Second, managing the longer and more complex supply chain adds expense, which must be tracked to make sure it does not erase lower-cost labor benefits. Many manufactured products are well suited for this quest to squeeze incremental labor savings from the production of goods. These products make good candidates for locating in places where there is abundant low cost labor. Specific examples of industry segments in transition are provided later in this report.
5 Trends in Global Manufacturing NAIOP Research Foundation September 2010
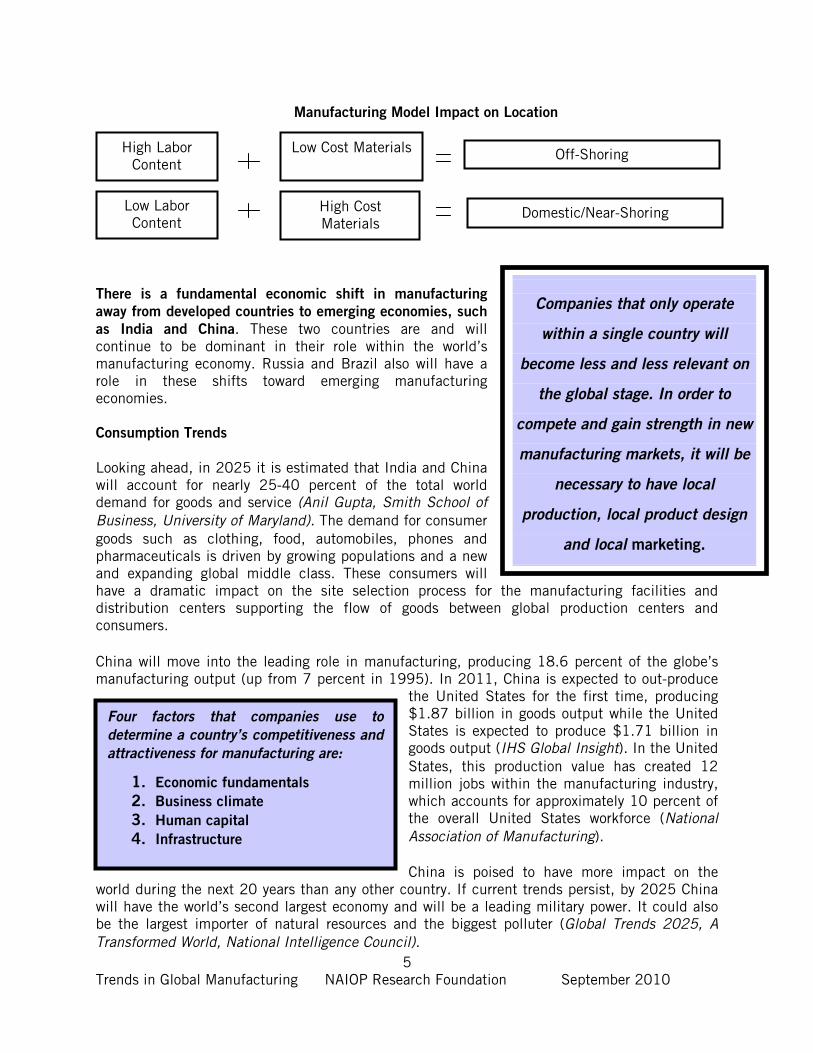
Companies that only operate
within a single country will
become less and less relevant on
the global stage. In order to
compete and gain strength in new
manufacturing markets, it will be
necessary to have local
production, local product design
and local marketing.
Four factors that companies use to
determine a country’s competitiveness and
attractiveness for manufacturing are:
1. Economic fundamentals
2. Business climate
3. Human capital
4. Infrastructure
There is a fundamental economic shift in manufacturing
away from developed countries to emerging economies, such
as India and China. These two countries are and will continue to be dominant in their role within the world’s manufacturing economy. Russia and Brazil also will have a role in these shifts toward emerging manufacturing economies. Consumption Trends
Looking ahead, in 2025 it is estimated that India and China will account for nearly 25-40 percent of the total world demand for goods and service (Anil Gupta, Smith School of Business, University of Maryland). The demand for consumer goods such as clothing, food, automobiles, phones and pharmaceuticals is driven by growing populations and a new and expanding global middle class. These consumers will have a dramatic impact on the site selection process for the manufacturing facilities and distribution centers supporting the flow of goods between global production centers and consumers. China will move into the leading role in manufacturing, producing 18.6 percent of the globe’s manufacturing output (up from 7 percent in 1995). In 2011, China is expected to out-produce
the United States for the first time, producing $1.87 billion in goods output while the United States is expected to produce $1.71 billion in goods output (IHS Global Insight). In the United States, this production value has created 12 million jobs within the manufacturing industry, which accounts for approximately 10 percent of the overall United States workforce (National Association of Manufacturing). China is poised to have more impact on the
world during the next 20 years than any other country. If current trends persist, by 2025 China will have the world’s second largest economy and will be a leading military power. It could also be the largest importer of natural resources and the biggest polluter (Global Trends 2025, A Transformed World, National Intelligence Council).
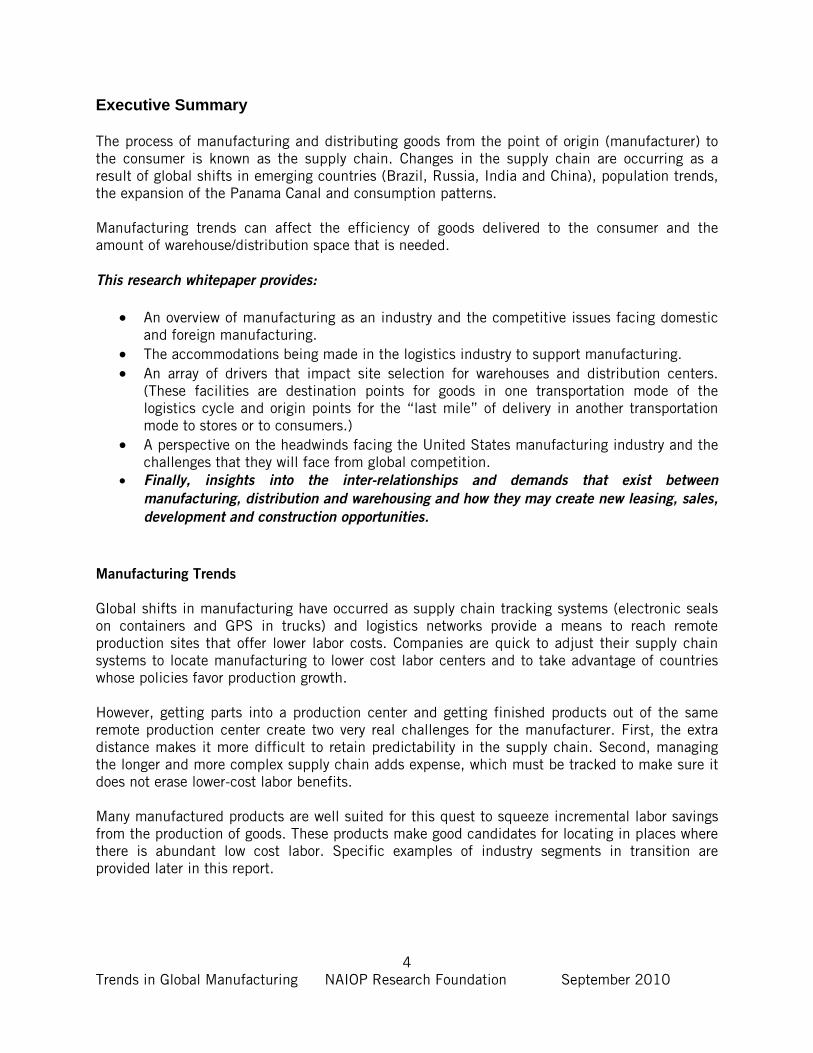
High Labor Content
Low Cost Materials Off-Shoring
Low Labor Content
High Cost Materials
Domestic/Near-Shoring
Manufacturing Model Impact on Location
6 Trends in Global Manufacturing NAIOP Research Foundation September 2010
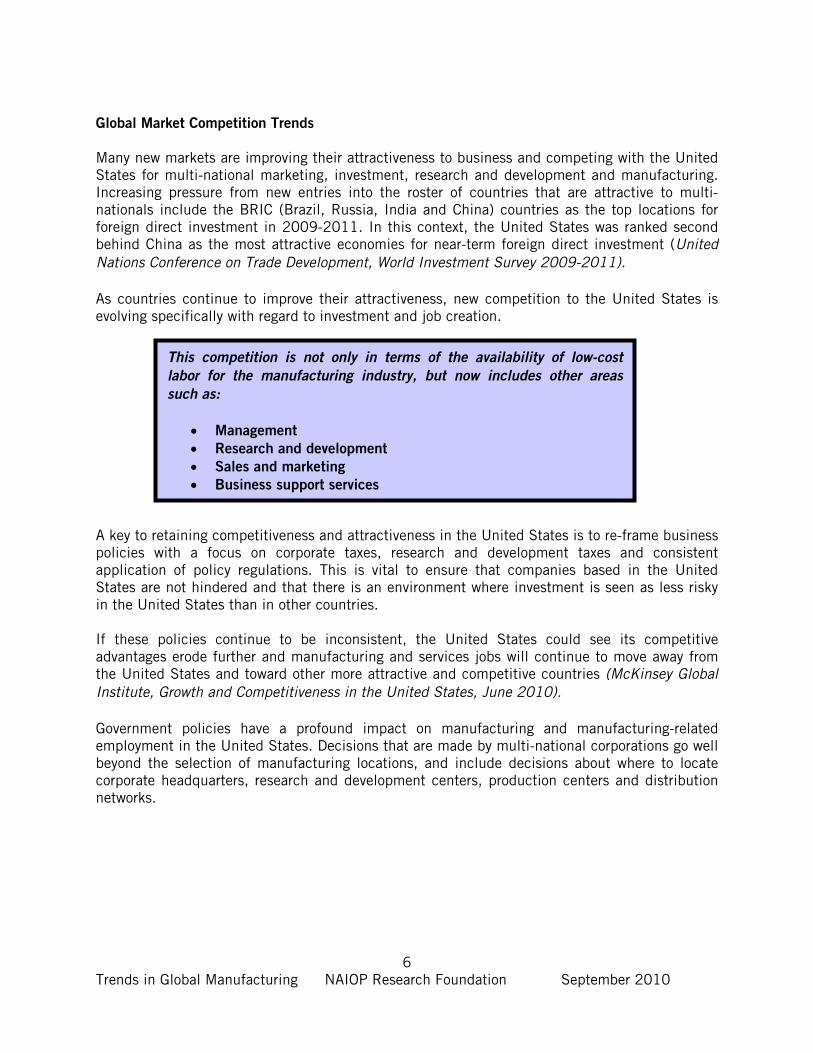
Global Market Competition Trends
Many new markets are improving their attractiveness to business and competing with the United States for multi-national marketing, investment, research and development and manufacturing. Increasing pressure from new entries into the roster of countries that are attractive to multi-nationals include the BRIC (Brazil, Russia, India and China) countries as the top locations for foreign direct investment in 2009-2011. In this context, the United States was ranked second behind China as the most attractive economies for near-term foreign direct investment (United Nations Conference on Trade Development, World Investment Survey 2009-2011). As countries continue to improve their attractiveness, new competition to the United States is evolving specifically with regard to investment and job creation. A key to retaining competitiveness and attractiveness in the United States is to re-frame business policies with a focus on corporate taxes, research and development taxes and consistent application of policy regulations. This is vital to ensure that companies based in the United States are not hindered and that there is an environment where investment is seen as less risky in the United States than in other countries. If these policies continue to be inconsistent, the United States could see its competitive advantages erode further and manufacturing and services jobs will continue to move away from the United States and toward other more attractive and competitive countries (McKinsey Global Institute, Growth and Competitiveness in the United States, June 2010). Government policies have a profound impact on manufacturing and manufacturing-related employment in the United States. Decisions that are made by multi-national corporations go well beyond the selection of manufacturing locations, and include decisions about where to locate corporate headquarters, research and development centers, production centers and distribution networks.
This competition is not only in terms of the availability of low-cost
labor for the manufacturing industry, but now includes other areas
such as:
• Management
• Research and development
• Sales and marketing
• Business support services
7 Trends in Global Manufacturing NAIOP Research Foundation September 2010
Transportation Trends
China’s Ministry of Rail has set a lofty goal of connecting 18 inland ports where manufacturing for local and export consumption as well as distribution of goods within China can occur on a foundation of intermodal rail systems. Currently, seven of the 18 intermodal terminals have been completed, with five additional terminals scheduled for completion by the end of 2010. The final six terminals, of the 18 terminal rail network, are scheduled to be completed by the end of June 2012. This means that China’s rail system will be able to move loaded double-stack containers from their inland manufacturing and distribution facilities to consumers across China or for export. They will be able to interchange imported raw materials or imported goods into distribution centers for consumers across the country. This will allow continuous access to lower-cost labor centers as these rail connections mature, and will keep China’s global manufacturing market share high for many years. (SK Pang, Marketing Manager for CRIntermodal, 7/2010). Panama’s expansion, which is scheduled to be completed in 2014, will provide an opportunity for new lower cost all-water services to be established between Asia and eastern United States ports. Post-expansion, adjustments to rates and service offerings will be made by the ocean and rail carriers as they seek to balance loads and gain market shares for inland ports and major ocean ports. These logistics centers are located in markets where distribution demand is high, rail infrastructure is mature and a large consumer base is accessible. Examples of logistics centers include Los Angeles/Long Beach, New York/New Jersey, Seattle/Tacoma, Chicago and Dallas/Fort Worth.
Conclusion
There are two barometers related to trade that must be watched and understood going forward. The first indicator is global trade in general; the second is related to global trade with the United States. In the context of trade growth, the second indicator will provide insight into when ports and inland ports will begin to reach capacity and when new capacity will be required. Currently, the United States is operating well below the current combined capacity of the ports and there is plenty of capacity available which will make competition a reality between ports on either or both coasts. Much of the cargo that will shift has already shifted from western ports to eastern ports.
The new ships that carry larger loads of cargo will have a more dramatic impact on the eastern
ports. Those with only regional capacity will be segregated from those with the necessary
infrastructure to support the larger ships and move goods efficiently and competitively both on a
regional and national platform.
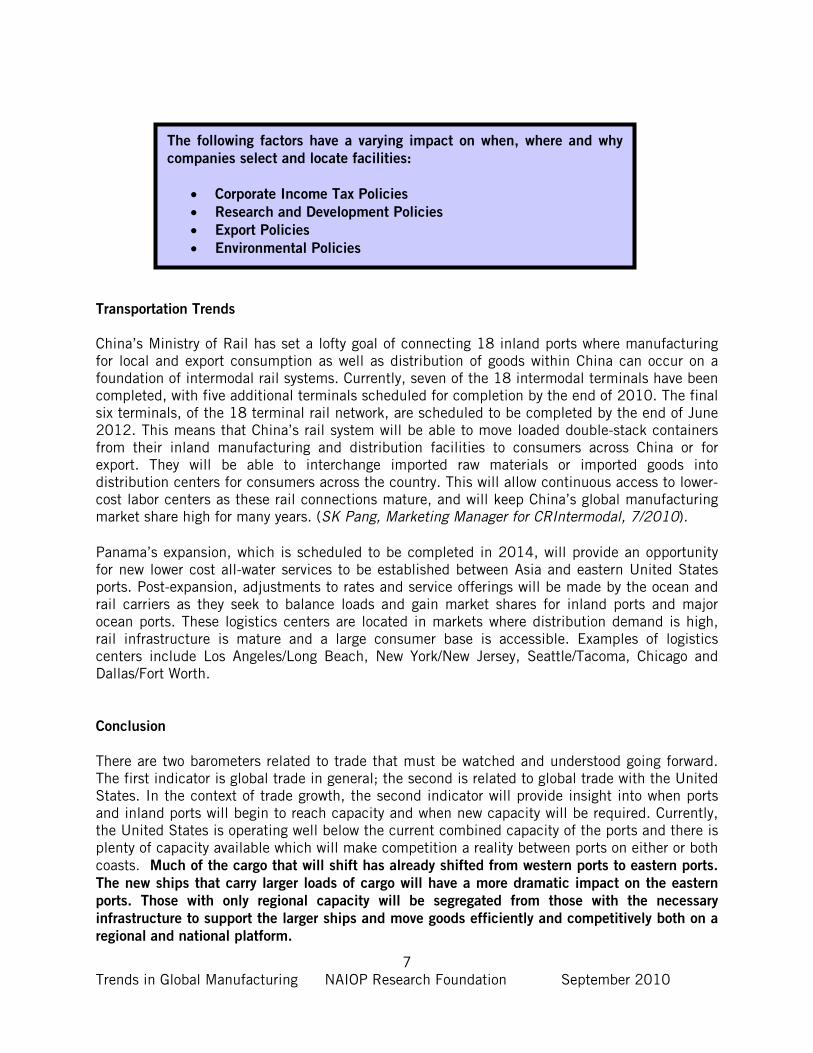
The following factors have a varying impact on when, where and why
companies select and locate facilities:
• Corporate Income Tax Policies
• Research and Development Policies
• Export Policies
• Environmental Policies
8 Trends in Global Manufacturing NAIOP Research Foundation September 2010
Containerized trade is the engine that drives warehouse and distribution space. Goods flow from origins to destination buildings in ocean containers is measured in 20 or 40-foot equivalent units (TEUs). These containers are transferred from a ship to the terminal, and then loaded on a train or truck for local, regional or inland delivery. Some containers are trans-loaded locally into domestic trailers. This practice allows the ocean carrier who owns the container to ‘re-cycle” the container back to the origin or to another user for an export load. Los Angeles and Long Beach are examples of ports where significant volumes of cargo transition from ship to warehouses. Some goods are stored for local distribution and other goods move inland in other domestic containers via truck or rail. Therefore, growth in containerized traffic is an indicator for creating
new industrial demand.
9 Trends in Global Manufacturing NAIOP Research Foundation September 2010
Prologue: A Manufacturing Story Global manufacturing centers produce materials for global consumers. The connection between these manufacturing centers and consumers are called supply chains. Supply chain systems operate like a global conveyor belt moving goods between points where goods are produced and global or local points where they are consumed. Simple to describe but complex in their operations: supply chains must provide visibility over products in motion anywhere on the conveyor belt. They must also be operated with flexibility so that changes in demand can be accommodated at any time between global origins and global consumers. Case in point: An appliance plant site, once located in the Midwest, moved to Mexico 20 years ago. The reason for this move was to take advantage of Mexico’s lower wages under their Maquiladora program. The supply chain had to make two adjustments in order to keep product moving to consumers:
1) Raw materials that originally moved to the now-closed Midwest facility had to be moved the longer distance to Mexico and had to cross a border.
2) After the manufacturing process, finished products moved back to a Midwest location
where goods were distributed for stores or consumers. Ten years ago, the appliance manufacturer started a new plant in Coastal China. The reason for this move was to take advantage of China’s lower wages and abundant labor. Again, the supply chain was adjusted to accommodate this relocation and to support manufacturing in China. Until local sources could be identified for the appliance production, raw materials were shipped from the Midwest to the manufacturing center in China. After production, finished goods were shipped from the manufacturing center to the Midwest to a location where goods were distributed for stores or consumers. A much longer and more complex supply chain system had to be created in order to retain the savings gained by moving to a lower-cost labor center. Replacing the Midwest distribution center with a West Coast distribution center location provided a new layer of savings by allowing the appliance manufacturer to prepare goods for stores and consumers in closer proximity to the port of arrival. Seven years ago, the appliance manufacturer realized that moving the production center to China also provided a new market for appliance sales to an emerging Asian consumer. This added another layer of complexity to the delivery process as China and most of Asia at that time did not have a strong goods movement infrastructure. Logistics costs were high for this but the incremental new volume of production for Asia customers made this move even more profitable. Over the course of the past years, moving goods inside China has become easier as China’s logistics infrastructure has seen significant improvements. They have added new rail centers to support manufacturing and distribution of goods deep in their highly populated inland provinces (where even lower cost labor is abundant).
10 Trends in Global Manufacturing NAIOP Research Foundation September 2010
Today, just miles from where that appliance production center was closed in the Midwest, a large new industrial complex is being constructed. This rail complex is being created as a hub to support a new location where imported goods from across the globe can be processed from the trains loaded at gateway ports to trucks for delivery to distribution centers in the region. Employees displaced by the original move of the manufacturing center now have an opportunity to re-engage in the movement of products in distribution centers constructed to deliver goods between global origins and global (and local) consumer destinations. The rail center being constructed today will support the development of up to 20 million square feet of new distribution and warehouse space, creating a new destination for imported goods and dynamically changing the local and regional economy. (Note: this case study is based on real experience. The author was involved in the original relocation of the appliance manufacturing center to Mexico and is now involved in the planning for the industrial outcome of the rail intermodal hub in the same Midwest location.)
11 Trends in Global Manufacturing NAIOP Research Foundation September 2010
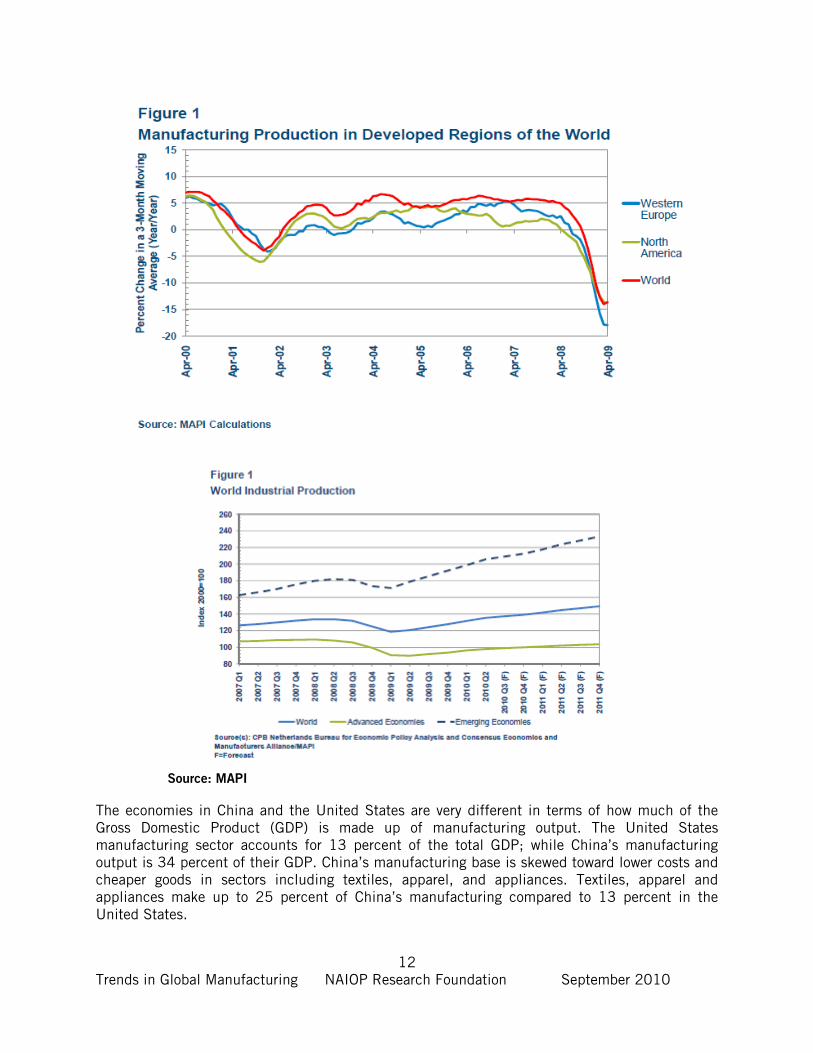
Trends in Manufacturing, Goods Movement and Consumption and Their Effect on Growth Historically, manufacturing jobs have been the mainstay of economic creation. This is consistent with the fact that the United States is the world’s largest manufacturing economy. The United States currently produces 19.9 percent (2009 Financial Times/Marsh) of the total world’s manufacturing products (down from 28 percent in 1995). China is poised to move into the leading role in manufacturing, producing 18.6 percent of the globe’s manufacturing output (up from 7 percent in 1995). In 2011, China is expected to out-produce the United States for the first time, producing $1.87 billion in goods output while the United States is expected to produce $1.71 billion in goods output (IHS Global Insight). In the United States, this production value has created 12 million jobs within the manufacturing industry, which accounts for approximately 10 percent of the overall United States workforce (National Association of Manufacturing). Significant shifts are occurring in global manufacturing with a seven percent decrease reported during the fourth quarter of 2008, another 14 percent decline in the first quarter of 2009 and an estimated overall manufacturing decline of 10 percent in 2009 compared with 2008 (Meckstroth, The Great Global Manufacturing Recession, June 2009.) Figure 1, Manufacturing Production in Developed Regions of the World, presents a clear picture of the overall impact of the global slowdown. Industrial activity in countries and regions around the world are linked through foreign trade by complex supply chains. Large declines in a country’s export volumes means that the country will also experience large declines in manufacturing activity which is not related to domestic fundamentals. These declines in industrial activity translate into job loss and excess capacity and less consuming and investing. All major regions of the world’s production centers sustained declines in production in 2009:
• Western Europe declined 14 percent; • North America fell 12 percent; and • Asia’s manufacturing slipped by 11 percent. Inside Asia, while China’s production did
increase by 9 percent, Japan’s output declined 34 percent causing the region to join the world in a deficit.
• Latin America’s production decreased by 8 percent.
12 Trends in Global Manufacturing NAIOP Research Foundation September 2010
Source: MAPI
The economies in China and the United States are very different in terms of how much of the Gross Domestic Product (GDP) is made up of manufacturing output. The United States manufacturing sector accounts for 13 percent of the total GDP; while China’s manufacturing output is 34 percent of their GDP. China’s manufacturing base is skewed toward lower costs and cheaper goods in sectors including textiles, apparel, and appliances. Textiles, apparel and appliances make up to 25 percent of China’s manufacturing compared to 13 percent in the United States.
13 Trends in Global Manufacturing NAIOP Research Foundation September 2010
The United States manufacturing base is dominated by goods including:
• aircraft • special industrial machinery • medical and scientific equipment • media-software industries
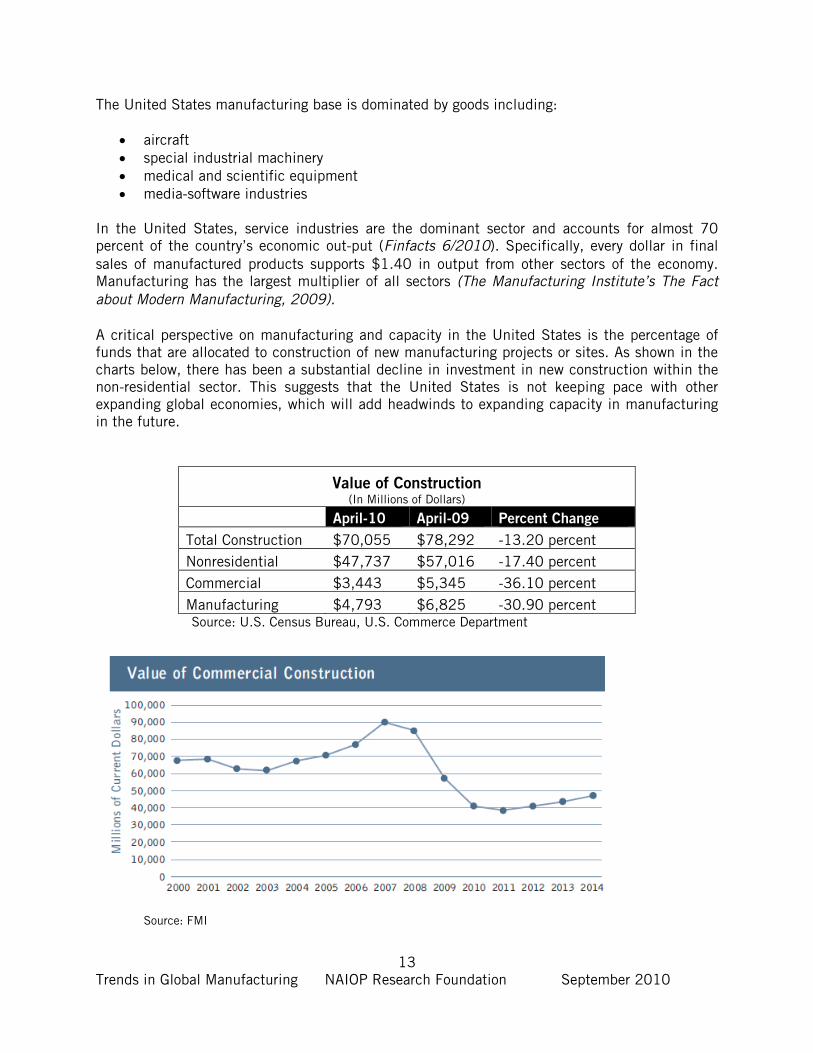
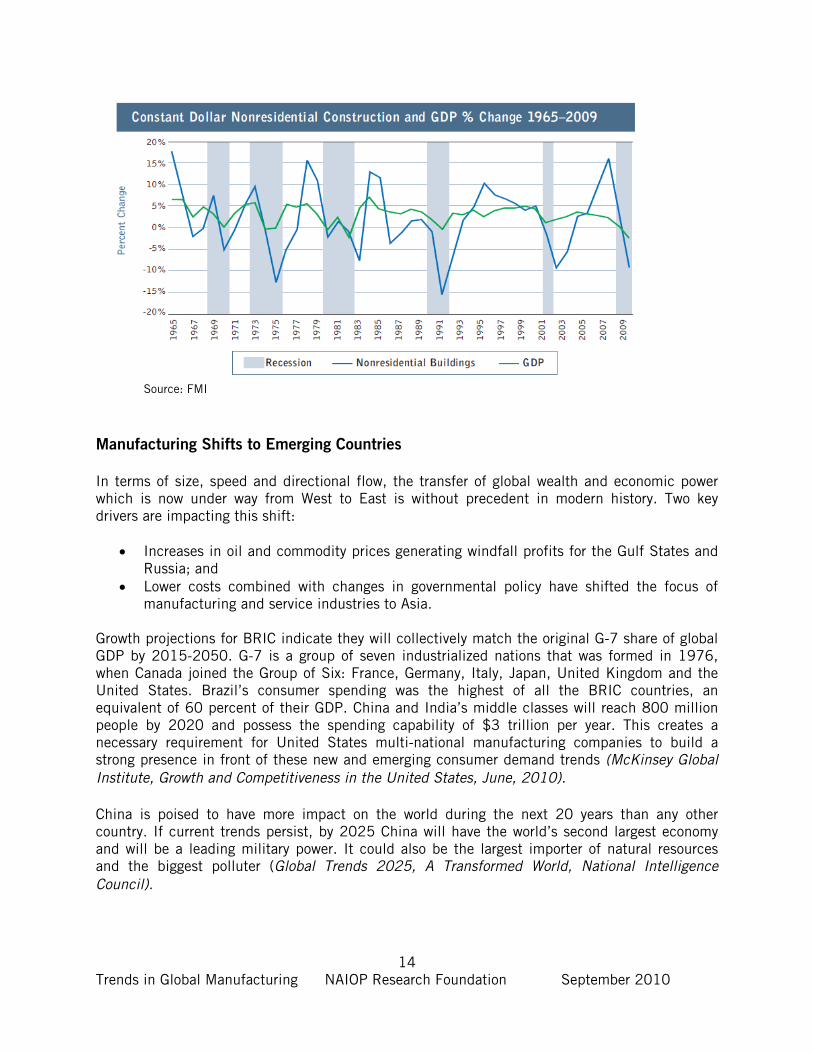
In the United States, service industries are the dominant sector and accounts for almost 70 percent of the country’s economic out-put (Finfacts 6/2010). Specifically, every dollar in final sales of manufactured products supports $1.40 in output from other sectors of the economy. Manufacturing has the largest multiplier of all sectors (The Manufacturing Institute’s The Fact about Modern Manufacturing, 2009). A critical perspective on manufacturing and capacity in the United States is the percentage of funds that are allocated to construction of new manufacturing projects or sites. As shown in the charts below, there has been a substantial decline in investment in new construction within the non-residential sector. This suggests that the United States is not keeping pace with other expanding global economies, which will add headwinds to expanding capacity in manufacturing in the future.
Value of Construction (In Millions of Dollars)
April-10 April-09 Percent Change
Total Construction $70,055 $78,292 -13.20 percent Nonresidential $47,737 $57,016 -17.40 percent
Commercial $3,443 $5,345 -36.10 percent
Manufacturing $4,793 $6,825 -30.90 percent Source: U.S. Census Bureau, U.S. Commerce Department
Source: FMI
14 Trends in Global Manufacturing NAIOP Research Foundation September 2010
Source: FMI
Manufacturing Shifts to Emerging Countries
In terms of size, speed and directional flow, the transfer of global wealth and economic power which is now under way from West to East is without precedent in modern history. Two key drivers are impacting this shift:
• Increases in oil and commodity prices generating windfall profits for the Gulf States and Russia; and
• Lower costs combined with changes in governmental policy have shifted the focus of manufacturing and service industries to Asia.
Growth projections for BRIC indicate they will collectively match the original G-7 share of global GDP by 2015-2050. G-7 is a group of seven industrialized nations that was formed in 1976, when Canada joined the Group of Six: France, Germany, Italy, Japan, United Kingdom and the United States. Brazil’s consumer spending was the highest of all the BRIC countries, an equivalent of 60 percent of their GDP. China and India’s middle classes will reach 800 million people by 2020 and possess the spending capability of $3 trillion per year. This creates a necessary requirement for United States multi-national manufacturing companies to build a strong presence in front of these new and emerging consumer demand trends (McKinsey Global Institute, Growth and Competitiveness in the United States, June, 2010). China is poised to have more impact on the world during the next 20 years than any other country. If current trends persist, by 2025 China will have the world’s second largest economy and will be a leading military power. It could also be the largest importer of natural resources and the biggest polluter (Global Trends 2025, A Transformed World, National Intelligence Council).
15 Trends in Global Manufacturing NAIOP Research Foundation September 2010
Growth provides a context for countries to compete for corporate investment. By way of example the chart below reflects the rate of GDP Annual Growth and the Consumer Spending Growth rates.
Country
Consumer Spending
Rate of Annual
Growth 1995-2008
Rate of GDP Annual
Growth 1995-2008
United States 3.3 percent 2.9 percent China 7.2 percent 9.6 percent India 5.1 percent 6.9 percent Russia 6.7 percent 4.7 percent
Industry Snapshots The following industry “snapshots” demonstrate the complexity of multi-national manufacturing, global trading and managing costs. These activities require a comprehensive supply chain strategy for moving goods on the conveyor belt between sources and consumers. Supply chains are increasingly longer and more complex, requiring more robust tracking systems to support the agility to change pace, routes and product to meet global demands. It is these complexities that create inefficiencies which must be overcome by the multi-national in order to meet the changing and evolving demands of multi-national buyers and consumers. The risk is to reduce costs in labor by sourcing in lower-cost markets but wind up erasing these benefits by poor execution in the supply chain. China Leads Auto Production and Sales
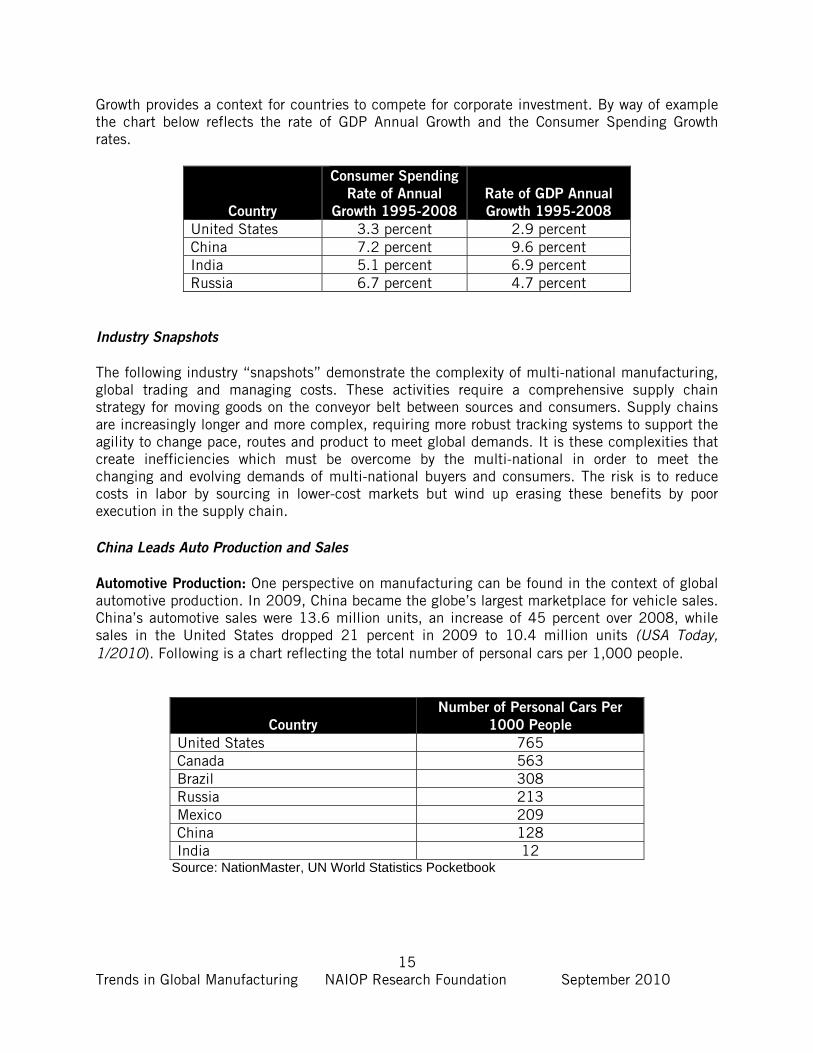
Automotive Production: One perspective on manufacturing can be found in the context of global automotive production. In 2009, China became the globe’s largest marketplace for vehicle sales. China’s automotive sales were 13.6 million units, an increase of 45 percent over 2008, while sales in the United States dropped 21 percent in 2009 to 10.4 million units (USA Today, 1/2010). Following is a chart reflecting the total number of personal cars per 1,000 people.
Country
Number of Personal Cars Per
1000 People
United States 765 Canada 563 Brazil 308 Russia 213 Mexico 209 China 128 India 12
Source: NationMaster, UN World Statistics Pocketbook
16 Trends in Global Manufacturing NAIOP Research Foundation September 2010
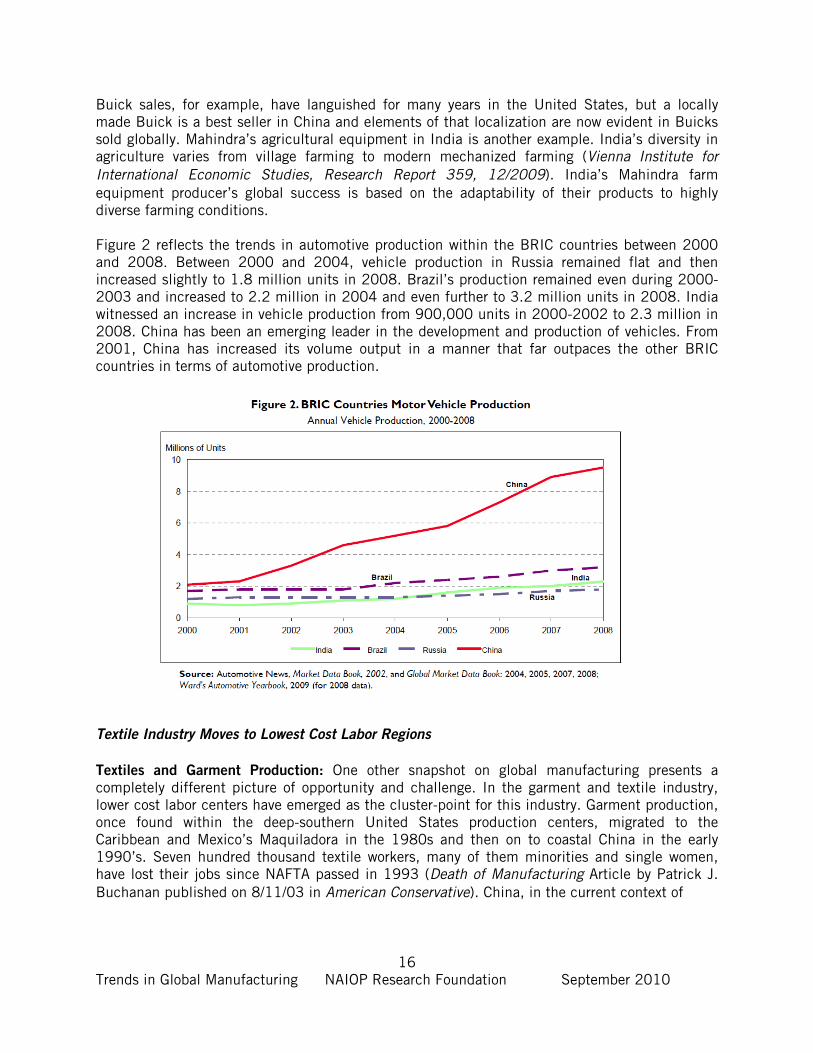
Buick sales, for example, have languished for many years in the United States, but a locally made Buick is a best seller in China and elements of that localization are now evident in Buicks sold globally. Mahindra’s agricultural equipment in India is another example. India’s diversity in agriculture varies from village farming to modern mechanized farming (Vienna Institute for International Economic Studies, Research Report 359, 12/2009). India’s Mahindra farm equipment producer’s global success is based on the adaptability of their products to highly diverse farming conditions. Figure 2 reflects the trends in automotive production within the BRIC countries between 2000 and 2008. Between 2000 and 2004, vehicle production in Russia remained flat and then increased slightly to 1.8 million units in 2008. Brazil’s production remained even during 2000-2003 and increased to 2.2 million in 2004 and even further to 3.2 million units in 2008. India witnessed an increase in vehicle production from 900,000 units in 2000-2002 to 2.3 million in 2008. China has been an emerging leader in the development and production of vehicles. From 2001, China has increased its volume output in a manner that far outpaces the other BRIC countries in terms of automotive production.
Textile Industry Moves to Lowest Cost Labor Regions
Textiles and Garment Production: One other snapshot on global manufacturing presents a completely different picture of opportunity and challenge. In the garment and textile industry, lower cost labor centers have emerged as the cluster-point for this industry. Garment production, once found within the deep-southern United States production centers, migrated to the Caribbean and Mexico’s Maquiladora in the 1980s and then on to coastal China in the early 1990’s. Seven hundred thousand textile workers, many of them minorities and single women, have lost their jobs since NAFTA passed in 1993 (Death of Manufacturing Article by Patrick J. Buchanan published on 8/11/03 in American Conservative). China, in the current context of
17 Trends in Global Manufacturing NAIOP Research Foundation September 2010
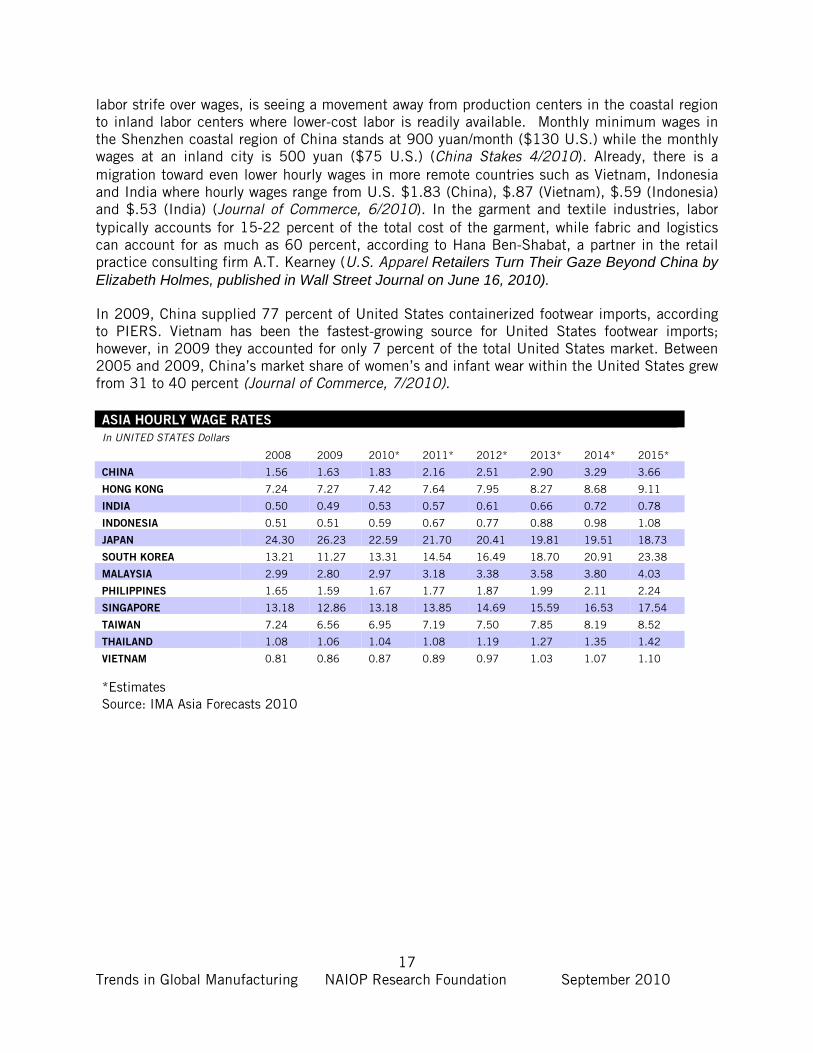
labor strife over wages, is seeing a movement away from production centers in the coastal region to inland labor centers where lower-cost labor is readily available. Monthly minimum wages in the Shenzhen coastal region of China stands at 900 yuan/month ($130 U.S.) while the monthly wages at an inland city is 500 yuan ($75 U.S.) (China Stakes 4/2010). Already, there is a migration toward even lower hourly wages in more remote countries such as Vietnam, Indonesia and India where hourly wages range from U.S. $1.83 (China), $.87 (Vietnam), $.59 (Indonesia) and $.53 (India) (Journal of Commerce, 6/2010). In the garment and textile industries, labor typically accounts for 15-22 percent of the total cost of the garment, while fabric and logistics can account for as much as 60 percent, according to Hana Ben-Shabat, a partner in the retail practice consulting firm A.T. Kearney (U.S. Apparel Retailers Turn Their Gaze Beyond China by Elizabeth Holmes, published in Wall Street Journal on June 16, 2010).
In 2009, China supplied 77 percent of United States containerized footwear imports, according to PIERS. Vietnam has been the fastest-growing source for United States footwear imports; however, in 2009 they accounted for only 7 percent of the total United States market. Between 2005 and 2009, China’s market share of women’s and infant wear within the United States grew from 31 to 40 percent (Journal of Commerce, 7/2010). ASIA HOURLY WAGE RATES
In UNITED STATES Dollars
2008 2009 2010* 2011* 2012* 2013* 2014* 2015*
CHINA 1.56 1.63 1.83 2.16 2.51 2.90 3.29 3.66
HONG KONG 7.24 7.27 7.42 7.64 7.95 8.27 8.68 9.11
INDIA 0.50 0.49 0.53 0.57 0.61 0.66 0.72 0.78
INDONESIA 0.51 0.51 0.59 0.67 0.77 0.88 0.98 1.08
JAPAN 24.30 26.23 22.59 21.70 20.41 19.81 19.51 18.73
SOUTH KOREA 13.21 11.27 13.31 14.54 16.49 18.70 20.91 23.38
MALAYSIA 2.99 2.80 2.97 3.18 3.38 3.58 3.80 4.03
PHILIPPINES 1.65 1.59 1.67 1.77 1.87 1.99 2.11 2.24
SINGAPORE 13.18 12.86 13.18 13.85 14.69 15.59 16.53 17.54
TAIWAN 7.24 6.56 6.95 7.19 7.50 7.85 8.19 8.52
THAILAND 1.08 1.06 1.04 1.08 1.19 1.27 1.35 1.42
VIETNAM 0.81 0.86 0.87 0.89 0.97 1.03 1.07 1.10
*Estimates Source: IMA Asia Forecasts 2010
18 Trends in Global Manufacturing NAIOP Research Foundation September 2010
Manufacturing: A Perspective on Labor and Costs
Manufacturing and production have two distinct sectors. The manufacturing sector is heavier or higher on material cost content and lighter/lower on labor cost content. The production sector is higher or heavier on labor cost content and lighter/lower on material cost content. Products with high labor content have historically sought global production centers where they can access the lowest possible labor costs in wages and benefits. These producers must manage their global supply chains in order to retain the value of the lowest labor. Manufacturing in the United States has been subjected to competition from countries with lower wages, and viable or developing platforms for business operations with an infrastructure to support production of labor intensive products. With adequate export systems, many countries have taken lower value-added jobs from the United States and used these jobs to begin their own evolution toward economic stability. But more recently, the United States has seen a similar outflow of jobs to other countries in the business support and services industry. As with the erosion of manufacturing, companies found lower cost workers outside the United States who could perform these services while remaining competitive. Recognizing a competitive edge in gaining service businesses, countries have invested in significant education and training in technologies to deliver a platform for attracting global services and support businesses. These outsourced positions have positioned countries like India, Ireland, Canada and Israel to gain new industries at the cost of jobs and investments in the United States (McKinsey Global Institute, June 2010). The computer-manufacturing industry is an excellent example of the out-sourcing of formerly United States jobs to other countries, with Asia currently employing about 1.5 million workers within this industry segment as factory employees, engineers and managers. The largest of the companies in this sector is Foxconn. Last year, its revenue was $62 billion, larger than Apple, Dell Inc., Intel and Microsoft Corp. Foxconn has more than 800,000 employees, more than the combined worldwide head count of Dell, Microsoft, Intel, Sony Corp., Hewlett-Packard Co. and Apple. In a southern China facility, 250,000 Foxconn employees produce Apple’s products, while about 25,000 Apple employees are located in the United States. That means for every Apple worker in the United States there are 10 people in China working on iMacs, iPods and iPhones. The same roughly 10-to-1 relationship holds for Dell, disk-drive maker Seagate Technology and a number or other United States technology companies (Bloomberg News Article by Andy Grove, July 2010). Labor Projections for United States Manufacturing Sectors
The United States Bureau of Labor Statistics (BLS) produces a Career Guide that provides an overview of the prospects for jobs and job applicants across service and manufacturing sectors, sector by sector. This information provides a broad array of data and detail related to each sector in terms of the nature of the industry in profile, typical jobs created or performed in each sector, training and advancement for employees in each sector, potential earnings in each sector and the outlook for expansion or contraction in each sector where the Bureau maintains records.
19 Trends in Global Manufacturing NAIOP Research Foundation September 2010
Industry Sector Projected Winners and Losers
According to the Career Guide for 2010, the prospect for job creation or growth and jobs loss or shrinkage in each specific sector is provided for the timeframe between 2008 and 2018. The information below provides the analysis of job growth or decline provided by BLS. In addition, IMSW has added an estimated growth factor based on our global research and market trend knowledge and this number is in parenthesis next to the published number. These are ordered from those projected to gain to those that are projected to decline the most in terms of industry growth within the United States. Sector: Construction Growth: BLS +19 percent (IMSW +19 percent) Employment in 2008: 7.2 million total Justification: Some 884,300 construction firms exist in the United States: 269,700 are building construction contractors, 57,600 are heavy or civil engineering construction or highway contractors and 557,000 are specialty trade contractors. Most specialty contractor establishments are small – 68 percent of the total specialty contractors had fewer than five employees. Construction occupations consist of self-employed workers. New construction, renovation and changes in demographics (senior housing and healthcare residences) will keep this sector active. Heavy and civil construction will be the sectors with strong growth as industrial plants are replaced or remodeled. School construction will continue and improvements in infrastructure will remain strong. Sector: Truck Transportation and Warehousing Growth: BLS +11 percent (IMSW +11 percent) Employment in 2008: 2.1 million total Justification: Growth in this sector is affected by the state of the economy, as the economy moves up or down, demand for transportation follows. Growth in the economy increases the demand for transportation to move goods from producers or importers to consumers. Long-and short-haul trucking face increased competition from rail carriers. Trains can move a ton of freight more than 436 miles on a single gallon of fuel versus a truck that can move 20 tons of freight an average of seven or eight miles on one gallon of fuel. Warehousing is expected to grow faster than the rest of the industry and additional growth will occur as manufacturers or importers outsource their distribution functions to trucking and warehousing companies who can perform these tasks with greater efficiency. In addition, job growth will occur as a result of the increase in online shopping. As more retailers are offering online shopping, they must analyze and re-configure their supply chain. This new supply chain requires a more robust delivery system. Site selection criteria must now take into consideration not only store fulfillment, but also Internet fulfillment centers. Sector: Air Transportation Growth: BLS +7 percent (IMSW +4 percent) Employment in 2008: 492,600 total Justification: International trade will drive growth in international travel and international cargo volumes. Domestic air cargo is not expected to follow this trend. Volumes in domestic cargo have in fact decreased due to lower volumes of mail routed on aircraft. New demands for cargo security screening have led to moves away from domestic lift to integrated cargo operations,
20 Trends in Global Manufacturing NAIOP Research Foundation September 2010
where time-definite products have proliferated. Outsourcing of maintenance and repair will continue to affect jobs in the United States. Aircraft operators now outsource maintenance, repair and overhaul to third-party contractors. Many are licensed to perform these certifications but are located in other countries. Military related job prospects will increase as well as jobs in special fields such as avionics and aircraft technology maintenance. Sector: Pharmaceutical and Medicine Manufacturing Growth: BLS +6 percent (IMSW +6 percent) Employment in 2008: 289,800 total Justification: Research and development remain the strength of this sector and there is a continuing demand for diagnostic, preventative and therapeutic drugs as well as antibiotics and vaccines. Professionals with skills and education are in strong demand, advances in biotechnology, information technology and blending technologies have produced productivity gains. Science, engineering and technicians, biologists and bio-sciences will continue to be in demand. This sector has seen consolidation by multi-nationals who seek to deliver products to global, not national consumers. Sector: Aerospace Product and Parts Manufacturing Growth: BLS 0 percent (IMSW +5 percent) Employment in 2008: 503,900 total Justification: Transport aircraft, defense equipment, drones and space flight contribute to growth while parts production has moved offshore. For professionals in this sector, job prospects are good; for laborers, prospects in the United States are in decline. Demand for new aircraft and increased travel in other countries will drive demand; however, protection for this industry in some regions will prevent the United States from competing for some business. As modernization continues its pace, military products demand will keep this industry active despite pressures on budgets and efforts to rein in space travel and exploration.
Sector: Food Manufacturing Growth: BLS 0 percent (IMSW +2 percent) Employment in 2008: 1.5 million total Justification: Farming, production and delivery of food products to consumers at home and outside the home provides stability in this sector. Increasing volumes of imported foods are becoming part of the current market demand base for year-round fresh products which are harvested worldwide and delivered locally. Technology improvements have increased productivity. Automation of processes to prepare and package foods has been intense in the past decade, and shifts in computer technologies from point of sales has changed supply chains for delivery of food from farm to plate. Sector: Machinery Manufacturing Growth: BLS -8 percent (IMSW -8 percent) Employment in 2008: 1.2 million total Justification: Metalworking, metal forming, cutting and shaping durable products will see declines due to automation improvements, robotics, programmable equipment and productivity increases. With a higher rate of retirement forecast in this sector, there will continue to be demand for highly skilled and specialized workers in a sector facing increased global competition.
21 Trends in Global Manufacturing NAIOP Research Foundation September 2010
Sector: Chemical Manufacturing (except drugs) Growth: BLS -13 percent (IMSW -5 percent) Employment in 2008: 560,000 total Justification: Technology, process automation, industry consolidation and increasing foreign competition are factors that impact this sector. Companies seeking to market to a broader global market are eliminating duplicate tasks in multiple manufacturing centers, performing Research and Development (R&D), engineering and process development in one location in support of global production and delivery. Environmental pressure, (e.g., a regional ban on plastic shopping bags) could impact production demand. Or, costs to comply with new regulations could increase locally produced products and allow foreign competition an even larger market share in this sector.
Sector: Steel Manufacturing Growth: BLS -13 percent (IMSW -10 percent) Employment in 2008: 159,000 total Justification: Industry consolidation, productivity improvements, automation will eliminate low skill workers, foreign competition and demand for steel products in developing countries and countries with expanding infrastructure and construction. China’s steel production is now having an impact of the amount and price of steel on the global market. For skilled engineers, production workers and metallurgists, demand will remain high. For those without requisite skills in the industry, declines are a certainty. Sector: Motor Vehicle Parts and Manufacturing Growth: BLS -16 percent (IMSW -5 percent North America not just U.S) Employment in 2008: 870,000 total Justification: Motor vehicle manufacturing of finished vehicles accounts for only 22 percent of the total employment in this sector. Parts manufacturing for producers of finished vehicles and for after-market sales account for 61.5 percent, and motor vehicle body and trailer manufacturing account for 16.3 percent share of this sector. According to BLS, 9,100 establishments manufactured motor vehicles and parts. Continued productivity and the ability to make a vehicle with fewer workers will not offset the advances of global competition on the industry. Parts and vehicle production will continue to shift to lower wage counties. Expanding factory automation, robotics and technology will all impact job growth and employment prospects. One out of four workers in motor vehicle and parts production were union members or covered by union contracts. This is double the proportion of workers in all manufacturing industries.
Sector: Printing Growth: BLS -16 percent (IMSW -16 percent) Employment in 2008: 594,100 total Justification: Increasing computerization of the industry, declining volume and demand for printed materials, expanded use of electronic media for advertising and Internet communications platforms. Some industry consolidation, self publishing and shorter run print demand negatively affect employment opportunities. Employees with computer, graphic design and communications skills will see strong employment demand, while other traditional printing occupations will be in decline.
22 Trends in Global Manufacturing NAIOP Research Foundation September 2010
Sector: Computer and Electronics Products Manufacturing Growth: BLS -19 percent (IMSW -20 percent) Employment in 2008: 1.2 million total Justification: Rapid declines in computer and electronic products manufacturing driven by rapid productivity growth globally, increased pressure from imported goods (parts or products). While design work remains largely in the United States, much of the manufacturing has moved overseas. Certain sectors in this category have varying results: navigational, measuring, electro-medical and control instrumentation will only decline by two percent. On the high end, employment in audio and video equipment manufacturing will decrease by 46 percent and employment in magnetic and optical media will decline by 26 percent. Research and development employment prospects and the demand for skills in digital technology, artificial intelligence and nanotechnologies will be sectors where demand will remain. Sector: Textile, Textile Product and Apparel Manufacturing Growth: BLS -48 percent (IMSW -48 percent) Employment in 2008: 497,100 total Justification: Apparel production is based on two processes – fiber into fabric production and fabric into clothing or other textile products. Cutting and sewing operations in the United States have become highly automated to remain competitive in some niche textile products. Otherwise, there has been a flight to lower-cost production centers for clothing and textile products. The domestic market benefits by the requirement that all military uniforms worn by the Armed Services and recently Transportation Security Administration officers be produced in the United States. Domestic producers also respond to custom, low volume or high-end production and the ability to produce locally reduces the time between order and delivery. Foreign firms in this regard are at a disadvantage as they must manage lengthy supply chains in order to stock products for consumers around the world. Custom orders or changes to goods must get implemented at the source, move through the supply chain custodians and arrive at the distribution location. Therefore, any changes to goods must be considered and implemented well in advance of the actual goods demand or need.
23 Trends in Global Manufacturing NAIOP Research Foundation September 2010
Manufacturing: Perspective on Policy
Government policies have a profound impact on manufacturing and manufacturing-related employment in the United States Decisions that are made by multi-national corporations go well beyond the selection of manufacturing locations, and include decisions about where to locate corporate headquarters, research and development centers, production centers and distribution networks. The following factors have a varying impact on when, where and why companies select and locate facilities:
• Corporate Income Tax Policies • Research and Development Policy • Export Policy • Environmental Policy
Corporate Income Tax Policy
The U.S. corporate income tax rate is the second highest (Milken Institute, Jobs for America, January 2010) among nations in the Organization for Economic Co-operations and Development (OECD). With a 40 percent corporate income tax rate, the United States is competing with a global average corporate income tax in decline from 32.7 percent in 1999 to 25.5 percent in 2009. This trend has increased the pressure of companies to move to other locations that can offer more favorable rates. By implementing a more favorable corporate income tax rate adjustment (lowering the rate by 13 percentage points to 22 percent over five years) the United States could obtain some very clear benefits. There would be a real increase in GDP of up to 2.2 percent over 10 years. (Endorsed by National Association of Manufacturers for a reduction to 25 percent or less without any tax increases to offset the tax cut, Journal of Commerce, 6/29/2010.) The United States is one of only a few of the OECD countries that allow for deferral. This requires businesses to pay domestic taxes on income earned abroad after deducting the taxes paid in the foreign country. Deferral allows companies to defer paying those taxes until the foreign income is repatriated. In contrast, most OECD countries now apply a territorial tax system which means that companies pay taxes in the country where they earn the income and do not face additional taxes in the country where they are domiciled. If the United States were to remove the deferral option, while leaving the corporate income tax rate unchanged, this would position United States companies at a significant disadvantage with other global competing companies. The business environment cannot be created where it is more costly to bring capital back to the United States than to invest it abroad (McKinsey Global Institute, Growth and Competitiveness in the United States, June 2010.)
Research and Development Policy
Research and development tax credit adjustments would have a parallel positive impact on manufacturing and production job creation and retention. Currently, the United States is ranked 17th among OECD countries worldwide, and the R&D tax policy has remained “temporary” for the past 29 years. The United States could benefit by increasing the R&D tax credit to 25 percent and making it permanent. These benefits include an increase of real GDP by 1.2 percent over 10 years, possible real fixed investment increases of up to 5.6 percent, possible higher exports and
24 Trends in Global Manufacturing NAIOP Research Foundation September 2010
an increase in manufacturing job creation of 270,000 (+2.1 percent). (Milken Institute, Jobs for America, January 2010.) There is increasing global competition for jobs in these sectors from countries that have investment policies which favor R&D and other higher value-added business occupations and operations. Locations where pools of labor exist with legal expertise, multiple language capabilities and accounting strengths are attractive for transitioning R&D from the United States to these new locations where the manufacturing and growing consumer bases are located. The secondary consideration in this context, as the United States competes to retain this sector of jobs, is the need to realize that other governments may “tilt” the table in order to provide more favorable conditions for multi-nationals to relocate their higher-end R&D occupations and related higher-income positions to their countries. In manufacturing, R&D supports development of real products through the actual production and experimentation. The current trends that are occurring within the United States, in terms of fixed investment in manufacturing plants and equipment, reveal a disturbing pattern. China and India devoted more than 42 percent and 32 percent, respectively, to fixed investment in 2009, while the United States only managed 12.5 percent in 2009. The longer-term trends and forecasts suggest that United States leadership in the R&D and manufacturing of high-technology goods is not losing its market share due solely from superior competition abroad, but from a lack of adequate domestic investment in this sector. A continued decline in this manufacturing sector has direct and serious impact on the strength of the United States economy in terms of productivity, growth, technological leadership, and standard of living (Industry Week Article: The Competitive Edge –Is U.S. R&D Investment Holding Up? by Thomas J. Duesterberg, April 21, 2010). Export Policy
Export controls and the application of export policies also have a significant impact on developing trade in certain sectors. The United States restrains export trade on certain products under concerns of national security. The reality exists that some of these technologies and systems are already commercially available globally. Modernizing United States export controls would produce an increase in the export of high-value products – things the United States manufacturing industry does well. The impact of this modernization of export policy would have the following effects projected over 10 years: Real exports would increase over current volumes by $56.6 billion, an increase of 1.9 percent and industrial production would add new employment of up to 340,000 new jobs in manufacturing. (Milken Institute, Jobs in America, 2010.) Exports have received some attention from Washington. On March 11, 2010, President Obama signed an Executive Order formalizing the administration’s position that exports have a critical impact on stimulating economic growth in the United States. Also discussed was the need for companies to actively participate in international markets by increasing their export performance of goods, services and agricultural products. The National Export Initiative Executive Order (NEI) created an Export Promotion Cabinet tasked to report back to President Obama in mid-September with a plan to improve conditions that directly affect the private sector’s ability to export. With an objective of doubling export volumes over the next five years, the NEI is designed to assist small business in overcoming hurdles to enter new and emerging export markets (Whitehouse.Gov, March 11, 2010). President Obama stated “Ninety-five percent of the world’s customers and fastest growing markets are beyond our borders. So if we want to find new growth
25 Trends in Global Manufacturing NAIOP Research Foundation September 2010
streams, if we want to find new markets and new opportunity, we’ve got to compete for those new customers.” (Speech made at The White House, July 7, 2010.)
Environmental Policy Impact
Recently an environmental policy event occurred within the United States that will have a reverberating impact across another sector of United States manufacturing. If the initial ruling is upheld, according to The Chicago Tribune (June 28, 2010), up to 1,000 jobs at Bucyrus International could be lost due to a vote by the Export-Import Bank to deny loan guarantees for a project based on the “projected environmental impact” of the project in India. Bucyrus International produces coal mining machinery and was contracted to sell this United States manufactured equipment to India. If this denial of funding for the project is not reversed, the coal mining equipment will be purchased from other sources in China or Belarus where competing equipment is available. The decision was made due to the current United States administration’s commitment to transition away from high carbon investments toward cleaner-energy projects. However, this policy will not curtail the construction of the coal-based power generation facility in India, as this facility will be developed regardless of this decision. Rather, it will now be completed without goods manufactured in the United States. Other environmental pressures are being placed on companies in Texas. The Environmental Protection Agency (EPA) invalidated 122 air quality permits which had been approved by the Texas Commission on Environmental Quality since the 1990’s, and the EPA is requiring the facilities to re-apply for permits for their oil and chemical refineries under newly approved EPA regulations. If the permitting process is delayed until January 2011, then new EPA greenhouse gas regulations would be applicable. This process extends the concerns of the applicants as they currently do not know which guidelines will apply – the current or next generation regulations. This uncertainty, the associated costs related to the next-generation compliance regulations, undermine a policy of stability in which companies can make investment and regulatory decisions (Houston Chronicle, July 2, 2010). These ambiguities on policy begin to undermine investment and growth (Allan Meltzer, Carnegie Mellon University, Wall Street Journal, 6/2010), deter job creation and expansion, produce investor caution and lengthen the wait for positive signs of a recovery. In the meantime, countries that offer a competitive environment for job creation, investment and
policy will be the winners.
26 Trends in Global Manufacturing NAIOP Research Foundation September 2010
Offshore Manufacturing Perspective on Transportation
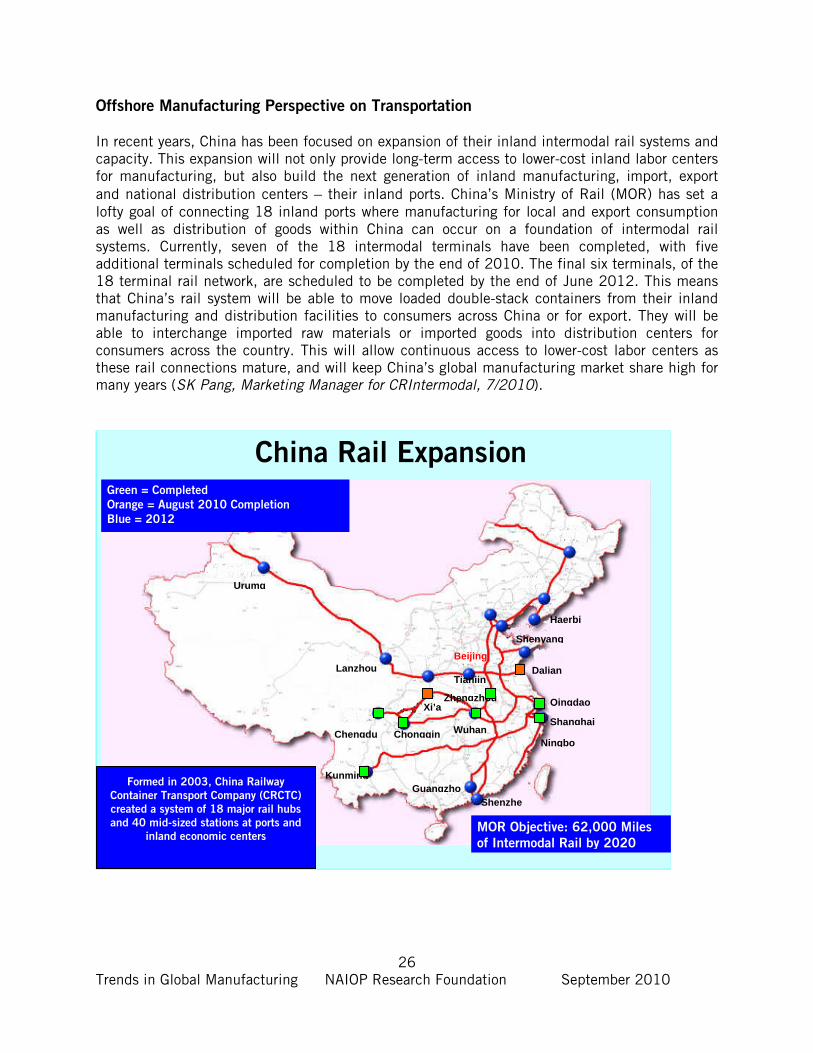
In recent years, China has been focused on expansion of their inland intermodal rail systems and capacity. This expansion will not only provide long-term access to lower-cost inland labor centers for manufacturing, but also build the next generation of inland manufacturing, import, export and national distribution centers – their inland ports. China’s Ministry of Rail (MOR) has set a lofty goal of connecting 18 inland ports where manufacturing for local and export consumption as well as distribution of goods within China can occur on a foundation of intermodal rail systems. Currently, seven of the 18 intermodal terminals have been completed, with five additional terminals scheduled for completion by the end of 2010. The final six terminals, of the 18 terminal rail network, are scheduled to be completed by the end of June 2012. This means that China’s rail system will be able to move loaded double-stack containers from their inland manufacturing and distribution facilities to consumers across China or for export. They will be able to interchange imported raw materials or imported goods into distribution centers for consumers across the country. This will allow continuous access to lower-cost labor centers as these rail connections mature, and will keep China’s global manufacturing market share high for many years (SK Pang, Marketing Manager for CRIntermodal, 7/2010).
China Rail Expansion
Urumq
Lanzhou
Chengdu
Kunming
Chongqin
Xi’a
Wuhan
Zhengzhou
GuangzhoShenzhe
Ningbo
Beijing
Tianjin
Shanghai
Qingdao
Dalian
Shenyang
Haerbi
Formed in 2003, China Railway
Container Transport Company (CRCTC)
created a system of 18 major rail hubs
and 40 mid-sized stations at ports and
inland economic centers MOR Objective: 62,000 Miles
of Intermodal Rail by 2020
Green = Completed
Orange = August 2010 Completion
Blue = 2012
27 Trends in Global Manufacturing NAIOP Research Foundation September 2010
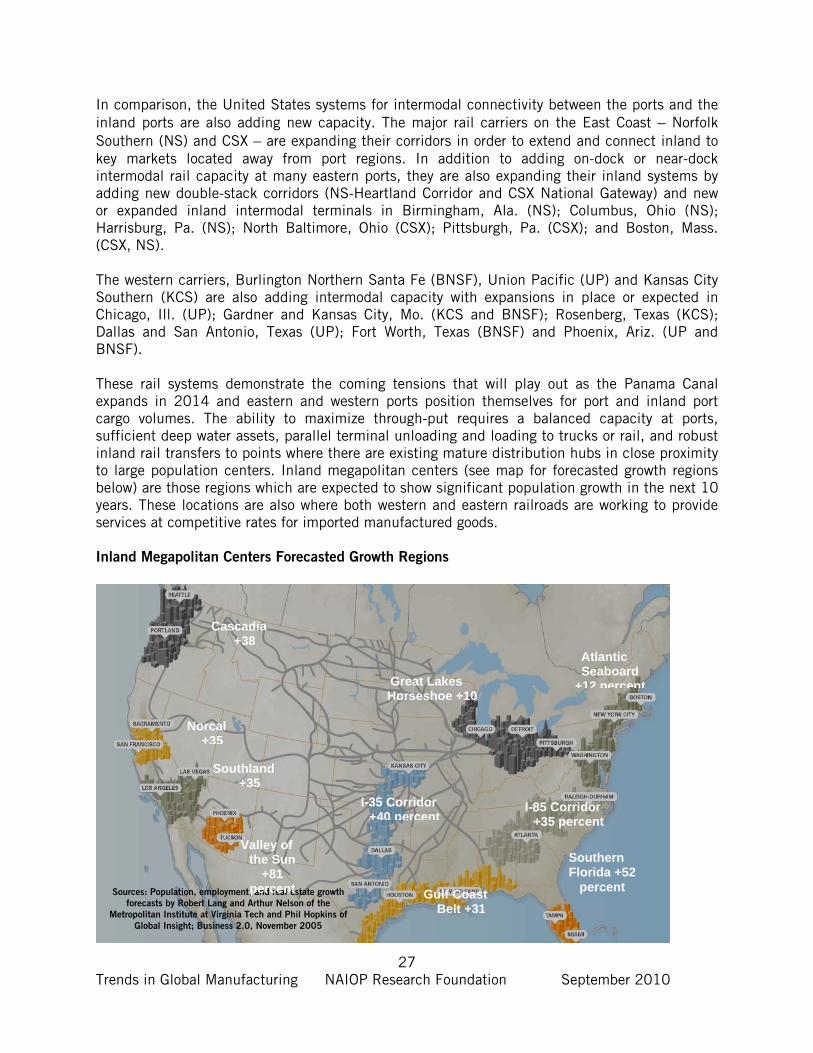
In comparison, the United States systems for intermodal connectivity between the ports and the inland ports are also adding new capacity. The major rail carriers on the East Coast – Norfolk Southern (NS) and CSX – are expanding their corridors in order to extend and connect inland to key markets located away from port regions. In addition to adding on-dock or near-dock intermodal rail capacity at many eastern ports, they are also expanding their inland systems by adding new double-stack corridors (NS-Heartland Corridor and CSX National Gateway) and new or expanded inland intermodal terminals in Birmingham, Ala. (NS); Columbus, Ohio (NS); Harrisburg, Pa. (NS); North Baltimore, Ohio (CSX); Pittsburgh, Pa. (CSX); and Boston, Mass. (CSX, NS). The western carriers, Burlington Northern Santa Fe (BNSF), Union Pacific (UP) and Kansas City Southern (KCS) are also adding intermodal capacity with expansions in place or expected in Chicago, Ill. (UP); Gardner and Kansas City, Mo. (KCS and BNSF); Rosenberg, Texas (KCS); Dallas and San Antonio, Texas (UP); Fort Worth, Texas (BNSF) and Phoenix, Ariz. (UP and BNSF). These rail systems demonstrate the coming tensions that will play out as the Panama Canal expands in 2014 and eastern and western ports position themselves for port and inland port cargo volumes. The ability to maximize through-put requires a balanced capacity at ports, sufficient deep water assets, parallel terminal unloading and loading to trucks or rail, and robust inland rail transfers to points where there are existing mature distribution hubs in close proximity to large population centers. Inland megapolitan centers (see map for forecasted growth regions below) are those regions which are expected to show significant population growth in the next 10 years. These locations are also where both western and eastern railroads are working to provide services at competitive rates for imported manufactured goods. Inland Megapolitan Centers Forecasted Growth Regions
Sources: Population, employment, and real estate growth
forecasts by Robert Lang and Arthur Nelson of the
Metropolitan Institute at Virginia Tech and Phil Hopkins of
Global Insight; Business 2.0, November 2005
I-35 Corridor +40 percent
Gulf Coast Belt +31
Cascadia +38
Norcal +35
Southland +35
Valley of the Sun
+81 percent
Great Lakes Horseshoe +10
Atlantic Seaboard
+12 percent
I-85 Corridor +35 percent
Southern Florida +52
percent
28 Trends in Global Manufacturing NAIOP Research Foundation September 2010
Keys to market share for inland destinations will be linked to the “total transportation costs” which apply to the supply chain system delivering goods from global origins to global destinations and consumers. Rail carriers are an integral part of this supply chain system, and their rates will impact the overall costs associated with moving intermodal containers to inland or near-port distribution centers. Thus, rate structures which apply to movement of goods inland from western ports require that the inland rail rate be competitive with goods which could be shipped to an eastern or gulf gateway port. Otherwise, the goods could shift from traditional western ports to eastern ports supported by longer all-water service from manufacturing centers to distribution centers and consumers. Impact of the Panama Canal Expansion in 2014
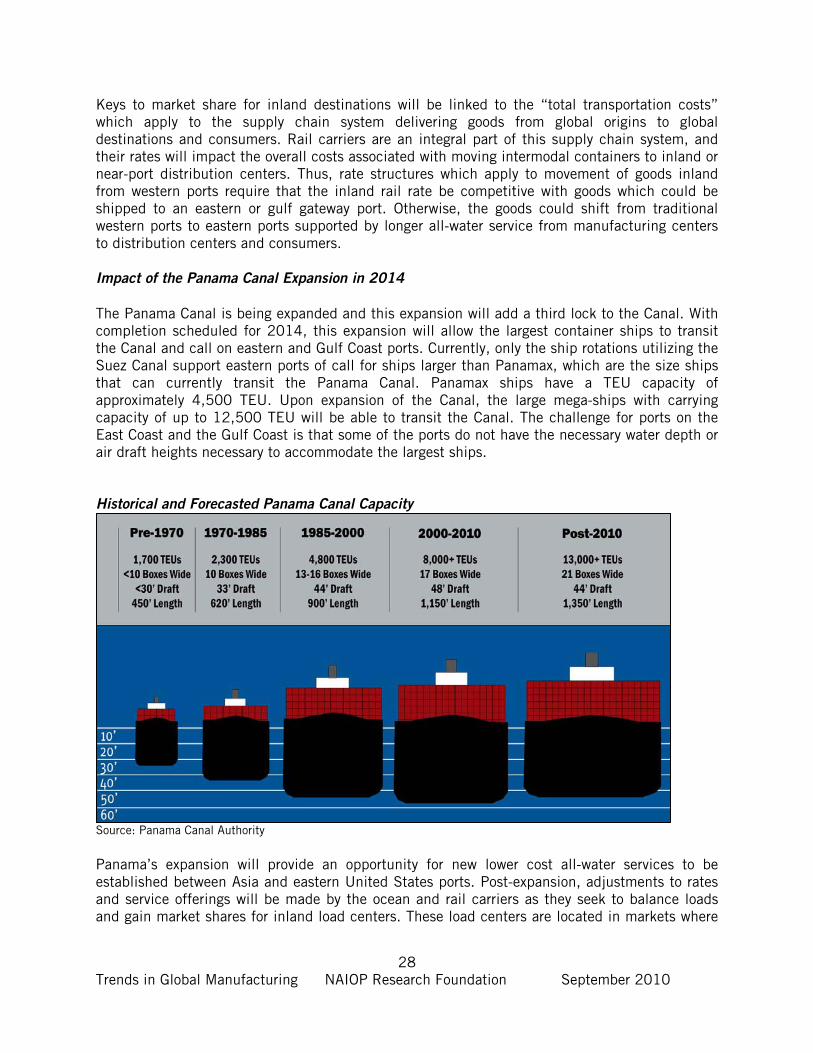
The Panama Canal is being expanded and this expansion will add a third lock to the Canal. With completion scheduled for 2014, this expansion will allow the largest container ships to transit the Canal and call on eastern and Gulf Coast ports. Currently, only the ship rotations utilizing the Suez Canal support eastern ports of call for ships larger than Panamax, which are the size ships that can currently transit the Panama Canal. Panamax ships have a TEU capacity of approximately 4,500 TEU. Upon expansion of the Canal, the large mega-ships with carrying capacity of up to 12,500 TEU will be able to transit the Canal. The challenge for ports on the East Coast and the Gulf Coast is that some of the ports do not have the necessary water depth or air draft heights necessary to accommodate the largest ships. Historical and Forecasted Panama Canal Capacity
Source: Panama Canal Authority Panama’s expansion will provide an opportunity for new lower cost all-water services to be established between Asia and eastern United States ports. Post-expansion, adjustments to rates and service offerings will be made by the ocean and rail carriers as they seek to balance loads and gain market shares for inland load centers. These load centers are located in markets where
29 Trends in Global Manufacturing NAIOP Research Foundation September 2010
distribution demand is high, rail infrastructure is mature, and a large consumer base is accessible. Discretionary cargo is routinely routed between origins and destinations in a manner that provides the lowest total cost, not necessarily the shortest transit times. Just-in-time cargo is routed to deliver the highest predictability to the destination. Tension exists between these two routing considerations. Shippers, distributors and logistics service providers routinely move goods to meet the lowest rates for their discretionary cargo. However, when seasonality or other demand place pressure on rates, decisions are made to favor more predictable and costly routes. Another developing factor is the possibility that ocean and rail carriers will assemble a “Gulf Coast” rotation and deploy a string of ships through Panama into the Gulf (Conversation held with Peter Keller, NYK prior to retirement). These do not necessarily require post-Panamax ships (ships over the current capability to transit the Canal), but the Gulf ports could be effectively served by Panamax ships which would stop at two or three Gulf ports and establish additional market share competition from this third coast. Houston, Galveston, Freeport, Tampa, Port Manatee, Mobile and New Orleans all provide an array of options. The requirement here will be the same for the eastern and western ports. In order to compete, these ports will need to have the ability to move cargo smoothly from ship to rail and to truck. The ability to compete with rail inland ports, currently supported by eastern and western rail carriers and ports will be critical if the new Gulf Coast rotation is to become a reality. Local volumes currently at these ports may not support a new rotation yet. Therefore, if/when inland rail capacity at/near terminals becomes a reality, this new rotation possibility will receive more traction.
30 Trends in Global Manufacturing NAIOP Research Foundation September 2010
Manufacturing and Distribution Impact on United States Industrial Real Estate
There is a clear relationship between imported TEU volumes and industrial space. Approximately,
20,000 TEUs provide a demand for one million square feet of import industrial space (Moffatt &
Nichol 2008). This is a highly variable but valuable indicator of demand (shoes and bicycles obviously require differing amounts of import distribution space) and provides a link between port activity and space demands. What is not readily available is the knowledge of where that industrial demand will occur, or “where the box stops” to be opened. The most difficult issue for a student of logistics is to understand the relationship between industrial demand and the location for the industrial demand, as indicated by the following questions:
1. How much of the total region’s industrial space is impacted by the port or airport? 2. How many of the import TEUs from the port or rail ramp remain in the region (i.e., is the
box opened here or elsewhere)? 3. What future factors impact questions 1 and 2 (i.e., new or expanded terminals or on-
dock rail)? As ports become more expansive in their influence and inland ports draw cargo from major ports on both eastern and western coasts, these “drivers” becomes more complex in application of where the demands will occur. The key to understanding how and when port volume will affect
current vacancies is to track not only incremental increases in port volumes but also to track the
zone of influence exerted by the port as it relates to local, regional or national cargo destinations
from the port. Ports now compete to increase their zone of influence to include inland load centers. The key for importers is to locate their distribution strategy at sites where they have access to multiple ocean and rail carriers. This allows them to choose a delivery strategy based on their priorities for cargo velocity, cargo pricing or leverage with a particular carrier. These sites represent real opportunity for new industrial construction. There will be a clear evolution to two types of port structures in the United States:
Regional ports without extensive intermodal rail service from the port inland. The regional port complexes will service populations in their immediate region, generally within a one-day truck drive.
National ports which provide two or more rail connections to inland cargo
destinations. The national ports will have the significant through-put capacity (potentially up to five million TEUs) and have on/near dock rail capacity, preferably served by two rail carriers for moving large volumes of goods inland while also supporting their local region.
There are also trends in the aggregation of volumes at inland ports within key United States metropolitan markets. The inland port or logistic center locations that will likely witness the highest volume of industrial property development are markets that can be served by both western and eastern rail carriers and have significant populations within a one-day drive. These sites, however, will be import-dependent, not export or manufacturing dependent and building configurations will reflect this demand. Imports from global sources will move from origins in supply chains to the most cost-effective port gateway, on the most cost-effective rail carrier and be distributed to stores and consumers in the region served by the cargo owner or importer.
31 Trends in Global Manufacturing NAIOP Research Foundation September 2010
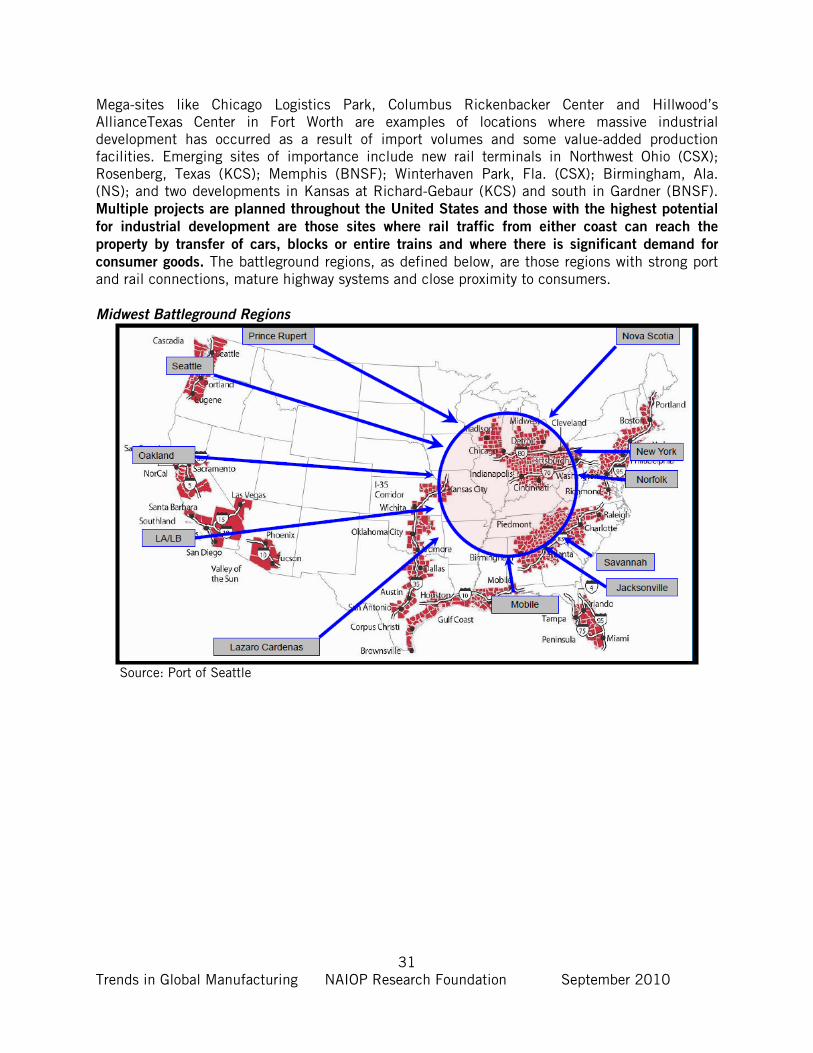
Mega-sites like Chicago Logistics Park, Columbus Rickenbacker Center and Hillwood’s AllianceTexas Center in Fort Worth are examples of locations where massive industrial development has occurred as a result of import volumes and some value-added production facilities. Emerging sites of importance include new rail terminals in Northwest Ohio (CSX); Rosenberg, Texas (KCS); Memphis (BNSF); Winterhaven Park, Fla. (CSX); Birmingham, Ala. (NS); and two developments in Kansas at Richard-Gebaur (KCS) and south in Gardner (BNSF). Multiple projects are planned throughout the United States and those with the highest potential
for industrial development are those sites where rail traffic from either coast can reach the
property by transfer of cars, blocks or entire trains and where there is significant demand for
consumer goods. The battleground regions, as defined below, are those regions with strong port and rail connections, mature highway systems and close proximity to consumers.
Midwest Battleground Regions
Source: Port of Seattle
32 Trends in Global Manufacturing NAIOP Research Foundation September 2010
Manufacturing: Perspective on Supply Chain Efficiencies
A key ingredient that will support a more diverse manufacturing system, whether localized or globalized, will be the supporting role of supply chain management tools which are evolving to better manage products in transit. Efficient supply chains provide the context for moving manufacturing to more remote locations while meeting the demand of global consumers. Making what is needed, when it is needed and delivering what is made on time is the role of the supply chain manager. In order to meet these demands, increased visibility within the supply chain is required. Products can no longer be made and stored; rather they should be made and presented to consumers. This means manufacturers must get much better at making what is needed when it is needed. Manufacturing, in today’s competitive climate, must not be site based nor cycle or forecast based. Manufacturing cannot exist in isolation within remote areas of the globe. It must operate as part of a system moving goods from production centers to consumers and this can only occur when the supply chain is secure, visible and flexible. The secret to manufacturing success in the future will be based on the ability to accommodate demand shifts faster and deliver products to consumers with more expediency. Scheduling flexibility in the manufacturing process must begin to approach same-day execution over manufacturing output. To increase efficiency and competiveness, shifting the point of sale information from the distribution center to the manufacturing center will allow the manufacturers the ability to adjust production to meet actual demand. Those manufacturers who adopt a supply chain system that accommodates this range of flexibility will indeed dominate the globe. While these aspirations are lofty, success in a global context will drive this level of sophistication. A robust and efficient supply chain will connect the demand and supply sides of the manufacturing and consumer cycle. (Supply Chain Brain Webcast, 6/2010) Two examples of manufacturing shifts have occurred that demonstrate trends in manufacturing
and the integration of global manufacturing, logistics and strategy.
When television production first moved from the United States to Mexico, parts were shipped from facilities in the United States to plants in Mexico. The finished televisions were returned to the United States for sale to consumers and this was done under the North American Free Trade Agreement (NAFTA). Under this arrangement United States corporations used Mexico’s Maquiladora (twin plant) program to access lower-cost labor for assembly and the NAFTA provisions to reduce taxes on the higher-value finished goods. In recent years, production of the major components contained in televisions and computers is being conducted in even lower-cost production centers, largely in China and India. These components and sub-assemblies are shipped to Mexico for completion and contain enough material and labor added in Mexico to qualify for NAFTA trade benefits. There is an added benefit for this delayed production, as final assembly in Mexico allows it to be closer to both the consumer market and export markets. Goods produced in China and shipped to Mexico are agnostic in terms of their configuration for a final destination. In Mexico, changes in demand, instructions or other final customizations can occur based on the actual country to which the goods, as final assemblies, will be shipped. Also, at this point in the supply chain, goods can be packaged based on the final consumer point of sale and this can be customized to meet the specific demands of retailers such as Best Buy or Wal-Mart. Goods produced in Mexico can also be customized or prepared for export to markets in closer-in locations such as Central or South America (Logistics’ Study conducted by IMSW, 2007).
33 Trends in Global Manufacturing NAIOP Research Foundation September 2010
Recently, a European automobile producer with an assembly plant in the United States announced their intentions to source more parts for their vehicle production in the United States and Mexico. This producer will invest heavily in parts production in Mexico and intends to purchase more goods globally than from traditional local European suppliers. The stated reason for this decision is to reduce the impact of foreign currency swings on their overall earnings. By buying parts globally, the company has stated that they will reduce their currency risk by $1.23 billion by 2012. Parts purchased from production centers in Mexico and added to a vehicle assembled and sold in the United States have an additional layer of savings under NAFTA provisions. (Automotive News, July, 2010)
34 Trends in Global Manufacturing NAIOP Research Foundation September 2010
The Impact of Brazil, Russia, India and China (BRIC)
Brazil, Russia, India and China make up the BRICs, which are four of the largest and fastest growing emerging countries and potential competitors for United States jobs. With common large land masses, large populations and fast economic growth, the BRICs utilize differing models for economic growth and threaten both the competitiveness of the United States and European Union in the global market.
• Brazil is a domestically-oriented economy with highest priorities on domestic and regional policies that drive growth.
• Russia is heavily dependent on their abundant energy and raw material supply and possesses significant export potential as its infrastructure system matures.
• India’s economy is largely service focused, but exports are now becoming a larger part of their economic momentum.
• China’s economy is all about manufacturing, production, exports and investments. The BRIC governments will manage their economies by controlling industrial policy. These countries as well as some of the Gulf States have and are implementing plans to diversify their economies and “climb” the value-added ladder into high technology and service sectors. These states now have the economic wherewithal to implement their plans and do not need to rely on foreign direct capital. To some extent, they are expanding the role of State Owned Enterprises (SOEs) which move across borders in commodity and energy sectors. SOEs, in some cases, act as vehicles for increased political control and are also vehicles for geopolitical influence. Increasing use of SOEs and their strength in certain global regions is a trend and policy that could impact commodity and energy sectors and global power balances (Global Trade Trends, 2025, National Intelligence Council). Brazil: One of the World’s Leaders in Aerospace and Ethanol Production
Territory: Over 8.5 million square kilometers (3.3 million square miles) Population: 189 million Government: Federal Republic, 26 States, one Federal District, 5560 municipalities GDP: GDP per capita $8,220 (U.S.) Economy: Ranked 60th based on GDP (nominal) per capita Industry: Services account for 66 percent of GDP, industry 28 percent and agriculture 6 percent Notes: Brazil is Latin America’s largest energy consumer and 15th highest oil producer (Source: CIA.gov/International Monetary Fund/The Vienna Institute for International Economic Studies, 12/2009) In 2008, Brazil made changes to their tax policies to support their industrial policies which included tax provisions and incentives for investment, R&D and exports. Their objectives were focused on innovation in R&D to increase Brazil’s market share of the world’s exports, increase the number of overall exporters of Brazilian-made products and increase competitiveness in key sectors of their national industries. Brazil is competitive globally in some high-tech sectors such as aerospace; it is the third leading country in terms of commercial aircraft production. It is also the second largest producer of
35 Trends in Global Manufacturing NAIOP Research Foundation September 2010
ethanol and is now emerging as a technology and production leader in the region for the automotive sector. While Brazil’s influence in the Mercosur region (composed of four sovereign member states of Argentina, Brazil, Paraguay, and Uruguay) remains stagnant, largely due to limited infrastructure to support trade in the region, their exports to China have increased threefold and now include agricultural commodities, meat, transport equipment and iron and steel products. Russia: Strong Energy and Raw Material Export Volumes
Territory: 7,075,200 kilometers (6,592,735 square miles) Population: 141,927,297 Government: Central government, with 83 federal subjects including: 46 provinces, 21 republics (nominally autonomous), 9 territories, 4 (autonomous districts), 1 autonomous oblast (the Jewish Autonomous Oblast) and 2 federal cities (Moscow and St. Petersburg) GDP: GDP per capita $8,694 (U.S.) Economy: Ranked 59th based on GDP (nominal) per capita Industry: Services account for 66 percent of GDP, industry 28 percent and agriculture 6 percent Notes: In 2008, Russia was the world’s largest oil producer. (Source: CIA.gov/International Monetary Fund/The Vienna Institute for International Economic Studies, 12/2009) Russia’s economy in the post-Soviet era is very heavily affected by the one-party political system and the centrally controlled planning system for the economy. The country remains heavily dependent on energy and raw material as exports, despite a fairly advanced defense and space-related industry. With a booming decade of growth ending in 2008, the Russian economy and population saw growth in all sectors, driven by surging energy prices. Russia was awash in money during this time, government budgets were running in surplus and public foreign debt was largely repaid. In the past two years, inflation and strong currency appreciation coupled with the collapse of oil prices have ravaged their economy. During the Putin era, there have been decreases in poverty and rising employment. However, there is a decline in Russia’s population and this will create major challenges in terms of labor shortages in the near future. Income differentiation has increased substantially. The government has targeted certain projects for public-private partnerships under new industrial policies including industries such as automotive, aviation, shipbuilding and certain high-tech industries (nano, nuclear and space). The recent global economic crisis headwinds will curtail these initiatives and their impact on the population and infrastructure of Russia. Russia’s export policies, linked to local production costs, will render their domestic manufacturing sector vulnerable to lower-cost producers and cheaper imports and may result in the displacement of some of Russia’s manufacturing power. By virtue of abundant natural resources, Russia will continue to attract foreign direct investments. This country has the ability to sustain major strength in space, defense and engineering.
36 Trends in Global Manufacturing NAIOP Research Foundation September 2010
India: Growing Population, Middle Class and Service Industry
Territory: 3,287,590 square kilometers (1,269,346 square miles) Population: 1,173,108,018 (July 2010 est.) Government: Federal Republic with 28 states and 7 union territories GDP: GDP per capita $1,031 (U.S.) Economy: Ranked 139th based on GDP (nominal) per capita Industry: Agriculture accounts for 17 percent of GDP, industry 28.2 percent and services 54.9 percent Notes: 73 percent of the population lives in rural areas (Source: CIA.gov/International Monetary Fund/The Vienna Institute for International Economic Studies, 12/2009) India has established some shared powers between the state and the central government in terms of tax and monetary policy. While still under the control of the central government, states are allowed to levy and collect value-added taxes. China and India account for 40 percent of the world’s population. Looking forward a few years, these two countries with billion-plus populations will demand a significant percentage of almost every product and service, particularly clothing, food products, automobiles, mobile phones and pharmaceuticals. Multi-national companies seeking a place in front of this demand storm will need local production, localized product design and local marketing. India’s services strength is linked to their ability to be diverse. Their economy is based on different production and distribution systems. For example, there is traditional farming in some regions and modern mechanized farming in other regions. There is labor-intensive handcraft and a broad array of modern industrial production at varying levels of technology development. Low productive service activities co-exist with capital intensive new services. In this country, there are 14 official languages in addition to English, along with 250 minor languages and dialects. The most recent census indicates that 80 percent of the population is Hindu by religion; 13.4 percent Muslim; 2.3 percent Christians; and the rest consists of Buddhists, Jains and other religions. Social diversions extend beyond ethnicity and the caste structure is complex and prevalent, with several thousand caste categories. India’s population is very young; projections for 2020 indicate that India’s average population will be 29 years old. The average age at that time in China and the United States will be 37 years old, the EU will be 45 years old and Japan 48 years old. India’s historic strength has been in the service and service-related industries. However, India is moving out of a single focus on the service-intensive sector and gaining traction in high-skilled and capital intensive new production systems. In services exports, India has been very successful and became the top exporter of computer and information services in the international economy in 2005. The highest concentration of these service exports were to the United States and the UK. India’s strength remains its focus on education as the basis for future growth and increasing global competitiveness. With at least 100 million young, educated workers in urban and semi-urban areas with English proficiency, India’s share of IT and the service sectors will continue to grow and drive new technology and manufacturing toward India. This is already evident by
37 Trends in Global Manufacturing NAIOP Research Foundation September 2010
Hyundai’s $2 billion investment in the port city of Chennai. Hyundai recently announced further expansion of their manufacturing facility to produce 650,000 cars annually. It is not only the low-cost factory labor that attracted this automotive manufacturer from South Korea, but the abundance of lower-cost engineers who are critical for programming the robots that help in the vehicle production. On the other side of town, Ford has invested close to $1 billion to deploy a very high-tech production line to manufacture vehicles. (The Wall Street Journal, A New Detroit Rises in India’s South, July 9, 2010) India’s key to keeping pace will be linked to their ability to balance infrastructure developments to ensure that the supply chains can function efficiently to support their diversification and growth. India’s rapid growth has placed a great deal of stress on physical infrastructures. All sectors of their infrastructure network remain in a shortage situation and lack capacity. This includes their electrical system, railways, roads, ports, airports, irrigation, water delivery and sanitation systems. India needs to increase spending on infrastructure from the current rate of 5 percent of GDP to 9 percent in order to meet the needs of economic growth and exports. China: Growing Manufacturing and Export Volumes and Expanding National Intermodal
Infrastructure
Territory: 9,596,961 sq km or (1,269,346 square miles) Population: 1,330,141,295 (July 2010 est.) Government: Communist State with 23 provinces, 5 autonomous regions and 4 municipalities GDP: GDP per capita $3,678 (U.S.) Economy: Ranked 98th based on GDP (nominal) per capita Industry: Agriculture accounts for 10.6 percent of GDP, industry 46.8 percent and services 42.6 percent Notes: Coastal provinces hosted 40 percent of China’s population, but produced 60 percent of GDP and account for 90 percent of China’s foreign trade and 80 percent of foreign direct investment. (Source: CIA.gov/International Monetary Fund/The Vienna Institute for International Economic Studies, 12/2009) Urban per capita income is three times that of the rural population in China, with the rural population in 2007 accounting for 55 percent of the total population. In China, the top 10 percent of all households earned 35 percent of all income; the top 20 percent disposed of more than 50 percent of all incomes earned. This suggests that the emerging affluent middle class in China is about 300 million people (consumers). China’s entry into the World Trade Organization in 2001 changed their global position almost immediately. By re-aligning regulations to comply with World Trade Organization rules and making changes in investment (foreign and local) and export regulations, China’s export volumes produced massive trade surpluses and led to large exchange reserves. China has developed a large appetite for raw materials and is aggressive worldwide in gaining access and market share to the necessary raw materials to sustain their manufacturing dominance.
38 Trends in Global Manufacturing NAIOP Research Foundation September 2010
According to the International Monetary fund, estimated annual growth of 7.6 percent GDP is expected over the course of the period from 2002-2020. There will be a transition from export-driven growth to a domestic focus on their domestic economic situation. Foreign direct investments and local investments in infrastructure, technology and access to labor in rural areas will result in China’s dominance as a developed country. It will also continue to be a global economic power for many years. However, population growth in China is much lower than other countries at similar stages of economic development. Due to this, during the 2020s, China will begin facing the problem of aging population and dependency ratios which will have an important influence on consumption as well as production in the future.
39 Trends in Global Manufacturing NAIOP Research Foundation September 2010
Projections and Conclusions: Impact of Mega-trends
There are two barometers related to trade that must be watched and understood going forward. The first indicator is global trade in general; the second is related to global trade with the United States. In the context of trade growth, the second indicator will provide insight into when ports and inland ports will begin to reach capacity and when new capacity will be required. Currently, the United States is operating well below the current combined capacity of the ports and there is plenty of capacity available which will make competition a reality between ports on either or both coasts. Total United States container volumes in 2008 were 42.7 million TEUs and declined to 37.2 million in 2009, which is a total net reduction of 13 percent (American Association of Port Authorities). Given a total estimated TEU capacity at United States ports of 64 million, there is significant latent capacity without adding new port infrastructure. Containerized trade is the engine that drives warehouse and distribution space. Goods flow from origins to destination buildings in ocean containers are measured in 20 or 40-foot equivalent units (TEUs). These containers are transferred from a ship to the terminal, and then loaded on a train or truck for local, regional or inland delivery. Some containers are trans-loaded locally into domestic trailers. This practice allows the ocean carrier who owns the container to ‘re-cycle” the container back to the origin or to another user for an export load. Los Angeles and Long Beach are examples of ports where significant volumes of cargo transition from ship to warehouses. Some goods are stored for local distribution and other goods move inland in other domestic containers via truck or rail. Therefore, growth in containerized traffic is an indicator for creating
new industrial demand.
International containerized trade is not likely to reach the pre-crisis levels of 2007 until or after 2012. World demand and output declined by 1.9 percent in 2009 and world GDP is projected to grow a modest 3 percent in 2010 and 3.4 percent in 2011 (Global Insight, Trade Forecast 2010). United States containerized exports measured in TEUs declined by 8.2 percent in 2009, but are expected to grow 8.6 percent in 2010. Imports dropped 17.4 percent in 2009 and are expected to recover only 8.2 percent in 2010. (Global Insight, Trade Forecast, 2010). Overall economic projections for the United States from the International Monetary Fund Report (produced June 21, 2010) indicate that annual economic growth will average slightly less than 3 percent through 2015. Historically, IMSW has estimated that United States trade volumes track at 2.5 times GDP or economic growth. Thus, the finding below suggests that containerized trade growth of 6-8 percent (in the United States) is in line with historic performances and expectations. Worldwide, container port handling is expected to grow by 6 percent annually starting in 2011 (Drewry Shipping Consultants), but not all trading regions will be affected by this strong growth prediction and not all manufacturing or production sectors will have this level of demand during that time.
40 Trends in Global Manufacturing NAIOP Research Foundation September 2010
Unpredictable Factors Impacting Global Trade
Following are two important, but unknown factors that will have an impact on trade and industrial demand going forward.
• One unknown element of this report is the inability to catalogue or quantify the flight of manufacturing from industrialized centers to emerging economic centers across the globe. While there is, and has been, a trend by manufacturing entities to move toward lower-cost centers, these new production centers now represent local cost and profit centers. What remains unknown is how much of the current manufacturing in the industrialized countries will still move offshore, and whether the majority of those who compete globally have already made their global production and distribution decisions and deployed their strategies. This report provides some insight to reasons why
companies move globally and why they compete in new markets, but does not, and cannot, provide insight into the decisions or timing for companies regarding their timing to move globally or remain local. The delta of decisions made in favor of either strategy is unknown and not quantifiable. Our opinion is that 85 percent of all “out-migration” may have already occurred. However, depending on policy decisions in the United States from 2010-2015, there might be other firms that will move to less restrictive regions.
• A secondary unknown factor for East and West Coast ports, as well as Panama’s future, is
to fully understand how much of a transition of all-water services from western ports to eastern ports has already occurred and how much “transfer” cargo still exists that could make the western-to-eastern coastal shift. According to an August 2009 Jones Lang LaSalle report, as much as 25 percent of current goods that flow to inland ports through western gateway ports could shift to eastern or Gulf Coast ports after the completion of the Panama Canal expansion. IMS Worldwide, Inc., disagrees with this analysis. This much of a shift would be met immediately by a rate reduction by the western rail carriers who would seek to retain market share on their profitable inland rail systems. The western carriers will make rate concessions in order to keep their current volumes. To be sure, slow steaming by the ocean carriers has already blunted any further shifts through the Panama Canal.
What is more likely, however, is that much of the cargo that will shift has already shifted from western ports to eastern ports. The new ships that carry larger loads of cargo will have a more dramatic impact on the eastern ports. Those with only regional capacity will be segregated from those with the necessary infrastructure to support the larger ships and move goods efficiently and competitively both on a regional and national platform.
41 Trends in Global Manufacturing NAIOP Research Foundation September 2010
SELECT NAIOP RESEARCH FOUNDATION
FUNDED RESEARCH
Available at www.naiop.org/foundation/completedresearch.cfm
Logistics Trends and Specific Industries That Will Drive Warehouse and Distribution Growth and Demand for Space (2010) Assessing Key Employment Trends Driving Commercial Real Estate (2009) Mixed-Use Price Premiums (2009) Going Green: Tips, Tools & Examples from the Field (2009) National and Metro Predictors of Commercial Real Estate Development (2009) The New Age of Trade: The Americas (2009) Measuring the Impact of Hispanic Population Growth on the Location of and Demand for Commercial Real Estate in the United States (2008) The Contribution of Office, Industrial and Retail Development and Construction on the U.S. Economy (2008 Edition) Green Building Incentives That Work: A Look at How Local Governments Are Incentivizing Green Development (2007) Commercial Real Estate in a Flat World, The Implications of Corporate Restructuring and Economic Globalization for Industrial, Office and Mixed-Use Property in America (2007) Exploration of LEED Design Approaches for Warehouse and Distribution Centers (2007) NAIOP Terms and Definitions: U.S. Office and Industrial Market (2005)
“The work of the Foundation is absolutely essential to anyone involved in industrial, office and mixed-use development. The Foundation’s projects are a blueprint for shaping the future and a road map that helps to ensure the success of the developments where we live, work and play.”
Ronald L. Rayevich, Founding Chairman
NAIOP Research Foundation

NAIOP RESEARCH FOUNDATION
We’re Shaping the Future
2201 Cooperative Way, Suite 300Herndon, VA 20171
tel 703.904.7100www.naioprf.org
Recommended