P[POQ1 'AMSO.TR-76-146
Q/
0
Transition Induced by Distributed Roughnesson Blunt Bodies in Supersonic Flow
-- Concepts and Plans Group Directorate -Reentry Systems Division
The Aerospace CorporationEl Segundo, Calif. 90245
29 October 1976
Final Report
APPROVED FOR PUBLIC RELEASE:
DISTRIBUTION UNLIMITED ...
-V 12 )976
Prepared for B
SPACE AND MISSILE SYSTEMS ORGANIZATIONAIR FORCE SYSTEMS COMMAND
Los Angeles Air Force StationP.O. Box 92960, Worldway Postal Center
Los Angeles, Calif. 90009

This final report was submitted by The Aerospace Corporation,El Segundo, CA 90245, under Contract F04701-76.C.0077 with the Spaceand Missile Systems Organization, Deputy for Reentry Systems, P.O. Box92960, Worldway Postal Center, Los Angeles, CA 90009. It was reviewedand approved for The Aerospace Corporation by 3. F. Mullen, ReentrySystems Division. The project officer was Lt E. G. Taylor, SAMSO (RSSE).
This report has been reviewed by the Information Office (O1) and
is releasable to the National Technical Information Service (NTIS). At NTIS,
it will be available to the general public, including foreign nations.
This technical report has been reviewed and is approved for publi-cation. Publication of this report does not constitute Air Force approval of
* the report's findings or conclusions. It is published only for the exchangeand stimulation of ideas.
Edward G. Taylor, Lt, USAF JMes .- Mc~ormack, MaJor, MAFAeromechanics and Materials = Einef, Aeromechanics and
Division Materials DivisionDirectorate of Ballistic Systems Directorate of Ballistic SystemsDeputy for Reentry Systems Deputy for Reentry Systems
FOR THE COMMANDER
II f0
Donald A. Dowle r, Col, USAF 0us
Director, Ballistic Systems JUUt .......... ...
Deputy for Reentry Systems ........................
............ ... .
ShlI1K Ah/*L I"T M KUE

UNCLASSIFIEDSECURITY :~o AT'ON OF T14,S PAGE ("o Date Entred
(J1 D .PORT DOCUMENTATION PAGE READ INSTRUCTIONSBEORE COPLTIG FORK
f...SAMSO R-76-146 12 .GOVT AC'CEsON.O No .RECPNT'S CATALOG NUMBER
TRANSITION INDUCED BY DISTRIBUTED/ . Final/ ,
,TOUGHNESS ON &LUNT BODI:ES IN f-/ ~ :, . . ::.._ ......
SUPERSONIC ELOW R 77 25-i5-{ TR 7(5 -5-9. PERFORMING ORGANIZATION NAME AND ADD rES 10. POGRAM EIEMENT PROJECT. TASKAREA II WORK UNIT NUMBERS
The Aerospace CorporationEl Segundo, Calif. 90245D
II. CONTROLLNG OFFICE NAME AND ADRESS.. ..)
Space and Missile Systems Organization 29 Octuim te76Air Force Systems Command, LAAFS N3'UMBER up, .""-Los Angeles, California 90009
"14. MONITORING AG;ENCY NAME A ADORESS(lf diferent how. Co.trolli.if 0flco) 15. SECURITY CLASS. (*fA;dP m-wa-
Un cla ssifie/ I p
IS.. O EC LASS, !I CATION/I00M0l"MJ I~l m~SCHEDULE
"16. DISTRIBUTION STATEMENT (of this Report)
Approved for public release; distribution unlimited.
17. DISTRIBUTION STATEMENT (of the abstract entered in Block 20, iI differene from Report)
II. SUPPLEMENTARY NOTES
9. KEY WORDS (Continue on reverae aide it necessary and identify by block number)
Transition Correlation Taylor-Goertler VorticesDistributed Roughnesses Roughness CharacterizationSupersonic Flow Streamline CurvatureHemispheres, Biconics, Stable Shapes
2 AO STRACT (Continue an reverse ide It n .cesry and identify by block nmber)
An empirical model has been developed that correlates transition due todistributed roughnesses, which range in height over five orders of magnitude.The data base is obtained from wind tunnels, arc heaters, and soundingrockets. The shapes included are hemispheres, biconics, and laminarstable. The correlation departs from previous attempts by dividing the,body into two distinct regions: a forward region where concave streamlinecurvature dominates transition, and a following region where streamline --.. A
011M 1413CS IS MI LEICoq0 P) UNCLASSIFIED
SECURITY CLASSIFICATION OF THIS PAGE (Wh9en D41a Entered)

IJCLASSIFIEDSECURITY CLASSIFICATION OF THIS PAGErshaw Dele Mug.0019. way WORDS (ConeM.,.d)
23. ASSTRACT (C.,,tftnd)
,curvature is not an influence. Noise is found to have little or no effect,and the extension of the correlation to roughnesses meaiured in micro-inches shows no observable smooth wall limit.
UNCLASSIFIED112COjITY CLASSIFICAION OF THIS PAGWfShai Date ifttemi)

CONTENTS
I. INTRODUCTION . .. .. .. .. .. .. .................. 3
II. DISCUSSION......................................... 5
A. Characterization of Roughness..........................5
B. The Correlation......................................6
C. Comparison With Correlation for Z-D Trips..............17
D. PANT Series J Data ................ o.........................8
E . 50-MW Arc Data................................. 21
F. Demetriades, Laderman Data ................. 24
III. CONC LUSIONS...........................................27
IV. RECOMMENDATIONS.....................................29
REFERENCES................................................31
NOMENCLATURE............................................ 35
TABLES
1. Collected Transition Data................................ 37
FIGURES
la. PANT Data, M = 5...................................... 9
lb. NASA-Langley Flight Tests...............................10o
2. PANT, M = 5. 0: Correlation of Data in Region
of Concave Flow Curvature................................12
3. ART, M = 7.9: Correlation of Data in Region
of Concave Flow Curvature................................14
4. Additional Wind Tunnel Tests.............................15
5. Correlation of Data in Region of ConcaveFlow Curvature......................................... 16
6. PANT Series J.........................................19
7. Laminar Blunt -SeriesJ.................................20
8. 50-MW Arc Data....................................... 21
9. Distribution of Microrougbness Characteristics..............22
1 0. Demetriades, Ladermann Data...........................Z23

I. INTRODUCTION
A method for predicting transition has been developed that correlates
the effect of distributed roughnesses varying in height over five orders of
magnitude. The data base includes the passive nosetip technology (PANT)
series A and J 2 , ART 3 and various other wind tunnel tests, the NASA-
Langley flight tests, and some 50-MW arc data.
The correlation departs from previous attempts by dividing the body
into two distinct regions: a forward region where concave streamline curva-
ture in the shock layer dominates transition, and a following region where
streamline curvature is not an influence. Noise is found to have little or
no effect in most of the experiments, and the extension of the correlation
to roughnesses measured in microinches tends to indicate that there is no
such thing as a smooth wall.
A. D. Ard,-rson, Analysis of PANT Series A Rough Wall Calorimeter Data,Aerotherm Report 73-81, Part II, Aerotherm Division/Acurex Corp.Mountain View, California (1973).
2M. D. Jackson, Interim Report Passive Nosetip Technology (PANT)Program, Aerotherm Report 74-100, Vol. XV, Aerotherm Division/AcurexCorp., Mountain View, California (April 1974).3 R. E. Phinney and F. P. Baltakis, Influence of Roughness on Heat Transferand Transition: ART Program Data Report, NOLTR 73-231, Naval OrdnanceLaboratory, Silver Spring, Maryland (December 1974).
-3-

II. DISCUSSION
A. CHARACTERIZATION OF ROUGHNESS
Previous treatments of roughness-induced transition have
nondimensionalized roughness height using the "smooth-wall" momentum
thickness. Various heuristic arguments on the pros and cons of this
approach can be made, but the fact is that it has not produced fully satis-
factory correlations. An alternate quantity, the nose diameter (D = 2R),
has been used here. The basis for this usage is the simple observation that
the tripping effectiveness of a roughness element diminishes with the size
of the body on which it is placed.
The roughness height used is the peak to valley (PTV) value as
suggested by Anderson , denoted by k. Several experimenters 4 ' 5 have
shown that, for distributed three-dimensional roughness elements on blunt
bodies, transition occurs at the element or not at all (i.e., disturbances
are not amplified downstream as is the case for two-dimensional trips).
Thus, in an idealized situation, transition would be distributed about a linedetermined by the median roughness height. In the actual situation, this
picture is modified by the wakes from larger elements that, by obscuring
smaller elements, bring transition forward of the median. Thus, for materi-
als with a wide roughness distribution, the approximate line of transition will
be determined by those larger elements that occur frequently enough to form
such a line. Upstream or downstream departures from this line will occur
4 J. B. Peterson and E. A. Horton, An Investigation of the Effect of a HighlyFavorable Pressure Gradient on Boundary-Layer Transition as Caused byVarious Types of Roughnessess on a 10 -Foot -Diameter Hemisphere at Sub-sonic Speeds, NASA Memo Z-8-59L, National Aeronautics and SpaceAdministration, Washington, D. C. (April 1959).
5 A. E. von Doenhoff and E. A. Horton, A Low-Speed Experimental Investi-gation of the Effect of a Sandpaper Type of Roughness on Boundary-LayerTransition, Technical Not 3858, National Advisory Committee for Aeronau-tics, Washington, D. C. (October 1956).
-5-
- ~. . .

when exceptionally large elements or a region of smaller elements are
encountered. This produces transition asymmetries. In this study it was
found that the size of the elements that determine this approximate line of
transition are those which are shown by a roughness distribution curve, to be
greater in height than 85 percent of the elements, k 8 5 . This is necessarily
an approximate figure and may vary with markedly varying types of rough-
ness. This approach will be discussed in more detail in Section E.
For calorimeter tests with a manufactured tsurface roughness, the distri-
bution is usually quite narrow (intentionally) and the average k approximately
equals k 8 5 . Thus, the average value of k as reported is used in these
cases.
An attempt was made in this analysis to also include roughness spacing
in the form of the spacing-to-height ratio X/k. It was found, however, that
X/k varied at most by a factor of 1. 3, while k/D varied by five orders of
magnitude and the wall-temperature ratio (to be discussed later) varied by a
factor of 3, therefore, no meaningful correlation could be obtained.
There may, of course, be other roughness distributions where spacing
becomes a factor. The same arguments also apply to individual roughness
geometries.
B. THE CORRELATION
In a single PANT transition test, all parameters remained constant
except the wall temperature-edge temperature ratio T w/T , which increased
with time; this caused transition to move downstream, indicating that an
increase in T w/T e is stabilizing. In an initial attempt to correct the smooth
wall momentum thickness Reynolds number Re 0 to account for this effect,
it was observed that the edge Mach number Me was also a stabilizinginfluence. These two effects can be rationalized physically in a manner
similar to that used by Lees , but using a momentum argument rather than
6 L. Lees, "Note of the Stabilizing Effect of Centrifugal Forces on the
tLaminar Boundary Layer Over Convex Surfaces," Journal of the Aeronau-tical Sciences, 25, 407-408 (June 1958).
_-6-
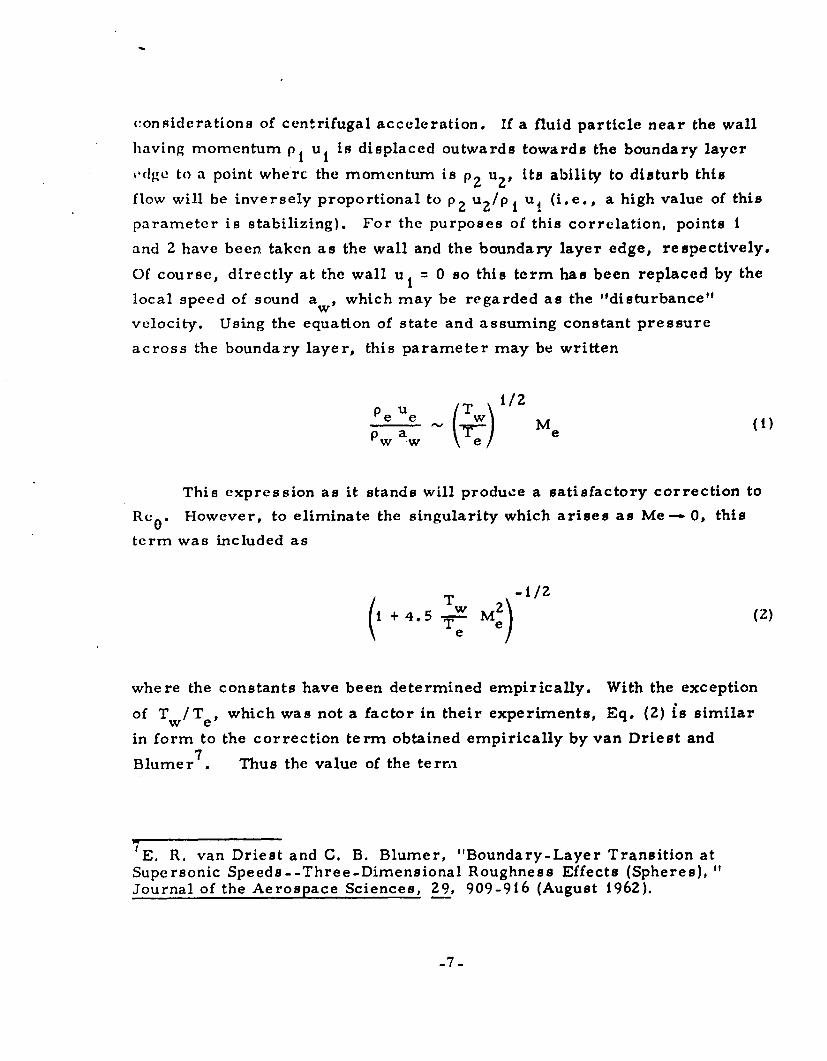
considerations of centrifugal acceleration. If a fluid particle near the wall
having momentum p t ut is displaced outwards towards the boundary layer
e(dge to a point wherc the momentum is p2 u 2 , its ability to disturb this
flow will be inversely proportional to p2 u 2 /pl u, (i.e., a high value of this
parameter is stabilizing). For the purposes of this correlation, points 1
and 2 have been taken as the wall and the boundary layer edge, respectively.
Of course, directly at the wall u i = 0 so this term has been replaced by the
local speed of sound aw, which may be regarded as the "disturbance"
velocity. Using the equation of state and assuming constant pressure
across the boundary layer, this parameter may be written
T1/2epeue (1)
p w aw ,(4 ) Me()a e
This expression as it stands will produce a satisfactory correction to
Re O. However, to eliminate the singularity which arises as Me-. 0, this
term was included as
i + 4. M) -1/2 (2)
where the constants have been determined empirically. With the exceptionof T w/T e, which was not a factor in their experiments, Eq. (2) is similar
in form to the correction term obtained empirically by van Driest and7
Blumer . Thus the value of the terra
7E. R. van Driest and C. B. Blumer, "Boundary-Layer Transition atSupersonic Speeds--Three-Dimensional Roughness Effects (Spheres),Journal of the Aerospace Sciences, 29, 909-916 (August 1962).
-7-
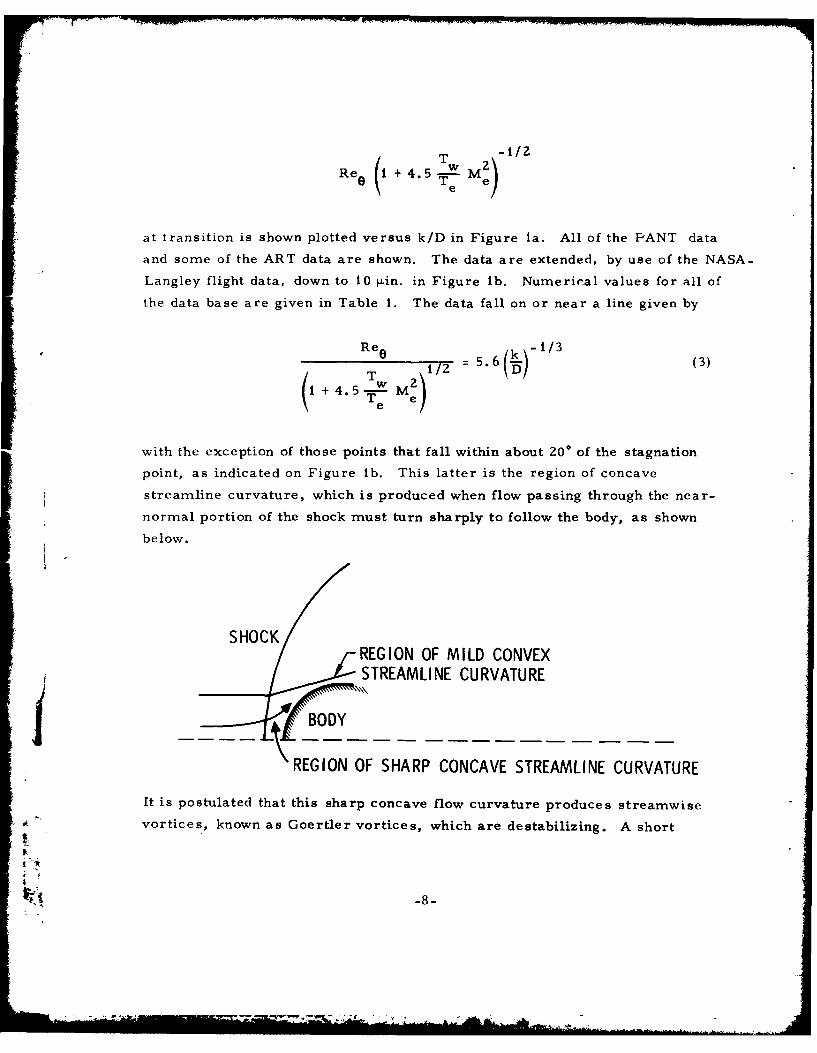
Ree i + 4.5 M
at transition is shown plotted versus k/D in Figure Ia. All of the PANT data
and some of the ART data are shown. The data are extended, by use of the NASA-
Langley flight data, down to 10 I.in. in Figure lb. Numerical values for all of
the data base are given in Table t. The data fall on or near a line given by
Re = 5.6) (3)
T e e
with the exception of those points that fall within about 0 of the stagnationpoint, as indicated on Figure lb. This latter is the region of concave
streamline curvature, which is produced when flow passing through the near-
normal portion of the shock must turn sharply to follow the body, as shown
below.
S HOCK
REGION OF MILD CONVEXSTREAMLI NE CURVATURE
REGION OF SHARP CONCAVE STREAMLINE CURVATURE
It is postulated that this sharp concave flow curvature produces streamwise
vortices, known as Goertler vortices, which are destabilizing. A short
-8-

ocCDCJ A~DI-
0 00
zi .
----- 4-4 L- C
* CD
Sn C
(A 0
LU in
SnI I
'0 0in Lon
-4 LUJ zLUJ
S
I-4
in=c
aC

00
ItIItI
LJ Itcrr
0 '0
-~ 4
C))
be I."-
C-Z1
C) -t

8discussion of this phenomenon is given in Schlichting8 . In particular,
Goertler 9 has calculated that such disturbances exist in the stagnation region
of bluff bodies. However, their existence has not yet been empirically
demonstrated in a completely satisfactory manner. Whether one believes
in vortex formation in the stagnation region or not, it is clear that the
nature of the streamline curvature there is radically different from that fur-
ther back on the nose. This curvature is used here to explain the departure
of the forward region transition from that given by Eq. (3). A problem arises
in attempting to use curvature as a correlation input, because it is not an
easily determined quantity. To avoid this, curvature (and other local flow
properties) were assumed to be functions of freestream Reynolds number,
Re D = U 2R/v, freestream Mach number, M , and angle from the stagna-
tion point, S/R. Wall-related parameters were included as before as k/D
and Tw IT e . A correlation of the PANT data for those points only that fall
below the curve in Figure Ia is shown in Figure 2. The straight line is given
by
r ( ) 1 2 3 (s)-1.0 (ReDF F06 = 0. 159 X 10 (4)
Note that this is for constant M = 5.0. At first glance this correlation
appears to have considerable scatter, but note that the scales are arithmetic,
not logarithmic as in the previous curves. The maximum scatter in this
curve is 0.05 radians or an error in transition location of 0. 125 in. on the
2. 5-in. nose radius PANT test model. This is quite accurate as transition
correlations go. A similar plot for the ART data (M., = 7.9), i.e., those
8 H. Schlichting, Boundary-Layer Theory, 6th ed., McG;-aw-Hill Book Co.,
New York, pp 500-508 (1968).
911. Grtler, "Dreidimensionale Instabilitat der ebenen Staupunktstr6munggegeniiber wirbelartigen St6rungen, " Festschrift, Fifty Years of Boundary-Layer Research, Arniversary Volume, eds. H. GUrtler and W. Tollmien,Vieweg, BraunschwEig, Germany, pp 303-314 (1955).
4i

6
LAMINAR ABOVE CURVE,TURBULENT BELOW
SLOPE 1.59 x 10⁻²
, 4 0
0
2 0 3.0 16300 10 165
10 169o 20. 40 171
1 0 20* 174Q 3.0 blunt 180
* See notes Table 10 1
0 0.1 0.2 0.3 0.4 0.5
SIR
Figure 2. PANT, M = 5. 0: Correlation of Data in Regionof Concave Flow Curvature
-12-

points that fall below Eq. (3), is shown in Figure 3. Once again agreement is
relatively good. In this case the slope of the straight line has changed to
0.99 X 10- due to the change in M. Additional data is also available in
correlating this Mach number effect. Figure 4 shows various other wind
tunnel tests. The Mach number in these tests ranges from 3.0 to 10.4.
Once again the data fall on the correlation in Eq. (3) except for those points
approaching the stagnation region. The M = 10.4 data I 0 is especially low.
The values of the right side of Eq. (4) have been calculated for these latter
points and, together with the slopes for the PANT and ART data from Figures
2 and 3, are plotted versus M. in Figure 5. Because of the abundance of PANT
and ART data, the correlation in Figure 5 is drawn through these points. This
final correlation for the region of concave flow curvature is given by
k = 5 Te) 1.23 Mi 6 " 9 6 (5D [ SR ReD 0.)6
where k/D is that value of dimensionless roughness required to produce
transition. Note the strong dependence on T /T and M . Some of the
Deveikis and Walker data falls slightly below this correlation (Figure 5) as
well as below the previous correlation (Figure 4). This data (as well as some
of the PANT and ART data) falls in an intermediate zone between the concave
and convex flow regions, and does not fall exactly on either correlation.
While this error is not great, its significance is that it marks the downstream
limit of the concave flow region. For the M = 5 or 8 data, this limit is
J. C. Dunavant and H. W. Stone, Effect of Roughness on Heat Transfer toHemisphere Cylinders at Mach Numbers 10.4 and 11.4, NASA TN D-3871,Langley Research Center, Hampton, Virginia (March 1967).
I IlW. D. Deveikis and R. W. Walker, Local Aerodynamic Heat Transfer and* Boundary-Layer Transition on Roughened Sphere-Ellipsoid Bodies at Mach
Number 3. 0, NASA TN D-907, Hampton, Virginia (August 1961).
I'.
-13-

6
5
-44
SLOPE =0.99 x 10²
3 30
0SYMBOL k (mit) RUN
00 3.0 202 0 0 302
0 0 3.0 560 3.0 blunt 7
10 10 29N~ 10 30
o 20 14
00 0.1 0.2 0.3 0.4 0.5I SIR
Figure 3. ART, M =7. 9: Correlation of Data in Regionof Concave Flow Curvature
-14-

cii
~ 800
-44
I 0 0 I0 IC* CD

10
OD PANTEo ART0 DUNAVANT STONE (10)
k =4, 25 mils& OTIS (18) k =3 mils
ADEVEIKIS, WALKER (11)k=0.4, 0.8 mit
100
k IT w/T 123 mo-1.96k ~R we M0
10 100
Figure 5. Correlation of Data in Region of ConcaveFlow Curvature
i A 16L

approximately at S/R 0. 3. For the M. 10. 4 it extends approximately to
S/R = 0. 40. In general the limit of the concave region will be affected by
ReD through boundary layer development. For increasing M one expects that
the decreasing shock standoff distance will increase the required flow curva-
ture. However increasing M. also lowers the Reynolds number behind the
shock, so the effect of M is not yet clear. Nevertheless, it appears that for
relatively high ReD and M the concave curvature region may extend over
most of the nose. This will be discussed in more detail in Section F.
C. COMPARISON WITH CORRELATION FOR TWO-DIMENSIONAL TRIPS
For the case of a flat plate with a single two-dimensional trip (a wire),
Schlichting 1 2 quotes the following low speed (incompressible) correlation
for transition at the trip itself:
k 2 20 (6)V p
where r is the wall shear evaluated at the trip position. For a flat plate
'r 0.332 u e (7)Cvx
and
Re 0o.664 uTex (8)
. V
tI2 H. Schlichting, Boundary-Layer Theorry, 6th ed., Mcgraw-Hill BookCo., New York, p 51 (1968).
-17-

whe re u is the edge velocity and x is the trip distance from the leading
edge. Substitution of Eq. (7) and Eq. (8) into Eq. (6) gives
Re = 0.96 kx-./ (9)
Equation (9) has the same form as the zero M e limit of the correlation in Eq.
(3), except that k is nondimensionalized by x rather than D and the power on k
is exactly twice that given by Eq. (3). This higher power is attributed to the
fact that three-dimensional disturbances may dissipate in all directions (away
from the wall), whereas two-dimensional disturbances may not dissipate in the
direction parallel to the trip. The correspondence between these two corre-
lations tends to confirm the validity of both of them. It also suggests that
wall shear could have been used instead of Re 0 in the present correlation.
D. PANT SERIES J DATA z
These data are important because shapes other than the hemisphere or
truncated hemisphere are included. The two shapes of interest here are the
!aminar'blunt and the biconic. The former shape is typical of a laminar ab-
lating nosetip; the latter shape sometimes occurs after transition has altered
the original nosetip shape. These data are correlated in Figure 6. For these
test models, the measured roughness varied from 2.7 to 3. 6 mils. A nomi-
nal roughness of 3. 5 mils was used for the correlation. The data agrees well
given the measured variation in roughness. For laminar blunt tests, D was
obtained from the actual nose radius. For the biconic tests, the diameter of
the body at the shoulder was used as D. It is probably coincidental that this
latter data agree so well using this D. The point to be made is that the bi-
conic data can be correlated with Eq. (3) using some appropriate D. Some of
the laminar blunt data (not shown on Figure 6) falls within the concave curva-
ture region. This is shown with the appropriate correlation from Eq. (5) in
Figure 7. Once again the agreement is good.
-18-

rrn
C C>
000 -
0 fl.
C)-
I.50
00 4
4-4
-'9a

6
5
4 CORRELATION (5)
3
2
0 RUN 636, M 5. 01 k3.5 miIR N 0 .7 n
00 0.1 0.2 0.3 0.4 0.5j S/R
Figure 7. Laminar Blunt - Series J
-20-
U*A
E. 50-MW ARC DATA
The data presented in Figure 8 consist of seven points previously
reduced by Anderson . The data are used exactly as given in this reference.
The roughnesses used are the k85 values discussed earlier. These were
obtained from distributions measured by Kratsch, et alt 3 and Swain, et a1 1 4
on postlaminar test specimens of ATJS graphite and MOD I I I-A carbon-
carbon. With the exception of one anomalous point, the agreement is
extremely good. Blowing was not included in the momentum thickness cal-
culation. This would slightly lower Re Two important observations can
be made from these data. First, there is no apparent noise influence in the
data. This has long been a source of uncertainty in the 50-MW data.
Second, there is no apparent "in situ" roughness effect, i.e., the post test
roughness used in the correlation appears to be very close to the actual
roughness during the test. Obviously many more tests have to be examined,
but data of this type could have great value.
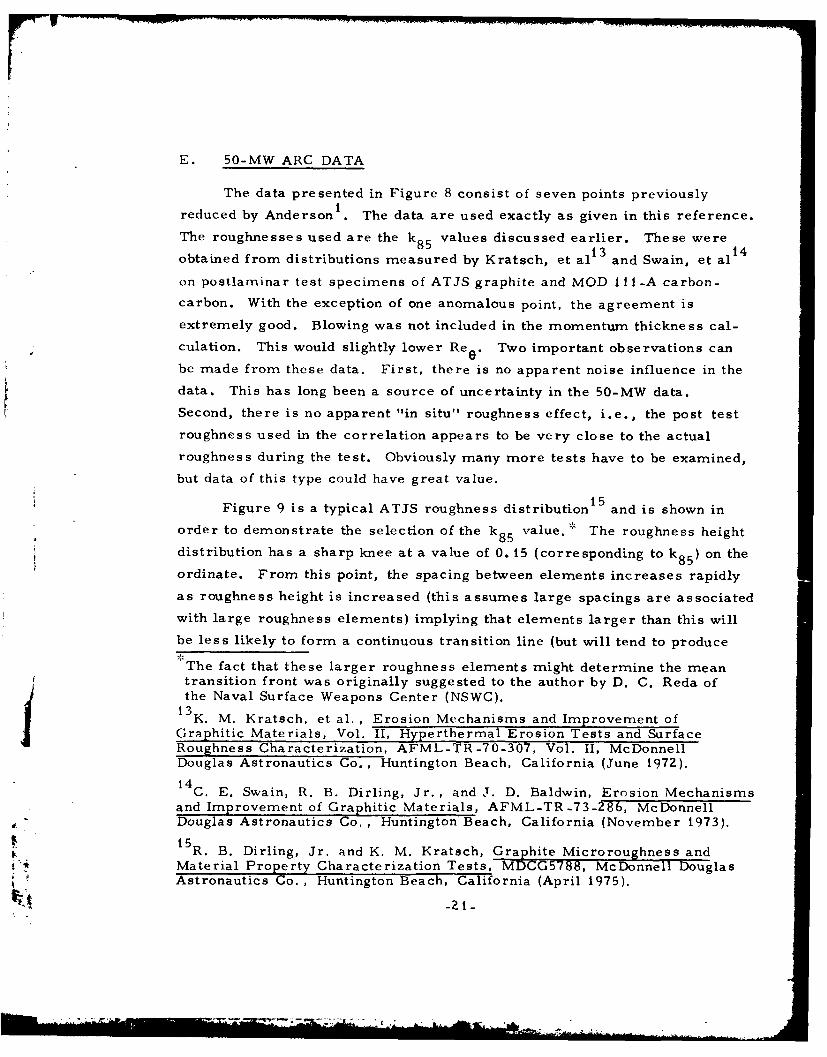
Figure 9 is a typical ATJS roughness distribution 1 5 and is shown in
order to demonstrate the selection of the k85 value.* The roughness height
distribution has a sharp knee at a value of 0. 15 (corresponding to k 8 5 ) on the
ordinate. From this point, the spacing between elements increases rapidly
as roughness height is increased (this assumes large spacings are associated
with large roughness elements) implying that elements larger than this will
be less likely to form a continuous transition line (but will tend to produce
The fact that these larger roughness elements might determine the meantransition front was originally suggested to the author by D. C. Reda ofthe Naval Surface Weapons Center (NSWC).
1 3 K. M. Kratsch, et al. , Erosion Mechanisms and Improvement ofGraphitic Materials, Vol. II, Hyperthermal Erosion Tests and SurfaceRoughness Characterization, AFML-TR-70-307, Vol. II, McDonnell
Douglas Astronautics Co. , Huntington Beach, California (June 1972).1 4 C. E. Swain, R. B. Dirling, Jr., and J. D. Baldwin, Erosion Mechanismsand Improvement of Graphitic Materials, AFML-TR-73-286, McDonnellDouglas Astronautics Co. , Huntington Beach, California (November 1973).
1 5 R. B. Dirling, Jr. and K. M. Kratsch, Graphite Microroughness andMaterial Property Characterization Tests, MDCG5788, McDonnell DouglasAstronautics Co. , Huntington Beach, California (April 1975).
-21-
*1~ --- -

CD~
irU
c~ 00 C I
00< -
-6D
Z/1 z M

I1.0
£ PRE-CHARRED MODEL STAG, REGION
0~ MEASURED ELEMENT HEIGHT, k0 MEASURED EL.EMENT WIDTH, W
n MEASURED ELEMENT SPACING, A
V. U (I L 0. 04 mi )
LUk
20.15~
0 040 6080 100LENGTH - microns
j Figure 9. Distribution of Microroughness Characteristics
_23-

forward transition points or asymmetries). The k 8 5 elements, however,
are associated with a width of approximately 40 t and a spacing of approxi-
rnately 6 5i, thus forming a nearly continuous front.
F. DEMETRIADES, LADERMAN DATA1 6
These data are taken on a 7 -in. nose radius hemisphere at M 6. 0 under
near-adiabatic wall conditions. Point of transition is determined using both
hot wire and pitot tube. The data are compared with the concave curvature
correlation from Eq. (5) in Figure 10. The 2. 36-mil data roughly straddles
the correlation, hot wire above, pitot below. The 4.77-mil data is high.
This discrepancy is thought to be due to the fact that the boundary layer
temperature distribution for this adiabatic case is radically different from
the cold-wall tests used to form the correlation. This could be corrected,
but future tests are planned using a cold vall. The data, which will be
looked at in toto at that tirne, are inmportant because the Goertler vortex
region appears to extend to about S/R 1. 0, possibly because Re D is
higher than most of the previous data (but still lower than low altitude
flight), or because of the higher T /T values. This tends to indicate that
for typical flight trajectories most of the nose is in the concave flow region.
16A. Demetriades and A. J. Ladernian, Advanced Penetration Problems1Progra-n, SAMSO-TR-75-51, Vols. I and II, Space and Missile Systemsr,,nization, Air Force Systems Command, Los Angeles, California
(l)ecember 1974).
_4-
~24|

o Po = 280 psia, k = 2.36 milo Po = 250 psia, k = 2.36 mil
'>Po =220 psia, k =2.36 milCs Po =200 psia, k =2.36 milb Po =280Opsia, k =4.77 mil0 Po = 220 psia, k = 4.77 mil
10 * Po = 160 psia, k =4.77 mil
c:)
5
CORRELATION (5)
OPEN SYMBOLS - HOT WIRE MEASCLOSED SYMBOLS - PITOT MEAS
00 0. 1 0. 2 0.3 0.4 0.5 0.6 0.7 0.8 0.9 1.0
Figure 10. Demetriades, Ladermann Data
-25-

ffiCZ I .. , -
III. CONC LUSIONS
The extension of the correlation to very small roughness, i.e., 10 flin.
in Figure lb, implies that there are no "smooth" walls. In the absence of
noise, some Reynolds number will eventually produce transition no matter
how small the roughness. Previous correlations using only a single corre-
lation for both the concave and convex flow regions show a greater k depen-
dence. For instance, PANT uses a power on k of -0.7 rather than the -1/3
used here. This made the correlation too high at small roughnesses and led
to the necessity of introducing a "smooch wall limit" or freestream noise to
explain the observed early onset.
Correspondingly, this correlation shows no apparent influence of
freestream noise--either in the wind tunnel or flight tests. Even the 50-MW
data show no evidence of noise. One could argue that noise was the domi-
nating factor in these latter tests and the results fell coincidently on the
correlation, but this would require some strong substantiation. Noise can
become a factor if experimenters go out of their way to make it so. This17is apparently the case for data taken by Dunlap and Keuthe where a sphere
was shrouded in an attempt to simulate hypersonic flow. Data for these
tests (not presented here) fall far below the present correlations, -robably
because of interaction between the shroud and the model. Thus, it seems that
data scatter previously thought due to noisy test conditions is more likely
due to the correlations used. It appears that roughness elements tend to
become significant disturbances in high speed flows, while freestream
noise may become "smeared out" in the associated large velocity gradients.
JAlternately, in low speed flows, noise is often dominating. Wind tunnel
tests of highly polished models, which were not studied here, are possibly
noise influenced.1 7 R. Dunlap and A. M. Kuethe, "Effects of Cooling on Boundary-LayerTransition on a Hemisphere in Simulated Hypersonic Flow, Journal of theAeronautical Sciences, 29, 1454-1462 (December 1962).
_27 -
6 _ ... 'L -
ga

Nosetip asymmetry depends on the random distribution of roughness
heights and will always be present if significant size variation exists.
Roughness spacing, shape, various statistical characteristics (other
than k distribution), etc. , appear to have much less influence on transition
than the properties correlated here. This applies only to the types of
roughnesses studied here; however, a large variation from these types
may produce an effect.
I8

IV. RECOMMENDATIONS
The correlation in Eq. (5) for the concave curvature region is strongly
sensitive to the power on Mach number and requires a fairly large extrapo-
lation to flight conditions. It is thus desirable that accurate higher M*c test
data be obtained in order to check the validity of the correlation and its
extension around the nosetip. Wind tunnel tests using the PANT models
would be ideal, but ballistic range data would also be very useful if transi-
tion location can be determined accurately.
Analytical studies should also be of value to determine the extent of
the concave curvature region and to establish some sort of correlation for
this. Empirical confirmation of the existence of Goertler vortices is also
desirable.
Finally an attempt should be made to apply the correlation in Eq. (3)
to frustra transition since there is no obvious reason why it should not work
there.
,4

-rpm
REFERENCES
1. A. D. Anderson, Analysis of PANT Series A Rough Wall CalorimeterData, Aerotherm Report 73-81, Part II, Aerotherm Division/AcurexCorp. , Mountain View, California (1073).
2. M. D. Jackson, Interim Report Passive Nosetip Technology (PANT)Program, Aerotherm Report 74-100, Vol. XV, Aerotherm Division/Acurex orp. , Mountain View, California (April 1974).
3. R. E. Phinney and F. P. Baltakis, Influence of Roughness on HeatTransfer and Transition: ART Program Data Report, NOLTR 73-231,Naval Ordnance Laboratory, Silver Spring, Maryland (Decenber 1974).
4. J. B. Peterson and E. A. Horton, An Investigation of the Effect of aHighly Favorable Pressure Gradient on Boundary-Layer Transition asCaused by Various Types of Roughnessess on a 10-Foot -DiameterHemisphere at Subsonic Speeds, NASA Memo 2-8-59L, NationalAeronautics and Space Administration, Washington, D. C. (April 1959).
5. A. E. von Doenhoff and E. A. Horton, A Low-Speed ExperimentalInvestigation of the Effect of a Sandpaper Type of Roughness onBoundary-Layer Transition, Technical Note 3858, National AdvisoryCommittee for Aeronautics, Washington, D. C. (October 1956).
6. L. Lees, "Note of the Stabilizing Effect of Centrifugal Forces on
the Laminar Boundary Layer Over Convex Surfaces, " Journal of theAeronautical Sciences, 25, 407-408 (June 1958).
7. E. R. van Driest and C. B. Blumer, "Boundary-Layer Transition atSupersonic Speeds--Three-Dimensional Roughness Effects (Spheres),Journal of the Aerospace Sciences, 29, 909-916 (August 1962).
8. H. Schlichting, Boundary-Layer Theory, 6th ed., McGraw-Hill BookCo. , New York, pp 500-508 (1968).
9. H. Grtler, "Dreidimensionale Instabilitat der ebenen Staupunkt-str~mung gegenaber wirbelartigen St~rungen, " Festschrift, FiYears of Boundary-Layer Research, Anniversary Volume, eds.H. Gdrtler and W. Tollmien, Vieweg, Braunschweig, Germany,pp 303-314 (1955).
-31-
I

10. J. C. Dunavant and H. W. Stone, Effect of Roughness on HeatTransfer to Hemisphere Cylinders at Mach Numbers 10.4 and 11.4,NASA TN D-3871, Langley Research Center, Hampton, Virginia(March 1967).
11. W. D. Deveikis and R. W. Walker, Local Aerodynamic HeatI ransfer and Boundary-Layer Transition on Roughened Sphere-Ellipsoid Bodies at Mach Number 3. 0, NASA TN D-907, Hampton,Virginia (August 1961).
12. 1l. Schlichting, Boundary-Layer Theory, 6th ed. , McGraw-HillBook Co., New York, p 511 (1968).
13. K. M. Kratsch, et al., Erosion Mechanisms and Improvement ofGraphitic Materials, Vol. II, Hyperthermal Erosion Tests and SurfaceRoughness Characterization, AFML-TR-70-307, Vol. II, McDonnellDouglas Astronautics Co., Huntington Beach, California (June 1972).
14. C. E. Swain, R. B. Dirling, Jr., and J. D. Baldwin, ErosionMechanisms and Improvement of Graphitic Materials, AFML-TR-73-286, McDonnell Douglas Astronautics Co., Huntington Beach,California (November 1973).
15. R. B. Dirling, Jr. and K. M. Kratsch, Graphite Microroughnessand Material Property Characterization Tests, MDCG5788,McDonnell Douglas Astronautics Go., Huntington Beach, California(April 1975).
16. A. Dernetriades and A. J. Laderman, Advanced Penetration Prob-
lems Program, SAMSO-TR-75-51, Vols. I and II, Space and MissileSystems Organization, Air Force Systems Command, Los Angeles,California (December 1974).
17. R. Dunlap and A. M. Kuethe, "Effects of Cooling on Boundary-LayerTransition on a Hemisphere in Simulated Hypersonic Flow," Journalof the Aeronautical Sciences, 29, 1454-1462 (December 1962).
18. J. H. Otis, Jr. , et al. , Strategic Reentry Technology Program(Street-A) Final Report, AVSD-0Z20-70-RR, Vol. II. Avco SystemsDivision, Wilmington, Massachusetts (November 1970).
0. M. R. Wool, Interim Report Passive Nosetip Technology (PANT)Program, Aerotherm Report 74-100, Vol. X, Aerotherm Division/AI7Texorp., Mountain View, California (January 1975).
-32-

20. J. J. Buglia, Heat Transfer and Boundary-Layer Transition on aHighly Polished Hemisphere-Cone in Free Flight at Mach Numbersup to 3. 14 and Reynolds Numbers up to Z4 X 106, NASA TN D-955,Langley Research Center, Hampton, Virginia (September 1961).
21. J. R. Hall, K. C. Speegle, and R. 0. Piland, Preliminary ResultsFrom a 1'ree-Flight Investigation of Boundary-Layer Transition andHeat Transfer on a Highly Polished 8-Inch-Diameter Hemisphere-Cylinder at Mach Number and Reynolds Numbers Based on Lengtiof 1 Foot up to 17. 7 x 10⁶, NACA RM L57D18c, Langley AeronauticalLaboratory, Langley Field, Virginia (May 1957).
22, B. J. Garland and L. T. Chauvin, Measurements of Heat Transferand Boundary-Layer Transition on an 8-Inch-Diameter Hemisphere-Cylinder in Free Flight for a Mach Number, NACA RM L57D04a,Langley Aeronautical Laboratory, Langley Field, Virginia(April 1957).
23. C. A. Powars, et al., AFFDL 50 MW RENT Facility Calibration,AFML-TR-73-128, Vol. II, Aerotherm Division/Acurex Corporation,Mountain View, California (October 1973).
-33-
VIA .. .m . . . . . ,. .

NOMENC LATURE
a speed of sound
D diameter of nose, nose radius X 2
H enthalpy
k average peak to valley (PTV) roughness height
k85 value of k greater than 85% of other roughness elementheights
M Mach number
P pressure
R nose radius
Re D freestream Reynolds number based on nose diameter(D = 2R)
Re momentum thickness Reynolds number, ue Oe
S streamwise distance from the stagnation point
T temperature
u streamwise velocity component
U0 freestream velocity
0 momentum thickness (smooth wall)
x peak-to-peak spacing between roughness elements
1* dynamic viscosity; also microns
v kinematic viscosity
p density
wall shear at trip location
-35-

Subscripts
e boundary-layer edge
w wall
o model stagnation condition
CO freestream
3
• -36-

4-4
% n xo m Ln xI,
~ 0 N o a,0 c N D 0 o LA L
L 0 C) 0 C) C> 0 A C N C) C 0 i 0 LA C) C) C)'
0-00 0 D 0000 r 0 00 00 000 0
4 LA ' N 4 Ln '.0 N- %0A'O LA 'D r
0o ) 0000 000 000 000
0
0a,0 0 0Q) U)
U$.Q)I
0 LAU . LwJN
a ,- 0
''0
0~z 0
zH CA
-37-

NL CO CO .O C - -:- .
w w- U -( O CO i 0' wO - Q O V' 0 It N. en~ M~ in N -
0 10 Lf a, 0- N 0 1(1 'ON CO N C) 'o 0 'TN o
t- r- m It Ln Ln LrA r- i 'D a) mA LnA .0
o' o0 0 0; c; C C OO '0 c0 '0cC0c; C C'
0000 00000om r 0 00 00 10 0000 mC-
2 ~ ~ ~ ~~~~~C H; N; N A I 0 ' n N N C C O' n a O N
M ~ LA 'ON CO m8 10 w N N' r- ' L fl ' L A '
cH 00 0 00 0 0 00 00 0
C fC
00 0 00 0 0 00 00 00
C I
I 0 0 0 0
0 CO CO8-

-. 0 00 'D LA) LA r- L) U) UlA LfA N 0 0 r- %D v '00 r- r- N- N - - - N N N- N- N- N N
;s r m y, so *n 0 * U *%0 00 0D 0 r - r- 1 c- W4 0 0 0
'~~~~'C~C ~ ) a . 0 ' 0 N o '0 C;)a'.
od ~ . 0 00 c -. 0000 v 0 00, 00 , M00-r
-tN f Lf c'o 'D C- LA t LA '0 0) qLr he) 'C N 0 C 0 r
.0
m -0 Z000'D00 m 00 0 0 0 00 CV 0 0 0000 a
0
- 0
0000 ) 0 0000 00 0 0 0 0
0
Hu M
0' LA a0 'n0 '0 O O
S -
-44
mI' ' L
-39
N L ~ m LA 00C LA) m .
*. 0 0 ; 0 C; . - - .
(1) 4 cn m LA C* cn 0 D 0 m LAn O- 1- 0 cn a, ULA 0 0 11 a, 0 0 n r- N 0 a, 0 N
'0 mA I- r- r a N N c .- N m( N N N N C",
Q 0 0a0 0 0 0 0 0j 0l 0 0 01 0 0 0
0 0 0 0 0 0 0 0 0 o 0 0 ; 0 o
C; C)
0
d o N v a
-NN N N m~ mf 0 m~ m LA N N N N NId 4- 1
0 N0 a
0. 0 0
LA 4- 0 0a0
ca aIeQ I i2:: -

0> r'. , N V 0 %C mA '4 N Vr %0 w -,cim m "N N m00 "~ 000
104 ~ r o ~N ' 0 It 0' ' M. LA N' V
C4 r- (7- IT0N~4 e ~ C 0 as It4 a, C
a) 0 .0.
-) 00 0 000 0000
00 0 00 00 00 0
0
.- 0 C.) -f- U4
* N N N 4 4. N -4
0)-
0 U 0 00 0 00 0 00
00At-
.- 0 AL.

'0 0 0 (7 I) ID o a A c~.. a ~ N L
- - a -n -7 -- o, -f -- on 0 -4
r' a c ' CO ' C" O % 1 0 C O L
0> 0) 0 0 0 0 0 0000D0 0 0
H NO f- a, %AD C) rN O '- o 0 en -. 0O~ NU-LA LA LA LA .4 Ln LA LA LAO L ' 'o N r LA
0
-j I
00
* 0 oc 00 0
Q) cr1
(L) - 4c- . x
II -
-4 -
100
0o 0
8-42

( ) 'Lj) a, rn e r r) c N 00 Ifl U) 0,
aWj Cl co oaa o (4 n 4
;>r 0 , 0 r -4 Lfl Ln OD C Ln 0C) 'D 0 cl)
0. Ln LA) '0 0' LA '. - n r-
0) CIAL 1 -. . . . a * * *
C; c-; 000 00 000 00)C)0 0
V f o 4- N LI - Ln 0 N
C) 0 NO"0; C C; C;
LfA
c - - r 0 a, C, 10 a' N LA 't (7 0' e) 0) Y) D
41 o C ) 0 (-' An 0' -z ., .1 4 N n Ln
00
44 C) CV 1
-4
uC 00
1-4 - 4H
0-r 0 0 0, 0
N_81 a, a, a' a
44-
14 V) LL)
w4 .I z C
-43-

t- P- r- N- N 0 " ID
en4- 00 0v) 0000 0y -0
N 0000 00 00000- r 0 0 0010
;>3) 4 r - e t - .. i N N N n v v) v n
000 00 00 0 0 - t 0 N00
'0 Ln t- 0 LA LA LAO U) D r- N- t- t- t-
*o 1.0 0 0 0 000 %00 r- r
00C
Q) U n LA 1- LA r- t Lm e n a,Ln l- Nn 0 0m V' 0w N- f- vA N N
w N- C; C; 01 , C 4
00 10 r-a 4 0 n t - a
In v
~ o0 0 0
en a, a,
o ;. 0 a,
0 .
41 s-4 -
V
m -iLf) LA LAl a,
F-4 0 a,8
00LA H 0 0
100
-44-

N 'C 7, o r 0- ol "r, 0 ' 'o D 0 0 N t- t-
Ln ~ N - L V U)0 (71 m D -0 N CN
'0 00 0 00 *0 0 0* 0 c ~ 44 04 0t i0 0
0 0 0 0 0 00 000 0000COlt) f (1I 00 Y
vn 44 N f %D vO It %0 LI) m0' i'N N
C; C C; C; C; CO 0'- 0~i . 4
ca NN
0000 0000 0 0 0
u Hi 0 0 00 0 0 00
-4 -4 - 4 4 - - 4 -
-0 u UrI 00 00 00 00 0 00 0
z 0 .. oZ c
'0
t:) -
r4
-4-45-

0 , (7O' N . 0 %000 r- I- r- N N r- N0
fq- eq0
00 en m~L 00 m 00 .4 a,0 %D LA 0' .4 cnI n LA'00 % 0 L An %0 mN -4 N .4 N a
- o .4 .n t- 0*
0 o a ,
'o00 -4 N a, N t- . 0 d v a 0' N , 1'0
~C C; C O
0 Lc)
M~ M00 00 00 0- 0,() ~ 00 00 0 f
0 0 CDLA L
C *
(1) 00 0 00 0 00 0 0
00 _00
~L)
P.. '
F4 0 nNL)0
.4 C 0
.1 0 000 r4
'-44
0 0
1-4 'I CO-46-

0 LAn 00 r- a, 0 It % -4 00 r- (1 ON 00 N N-0 a, w0 w' ' cy C) W N M r
.D
4) 0 c) - 0,N 00 a'N, r- 'D 00 N o0'o 0 a-'DO;> - 00 LA) lw LA) Or- N 0'O %0 LA LA a' N -4 a,
%0- m .0 % a 0 mA L D r- w) a'0 1 %D r-c w O
-n 000 0 0 0 0 0 0en- 00000- o
DI~ N NO q~ 0 o Niqt N No D. a'-" N N(Y e LA '0 N m m~ v4 v* mA ' V* V4 LA %0 N-
qw LA , N N LA It a 0 c' N UA NO- LA'I M -CwN 0enr a4 N 0 ecn %0 %D
Ul L LA)s-- C0 %~'0 0 0 m LA N %0 Os%0 LAE O aN~'~ N N * c) 00 e I- LA
0 O )000
0 r '"0 $, LO0
S.0 0 'U ) O uLAa0) 1:4 0 )
C)
NN
zI N
H -47-

00 co %0 0 LA ' N -
so'o'0C en' 0- .- D .1 4C ~ ~ 0 0 m ~0 0 0 0 o m c t4 L) MA %0 Ln mA 10~O O'0.
I 0 -0 0 c Ln N - inL 0 %0 0', N v mA ULA t 0'0~L %0''DO 1-C AO0 L 10 4 'N N N N N cn
.4 0 000 00 00 0 0 0000( D(nr Cc 00 0
%0 1 A0 00 0 L A 0'0 0- U) % L0 N n m m n
0000 0 00 0 00 0 0 0
r-L C LA cn vt N co N LA Co u) LA 01AiA
LA~' .j mL LA %0 mJ EI' U)4 m~ A~' L A L Ln LA
LA LA N 0O cA Nn 0 NAC N'CO 0C
00000 0 0 00 0 0 0 0 00 000
U0
ODA L ~'L 4L A ''~1 A L AL 0 0 00 00 00 0
0 -
LAn
0 .2t0I)lf V)ccc
8 U -4
z. '-4
-- 48

C)~ Nae' cn m m CI I. . i 4 ON-4 W r-n WI n m v4 N N 0 o-4 ~'D in
w4 w4 o 00 00 t - f- - 00 00 0 0 0-
a, N r- 0 0 m in OD '0, N0O' N 'D
N N -4 .- 4 4N I- CO'
N ~N .' n m00c O a,0' 40
[-40 4 'D0 N m' m~ mV c- '.0 N- m' 4 ''N N- N in 0 0 U) C% N N- a, r-0 in N
N0 F' 0 0 0000 r naV %0 00'00 0
-~0
00 0
00
'4
0 c
u~ oa,
u F 4
-- 4-

-4 -4 0 0) v'f v lI D 1
4A C;C; C C; C;O CoC C; C; c; C; oC
000 0oC-00 000 0000r , ar
No 1 * a' 00 LA W CON Ln m aO"0 N L s'Q Ln r 00oO'1
cn0 r- 0 0 D N '0 NM
a, en P, N 6'.A 'm m I0 - r- ID N
CCV
-4)
0 >
00 0
U))-4< I0Cit co) 00
(u 000~L
0'
aj4
it
U)n
-0
O' 3 a~ 0 ' 'D N N o, r- a'o oa~ w -4 N -4Oa 0 .4 0 ' Lf) O 0
44
iN~ % O0O 0-.O 0~0 00
Z>~~ Ln 4 L~ -4 0' 00-~J cn ILn t- Oi0 Ln 1 D r- ooa u, L 0r- r- IfL*nl '3'3'%03'31
m~ tn 'z a, m4 q 0 , enC LA mY Nq am r~- a,
0000 0000 0 0 00
W~~~' co OaL O'tn' 0 tm00'a-v a N 1'
oJ 00000 00 000 000 000
0 M omI In L ) W 0 N
0 0 . 0 LA LA . 0 ON IA 0 . . N
Do C00000 0 00C>0 0~; 0 0 0 o
0
co0 0
II u
4
-4 0) 0004
I LA
u r.;
040
00 a , a,
ooL

0 o L) m N- a, - (l 0 LA t-C-4 C a O - a'O -- 4 0 00 t-a' N, a'a a 00 r'- N
-4 - N N(mN 00 a a% 0'' aaaa 0, ,Ca
--- -D 0 0 - 0 - 0 - t-00)0 0 0 0
N .-n . 0y N r- NO ON r- % -a N v 10 a, v N- a, N N-
'. LA a, 4) C 'D C) re N '.0 N o a'N 000 N W %0 0 N
0. 01 *; C
~~.'f 0 0 0 0 0 0 0 00 000 0'
00 00 0 00000 000000
0) cn 0n (4 'D ce) 00 - en~ 00 N LA O - - Lve v~ ~ LA n ~ LA n e Ln Ln Ln 0'.0 o LA LA) L)'.0'.
00 00 0 00000 000000 r
0
0 - 0'
000000000000 00 00
-44
'0 %
4 4j x
L) 4N
*0~ P.
en H0H~ 13i N
I -520

en - 0 0I00 -4 00 m~O %o% In oCD 1' %0 r'n N v4 Ml gflO N 0
0 N N 00 00000-
-4 -. ~ 00 0 N 00 00 So L7AI
-o 04 0n Nn N fn N 000
N N ' NIn %-4 fn L
-4a -n a -n -n 0 0%
000
oH
0 0 0
0 N0 N0 CO-0 0OL
-n 0 4 0
1.44
4- 0 N LA W na% I N
Ha UI
a) 0.. * .
0 ~ ) L ~U)
.- ; 0 0.0 140~-4-
-4% 0-4-4V) 0 ' -4- 4
a) 0 4 I4
(u
0 04 C4 0~ 4.J
z . P- .-
H00 0 0U) 8 C 00 m 1
0 '. 4.8
1-4 0) > >M n 0 C'-H0 >
0
-53-

v a, o~ Nt- -0 NN
0000
Hn a, if -- D
N00 L
~ fl~ 0 fl 14 0' .r- - 0 0 0 0;C, c 0
.E P. 0 0
CU - 0 i-n 0, a' c
- C C)
C) 0n C) -" 0 c a, N0
"' :D .) N) 00 N c'
0 Q)N 0 . W -- , L)r
0 m tnC ) t - ao
(04 d ' 040'
fl~inN 0l o., i -
0 o C:) Nf D. N
C a [.C~00
~sI9 * 8-54-

II) 0 A .0 LA r
00 * o 0 ,, 04 r- r - o I
cc- 0- 0 -co. .0
Cc I" I
0~ 00Ad
N H c c Lt '0 '. 00L
Q) a4 o~ 0 'o C'-0 (D o'-
H 00
(Y) rriN L))
.Z 0U)~ .U N ,
-4 '-
~ o~]~0000
Lf - s '
-5N 5--
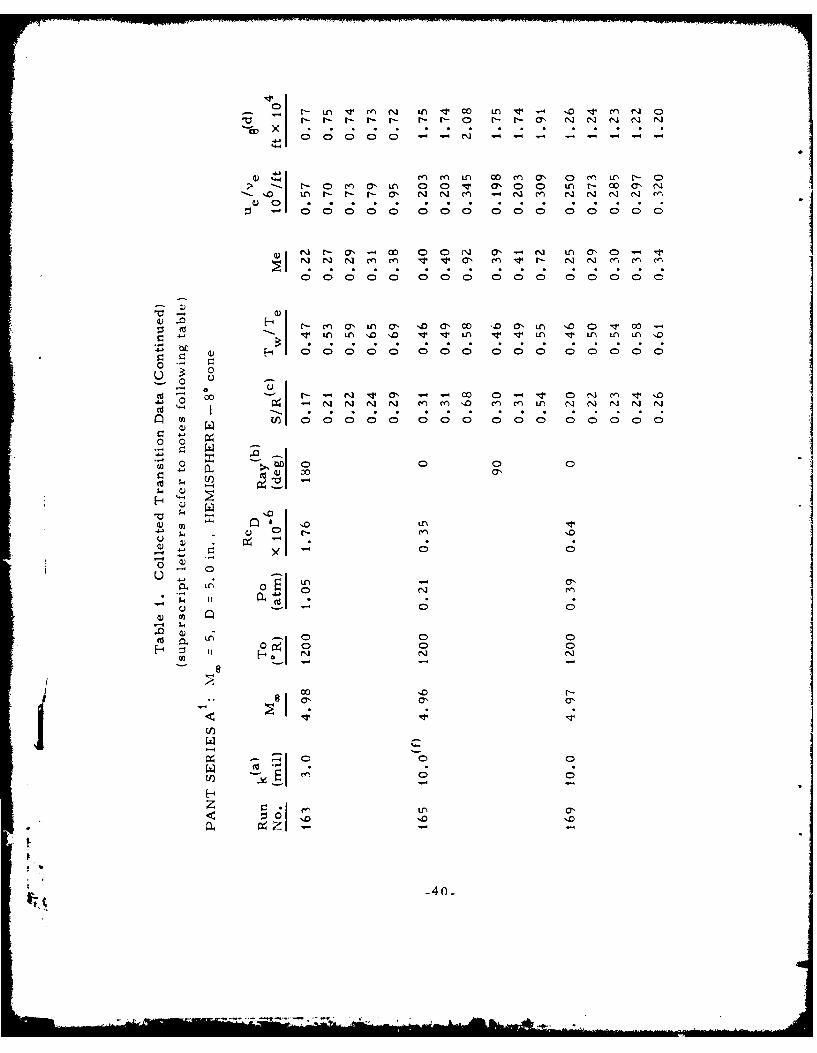
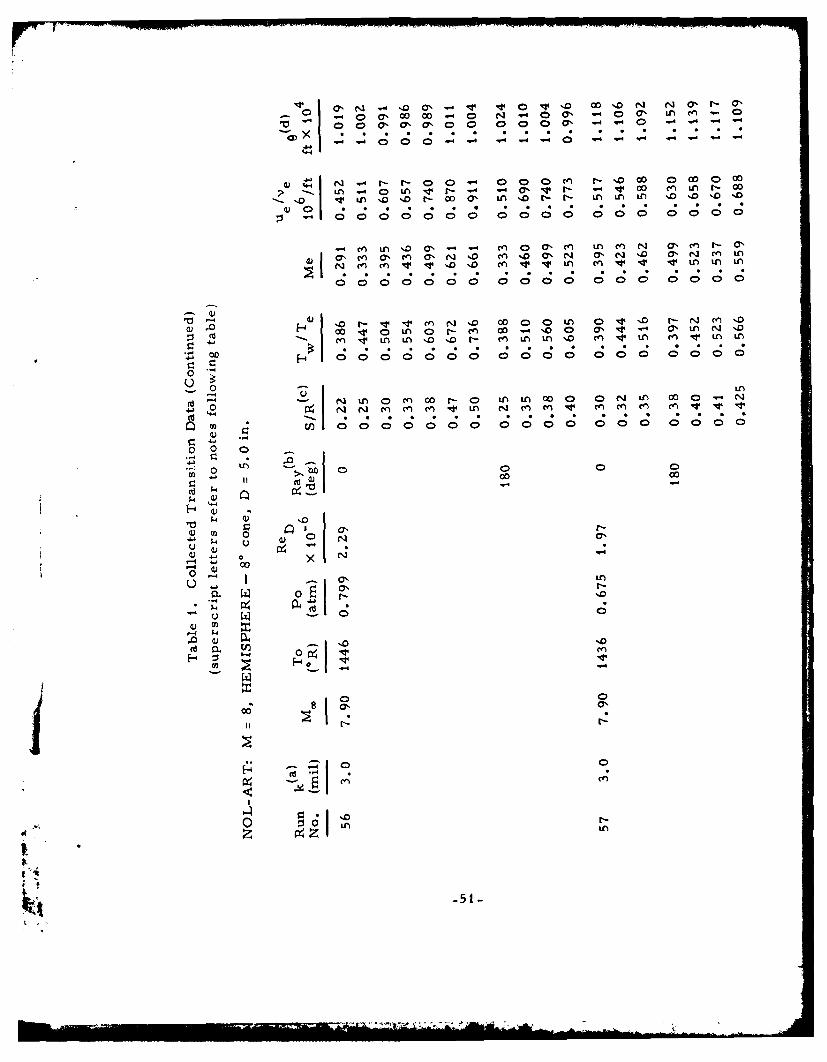
NOTES ON TABLE 1
General
For the sake of brevity, detailed discussion of the experimental
procedures used in each reference has been avoided. However, some gen-
eral observations should be made. For consistency all of the data reduc-
tion, except where noted, has been done by Aerotherm/Acurex. This
includes all of the PANT and ART data. The same test models were used
in both of these series. A detailed summary of the PANT series is given
ir Ref. 19 as well as in Refs. t and 2. In most of the data used here the
point of transition was determined by extrapolating the turbulent heat trans-
fer coefficients or Stanton numbers back to the laminar distribution for these
quantities. The intersection of these two curves was taken as the point of
transition. Heat transfer coefficients from most references were obtained
from backface thermocouples on thin-walled calorimeters.
Notes
a. The roughness height used is that peak-to-valley (PTV) value whichon a roughness distribution curve is greater than 8516 of the rough-ness elements, k8 5 (see discussion in text). For uniform, (narrowdistribution) manufactured roughness, k 8 5 is approximately equalto the average PTV value and this latter value was used in thesecases. In references where only the rms roughness height wasreported, the correlation PTV = 4 X rms was used. This corre-lation is discussed in detail in Ref. 19.
b. For the PANT series A tests, backface thermocouples werelocated along three rays on the body at 0*, 90", and 1800 from thevertical. Only the two best rays of data were reported in eachcase.
c. S/R denotes the location of transition in radians. All local condi-tions are evaluated at this point.
d. This is the "smooth wall" value of momentum thickness. Exceptwhere noted, it has been calculated by Aerotherm/Acurex using theBLIMP code and a Sutherland viscosity model with F1 TO. 7 .
-57-
e. These roughnesses were formed by grit-blasting.
f. These roughnesses were formed by brazing spherical copperparticles to the calorimeter.
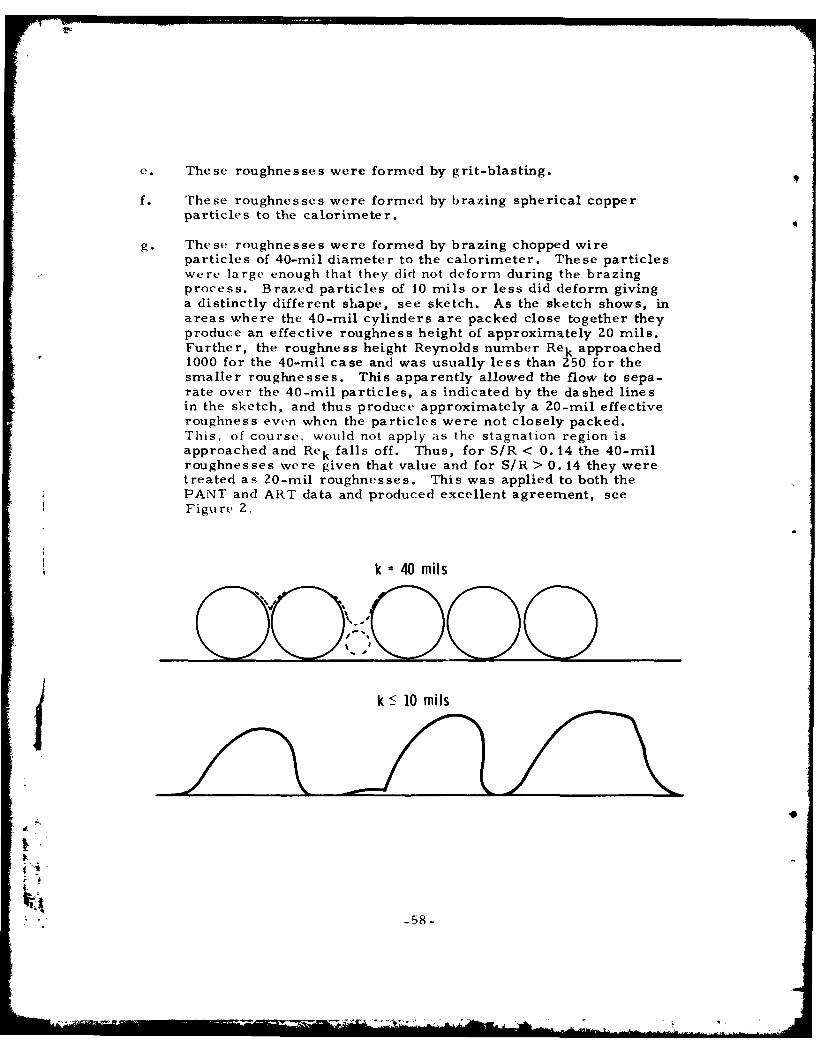
g. These roughnesses were formed by brazing chopped wireparticles of 40-mil diameter to the calorimeter. These particleswere large enough that they did not deform during the brazingprocess. Brazed particles of 10 mils or less did deform givinga distinctly different shape, see sketch. As the sketch shows, inareas where the 40-mil cylinders are packed close together theyproduce an effective roughness height of approximately 20 mils.Further, the roughness height Reynolds number Rek approached1000 for the 40-mil case and was usually less than 250 for thesmaller roughnesses. This apparently allowed the flow to sepa-rate over the 40-mil particles, as indicated by the dashed linesin the sketch, and thus produce approximately a 20-mil effectiveroughness even when the particles were not closely packed.This, of course, would not apply is the stagnation region isapproached and Rek falls off. Thus, for S/R < 0. 14 the 40-milroughnesses were given that value and for S/R > 0. 14 they weretreated as 20-mil roughnesses. This was applied to both thePANT and ART data and produced excellent agreement, seeFigure 2.
k 40 mils
k 5 10 mils
_58-

h. A 5.0-in. nose radius on an 8* cone having a 5.0-in. diameterat the sphere-cone juncture (shoulder).
i. For geometry see sketch on Figure 6.
j. This shape is designed to simulate a stable laminar shape, seesketch on Figure 6.
k. Roughness formed by molten copper spray.
1. Taken from Ref. 1.
m. Tw estimated at 530 0 R, personal communication withJ. C. Dunavant.
n. From Ref. 1, based on estimated wall temperature.
o. Roughness ranged from 2 to 4 mils (used 3 as a nominal value).Method of producing roughness not given.
p. Hot wire and pitot measured points of transition coincide.
q. Mirror polish.
r. Obtained from Ref. 20.
s. Obtained from Ref. 21.
t. JANAF base state.
u. Obtained from measured pressure distributions, Ref. 23.
v. These values of 0 do not include blowing.
* 5t
.....- 59-
Recommended