Hepatotoxicity of Antiretroviral Therapy Liver friendly ART: fantasy or reality?
Martin Fisher Brighton and Sussex University Hospitals
Brighton UK

Outline
• Methodological issues in defining hepatotoxicity
• Summary of pathogenic mechanisms • Summary of “conventional” ART • Newer ART agents and available data • Approach to patient management • Fantasy or reality?

Background • Antiretroviral therapy has dramatically reduced HIV
associated morbidity and mortality – Opportunity to reduce onward HIV transmission – Guidelines recommending earlier initiation
• Toxicity has emerged as one of the leading causes of
HIV related morbidity, mortality and treatment discontinuation – Toxicity the major reason for hospital admission1 – Hepatotoxicity the most frequent (30%)1 – Hepatotoxicity historically 3rd most common reason for ART-
toxicity related discontinuation2
• High rates of HBV and HCV co-infection likely to increase risk of hepatotoxicity
1Nunez et al, AIDS Res Hum Retroviruses 2006; 2Fisher et al, in press

Difficulties in defining hepatotoxicity
• Clinical endpoints rarely used – cf cardiovascular end-points
• Definition of laboratory abnormalities vary from study to study – Usually ACTG criteria, but – May be modified according to baseline values if elevated – Definitions of Upper Limit of Normal vary between labs
• Definitions of HBV and HCV co-infection vary from study to study – HBV: sAg positive or eAg positive – HCV: antibody positive or RNA detected
• Incidence versus prevalence
Defining Hepatotoxicity
Grade 3 toxicity
Grade 4 toxicity
Normal
Grade 1 or 2 toxicity
ALT or AST
ULN
1
5
10
0
ULN →
‘Severe hepatotoxicity’
ULN, upper limit of normal

Defining Hepatotoxicity ALT or AST
ULN
1
5
10
0
ULN →
‘Severe hepatotoxicity’
ULN, upper limit of normal

Defining Hepatotoxicity ALT or AST
ULN
1
5
10
0
ULN →
‘Severe hepatotoxicity’
ULN, upper limit of normal
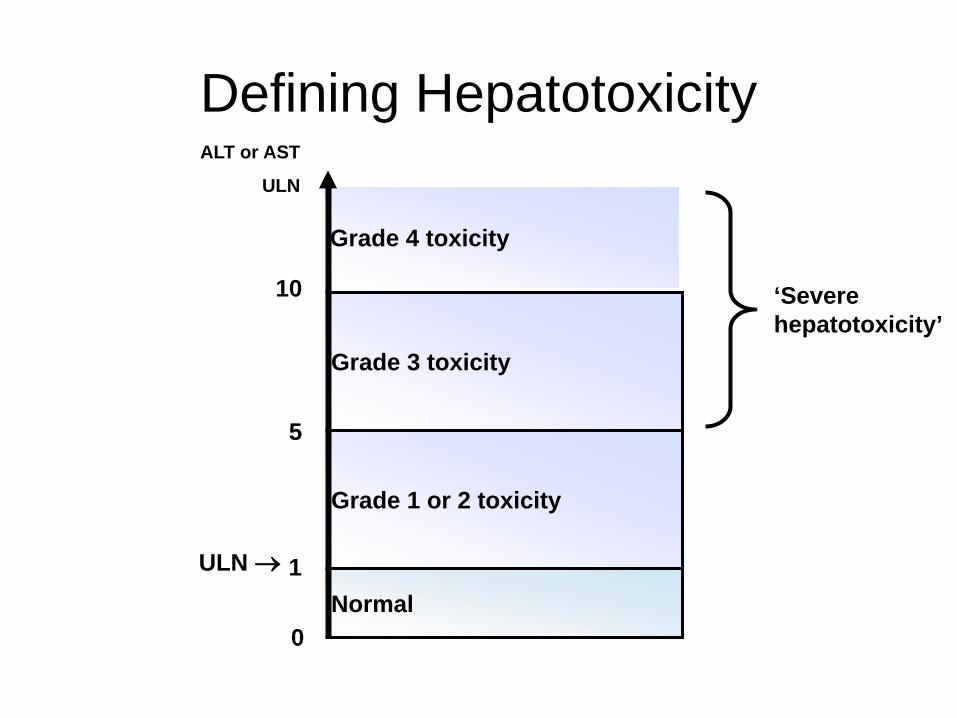
RCT evidence of hepatotoxicity
• Randomisation allows comparison between arms; differences due to chance
• Detailed data on adverse events • Regular and pre-specified monitoring
• Short duration of follow-up • Clinical trial patients not always representative • Co-infected patients or patients with higher baseline
LFTs or at higher risk often excluded
• Incidence rates likely to be underestimated

Observational data of hepatotoxicity • More representative of patient population • Longer-term follow-up • No exclusion of “higher risk” patients
• Reasons for treatment allocation unknown (possibility of
confounding bias) • Differential follow-up and monitoring patterns • Complexity of previous treatments difficult to capture • Possibility of recall bias in retrospective studies • Wide variation in rates of co-infection between cohorts
• Incidence rates may be overestimated

• ULN of AST varies 35–57; ALT 31-40 – Grade 4 AST therefore varies >350 to >570 and ALT
310-400
• Co-infection rates in cohorts vary from 4% to 13% (HBV) and 8% to 52% (HCV)
• Incidence/prevalence rates of hepatotoxicity vary from 1% to 29%
• If define hepatotoxicity by 2x abnormal ALT/AST decreases incidence by 50% After Smith and Sabin, Antiviral Therapy 2004; Sabin JID 2004 ; Bansi, JAIDS 2009

Attributing cause for abnormal LFTs
Opportunistic diseases
Alcohol Recreational Drugs
Other treatment
Immune reconstitution
Hepatitis virus Co-
infection
HIV treatment ? Drug X ? Drug Y ? Drug Z
Other co-morbidities
Fatty Liver Disease

Mechanisms of drug-related liver injury in HIV-infected patients
Mechanism Direct liver cell stress NNRTIs, Tipranavir
Usually within weeks Metabolic (steatosis)
PIs (?associated with NAFLD) Months to years
Hypersensitivity NVP>ABC>fosAPV Early, usually within 8 weeks Often associated with rash HLA-linked
Mitochondrial toxicity NRTIs ddI>d4T>AZT>ABC=TDF=FTC/3TC
Immune reconstitiution Chronic Hepatitis B Within first month More common if low CD4 count/large rise
After Soriano et al. AIDS 2008; Nunez Hepatology 2010; Surgers 2013

Associated Risk factors for hepatotoxicity of ART
• Hepatitis B and C co-infection – Genotype 3?
• Higher baseline ALT/AST levels • Alcohol • Older age • Female gender • High or low CD4 count • Lower BMI • Use of ddI, d4T, NVP, RTV (>200mgs/d)
Rodriguez-Rosado et al. AIDS 1998;12:1256; Sulkowski et al. JAMA 2000;283:74.;
Saves et al. AIDS 1999;13:F115; den Brinker et al. AIDS 2000;14:2895;
Martínez et al. AIDS 2001;15:1261; Núñez et al. J AIDS 2001;27:426.

Nucleoside RTIs (NRTIs) • Inhibition of mitochondrial DNA
– “d” drugs: ddI > d4T = ddC > ABC = TDF = 3TC = FTC – Hepatic steatosis +/- fibrosis – Rarely lactic acidosis syndrome – Weeks to months
• Abacavir hypersensitivity
– B*5701 highly predictive – Days to 3 weeks
• Non-cirrhotic portal hypertension
– ddI – Months to years
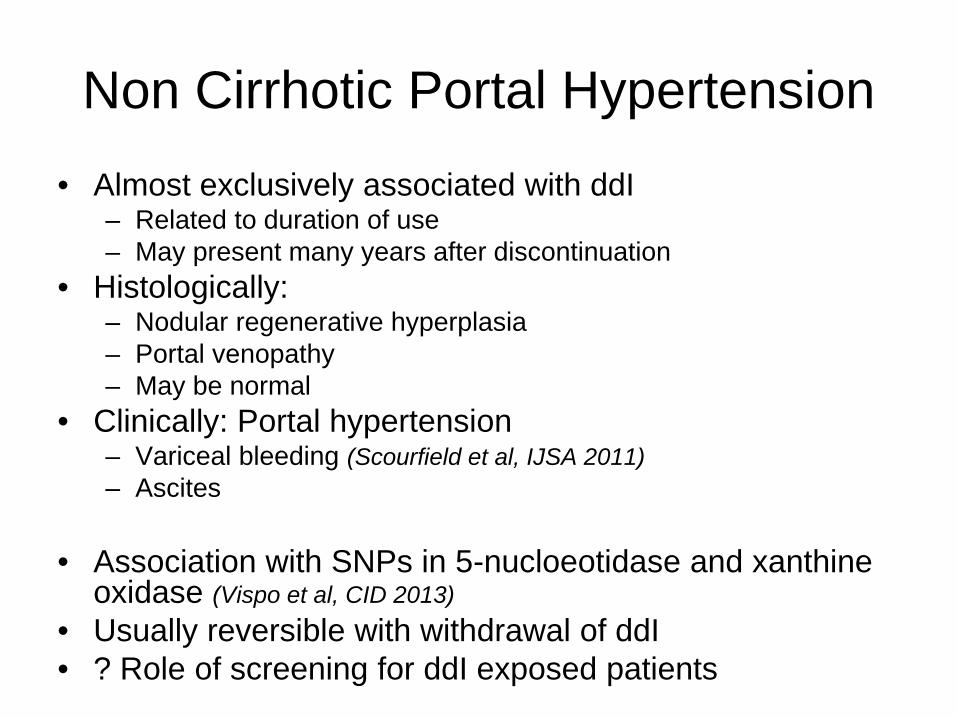
Non Cirrhotic Portal Hypertension • Almost exclusively associated with ddI
– Related to duration of use – May present many years after discontinuation
• Histologically: – Nodular regenerative hyperplasia – Portal venopathy – May be normal
• Clinically: Portal hypertension – Variceal bleeding (Scourfield et al, IJSA 2011) – Ascites
• Association with SNPs in 5-nucloeotidase and xanthine
oxidase (Vispo et al, CID 2013) • Usually reversible with withdrawal of ddI • ? Role of screening for ddI exposed patients
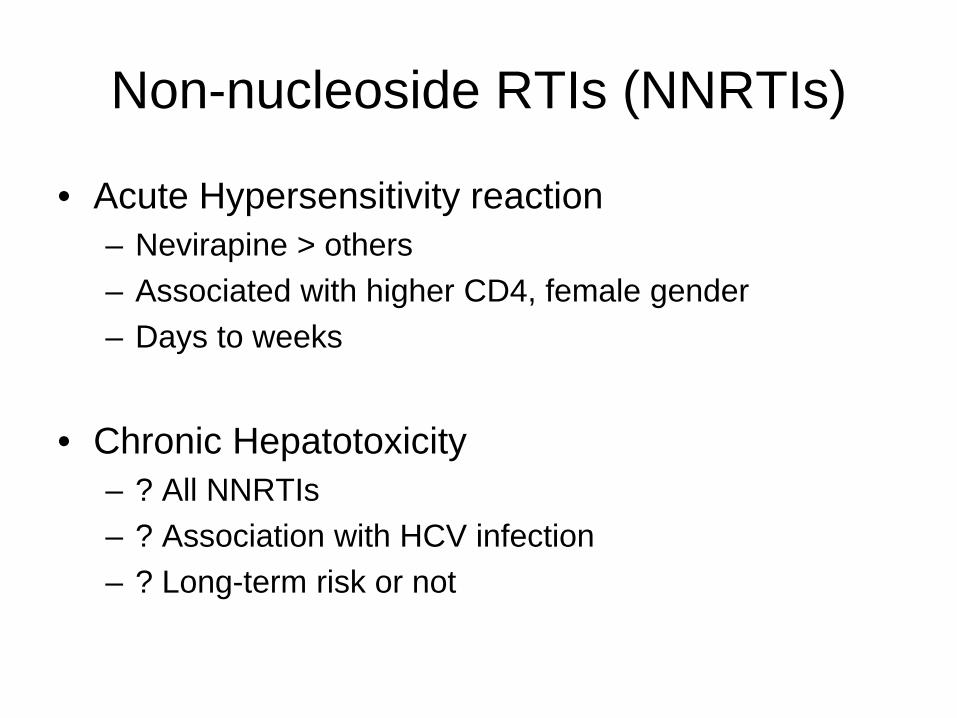
Non-nucleoside RTIs (NNRTIs)
• Acute Hypersensitivity reaction – Nevirapine > others – Associated with higher CD4, female gender – Days to weeks
• Chronic Hepatotoxicity
– ? All NNRTIs – ? Association with HCV infection – ? Long-term risk or not
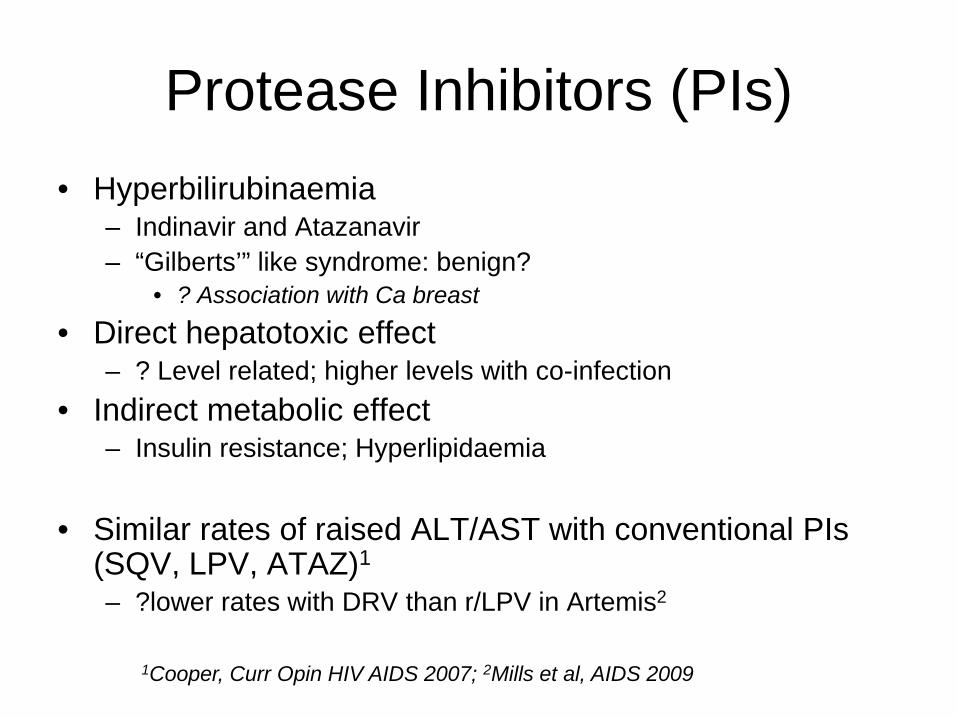
Protease Inhibitors (PIs) • Hyperbilirubinaemia
– Indinavir and Atazanavir – “Gilberts’” like syndrome: benign?
• ? Association with Ca breast
• Direct hepatotoxic effect – ? Level related; higher levels with co-infection
• Indirect metabolic effect – Insulin resistance; Hyperlipidaemia
• Similar rates of raised ALT/AST with conventional PIs
(SQV, LPV, ATAZ)1 – ?lower rates with DRV than r/LPV in Artemis2
1Cooper, Curr Opin HIV AIDS 2007; 2Mills et al, AIDS 2009

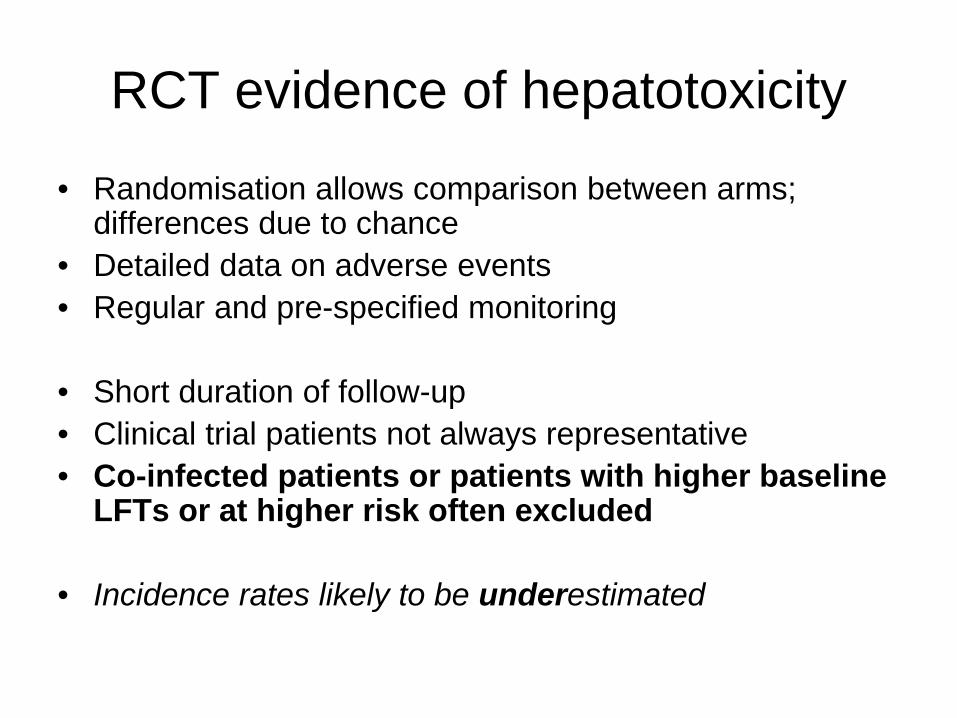
Caut
ion
Safe
ddI d4T
AZT
3TC FTC
ABV TDF
NRTI NNRTI
EFV
NVP
PI
SQV NFV
ATV LPV
APV DRV
TPV
RTV
Entry inhibitors
T20
Integrase inhibitors
Boosters
RTV
After Soriano at al. AIDS 2008; 22: 1-13
Hepatic Safety Profile of ARVs

Rilpivirine • Naïve patients (ECHO and THRIVE)
– RPV vs Efavirenz – HBV 4% and HCV 5% co-infected – G3/4 ALT 2% v 3%: AST 2% v 2% – In HCV co-infected: similar rates of d/c 6% v 9%
• But LEE rates 27% vs 4% in HCV- for rilpivirine
• Experienced patients (SPIRIT)
– RPV vs r/PI – No significant difference in LFTs
Cohen et al Lancet 2011; Palella et al, IAS 2013
1 case of DILI reported; Ahmed 2012
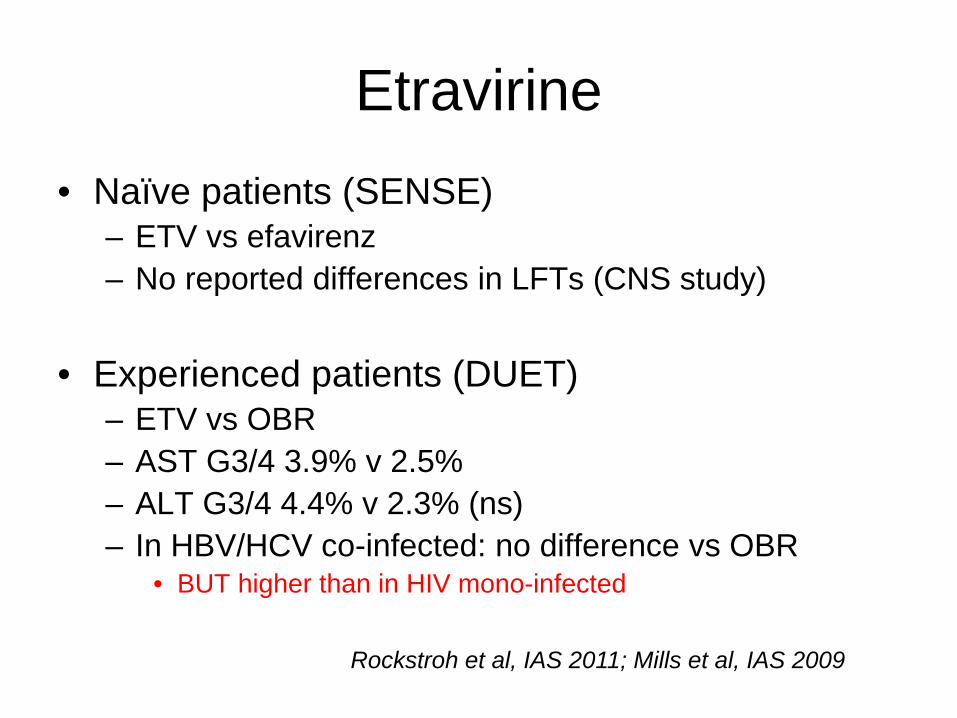
Etravirine • Naïve patients (SENSE)
– ETV vs efavirenz – No reported differences in LFTs (CNS study)
• Experienced patients (DUET)
– ETV vs OBR – AST G3/4 3.9% v 2.5% – ALT G3/4 4.4% v 2.3% (ns) – In HBV/HCV co-infected: no difference vs OBR
• BUT higher than in HIV mono-infected
Rockstroh et al, IAS 2011; Mills et al, IAS 2009
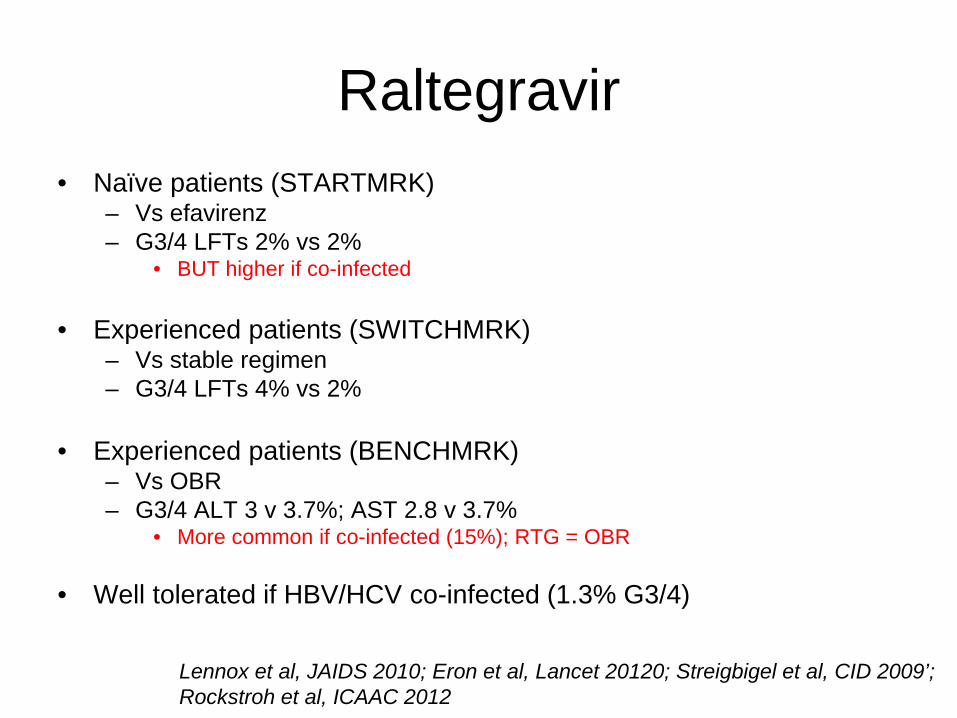
Raltegravir • Naïve patients (STARTMRK)
– Vs efavirenz – G3/4 LFTs 2% vs 2%
• BUT higher if co-infected
• Experienced patients (SWITCHMRK) – Vs stable regimen – G3/4 LFTs 4% vs 2%
• Experienced patients (BENCHMRK)
– Vs OBR – G3/4 ALT 3 v 3.7%; AST 2.8 v 3.7%
• More common if co-infected (15%); RTG = OBR
• Well tolerated if HBV/HCV co-infected (1.3% G3/4)
Lennox et al, JAIDS 2010; Eron et al, Lancet 20120; Streigbigel et al, CID 2009’; Rockstroh et al, ICAAC 2012

Vispa et al Madrid Cohort analysis

Maraviroc • Naïve Patients (MERIT)
– MVC vs efavirenz – HBV and HCV co-infection rates not stated – G3/4 AEs 3.1% vs 3.7%
• Experienced Patients (MOTIVATE)
– MVC (bd vs od) vs “OBR” – G3/4 AEs (3-4%) similar for MVC od, bd, PBO – 6/34 (18%) v 1/19 (5%) with HCV had G3/4 transaminase elevations
• Maraviroc studies in patients with HCV co-infection to ?slow disease
progression
• (Aplaviroc discontinued due to hepatototoxicity; ?CCR5 deficiency associated with hepatitis)
Cooper et al, JID 2010; van Lelyveld, ExRevAntiInfectTher 2012; Wasmurth, Ex Opin Drug Saf 2012
Recent case of DILI

Cobicistat
• Naïve patients (Study 105) – TVD + Atazanavir with COBI or RTV (Blinded) – HBV and HCV co-infection excluded – Grade 3/4 hyperbilirubinaemia 63%v45% (ns) – Transaminase results not reported, but no overall
difference in d/c due to AEs • Naïve patients (Study 114)
– TVD + Atazanavir with COBI or RTV (Blinded) – HBV 5% and HCV 6% co-infected – higher rates of hyperbilirubinaemia with COBI – G3/4 ALT or AST 3% vs 2%
Elion et al; AIDS 2011; Gallant et al; IAS 2012

Elvitegravir (“Stribild”) • Naïve patients (Study 102 and 103)
– Versus efavirenz or r/Atazanavir – 1% HBV and 5% HCV co-infected – 2.3% G3/4 AST v 5% v 6% – 1.4% G3/4 ALT vs 4% v 3%
• Experienced patients (Study 145)
– Versus raltegravir – 5% HBV and 13% HCV co-infected – More G3 ALT (5%v2%) and AST (5%v1%) with raltegravir – Liver AEs leading to d/c: 1.7%v0.8%
Zolopa et al, CROI 2013; Molina et al; LancetID, 2012
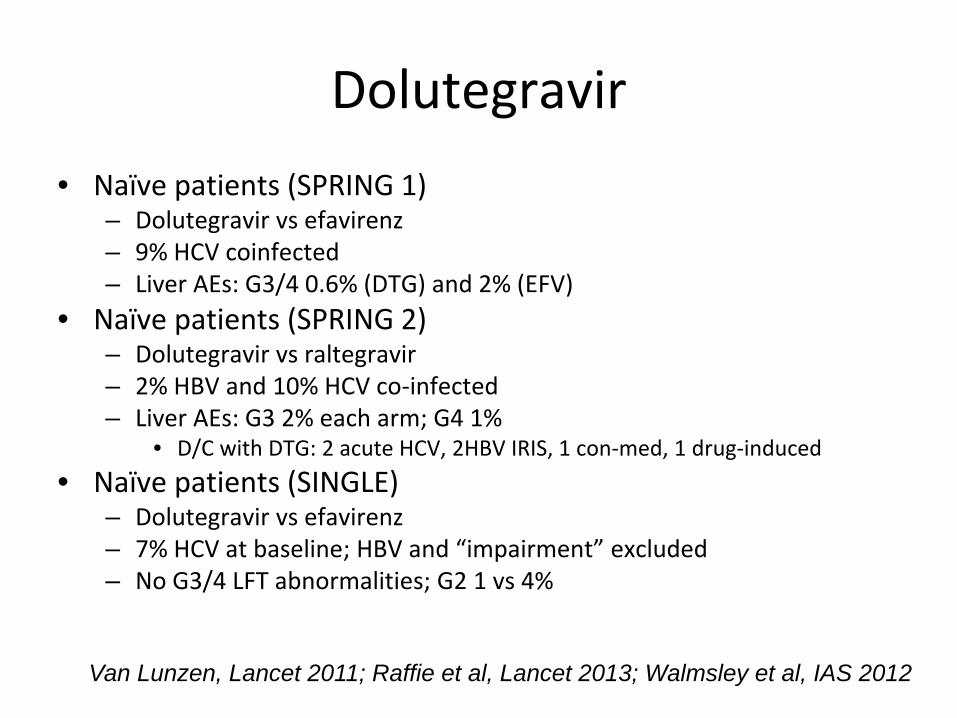
Dolutegravir • Naïve patients (SPRING 1)
– Dolutegravir vs efavirenz – 9% HCV coinfected – Liver AEs: G3/4 0.6% (DTG) and 2% (EFV)
• Naïve patients (SPRING 2) – Dolutegravir vs raltegravir – 2% HBV and 10% HCV co-infected – Liver AEs: G3 2% each arm; G4 1%
• D/C with DTG: 2 acute HCV, 2HBV IRIS, 1 con-med, 1 drug-induced • Naïve patients (SINGLE)
– Dolutegravir vs efavirenz – 7% HCV at baseline; HBV and “impairment” excluded – No G3/4 LFT abnormalities; G2 1 vs 4%
Van Lunzen, Lancet 2011; Raffie et al, Lancet 2013; Walmsley et al, IAS 2012
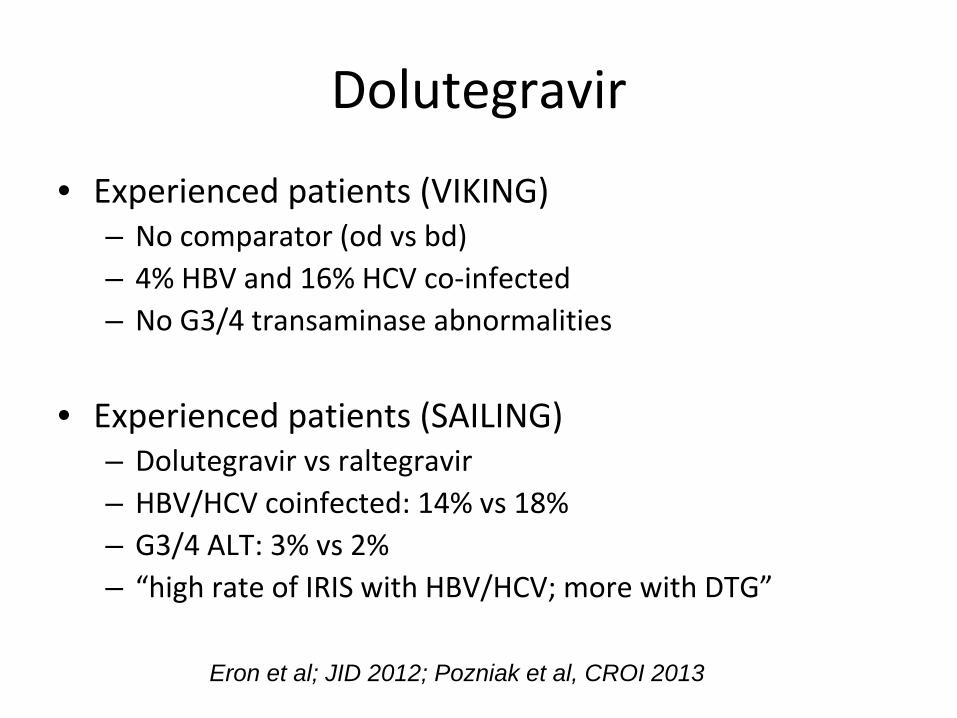
Dolutegravir
• Experienced patients (VIKING) – No comparator (od vs bd) – 4% HBV and 16% HCV co-infected – No G3/4 transaminase abnormalities
• Experienced patients (SAILING)
– Dolutegravir vs raltegravir – HBV/HCV coinfected: 14% vs 18% – G3/4 ALT: 3% vs 2% – “high rate of IRIS with HBV/HCV; more with DTG”
Eron et al; JID 2012; Pozniak et al, CROI 2013

Caut
ion
Safe
ddI d4T
AZT
3TC FTC
ABV TDF
NRTI NNRTI
RPV
ETV
EFV
NVP
PI
SQV NFV
ATV LPV
APV DRV
TPV
RTV
Entry inhibitors
T20
MVC
Integrase inhibitors
DTG RTG
Boosters
COBI
RTV
After Soriano at al. AIDS 2008; 22: 1-13
Hepatic Safety Profile of ARVs
ETG

Starting ART • Benefits >> Risk
• Be aware of patient status
– HBV/HCV status – Baseline LFTs – Other co-morbidities – Other concomitant medications
• Caution with patients at higher risk for
hepatotoxicity – ?shouldn’t alter decision on when to start
See Cooper, Curr Opin HIV AIDS 2007

Monitoring ART BHIVA Monitoring Guidelines: • Full baseline LFTs • Repeat transaminases after 1 and 3 months • Then 3-6 monthly once established on ART
• If commencing nevirapine: • Weekly for first 2 months
• Consider closer monitoring if HBV or HCV co-infected • ?role for therapeutic drug monitoring if hepatic damage
Asboe et al, HIV Medicine 2011

Managing abnormal LFTs • Repeat specimen to confirm
• Include alkaline phosphatase, gamma GT,
albumin and INR to help determine aetiology
• Check for other co-infections: acute HCV, syphilis
• Check for other medications (including unprescribed)
Asboe et al, HIV Medicine 2011; Walker Curr Opin HIV AIDS 2007
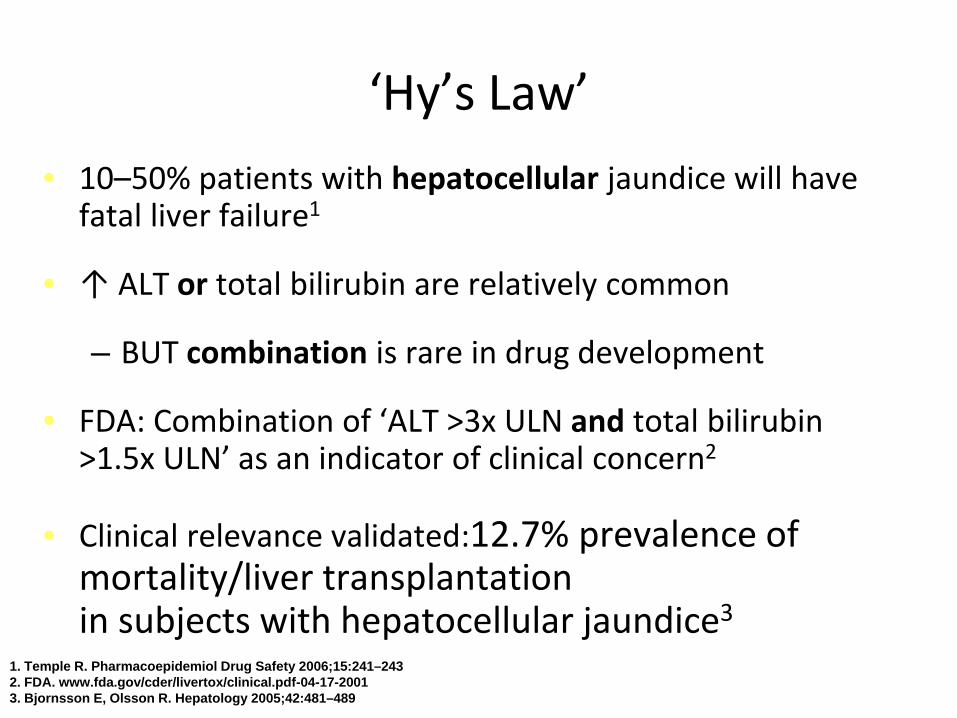
‘Hy’s Law’ • 10–50% patients with hepatocellular jaundice will have
fatal liver failure1
• ↑ ALT or total bilirubin are relatively common
– BUT combination is rare in drug development
• FDA: Combination of ‘ALT >3x ULN and total bilirubin >1.5x ULN’ as an indicator of clinical concern2
• Clinical relevance validated:12.7% prevalence of mortality/liver transplantation in subjects with hepatocellular jaundice3
1. Temple R. Pharmacoepidemiol Drug Safety 2006;15:241–243 2. FDA. www.fda.gov/cder/livertox/clinical.pdf-04-17-2001 3. Bjornsson E, Olsson R. Hepatology 2005;42:481–489

Median AST in patients with LEE
350
AST
(U/L
)
Weeks since start LEE
continued HAART modified HAART upper limit normal
0 4 8 12 24 36 48
300
250
200
150
100
50
0
den Brinker, AIDS 2000
Median AST (IQR)

When to stop ARVs for hepatotoxicity?
• Symptomatic hepatitis • Jaundice • Lactic acidosis • Hypersensitivity • ALT or AST >10xULN • Newly-marketed drugs
Soriano et al. AIDS 2008; 22: 1-13

Nunez, Hepatology, 2010
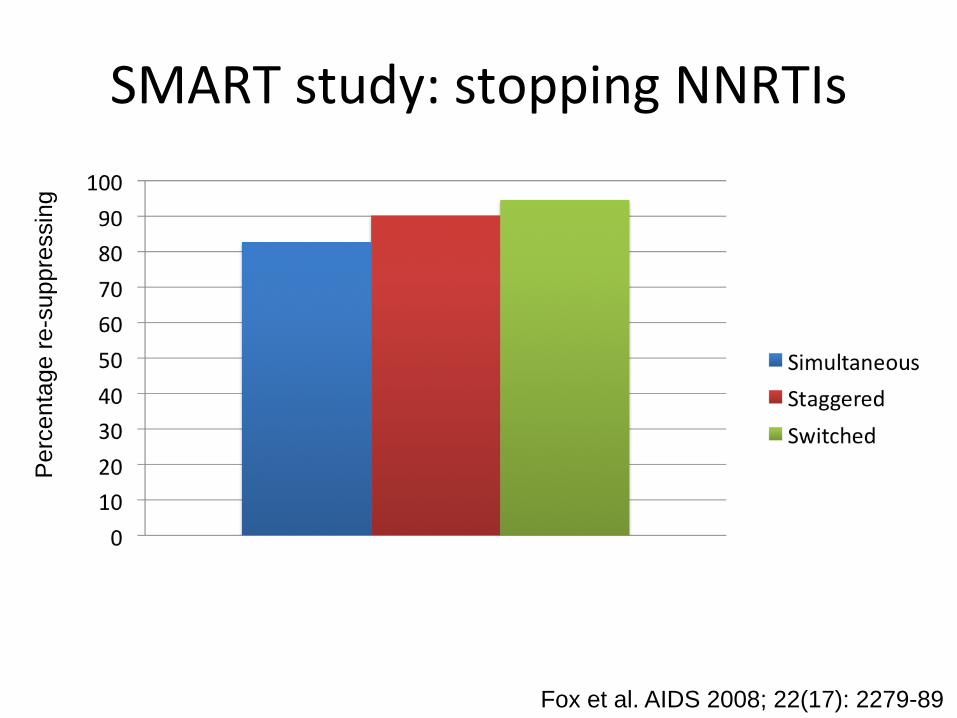
SMART study: stopping NNRTIs P
erce
ntag
e re
-sup
pres
sing
Fox et al. AIDS 2008; 22(17): 2279-89

22
24
26
28
30
32
34
36
38
Mea
n ab
solu
te A
LT (U
/l)(p
oint
wis
e 95
% C
I)
0 4 12 24 36 48 60 72 84 96 108
120
132
144
156
168
180
192
204
216
228
240
252
264
276
288
Weeks
LCM CDM
Mean absolute ALT (U/l) from LCM/CDM randomisation
Global P=0.83 overall (65028 measurements) Global P=0.14 estimating individual comparisons at each timepoint

SUS2008/006p
0.2
0.4
0.6
0.8
1.0
Impact of ART on Overall Liver Mortality in HIV/HCV Co-infected Patients
• Bonn cohort (1990–2002) – 285 HIV/HCV co-infected
patients • Liver-related mortality rates
per 100 person-years – HAART: 0.45 – ART: 0.69 – No therapy: 1.70
• Predictors for liver-related mortality – No HAART – Low CD4 cell count – Increasing age
Qurishi N, et al. Lancet 2003:362:1708–1713
0.2
0.4
0.6
0.8
1.0 Overall mortality
Cum
ulat
ive
surv
ival
ART
HAART*
No therapy *p<0.001
Time (days) 0 1000 2000 3000 4000 5000 6000
Liver-related mortality
Cum
ulat
ive
surv
ival
ART
HAART*
No therapy
*p=0.018
Time (days) 0 1000 2000 3000 4000 5000 6000

Caut
ion
Safe
ddI d4T
AZT
3TC FTC
ABV TDF
NRTI NNRTI
RPV
ETV
EFV
NVP
PI
SQV NFV
ATV LPV
APV DRV
TPV
RTV
Entry inhibitors
T20
MVC
Integrase inhibitors
DTG RTG
Boosters
COBI
RTV
After Soriano at al. AIDS 2008; 22: 1-13
Hepatic Safety Profile of ARVs: Current Guideline Recommended agents
ETG

Some caution with new “friendly” drugs • RCTs may exclude patients with HCV/HBV
• RCTs may exclude patients with abnormal baseline
LFTs
• RCTs may exclude key patient groups
• Cirrhosis usually an exclusion
• Duration of follow-up is limited
• Cohort studies will not report for some time…..
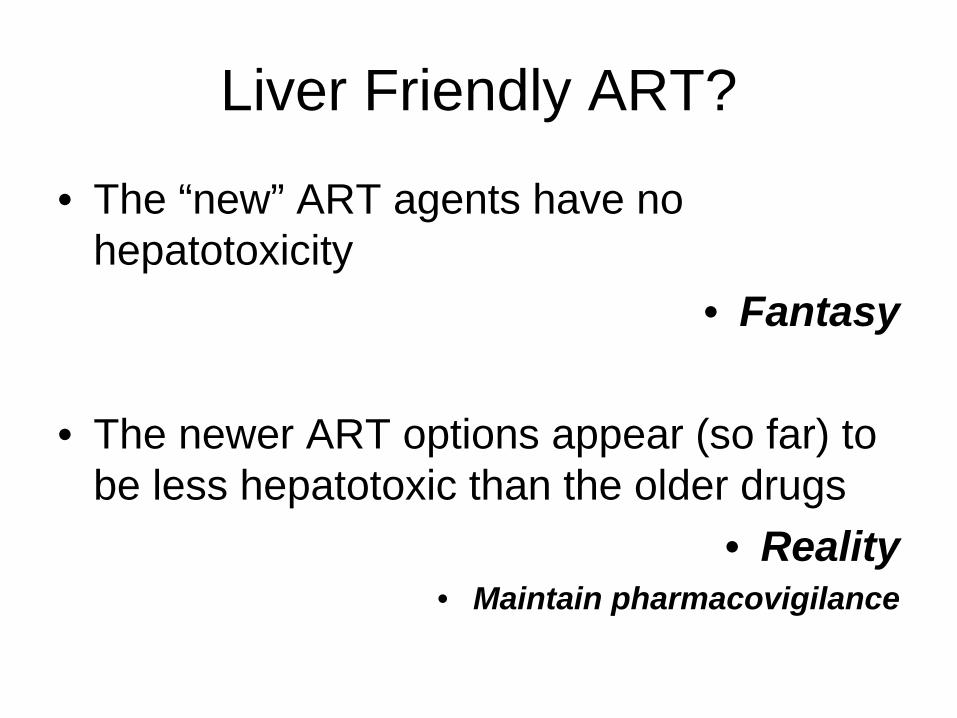
Liver Friendly ART?
• The “new” ART agents have no hepatotoxicity
• Fantasy
• The newer ART options appear (so far) to be less hepatotoxic than the older drugs
• Reality • Maintain pharmacovigilance

Summary • Difficulties in analysing studies to determine
frequency of hepatotoxicity • Hepatotoxicity described with all antiretroviral
agents • Less hepatotoxicity with newer recommended
ART options – ? Hepatotoxicity may become less of an issue
• Caution with those “at risk” • Evaluate for non-ART causes of abnormal liver
function • Benefits of ART significantly outweigh the risks
Acknowledgements • DART Study Team Sarah Walker • BSUH Duncan Churchill • RFH Sanjay Bhagani • UCL Caroline Sabin • Hamburg Jan Van Lunzen
• Gilead Terry Whitehead • Viiv Andy Benzie • AbbVie Pat Dore • BMS Izabela Tolowinska • Janssen Rebecca Wroe • Merck Harpal Lamba
Recommended