1
TI-82 GRAPHING CALCULATOR
BASIC OPERATIONS
by
Carolyn MeitlerConcordia University Wisconsin
A-1 Getting Started
Press ON to turn on the calculator.
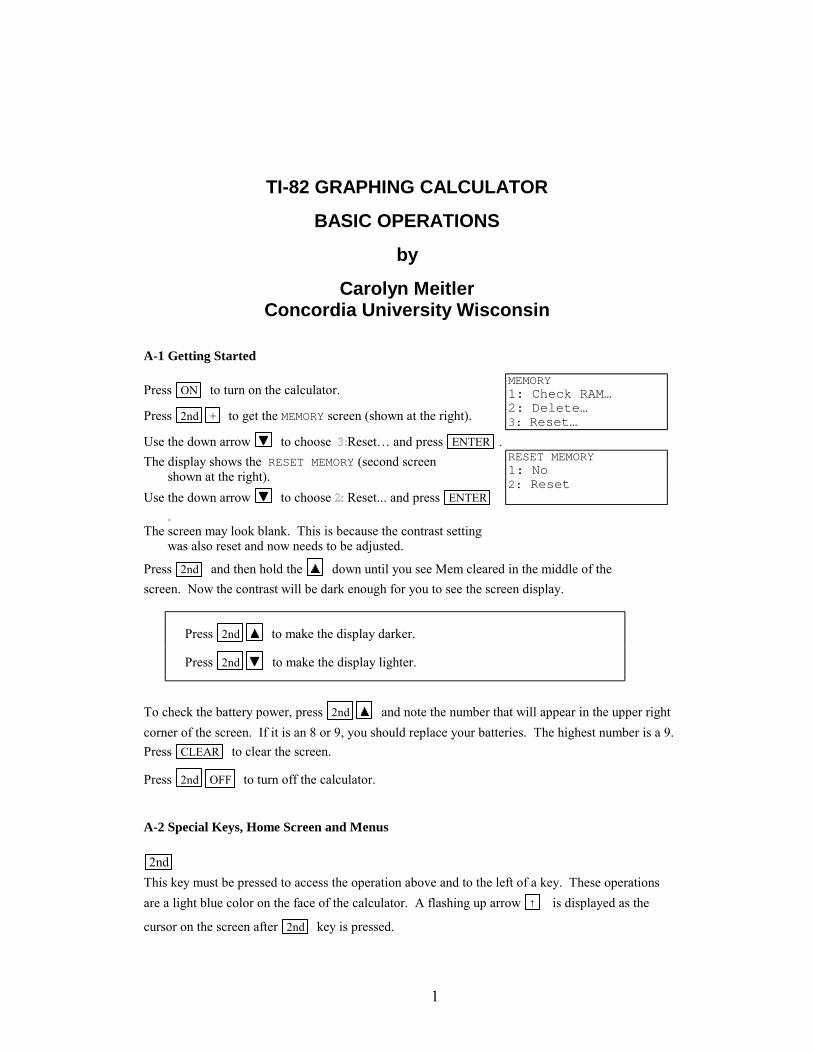
Press 2nd + to get the MEMORY screen (shown at the right).
Use the down arrow to choose Reset… and press ENTER .
The display shows the RESET MEMORY (second screenshown at the right).
Use the down arrow to choose Reset... and press ENTER
.The screen may look blank. This is because the contrast setting
was also reset and now needs to be adjusted.
MEMORY1: Check RAM…2: Delete…3: Reset…
RESET MEMORY1: No2: Reset
Press 2nd and then hold the down until you see Mem cleared in the middle of the
screen. Now the contrast will be dark enough for you to see the screen display.
Press 2nd to make the display darker.
Press 2nd to make the display lighter.
To check the battery power, press 2nd and note the number that will appear in the upper right
corner of the screen. If it is an 8 or 9, you should replace your batteries. The highest number is a 9.
Press CLEAR to clear the screen.
Press 2nd OFF to turn off the calculator.
A-2 Special Keys, Home Screen and Menus
2nd
This key must be pressed to access the operation above and to the left of a key. These operations
are a light blue color on the face of the calculator. A flashing up arrow ↑ is displayed as the
cursor on the screen after 2nd key is pressed.
Basic Operations TI-82 Calculator 2
In this document, the functions on the face of the calculator above a key will bereferred to in square boxes just as if the function was printed on the key cap. For
example, ANS is the function above the (-) key.
ALPHA
This key must be pressed first to access the operation above and to the right of a key. A flashing
is displayed as the cursor on the screen after the ALPHA key is pressed.
A-LOCK
2nd A-LOCK locks the calculator into alpha mode. The calculator will remain in alpha mode
until the ALPHA is pressed again.
MODE
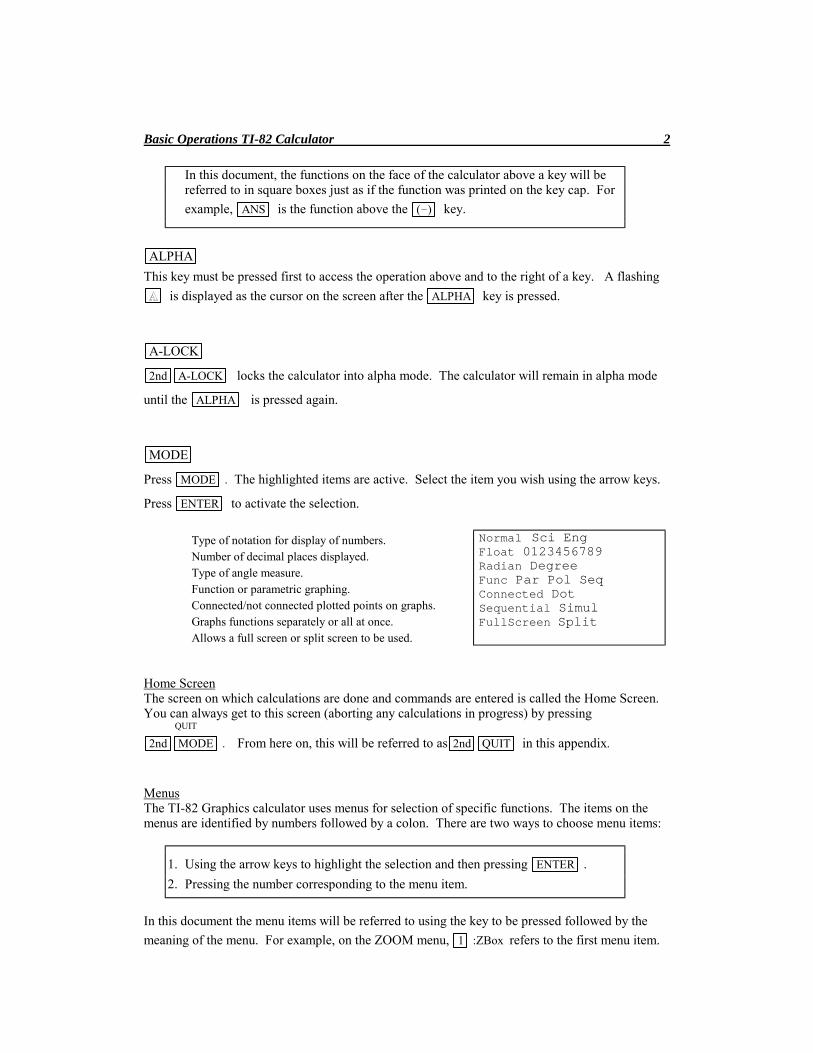
Press MODE . The highlighted items are active. Select the item you wish using the arrow keys.
Press ENTER to activate the selection.
Type of notation for display of numbers.Number of decimal places displayed.Type of angle measure.Function or parametric graphing.Connected/not connected plotted points on graphs.Graphs functions separately or all at once.Allows a full screen or split screen to be used.
Normal Sci EngFloat 0123456789Radian DegreeFunc Par Pol SeqConnected DotSequential SimulFullScreen Split
Home ScreenThe screen on which calculations are done and commands are entered is called the Home Screen.You can always get to this screen (aborting any calculations in progress) by pressing QUIT
2nd MODE . From here on, this will be referred to as 2nd QUIT in this appendix.
MenusThe TI-82 Graphics calculator uses menus for selection of specific functions. The items on themenus are identified by numbers followed by a colon. There are two ways to choose menu items:
1. Using the arrow keys to highlight the selection and then pressing ENTER .
2. Pressing the number corresponding to the menu item.
In this document the menu items will be referred to using the key to be pressed followed by the
meaning of the menu. For example, on the ZOOM menu, 1 :ZBox refers to the first menu item.
Basic Operations TI-82 Calculator 3
A-3 Correcting Errors
It is easy to correct errors on the screen when entering data into the calculator. To do so use the
arrow keys, DEL , and INS keys.
or Moves the cursor to the left or right one position.
Moves the cursor up one line or replays the last executed input.
Moves the cursor down one line.
DEL Deletes one or more characters at the cursor position.
2nd INS Inserts one or more characters at the cursor position.
A-4 Calculation
Example 1 Calculate -8 + 92 -
3
2 - 5 .
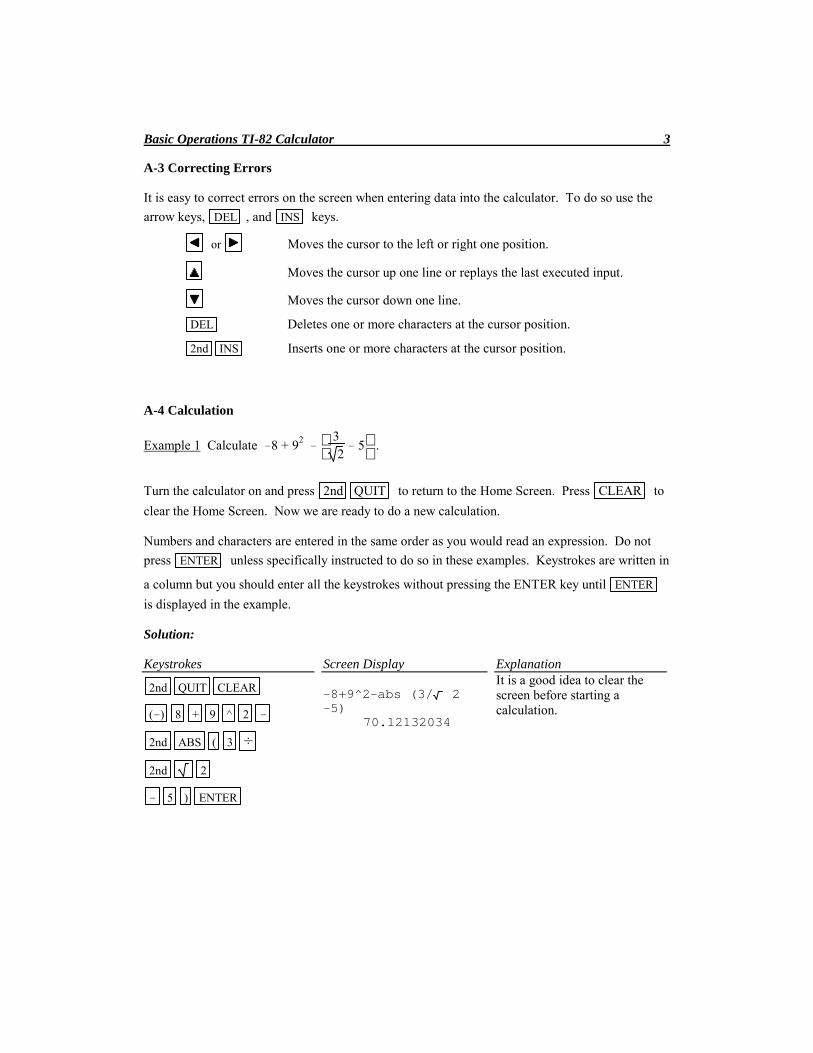
Turn the calculator on and press 2nd QUIT to return to the Home Screen. Press CLEAR to
clear the Home Screen. Now we are ready to do a new calculation.
Numbers and characters are entered in the same order as you would read an expression. Do not
press ENTER unless specifically instructed to do so in these examples. Keystrokes are written in
a column but you should enter all the keystrokes without pressing the ENTER key until ENTER
is displayed in the example.
Solution:
Keystrokes
2nd QUIT CLEAR
(-) 8 + 9 ^ 2 -
2nd ABS ( 3 ÷
2nd 2
- 5 ) ENTER
Screen Display
-8+9^2-abs (3/ 2-5) 70.12132034
ExplanationIt is a good idea to clear thescreen before starting acalculation.
Basic Operations TI-82 Calculator 4
A-5 Evaluation of an Algebraic Expression, Lists and Tables
Example 1 Evaluate x4-3a
8w for x = π , a = 3 , and w = 4!.
Two different methods can be used to evaluate algebraic expressions:
1. Store the values of the variables and then enter the expression. When ENTER is pressed
the expression is evaluated for the stored values of the variables.2. Store the expression and store the values of the variables. Recall the expression.
Press ENTER . The expression will be evaluated for the stored values of the variables.
The advantage of the second method is that the expression can be easily evaluated for severaldifferent values of the variables.
Solution:
Method 1
Keystrokes Screen Display
2nd QUIT π→X
2nd π STO X,T,θ ENTER 3.141592654
2nd 3 STO ALPHA A ENTER 3→A
1.732050808
4 MATH 4 :! STO ALPHA W ENTER 4!→W
24
In this document the notation 4 :! refers to the menu item accessed by pressing the number 4.
( X,T,θ ^ 4 - 3 ALPHA A ) ÷ (X^4-3A)/(8W)
( 8 ALPHA W ) ENTER .4802757219
Method 2
Keystrokes Screen Display
CLEAR Y= CLEAR ( X,T,θ ^ 4 - 3 ALPHA Y1=(X^4-3A)/(8W
A ) ÷ ( 8 ALPHA W ) 2nd QUIT )
2nd π STO X,T,θ ENTER π→X
3.141592654
2nd 3 STO ALPHA A ENTER 3→A
1.732050808
4 MATH 4 :! STO ALPHA W ENTER 4!→W
24
2nd Y-VARS 1 :Function 1 :Y1 ENTER Y1
.4802757219
Basic Operations TI-82 Calculator 5
Example 2 For f(x) = 3x+5 and g(x) = x - x find f(2) - g(2) .
Solution: (Using Method 2 above.)
Keystrokes
Y= CLEAR 3 X,T,θ + 5
ENTER CLEAR
2nd ( X,T,θ -
2nd X,T,θ )
2nd QUIT
2 STO X,T,θ ENTER
2nd Y-VARS 1 :Function
1 :Y1 - 2nd Y-VARS
1 :Function 2 :Y2 ENTER
Screen Display
Y1=3X+5
Y2= (X- X)
2→X
2
Y1-Y2
10.23463314
ExplanationClear Y1 and store f(x) as Y1.
Clear Y2 and store g(x) as Y2.
Store 2 as X.
Algebraically form f(x)-g(x)and evaluate at x = 2.
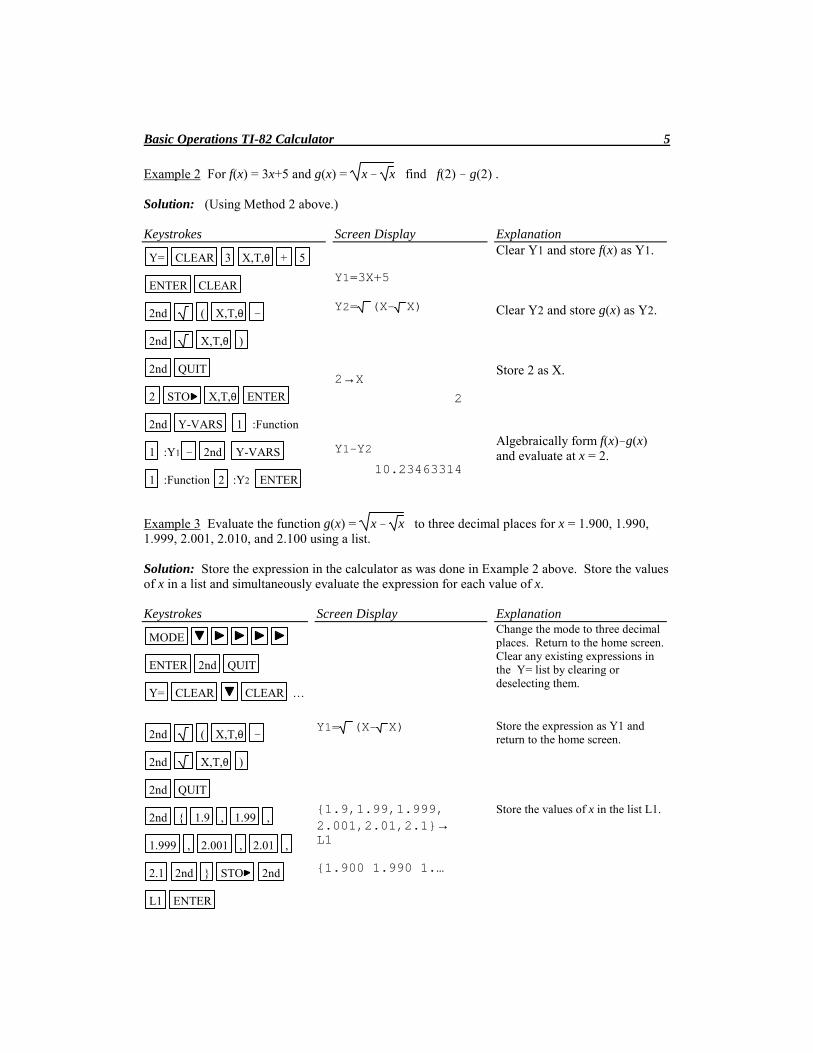
Example 3 Evaluate the function g(x) = x - x to three decimal places for x = 1.900, 1.990,1.999, 2.001, 2.010, and 2.100 using a list.
Solution: Store the expression in the calculator as was done in Example 2 above. Store the valuesof x in a list and simultaneously evaluate the expression for each value of x.
Keystrokes Screen Display Explanation
MODE
ENTER 2nd QUIT
Y= CLEAR CLEAR …
Change the mode to three decimalplaces. Return to the home screen.Clear any existing expressions inthe Y= list by clearing ordeselecting them.
2nd ( X,T,θ -
2nd X,T,θ )
2nd QUIT
Y1= (X- X) Store the expression as Y1 andreturn to the home screen.
2nd { 1.9 , 1.99 ,
1.999 , 2.001 , 2.01 ,
2.1 2nd } STO 2nd
L1 ENTER
{1.9,1.99,1.999,2.001,2.01,2.1}→L1
{1.900 1.990 1.…
Store the values of x in the list L1.
Basic Operations TI-82 Calculator 6
2nd Y-VARS 1 :Function
1 :Y1 ( 2nd L1 )
STO 2nd L2
ENTER
2nd L2 ENTER
Y1(L1)→L2{.722 .761 .765…
L2{.722 .761 .765…
Calculate the value of theexpression stored as Y2 for thevalues of x in list L1 and store inlist L2.
To view the results, use the
and keys.
To recall L2, press 2nd L2.The results are 0.722, 0.761,0.765, 0.766, 0.770, and 0.807.
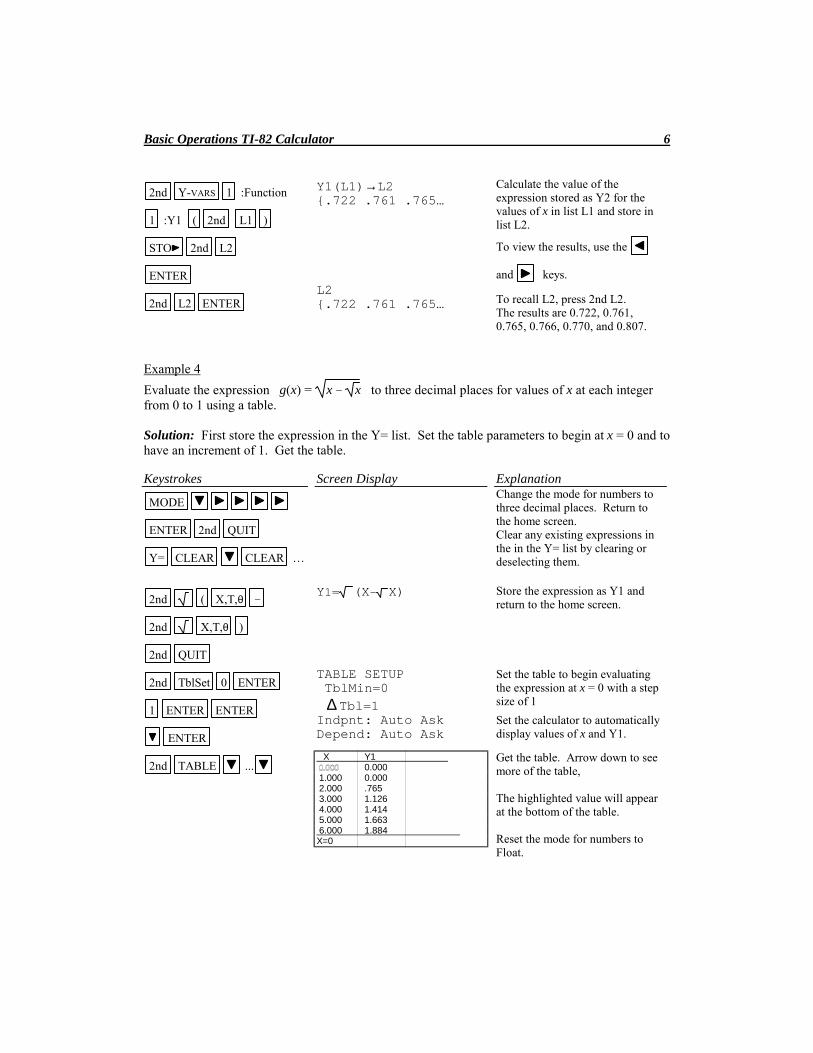
Example 4
Evaluate the expression g(x) = x - x to three decimal places for values of x at each integerfrom 0 to 1 using a table.
Solution: First store the expression in the Y= list. Set the table parameters to begin at x = 0 and tohave an increment of 1. Get the table.
Keystrokes Screen Display Explanation
MODE
ENTER 2nd QUIT
Y= CLEAR CLEAR …
Change the mode for numbers tothree decimal places. Return tothe home screen.Clear any existing expressions inthe in the Y= list by clearing ordeselecting them.
2nd ( X,T,θ -
2nd X,T,θ )
2nd QUIT
Y1= (X- X) Store the expression as Y1 andreturn to the home screen.
2nd TblSet 0 ENTER
1 ENTER ENTER
ENTER
TABLE SETUP TblMin=0
∆ Tbl=1Indpnt: Auto AskDepend: Auto Ask
Set the table to begin evaluatingthe expression at x = 0 with a stepsize of 1
Set the calculator to automaticallydisplay values of x and Y1.
2nd TABLE ... X Y1
0.000 1.000 0.000 2.000 .765 3.000 1.126 4.000 1.414 5.000 1.663 6.000 1.884 X=0
Get the table. Arrow down to seemore of the table,
The highlighted value will appearat the bottom of the table.
Reset the mode for numbers toFloat.
Basic Operations TI-82 Calculator 7
A-6 Testing Inequalities in One Variable
Example 1 Determine whether or not x3 + 5 < 3x4 - x is true for x = - 2 .
Solution:
Keystrokes
CLEAR MODE ENTER
(-) 2nd 2 STO
X,T,θ ENTER
X,T,θ MATH 3 :3 + 5
2nd TEST 5 :< 3
X,T,θ ^ 4 - X,T,θ
ENTER
Screen Display
- 2→X
-1.414213562
X3 +5<3X^4-X 1
ExplanationClear the Home Screen.Change the MODE to floating.
Store the value for x.
Enter the expression.
The result of 1 indicates theexpression is true for this valueof x. If a 0 was displayed, theexpression would be false.
A-7 Graphing and the ZStandard Graphing Screen
Before doing any graphing on the calculator, the statistical graphing commandsneed to be turned off.
2nd PLOTSTAT
4 :PlotsOff ENTER
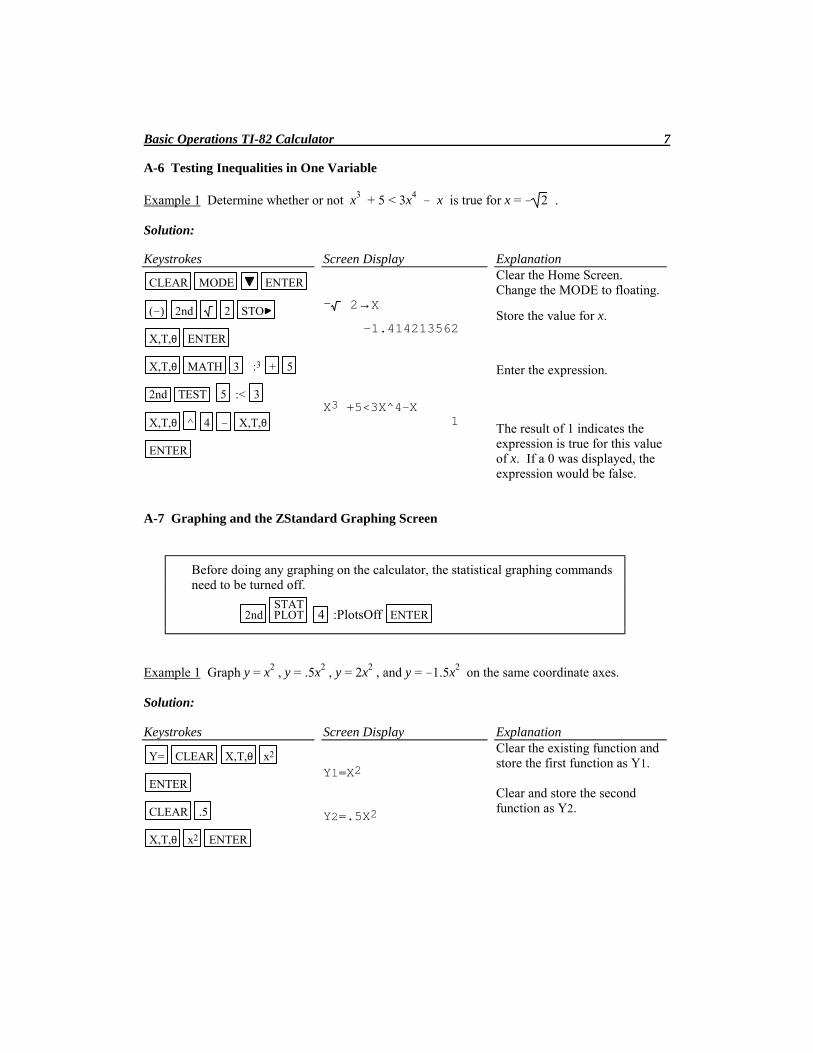
Example 1 Graph y = x2 , y = .5x2 , y = 2x2 , and y = -1.5x2 on the same coordinate axes.
Solution:
Keystrokes
Y= CLEAR X,T,θ x2
ENTER
CLEAR .5
X,T,θ x2 ENTER
Screen Display
Y1=X2
Y2=.5X2
ExplanationClear the existing function andstore the first function as Y1.
Clear and store the secondfunction as Y2.
Basic Operations TI-82 Calculator 8
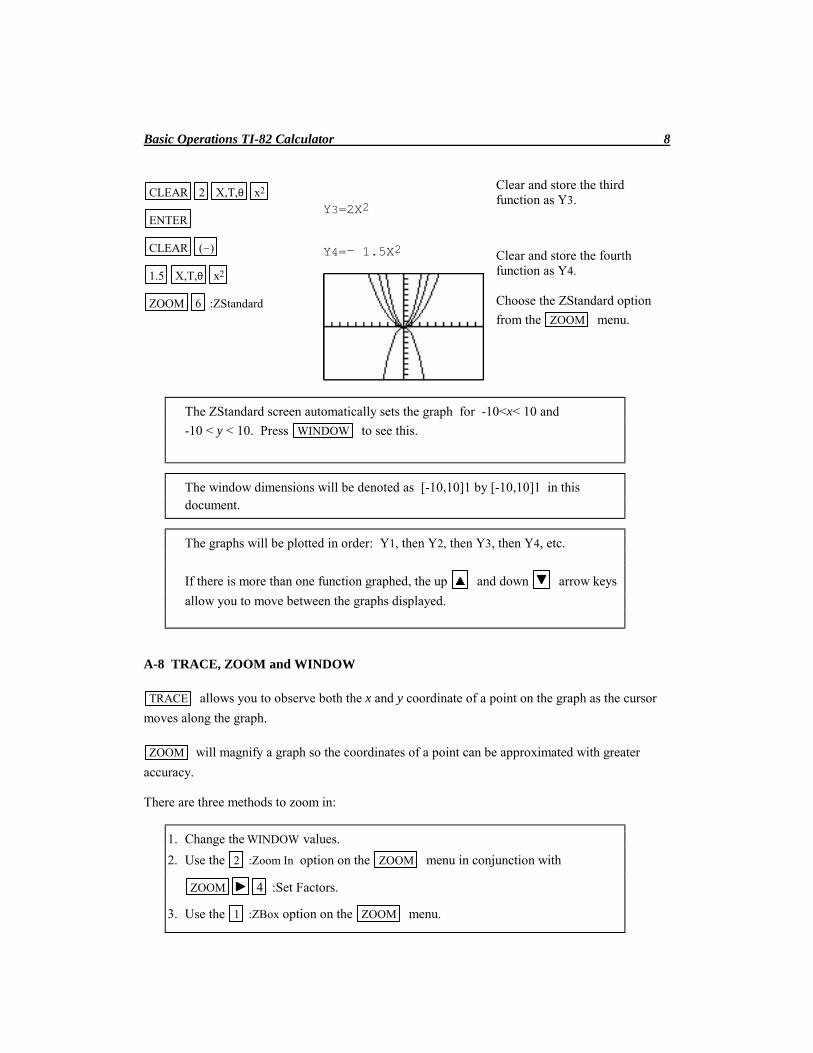
CLEAR 2 X,T,θ x2
ENTER
CLEAR (-)
1.5 X,T,θ x2
ZOOM 6 :ZStandard
Y3=2X2
Y4=- 1.5X2
Clear and store the thirdfunction as Y3.
Clear and store the fourthfunction as Y4.
Choose the ZStandard option
from the ZOOM menu.
The ZStandard screen automatically sets the graph for -10<x< 10 and
-10 < y < 10. Press WINDOW to see this.
The window dimensions will be denoted as [-10,10]1 by [-10,10]1 in thisdocument.
The graphs will be plotted in order: Y1, then Y2, then Y3, then Y4, etc.
If there is more than one function graphed, the up and down arrow keys
allow you to move between the graphs displayed.
A-8 TRACE, ZOOM and WINDOW
TRACE allows you to observe both the x and y coordinate of a point on the graph as the cursor
moves along the graph.
ZOOM will magnify a graph so the coordinates of a point can be approximated with greater
accuracy.
There are three methods to zoom in:
1. Change the WINDOW values.
2. Use the 2 :Zoom In option on the ZOOM menu in conjunction with
ZOOM 4 :Set Factors.
3. Use the 1 :ZBox option on the ZOOM menu.
Basic Operations TI-82 Calculator 9
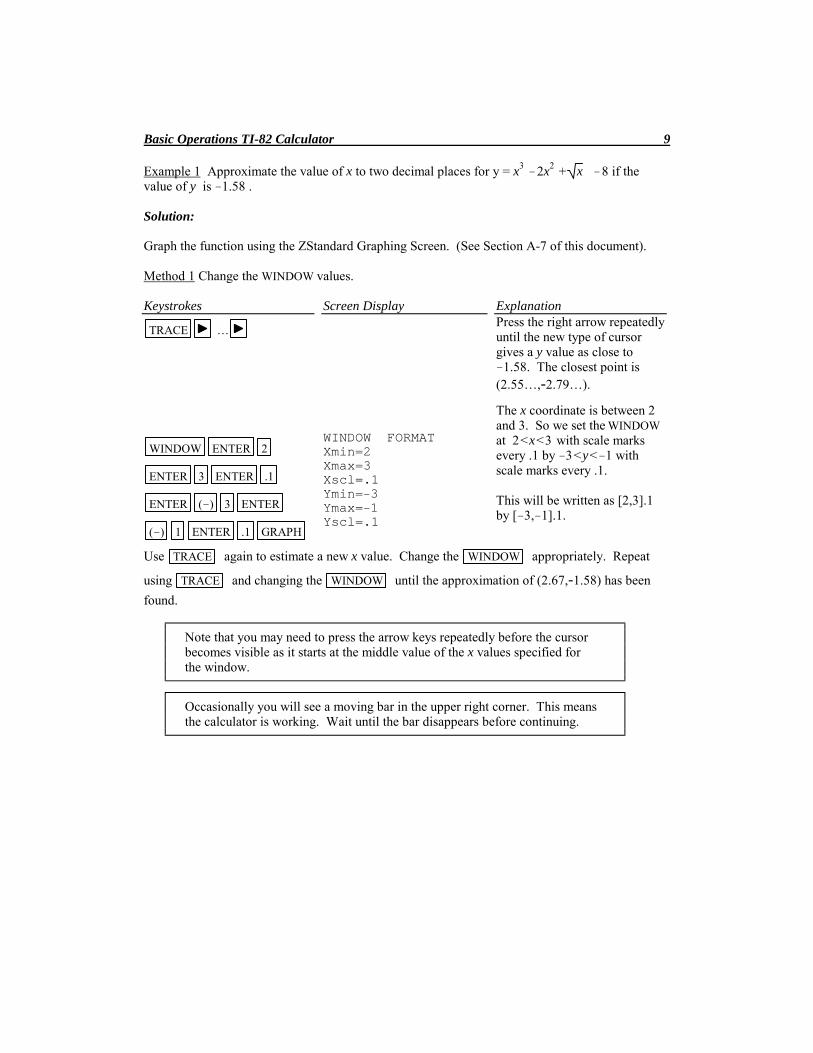
Example 1 Approximate the value of x to two decimal places for y = x3 -2x2 + x -8 if thevalue of y is -1.58 .
Solution:
Graph the function using the ZStandard Graphing Screen. (See Section A-7 of this document).
Method 1 Change the WINDOW values.
Keystrokes
TRACE …
Screen Display ExplanationPress the right arrow repeatedlyuntil the new type of cursorgives a y value as close to-1.58. The closest point is(2.55…,-2.79…).
WINDOW ENTER 2
ENTER 3 ENTER .1
ENTER (-) 3 ENTER
(-) 1 ENTER .1 GRAPH
WINDOW FORMATXmin=2Xmax=3Xscl=.1Ymin=-3Ymax=-1Yscl=.1
The x coordinate is between 2and 3. So we set the WINDOWat 2<x<3 with scale marksevery .1 by -3<y<-1 withscale marks every .1.
This will be written as [2,3].1by [-3,-1].1.
Use TRACE again to estimate a new x value. Change the WINDOW appropriately. Repeat
using TRACE and changing the WINDOW until the approximation of (2.67,-1.58) has been
found.
Note that you may need to press the arrow keys repeatedly before the cursorbecomes visible as it starts at the middle value of the x values specified forthe window.
Occasionally you will see a moving bar in the upper right corner. This meansthe calculator is working. Wait until the bar disappears before continuing.
Basic Operations TI-82 Calculator 10
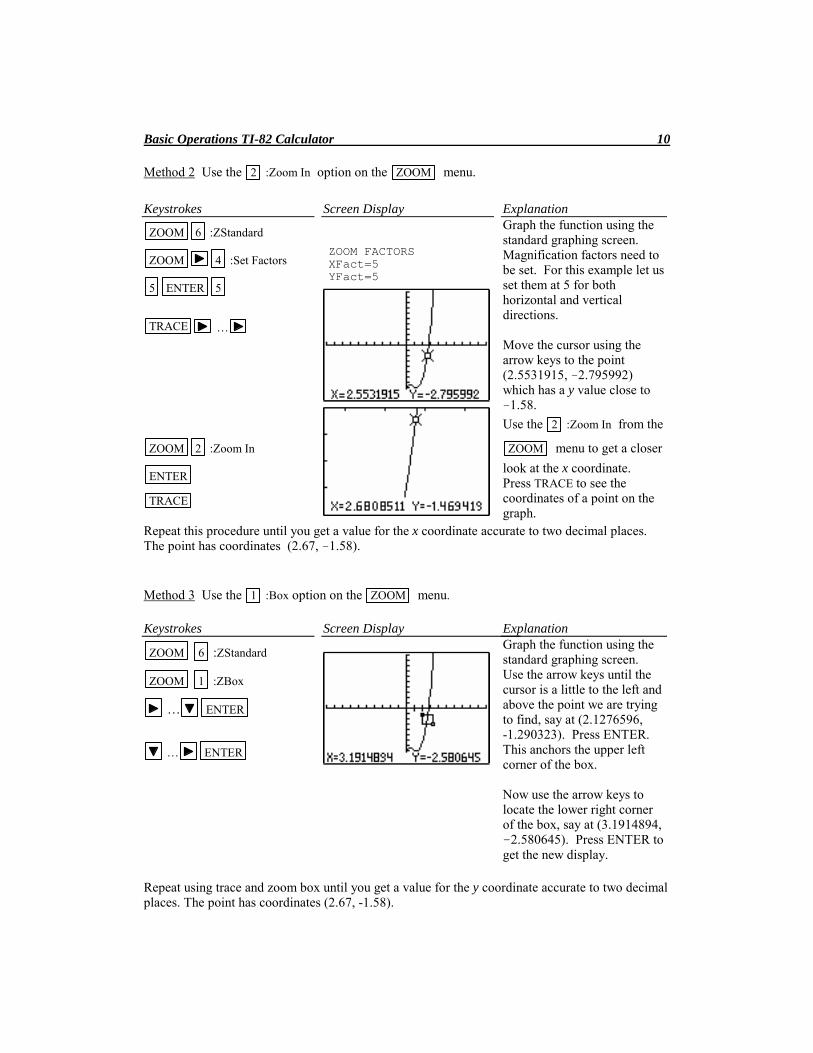
Method 2 Use the 2 :Zoom In option on the ZOOM menu.
Keystrokes
ZOOM 6 :ZStandard
ZOOM 4 :Set Factors
5 ENTER 5
TRACE …
ZOOM 2 :Zoom In
ENTER
TRACE
Screen Display
ZOOM FACTORSXFact=5YFact=5
ExplanationGraph the function using thestandard graphing screen.Magnification factors need tobe set. For this example let usset them at 5 for bothhorizontal and verticaldirections.
Move the cursor using thearrow keys to the point(2.5531915, -2.795992)which has a y value close to-1.58.
Use the 2 :Zoom In from the
ZOOM menu to get a closer
look at the x coordinate.Press TRACE to see thecoordinates of a point on thegraph.
Repeat this procedure until you get a value for the x coordinate accurate to two decimal places.The point has coordinates (2.67, -1.58).
Method 3 Use the 1 :Box option on the ZOOM menu.
Keystrokes
ZOOM 6 :ZStandard
ZOOM 1 :ZBox
… ENTER
… ENTER
Screen Display ExplanationGraph the function using thestandard graphing screen.Use the arrow keys until thecursor is a little to the left andabove the point we are tryingto find, say at (2.1276596,-1.290323). Press ENTER.This anchors the upper leftcorner of the box.
Now use the arrow keys tolocate the lower right cornerof the box, say at (3.1914894,-2.580645). Press ENTER toget the new display.
Repeat using trace and zoom box until you get a value for the y coordinate accurate to two decimalplaces. The point has coordinates (2.67, -1.58).
Basic Operations TI-82 Calculator 11
A-9 Determining the WINDOW Dimensions and Scale Marks
There are several ways to determine the limits of the x and y axes to be used in setting theWINDOW. Three are described below:
1. Graph using the default setting of the calculator and zoom out. The disadvantage of thismethod is that often the function cannot be seen at either the default settings or the zoomedout settings of the WINDOW.
2. Evaluate the function for several values of x. Make a first estimate of the windowdimensions based on these values.
3. Analyze the leading coefficient and/or the constant terms.
A good number to use for the scale marks is one that yields about 20 marks across the axis. Forexample if the WINDOW is [-30, 30] for the an axis then a good scale value is (30-(-30))/20 or 3.
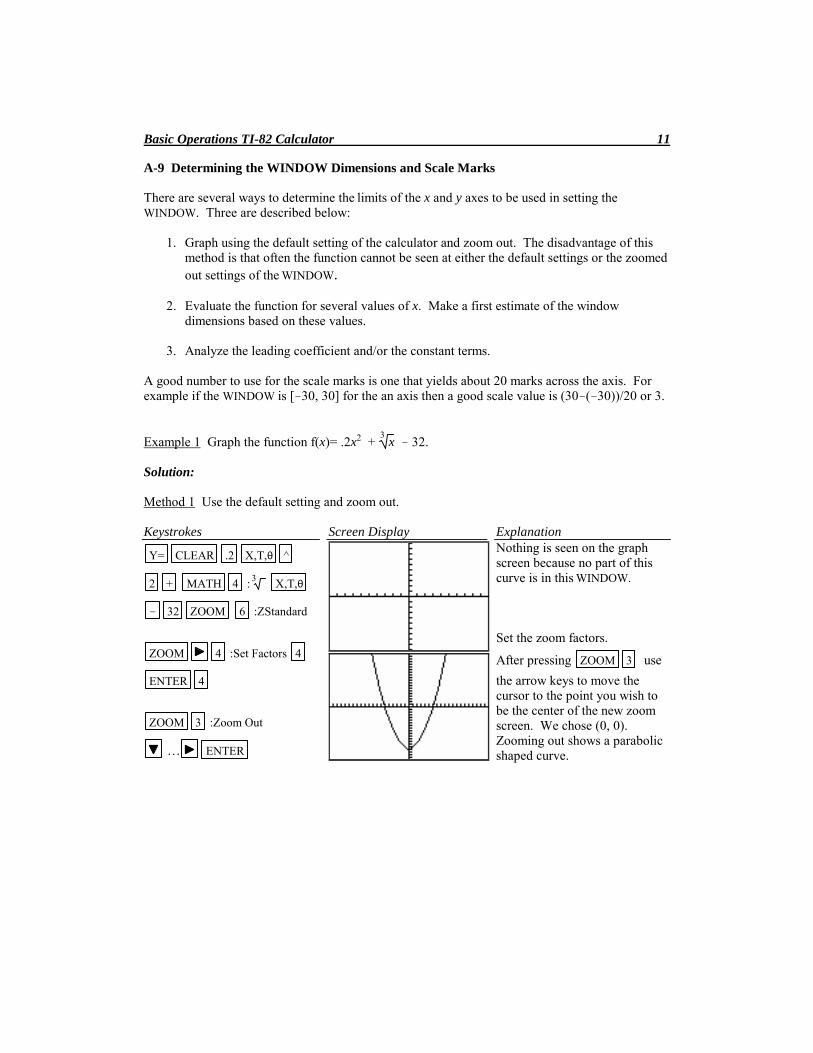
Example 1 Graph the function f(x)= .2x2 + 3
x - 32.
Solution:
Method 1 Use the default setting and zoom out.
Keystrokes
Y= CLEAR .2 X,T,θ ^
2 + MATH 4 :3 X,T,θ
- 32 ZOOM 6 :ZStandard
ZOOM 4 :Set Factors 4
ENTER 4
ZOOM 3 :Zoom Out
… ENTER
Screen Display ExplanationNothing is seen on the graphscreen because no part of thiscurve is in this WINDOW.
Set the zoom factors.
After pressing ZOOM 3 use
the arrow keys to move thecursor to the point you wish tobe the center of the new zoomscreen. We chose (0, 0).Zooming out shows a parabolicshaped curve.
Basic Operations TI-82 Calculator 12
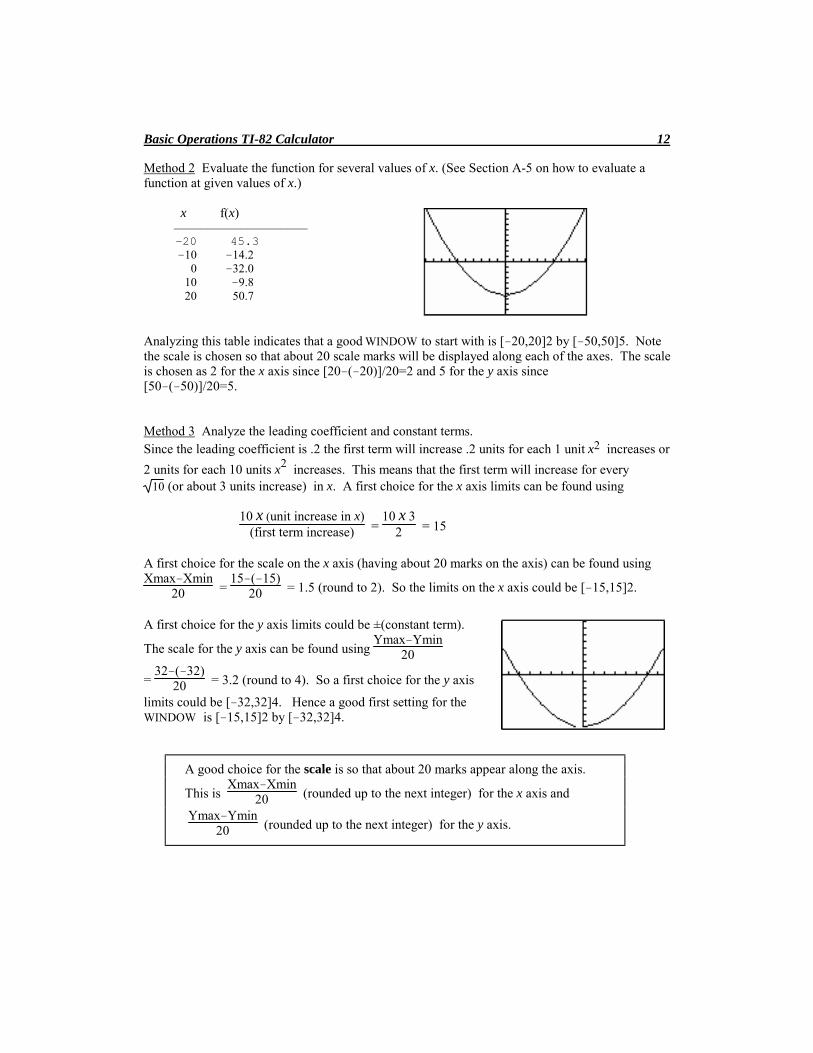
Method 2 Evaluate the function for several values of x. (See Section A-5 on how to evaluate afunction at given values of x.)
x f(x) ––––––––––––––––––––
-20 45.3-10 -14.2
0 -32.010 -9.820 50.7
Analyzing this table indicates that a good WINDOW to start with is [-20,20]2 by [-50,50]5. Notethe scale is chosen so that about 20 scale marks will be displayed along each of the axes. The scaleis chosen as 2 for the x axis since [20-(-20)]/20=2 and 5 for the y axis since[50-(-50)]/20=5.
Method 3 Analyze the leading coefficient and constant terms.Since the leading coefficient is .2 the first term will increase .2 units for each 1 unit x2 increases or
2 units for each 10 units x2 increases. This means that the first term will increase for every10 (or about 3 units increase) in x. A first choice for the x axis limits can be found using
10 x (unit increase in x)(first term increase) =
10 x 32 = 15
A first choice for the scale on the x axis (having about 20 marks on the axis) can be found usingXmax-Xmin
20 = 15-(-15)
20 = 1.5 (round to 2). So the limits on the x axis could be [-15,15]2.
A first choice for the y axis limits could be ±(constant term).
The scale for the y axis can be found using Ymax-Ymin
20
= 32-(-32)
20 = 3.2 (round to 4). So a first choice for the y axis
limits could be [-32,32]4. Hence a good first setting for theWINDOW is [-15,15]2 by [-32,32]4.
A good choice for the scale is so that about 20 marks appear along the axis.
This is Xmax-Xmin
20 (rounded up to the next integer) for the x axis and
Ymax-Ymin
20 (rounded up to the next integer) for the y axis.
Basic Operations TI-82 Calculator 13
A-10 Piecewise-Defined Functions
There are two methods to graph piecewise-defined functions:
1. Graph each piece of the function separately as an entire function on the same coordinateaxes. Use trace and zoom to locate the partition value on each of the graphs.
2. Store each piece of the function separately but include an inequality statement followingthe expression which will set the WINDOW of values on x for which the function should begraphed. Then graph all pieces on the same coordinate axes.
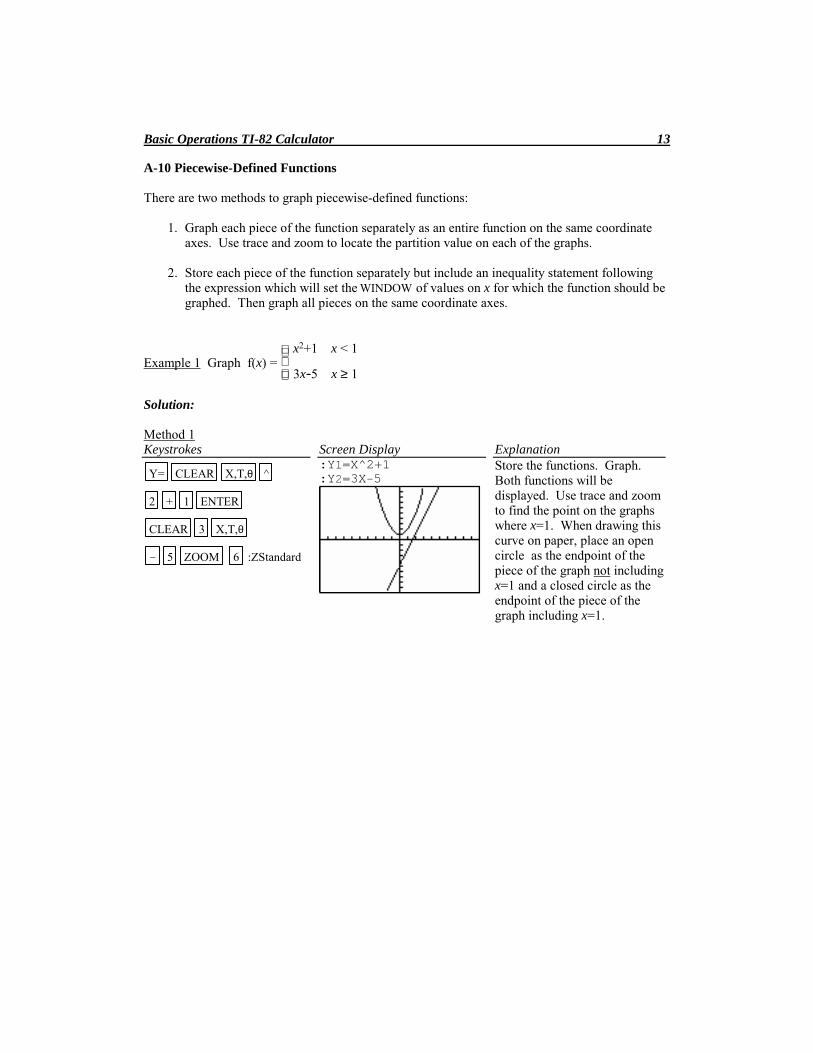
Example 1 Graph f(x) = x2+1 x < 1
3x-5 x ≥ 1
Solution:
Method 1Keystrokes
Y= CLEAR X,T,θ ^
2 + 1 ENTER
CLEAR 3 X,T,θ
- 5 ZOOM 6 :ZStandard
Screen Display:Y1=X^2+1:Y2=3X-5
ExplanationStore the functions. Graph.Both functions will bedisplayed. Use trace and zoomto find the point on the graphswhere x=1. When drawing thiscurve on paper, place an opencircle as the endpoint of thepiece of the graph not includingx=1 and a closed circle as theendpoint of the piece of thegraph including x=1.
Basic Operations TI-82 Calculator 14
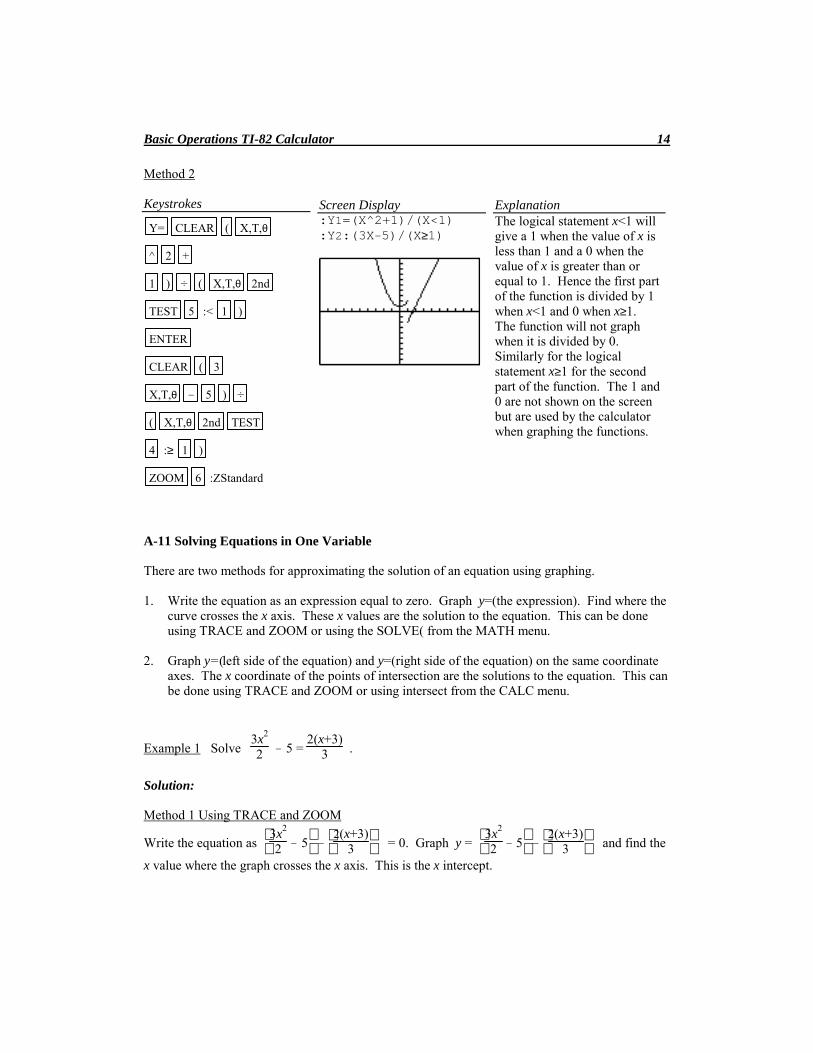
Method 2
Keystrokes
Y= CLEAR ( X,T,θ
^ 2 +
1 ) ÷ ( X,T,θ 2nd
TEST 5 :< 1 )
ENTER
CLEAR ( 3
X,T,θ - 5 ) ÷
( X,T,θ 2nd TEST
4 :≥ 1 )
ZOOM 6 :ZStandard
Screen Display:Y1=(X^2+1)/(X<1):Y2:(3X-5)/(X≥1)
ExplanationThe logical statement x<1 willgive a 1 when the value of x isless than 1 and a 0 when thevalue of x is greater than orequal to 1. Hence the first partof the function is divided by 1when x<1 and 0 when x≥1.The function will not graphwhen it is divided by 0.Similarly for the logicalstatement x≥1 for the secondpart of the function. The 1 and0 are not shown on the screenbut are used by the calculatorwhen graphing the functions.
A-11 Solving Equations in One Variable
There are two methods for approximating the solution of an equation using graphing.
1. Write the equation as an expression equal to zero. Graph y=(the expression). Find where thecurve crosses the x axis. These x values are the solution to the equation. This can be doneusing TRACE and ZOOM or using the SOLVE( from the MATH menu.
2. Graph y = (left side of the equation) and y=(right side of the equation) on the same coordinateaxes. The x coordinate of the points of intersection are the solutions to the equation. This canbe done using TRACE and ZOOM or using intersect from the CALC menu.
Example 1 Solve 3x2
2 - 5 = 2(x+3)
3 .
Solution:
Method 1 Using TRACE and ZOOM
Write the equation as
3x2
2 - 5 -
2(x+3)
3 = 0. Graph y =
3x2
2 - 5 -
2(x+3)
3 and find the
x value where the graph crosses the x axis. This is the x intercept.
Basic Operations TI-82 Calculator 15
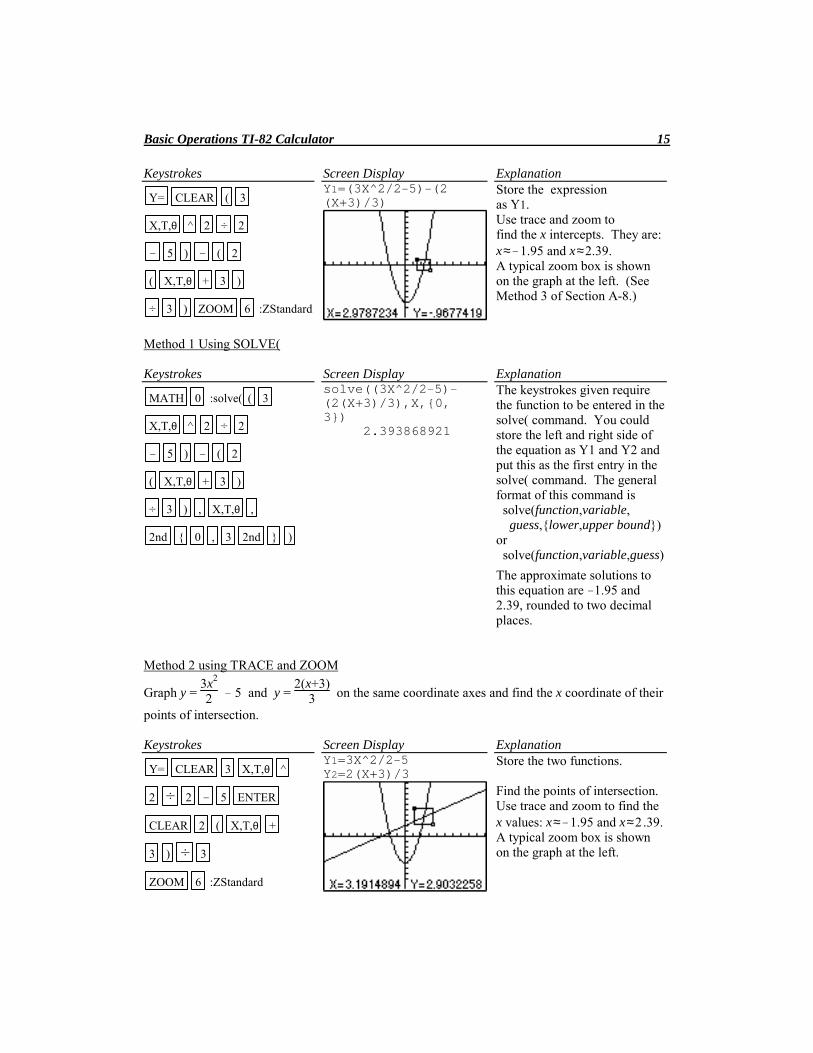
Keystrokes
Y= CLEAR ( 3
X,T,θ ^ 2 ÷ 2
- 5 ) - ( 2
( X,T,θ + 3 )
÷ 3 ) ZOOM 6 :ZStandard
Screen DisplayY1=(3X^2/2-5)-(2(X+3)/3)
ExplanationStore the expressionas Y1.Use trace and zoom tofind the x intercepts. They are:x≈-1.95 and x≈2.39.A typical zoom box is shownon the graph at the left. (SeeMethod 3 of Section A-8.)
Method 1 Using SOLVE(
Keystrokes
MATH 0 :solve( ( 3
X,T,θ ^ 2 ÷ 2
- 5 ) - ( 2
( X,T,θ + 3 )
÷ 3 ) , X,T,θ ,
2nd { 0 , 3 2nd } )
Screen Displaysolve((3X^2/2-5)-(2(X+3)/3),X,{0,3}) 2.393868921
ExplanationThe keystrokes given requirethe function to be entered in thesolve( command. You couldstore the left and right side ofthe equation as Y1 and Y2 andput this as the first entry in thesolve( command. The generalformat of this command is solve(function,variable, guess,{lower,upper bound})or solve(function,variable,guess)
The approximate solutions tothis equation are -1.95 and2.39, rounded to two decimalplaces.
Method 2 using TRACE and ZOOM
Graph y = 3x2
2 - 5 and y = 2(x+3)
3 on the same coordinate axes and find the x coordinate of their
points of intersection.
Keystrokes
Y= CLEAR 3 X,T,θ ^
2 ÷ 2 - 5 ENTER
CLEAR 2 ( X,T,θ +
3 ) ÷ 3
ZOOM 6 :ZStandard
Screen DisplayY1=3X^2/2-5Y2=2(X+3)/3
ExplanationStore the two functions.
Find the points of intersection.Use trace and zoom to find thex values: x≈-1.95 and x≈2.39.A typical zoom box is shownon the graph at the left.
Basic Operations TI-82 Calculator 16
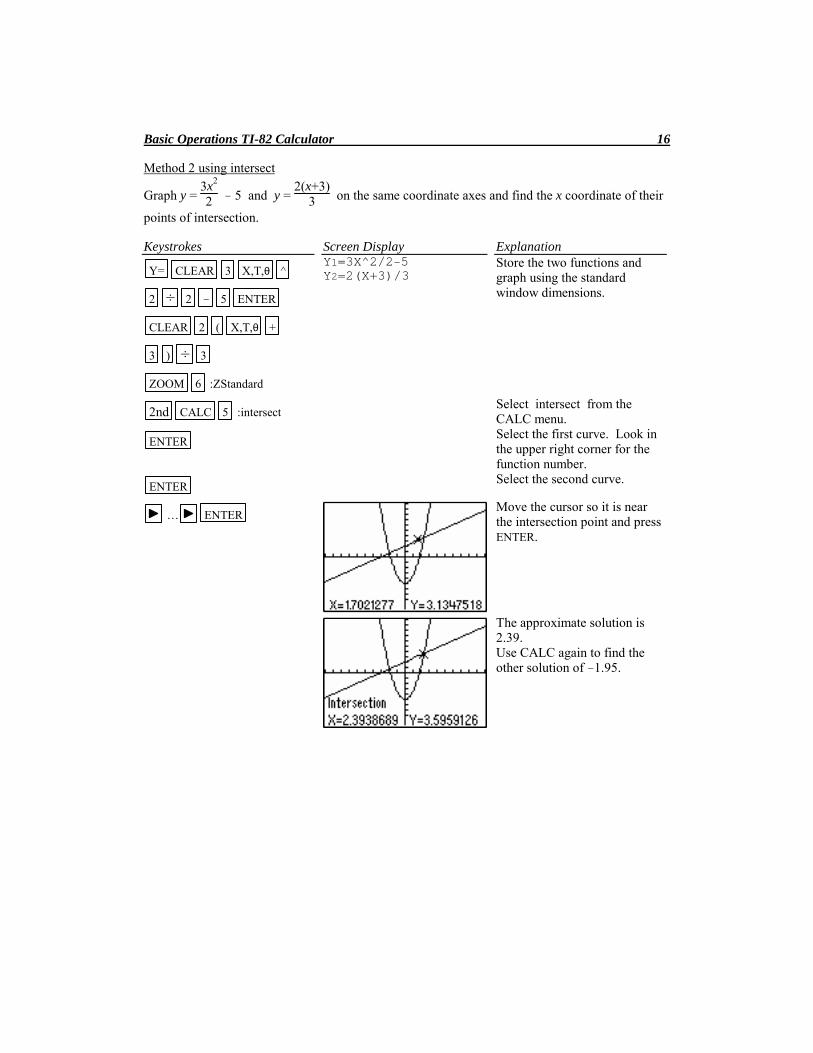
Method 2 using intersect
Graph y = 3x2
2 - 5 and y = 2(x+3)
3 on the same coordinate axes and find the x coordinate of their
points of intersection.
Keystrokes
Y= CLEAR 3 X,T,θ ^
2 ÷ 2 - 5 ENTER
CLEAR 2 ( X,T,θ +
3 ) ÷ 3
ZOOM 6 :ZStandard
Screen DisplayY1=3X^2/2-5Y2=2(X+3)/3
ExplanationStore the two functions andgraph using the standardwindow dimensions.
2nd CALC 5 :intersectSelect intersect from theCALC menu.
ENTER Select the first curve. Look inthe upper right corner for thefunction number.
ENTER Select the second curve.
… ENTER Move the cursor so it is nearthe intersection point and pressENTER.
The approximate solution is2.39.Use CALC again to find theother solution of -1.95.
Basic Operations TI-82 Calculator 17
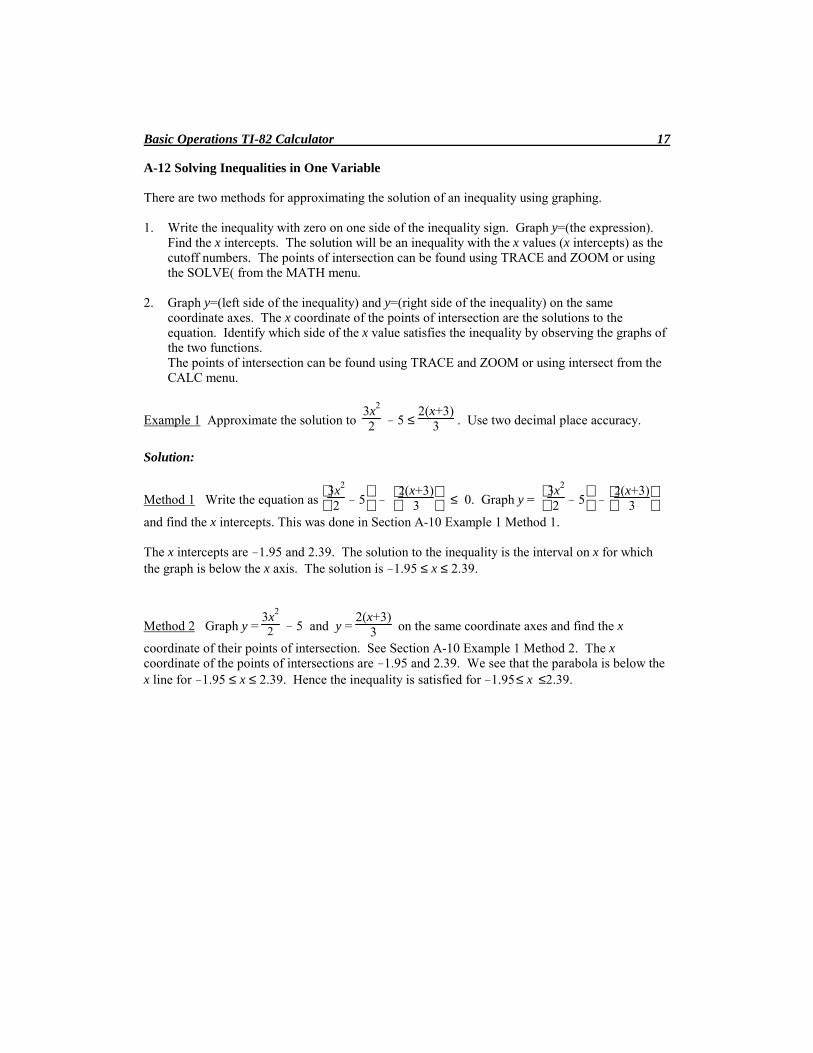
A-12 Solving Inequalities in One Variable
There are two methods for approximating the solution of an inequality using graphing.
1. Write the inequality with zero on one side of the inequality sign. Graph y=(the expression).Find the x intercepts. The solution will be an inequality with the x values (x intercepts) as thecutoff numbers. The points of intersection can be found using TRACE and ZOOM or usingthe SOLVE( from the MATH menu.
2. Graph y=(left side of the inequality) and y=(right side of the inequality) on the samecoordinate axes. The x coordinate of the points of intersection are the solutions to theequation. Identify which side of the x value satisfies the inequality by observing the graphs ofthe two functions.The points of intersection can be found using TRACE and ZOOM or using intersect from theCALC menu.
Example 1 Approximate the solution to 3x2
2 - 5 ≤ 2(x+3)
3 . Use two decimal place accuracy.
Solution:
Method 1 Write the equation as
3x2
2 - 5 -
2(x+3)
3 ≤ 0. Graph y =
3x2
2 - 5 -
2(x+3)
3
and find the x intercepts. This was done in Section A-10 Example 1 Method 1.
The x intercepts are -1.95 and 2.39. The solution to the inequality is the interval on x for whichthe graph is below the x axis. The solution is -1.95 ≤ x ≤ 2.39.
Method 2 Graph y = 3x2
2 - 5 and y = 2(x+3)
3 on the same coordinate axes and find the x
coordinate of their points of intersection. See Section A-10 Example 1 Method 2. The xcoordinate of the points of intersections are -1.95 and 2.39. We see that the parabola is below thex line for -1.95 ≤ x ≤ 2.39. Hence the inequality is satisfied for -1.95≤ x ≤2.39.
Basic Operations TI-82 Calculator 18
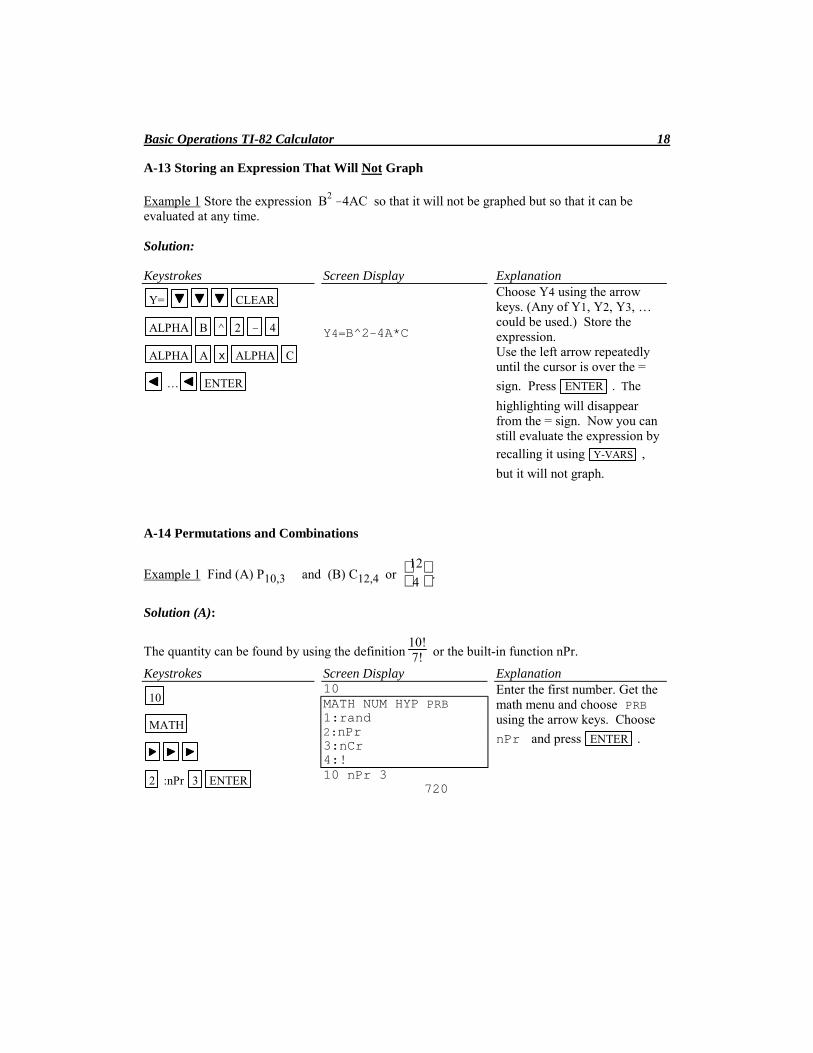
A-13 Storing an Expression That Will Not Graph
Example 1 Store the expression B2 -4AC so that it will not be graphed but so that it can beevaluated at any time.
Solution:
Keystrokes
Y= CLEAR
ALPHA B ^ 2 - 4
ALPHA A x ALPHA C
… ENTER
Screen Display
Y4=B^2-4A*C
ExplanationChoose Y4 using the arrowkeys. (Any of Y1, Y2, Y3, …could be used.) Store theexpression.Use the left arrow repeatedlyuntil the cursor is over the =
sign. Press ENTER . The
highlighting will disappearfrom the = sign. Now you canstill evaluate the expression byrecalling it using Y-VARS ,
but it will not graph.
A-14 Permutations and Combinations
Example 1 Find (A) P10,3 and (B) C12,4 or
12
4 .
Solution (A):
The quantity can be found by using the definition 10!7! or the built-in function nPr.
Keystrokes
10
MATH
2 :nPr 3 ENTER
Screen Display10MATH NUM HYP PRB1:rand2:nPr3:nCr4:!10 nPr 3
720
ExplanationEnter the first number. Get themath menu and choose PRBusing the arrow keys. Choose
nPr and press ENTER .
Basic Operations TI-82 Calculator 19
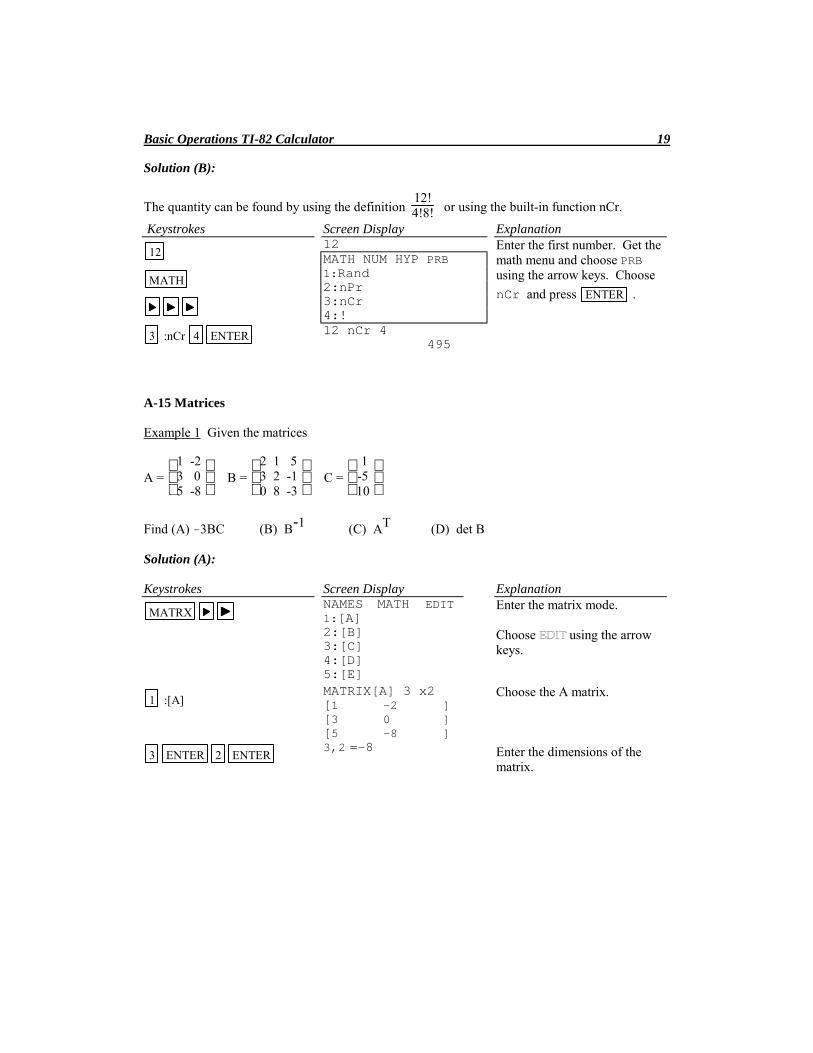
Solution (B):
The quantity can be found by using the definition 12!4!8! or using the built-in function nCr.
Keystrokes
12
MATH
3 :nCr 4 ENTER
Screen Display12MATH NUM HYP PRB1:Rand2:nPr3:nCr4:!12 nCr 4 495
ExplanationEnter the first number. Get themath menu and choose PRBusing the arrow keys. Choose
nCr and press ENTER .
A-15 Matrices
Example 1 Given the matrices
A =
1 -2
3 0 5 -8
B =
2 1 5
3 2 -1 0 8 -3
C =
1
-5 10
Find (A) -3BC (B) B-1 (C) AT (D) det B
Solution (A):
Keystrokes
MATRX
Screen DisplayNAMES MATH EDIT1:[A]2:[B]3:[C]4:[D]5:[E]
ExplanationEnter the matrix mode.
Choose using the arrowkeys.
1 :[A]
3 ENTER 2 ENTER
MATRIX[A] 3 x2[1 -2 ][3 0 ][5 -8 ]3,2 =-8
Choose the A matrix.
Enter the dimensions of thematrix.
Basic Operations TI-82 Calculator 20
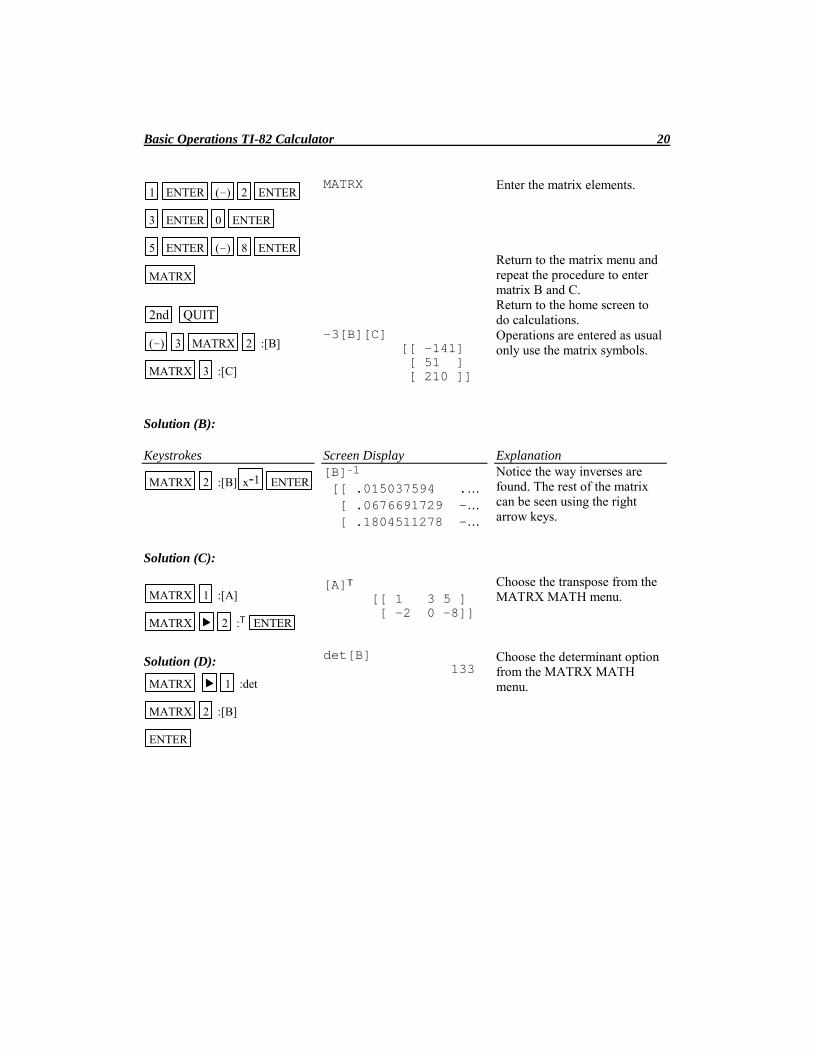
1 ENTER (-) 2 ENTER
3 ENTER 0 ENTER
5 ENTER (-) 8 ENTER
MATRX
2nd QUIT
MATRX Enter the matrix elements.
Return to the matrix menu andrepeat the procedure to entermatrix B and C.Return to the home screen todo calculations.
(-) 3 MATRX 2 :[B]
MATRX 3 :[C]
-3[B][C][[ -141] [ 51 ] [ 210 ]]
Operations are entered as usualonly use the matrix symbols.
Solution (B):
Keystrokes
MATRX 2 :[B] x-1 ENTER
Solution (C):
MATRX 1 :[A]
MATRX 2 :T ENTER
Solution (D):
MATRX 1 :det
MATRX 2 :[B]
ENTER
Screen Display[B]-1 [[ .015037594 .… [ .0676691729 -… [ .1804511278 -…
[A]T [[ 1 3 5 ] [ -2 0 -8]]
det[B] 133
ExplanationNotice the way inverses arefound. The rest of the matrixcan be seen using the rightarrow keys.
Choose the transpose from theMATRX MATH menu.
Choose the determinant optionfrom the MATRX MATHmenu.
Basic Operations TI-82 Calculator 21
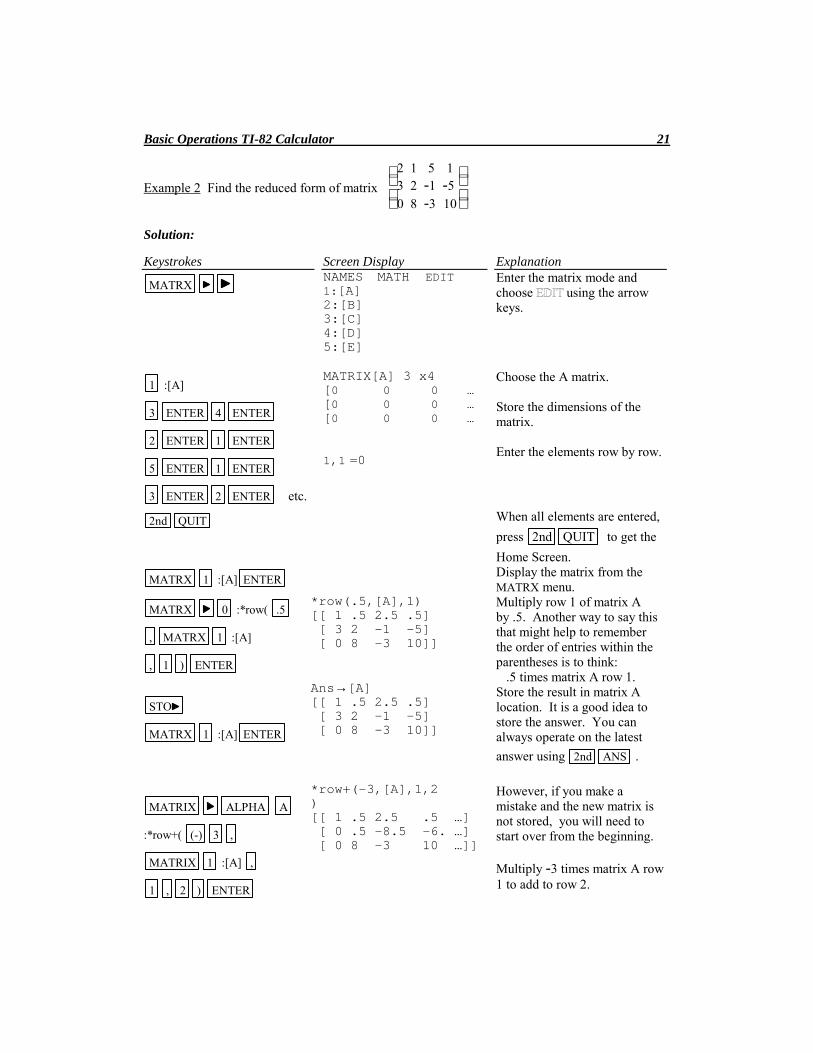
Example 2 Find the reduced form of matrix
2 1 5 1 3 2 -1 -5
0 8 -3 10
Solution:
Keystrokes
MATRX
Screen DisplayNAMES MATH EDIT1:[A]2:[B]3:[C]4:[D]5:[E]
ExplanationEnter the matrix mode andchoose using the arrowkeys.
1 :[A]
3 ENTER 4 ENTER
2 ENTER 1 ENTER
5 ENTER 1 ENTER
3 ENTER 2 ENTER etc.
MATRIX[A] 3 x4[0 0 0 …[0 0 0 …[0 0 0 …
1,1 =0
Choose the A matrix.
Store the dimensions of thematrix.
Enter the elements row by row.
2nd QUIT When all elements are entered,
press 2nd QUIT to get the
Home Screen.
MATRX 1 :[A] ENTER Display the matrix from theMATRX menu.
MATRX 0 :*row( .5
, MATRX 1 :[A]
, 1 ) ENTER
STO
MATRX 1 :[A] ENTER
MATRIX ALPHA A
:*row+( (-) 3 ,
MATRIX 1 :[A] ,
1 , 2 ) ENTER
*row(.5,[A],1)[[ 1 .5 2.5 .5] [ 3 2 -1 -5] [ 0 8 -3 10]]
Ans→[A][[ 1 .5 2.5 .5] [ 3 2 -1 -5] [ 0 8 -3 10]]
*row+(-3,[A],1,2)[[ 1 .5 2.5 .5 …] [ 0 .5 -8.5 -6. …] [ 0 8 -3 10 …]]
Multiply row 1 of matrix Aby .5. Another way to say thisthat might help to rememberthe order of entries within theparentheses is to think: .5 times matrix A row 1.Store the result in matrix Alocation. It is a good idea tostore the answer. You canalways operate on the latest
answer using 2nd ANS .
However, if you make amistake and the new matrix isnot stored, you will need tostart over from the beginning.
Multiply -3 times matrix A row1 to add to row 2.
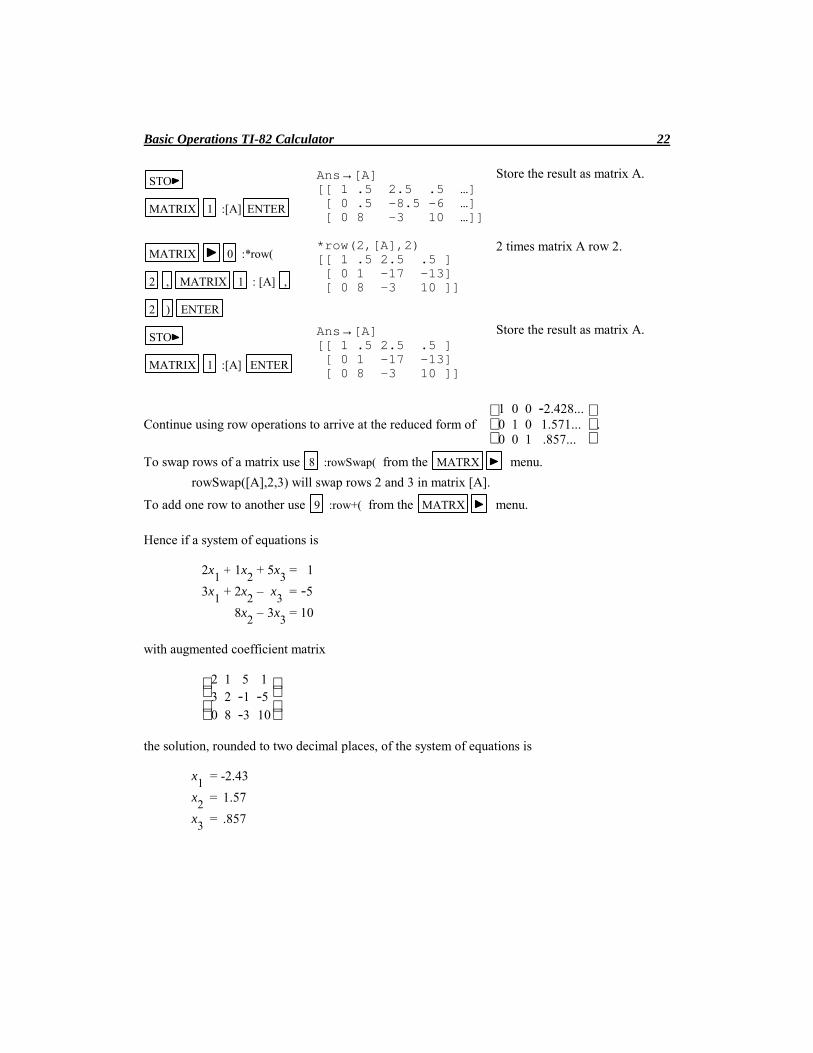
Basic Operations TI-82 Calculator 22
STO
MATRIX 1 :[A] ENTER
Ans→[A][[ 1 .5 2.5 .5 …] [ 0 .5 -8.5 -6 …] [ 0 8 -3 10 …]]
Store the result as matrix A.
MATRIX 0 :*row(
2 , MATRIX 1 : [A] ,
2 ) ENTER
*row(2,[A],2)[[ 1 .5 2.5 .5 ] [ 0 1 -17 -13] [ 0 8 -3 10 ]]
2 times matrix A row 2.
STO
MATRIX 1 :[A] ENTER
Ans→[A][[ 1 .5 2.5 .5 ] [ 0 1 -17 -13] [ 0 8 -3 10 ]]
Store the result as matrix A.
Continue using row operations to arrive at the reduced form of
1 0 0 -2.428...
0 1 0 1.571... 0 0 1 .857...
.
To swap rows of a matrix use 8 :rowSwap( from the MATRX menu.
rowSwap([A],2,3) will swap rows 2 and 3 in matrix [A].
To add one row to another use 9 :row+( from the MATRX menu.
Hence if a system of equations is
2x1
+ 1x2 + 5x
3 = 1
3x1 + 2x
2 – x
3 = -5
8x2 – 3x
3 = 10
with augmented coefficient matrix
2 1 5 1 3 2 -1 -5
0 8 -3 10
the solution, rounded to two decimal places, of the system of equations is
x1
= -2.43
x2
= 1.57
x3
= .857
Basic Operations TI-82 Calculator 23
A-16 Graphing an Inequality
There are two methods to graph an inequality.1. Graph the boundary curve. Determine the half-plane by choosing a test point not on the
boundary curve and substituting into the inequality.2. Repeat Method 1 to determine which side of the graph is to be shaded. Use the SHADE
option on the calculator to get a shaded graph.
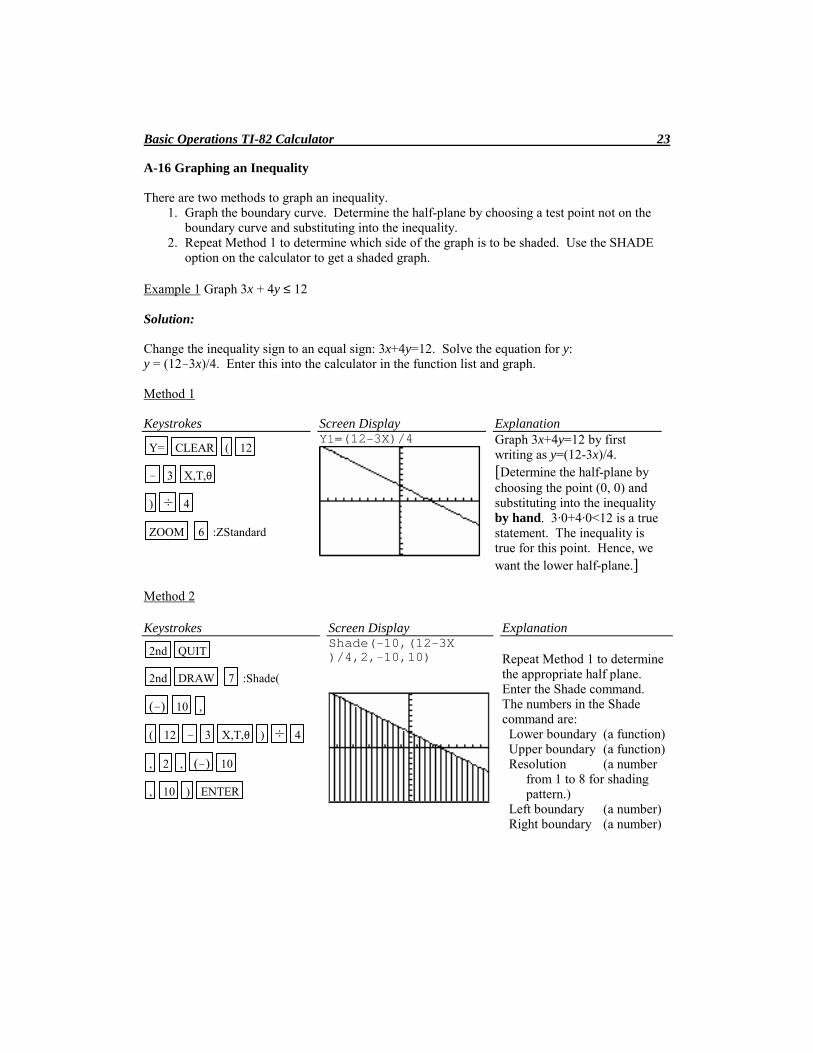
Example 1 Graph 3x + 4y ≤ 12
Solution:
Change the inequality sign to an equal sign: 3x+4y=12. Solve the equation for y:y = (12-3x)/4. Enter this into the calculator in the function list and graph.
Method 1
Keystrokes
Y= CLEAR ( 12
- 3 X,T,θ
) ÷ 4
ZOOM 6 :ZStandard
Screen DisplayY1=(12-3X)/4
ExplanationGraph 3x+4y=12 by firstwriting as y=(12-3x)/4.[Determine the half-plane bychoosing the point (0, 0) andsubstituting into the inequalityby hand. 3∙0+4∙0<12 is a truestatement. The inequality istrue for this point. Hence, wewant the lower half-plane.]
Method 2
Keystrokes
2nd QUIT
2nd DRAW 7 :Shade(
(-) 10 ,
( 12 - 3 X,T,θ ) ÷ 4
, 2 , (-) 10
, 10 ) ENTER
Screen DisplayShade(-10,(12-3X)/4,2,-10,10)
Explanation
Repeat Method 1 to determinethe appropriate half plane.Enter the Shade command.The numbers in the Shadecommand are: Lower boundary (a function) Upper boundary (a function) Resolution (a number
from 1 to 8 for shadingpattern.)
Left boundary (a number) Right boundary (a number)
Basic Operations TI-82 Calculator 24
A-17 Exponential and Hyperbolic Functions
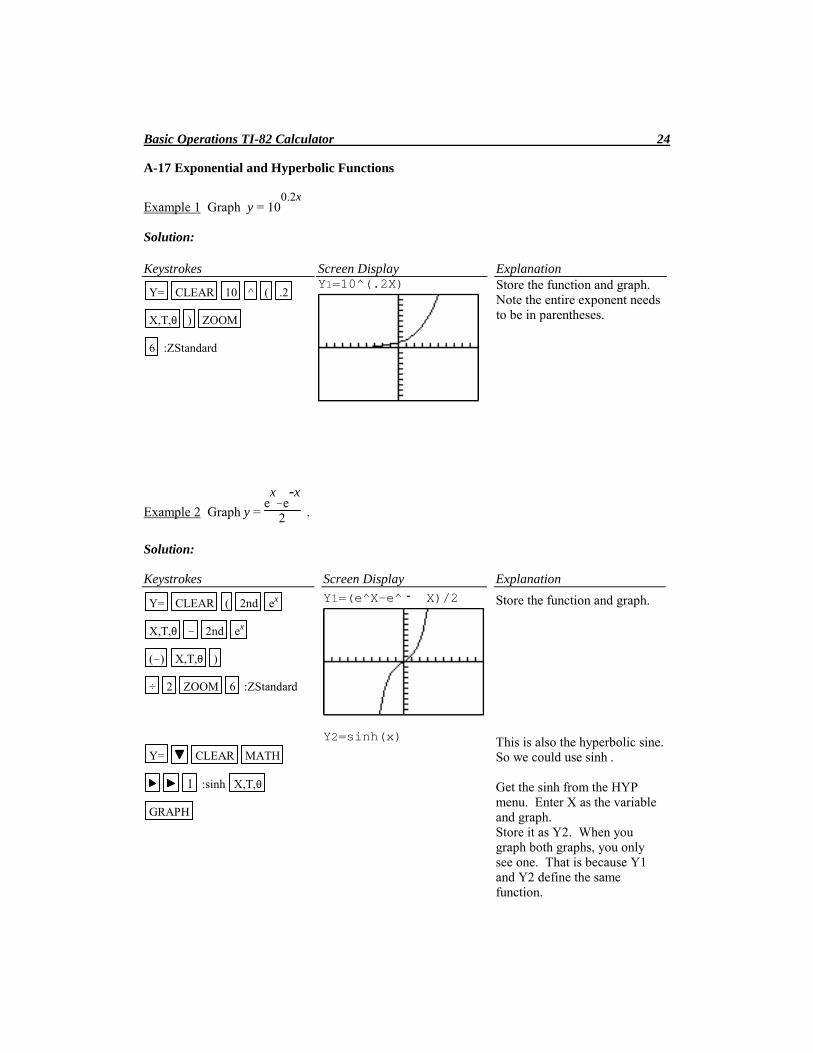
Example 1 Graph y = 100.2x
Solution:
Keystrokes
Y= CLEAR 10 ^ ( .2
X,T,θ ) ZOOM
6 :ZStandard
Screen DisplayY1=10^(.2X)
ExplanationStore the function and graph.Note the entire exponent needsto be in parentheses.
Example 2 Graph y = ex-e
-x
2 .
Solution:
Keystrokes
Y= CLEAR ( 2nd ex
X,T,θ - 2nd ex
(-) X,T,θ )
÷ 2 ZOOM 6 :ZStandard
Y= CLEAR MATH
1 :sinh X,T,θ
GRAPH
Screen Display
Y1=(e^X–e^ - X)/2
Y2=sinh(x)
Explanation
Store the function and graph.
This is also the hyperbolic sine.So we could use sinh .
Get the sinh from the HYPmenu. Enter X as the variableand graph.Store it as Y2. When yougraph both graphs, you onlysee one. That is because Y1and Y2 define the samefunction.
Basic Operations TI-82 Calculator 25
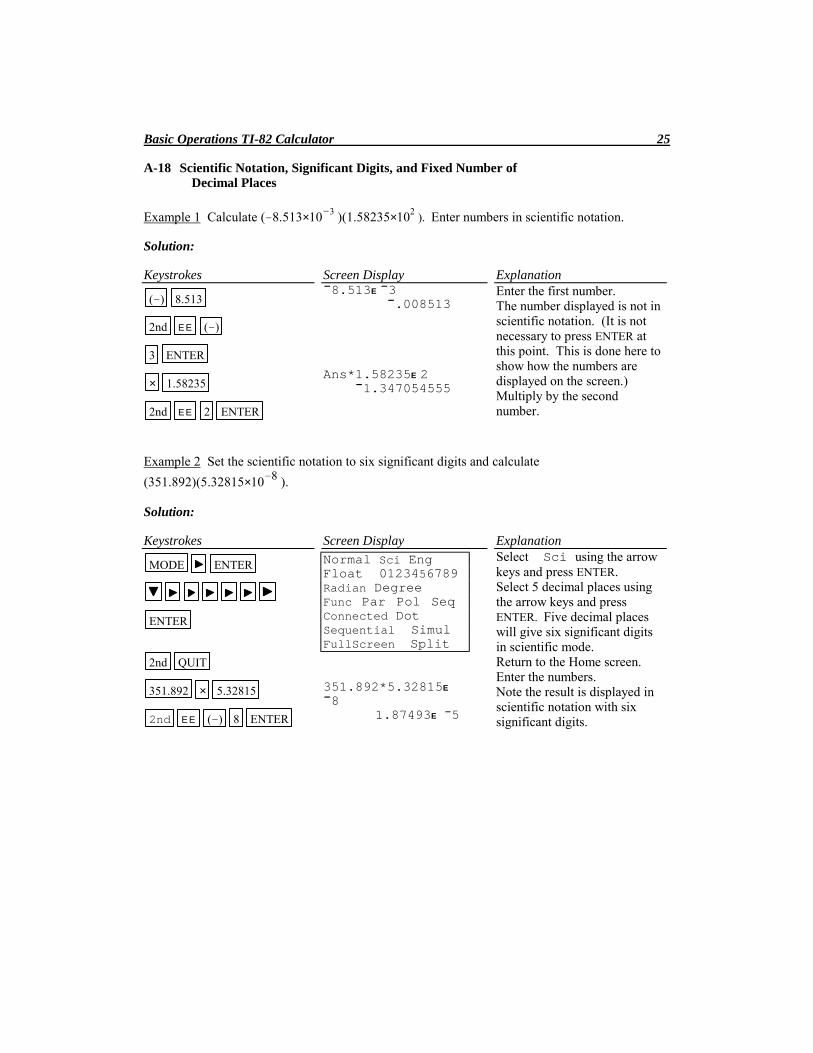
A-18 Scientific Notation, Significant Digits, and Fixed Number ofDecimal Places
Example 1 Calculate (-8.513×10⁻³ )(1.58235×10² ). Enter numbers in scientific notation.
Solution:
Keystrokes
(-) 8.513
2nd E E (-)
3 ENTER
× 1.58235
2nd E E 2 ENTER
Screen Display¯8.513E ¯3 ¯.008513
Ans*1.58235E 2 ¯1.347054555
ExplanationEnter the first number.The number displayed is not inscientific notation. (It is notnecessary to press ENTER atthis point. This is done here toshow how the numbers aredisplayed on the screen.)Multiply by the secondnumber.
Example 2 Set the scientific notation to six significant digits and calculate
(351.892)(5.32815×10⁻⁸ ).
Solution:
Keystrokes
MODE ENTER
ENTER
2nd QUIT
351.892 × 5.32815
2nd E E (-) 8 ENTER
Screen Display
Normal Sci EngFloat 0123456789Radian DegreeFunc Par Pol SeqConnected DotSequential SimulFullScreen Split
351.892*5.32815E
¯8 1.87493E ¯5
ExplanationSelect Sci using the arrowkeys and press ENTER.Select 5 decimal places usingthe arrow keys and pressENTER. Five decimal placeswill give six significant digitsin scientific mode.Return to the Home screen.Enter the numbers.Note the result is displayed inscientific notation with sixsignificant digits.
Basic Operations TI-82 Calculator 26
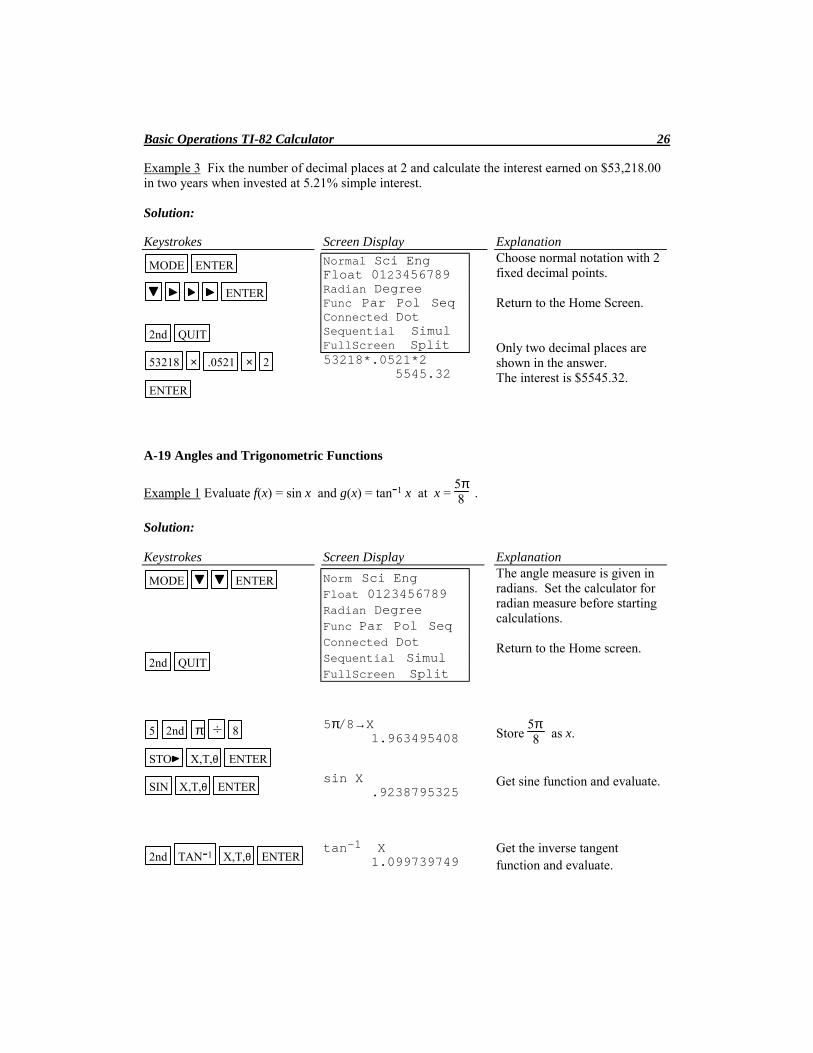
Example 3 Fix the number of decimal places at 2 and calculate the interest earned on $53,218.00in two years when invested at 5.21% simple interest.
Solution:
Keystrokes
MODE ENTER
ENTER
2nd QUIT
53218 × .0521 × 2
ENTER
Screen Display
Normal Sci EngFloat 0123456789Radian DegreeFunc Par Pol SeqConnected DotSequential SimulFullScreen Split53218*.0521*2 5545.32
ExplanationChoose normal notation with 2fixed decimal points.
Return to the Home Screen.
Only two decimal places areshown in the answer.The interest is $5545.32.
A-19 Angles and Trigonometric Functions
Example 1 Evaluate f(x) = sin x and g(x) = tan-1 x at x = 5π8 .
Solution:
Keystrokes
MODE ENTER
2nd QUIT
Screen Display
Norm Sci EngFloat 0123456789Radian DegreeFunc Par Pol SeqConnected DotSequential SimulFullScreen Split
ExplanationThe angle measure is given inradians. Set the calculator forradian measure before startingcalculations.
Return to the Home screen.
5 2nd π ÷ 8
STO X,T,θ ENTER
5π/8→X 1.963495408 Store
5π 8 as x.
SIN X,T,θ ENTER sin X .9238795325
Get sine function and evaluate.
2nd TAN-1 X,T,θ ENTER tan-1 X 1.099739749
Get the inverse tangentfunction and evaluate.
Basic Operations TI-82 Calculator 27
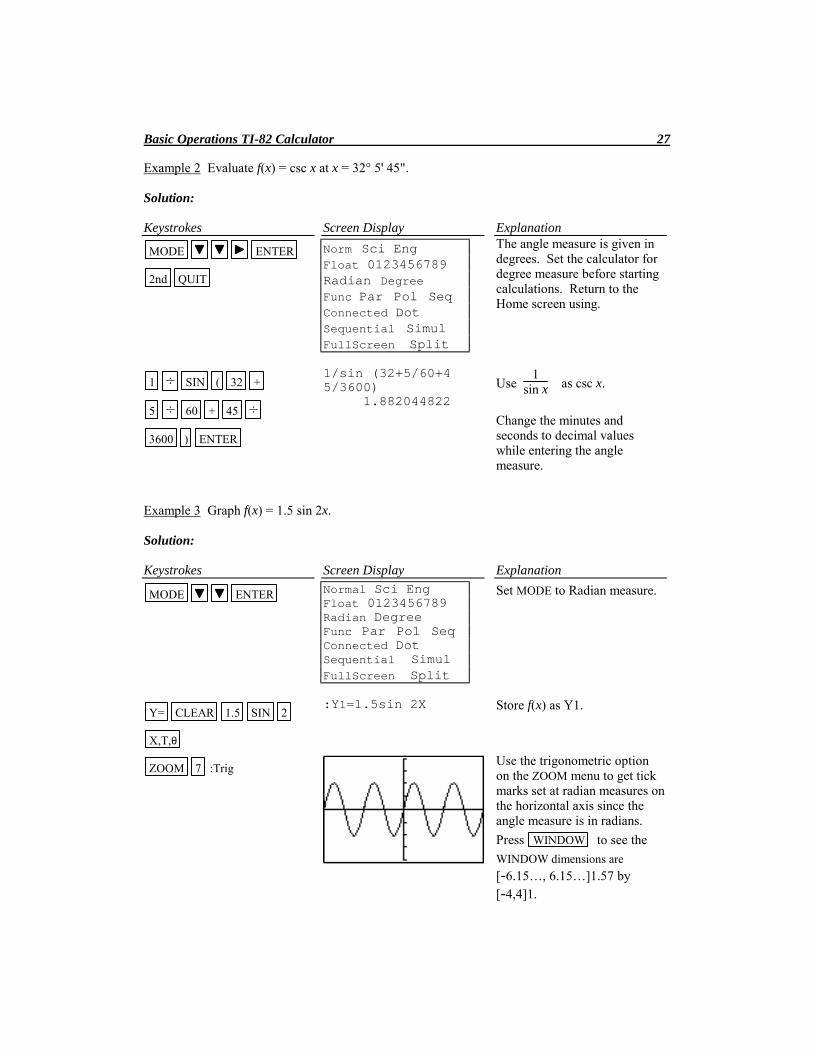
Example 2 Evaluate f(x) = csc x at x = 32° 5' 45".
Solution:
Keystrokes
MODE ENTER
2nd QUIT
Screen Display
Norm Sci EngFloat 0123456789Radian DegreeFunc Par Pol SeqConnected DotSequential SimulFullScreen Split
ExplanationThe angle measure is given indegrees. Set the calculator fordegree measure before startingcalculations. Return to theHome screen using.
1 ÷ SIN ( 32 +
5 ÷ 60 + 45 ÷
3600 ) ENTER
1/sin (32+5/60+45/3600) 1.882044822
Use 1
sin x as csc x.
Change the minutes andseconds to decimal valueswhile entering the anglemeasure.
Example 3 Graph f(x) = 1.5 sin 2x.
Solution:
Keystrokes
MODE ENTER
Screen Display
Normal Sci EngFloat 0123456789Radian DegreeFunc Par Pol SeqConnected DotSequential SimulFullScreen Split
Explanation
Set MODE to Radian measure.
Y= CLEAR 1.5 SIN 2
X,T,θ
:Y1=1.5sin 2X Store f(x) as Y1.
ZOOM 7 :TrigUse the trigonometric optionon the ZOOM menu to get tickmarks set at radian measures onthe horizontal axis since theangle measure is in radians.
Press WINDOW to see the
WINDOW dimensions are
[-6.15…, 6.15…]1.57 by
[-4,4]1.
Basic Operations TI-82 Calculator 28
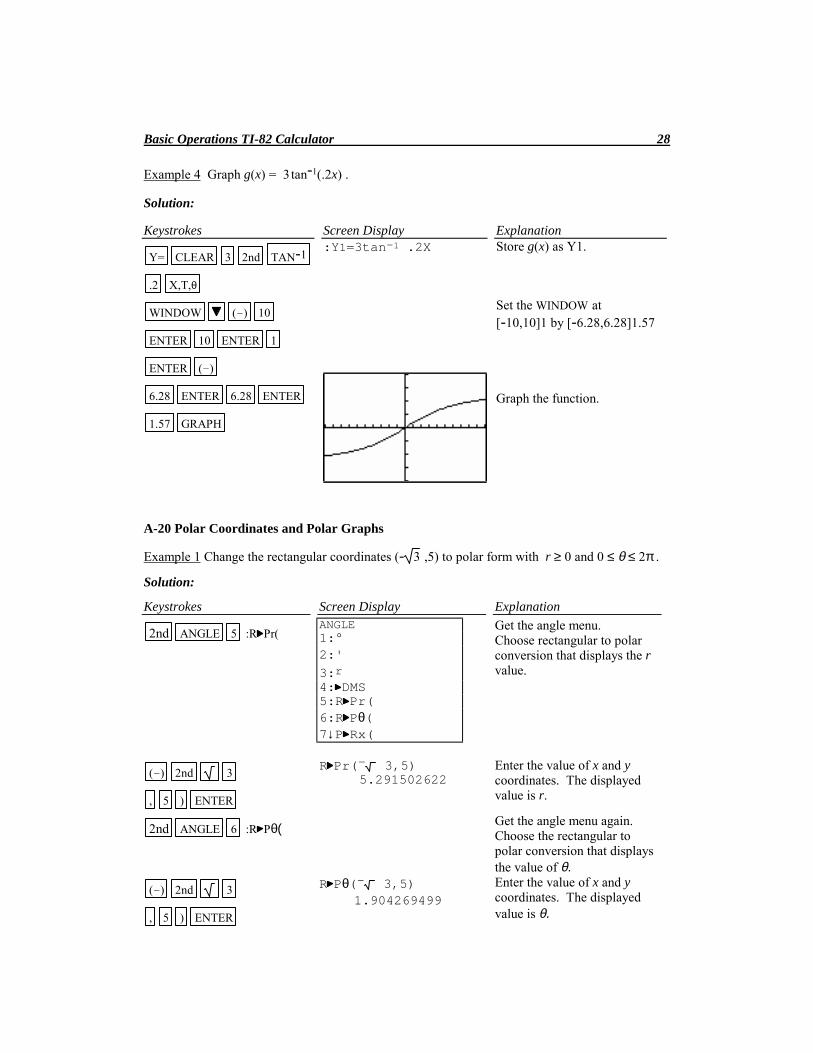
Example 4 Graph g(x) = 3 tan-1(.2x) .
Solution:
Keystrokes
Y= CLEAR 3 2nd TAN-1
.2 X,T,θ
Screen Display:Y1=3tan-1 .2X
ExplanationStore g(x) as Y1.
WINDOW (-) 10
ENTER 10 ENTER 1
ENTER (-)
6.28 ENTER 6.28 ENTER
1.57 GRAPH
Set the WINDOW at[-10,10]1 by [-6.28,6.28]1.57
Graph the function.
A-20 Polar Coordinates and Polar Graphs
Example 1 Change the rectangular coordinates (- 3 ,5) to polar form with r ≥ 0 and 0 ≤ θ ≤ 2π .
Solution:
Keystrokes Screen Display Explanation
2nd ANGLE 5 :R Pr(ANGLE1:°2:'
3:r 4: DMS5:R Pr(6:R Pθ(7↓P Rx(
Get the angle menu.Choose rectangular to polarconversion that displays the rvalue.
(-) 2nd 3
, 5 ) ENTER
R Pr(¯ 3,5) 5.291502622
Enter the value of x and ycoordinates. The displayedvalue is r.
2nd ANGLE 6 :R Pθ( Get the angle menu again.Choose the rectangular topolar conversion that displaysthe value of θ.
(-) 2nd 3
, 5 ) ENTER
R Pθ(¯ 3,5) 1.904269499
Enter the value of x and ycoordinates. The displayedvalue is θ.
Basic Operations TI-82 Calculator 29
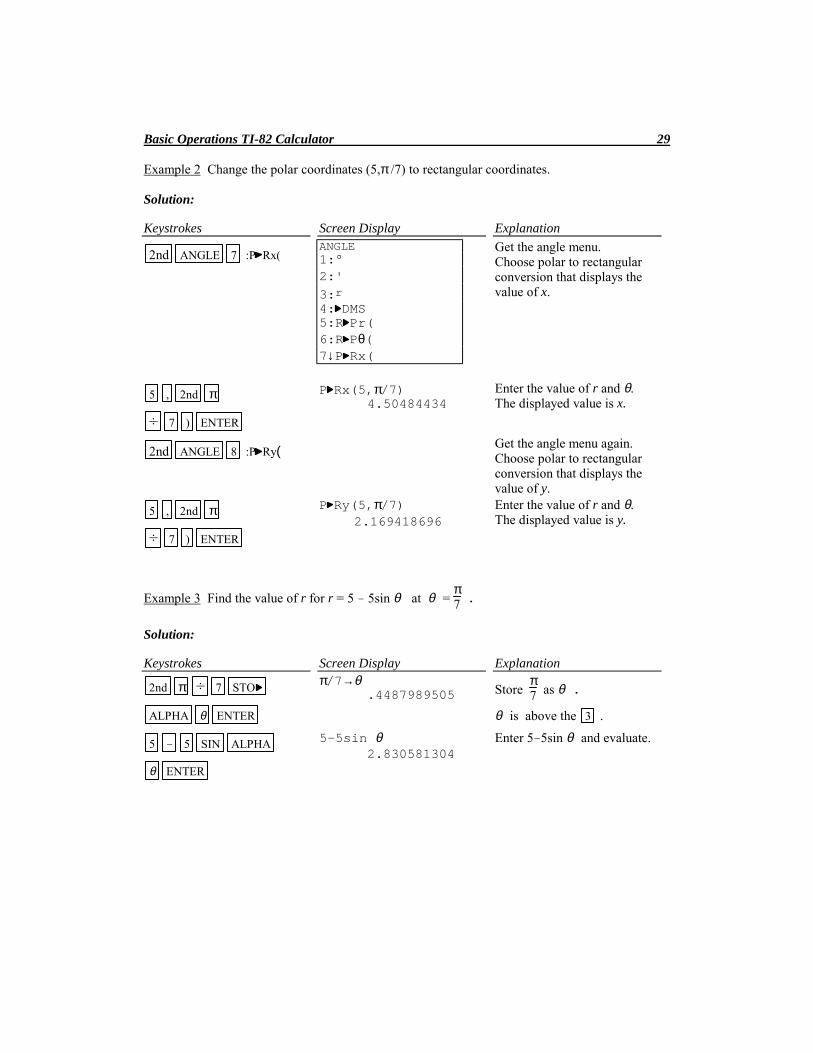
Example 2 Change the polar coordinates (5,π /7) to rectangular coordinates.
Solution:
Keystrokes Screen Display Explanation
2nd ANGLE 7 :P Rx(ANGLE1:°2:'
3:r 4: DMS5:R Pr(6:R Pθ(7↓P Rx(
Get the angle menu.Choose polar to rectangularconversion that displays thevalue of x.
5 , 2nd π
÷ 7 ) ENTER
P Rx(5,π/7) 4.50484434
Enter the value of r and θ.The displayed value is x.
2nd ANGLE 8 :P Ry( Get the angle menu again.Choose polar to rectangularconversion that displays thevalue of y.
5 , 2nd π
÷ 7 ) ENTER
P Ry(5,π/7) 2.169418696
Enter the value of r and θ.The displayed value is y.
Example 3 Find the value of r for r = 5 - 5sin θ at θ = π7 .
Solution:
Keystrokes Screen Display Explanation
2nd π ÷ 7 STO
ALPHA θ ENTER
π/7→θ .4487989505 Store
π7 as θ .
θ is above the 3 .
5 - 5 SIN ALPHA
θ ENTER
5-5sin θ 2.830581304
Enter 5-5sin θ and evaluate.
Basic Operations TI-82 Calculator 30
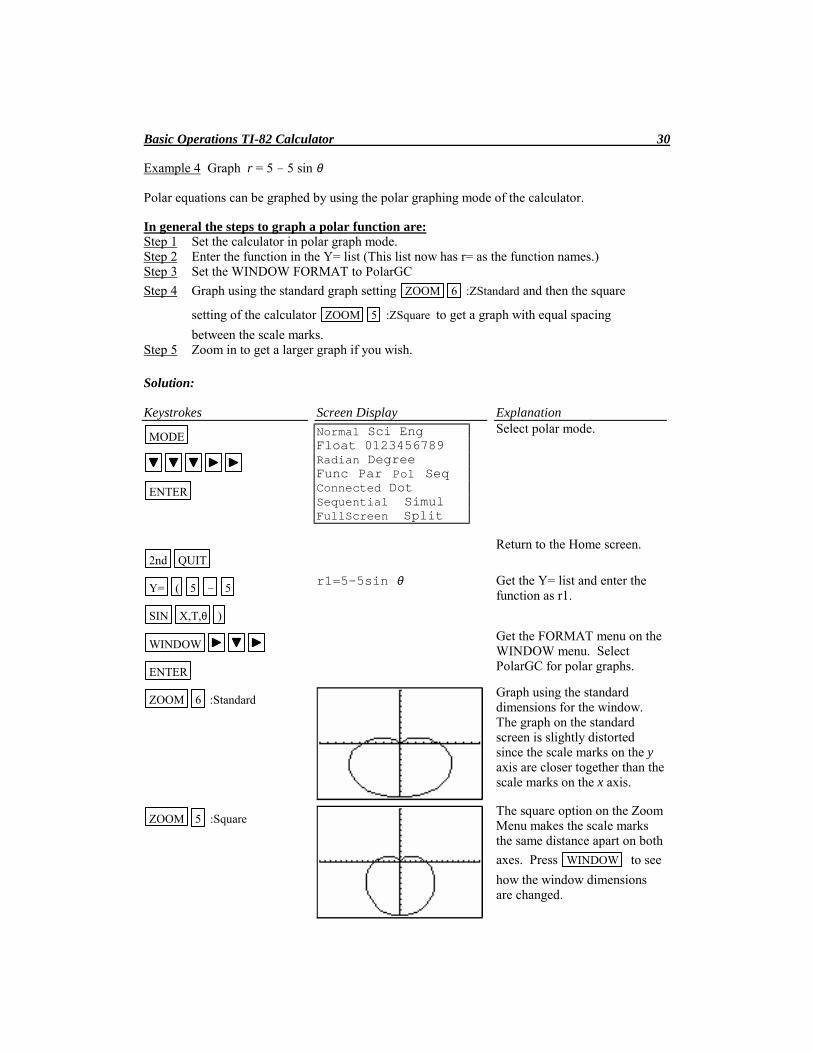
Example 4 Graph r = 5 - 5 sin θ Polar equations can be graphed by using the polar graphing mode of the calculator.
In general the steps to graph a polar function are:Step 1 Set the calculator in polar graph mode.Step 2 Enter the function in the Y= list (This list now has r= as the function names.)Step 3 Set the WINDOW FORMAT to PolarGC
Step 4 Graph using the standard graph setting ZOOM 6 :ZStandard and then the square
setting of the calculator ZOOM 5 :ZSquare to get a graph with equal spacing
between the scale marks.Step 5 Zoom in to get a larger graph if you wish.
Solution:
Keystrokes Screen Display Explanation
MODE
ENTER
2nd QUIT
Normal Sci EngFloat 0123456789Radian DegreeFunc Par Pol SeqConnected DotSequential SimulFullScreen Split
Select polar mode.
Return to the Home screen.
Y= ( 5 - 5
SIN X,T,θ )
r1=5-5sin θ Get the Y= list and enter thefunction as r1.
WINDOW
ENTER
Get the FORMAT menu on theWINDOW menu. SelectPolarGC for polar graphs.
ZOOM 6 :StandardGraph using the standarddimensions for the window.The graph on the standardscreen is slightly distortedsince the scale marks on the yaxis are closer together than thescale marks on the x axis.
ZOOM 5 :SquareThe square option on the ZoomMenu makes the scale marksthe same distance apart on both
axes. Press WINDOW to see
how the window dimensionsare changed.
Recommended


![Running Head: IMPACT OF HANDHELD GRAPHING CALCULATOR … · Handheld Graphing Calculator Use [Key-TI 051228.2100] Heller Research Associates ©2005 1 Impact of Handheld Graphing Calculator](https://img.pdfslide.us/doc/110x75/60178c16de86900da315a012/running-head-impact-of-handheld-graphing-calculator-handheld-graphing-calculator.jpg)