SMERA MFI GRADING
This is to certify that
Network Of Entrepreneurship & Economic Development (NEED) has been assigned
a SMERA MFI Grading of
SMERA MF3
This grading indicates Above Average level of credit strength
This Grading is valid from August 31, 2016 to August 30, 2017
For SMERA Ratings Limited
Sankar Chakraborti Chief Executive Officer
Disclaimer: SMERA MFI Gradings are based on the data and information (Data) provided by the Entity and obtained by SMERA from sources it considers reliable. Although reasonable care has been taken to verify the Data, SMERA, makes no representation or warranty, expressed or
implied with respect to the accuracy, adequacy or completeness of any Data relied upon. SMERA is not responsible for any errors or omissions or for the results obtained from the use of the Grading or the Grading Report and especially states that it has no financial liability, whatsoever, for any direct, indirect or consequential loss of any kind arising from the use of its Gradings. A SMERA MFI Grading does not constitute an audit of the graded entity and should not be treated as a recommendation or opinion or a substitute for investor's independent assessment of
whether to buy, sell or hold any security. The SMERA MFI Grading Report should not be distributed/ published/ reproduced in any form without SMERA’s prior written approval.
1
SMERA MFI Grading Report
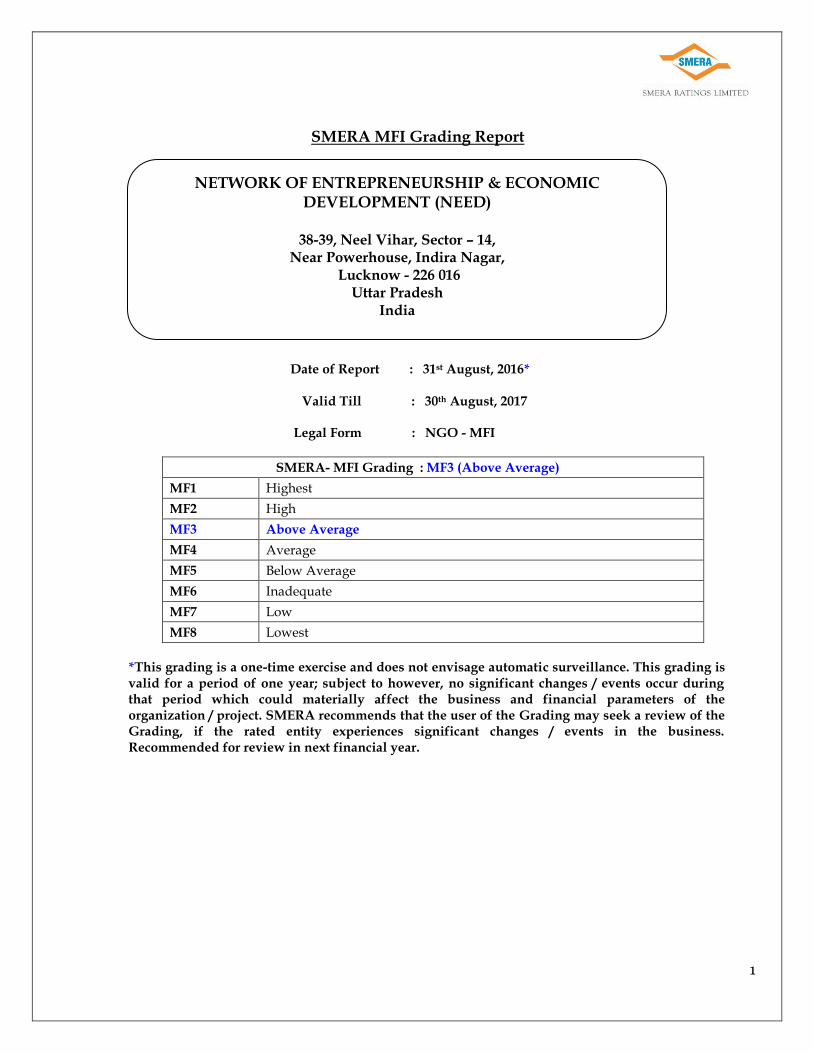
Date of Report : 31st August, 2016* Valid Till : 30th August, 2017
Legal Form : NGO - MFI
SMERA- MFI Grading : MF3 (Above Average)
MF1 Highest
MF2 High
MF3 Above Average
MF4 Average
MF5 Below Average
MF6 Inadequate
MF7 Low
MF8 Lowest
*This grading is a one-time exercise and does not envisage automatic surveillance. This grading is valid for a period of one year; subject to however, no significant changes / events occur during that period which could materially affect the business and financial parameters of the organization / project. SMERA recommends that the user of the Grading may seek a review of the Grading, if the rated entity experiences significant changes / events in the business. Recommended for review in next financial year.
NETWORK OF ENTREPRENEURSHIP & ECONOMIC DEVELOPMENT (NEED)
38-39, Neel Vihar, Sector – 14,
Near Powerhouse, Indira Nagar, Lucknow - 226 016
Uttar Pradesh India
2
SNAPSHOT
D&B D-U-N-S® Number 65-054-5986
MFI Name NETWORK OF ENTREPRENEURSHIP & ECONOMIC DEVELOPMENT (NEED)
Trade Style “NEED”
Registered Office Address
38-39, Neel Vihar, Sector – 14, Near Power House, Indira Nagar, Lucknow - 226 016 Uttar Pradesh India
Telex (91) (522) (2712671) (91) (522) (2712311)
Website www.needindia.org www.needindia.org.in
Email [email protected]
Line of Business
Microfinance services using Joint Liability Group (JLG) and Self Help Group (SHG) Model including value chain based producer groups
Chief Executive Mr.Anil K. Singh, An Ashoka Fellow Chief Executive Officer
SMERA MFI Grading MF3 (Above Average)
Legal Form NGO-MFI (The Societies Registration Act, 1860)
Date of Incorporation 22/Jun/1995
Year of Commencement of Microfinance Operations
2005
Total Employees 102
3
RATING RATIONALE
SMERA has assigned a rating of MF3 to NETWORK OF ENTREPRENEURSHIP & ECONOMIC
DEVELOPMENT (hereafter referred as NEED). The rating indicates that in SMERA’s current opinion, the
rated MFI’s ability with regards to credit strength is Above Average.
The rating assigned to NEED reflects following strengths:
Experienced and Qualified Management
NEED has experienced & qualified board members. NEED is managed by an international Advisory
Council Comprising Social Entrepreneurs, Trainers, Behavior Scientist, Volunteers,
Professors/Researchers, Consultants etc. Mr. Anil Singh, promoter is senior research fellow from Indian
Institute of Management (IIM) Ahmedabad who took specific action research project in remote tribal
villages of India. After working about 15 years in the formal sector, he started working for social and
economic entrepreneurship.
Standardized operational procedures
NEED has appointed department-wise personnel for operations, management information system (MIS),
Internal Audit (IA), Finance & Accounts, Risk cum Mobile Manager Team, Human Resource. The NGO-MFI
has documented operational policies covering details of loan products, field operations, credit approval and
monitoring process.
Diversity in Social and Economic Services
NEED with deeper penetration in the under-served states of Uttar Pradesh & Bihar is an organization of
280 social entrepreneurs focusing on following areas.
Market based skill training and entrepreneurship dev. (MBSED) as the lead agency of Ministry of
Textiles, DFID supported project in Bihar, World Bank sponsored JEEVIKA project. NEED has also
been recipient of National Award by a Sr. Policy Official of Ministry and Hon’ble Cabinet Ministry in
an august gathering.
Promoting Pro-Poor Livelihoods& micro-enterprises including entrepreneurship,
Micro-finance way to promoting Social & Economic Enterprises including Healthcare and Sanitation,
Safe Drinking Kits,
Nutrition,
Creating a cadre of community based Village Health Guides,
4
Community School Teachers
Micro-Planning with Village Councils with public and private service institutions.
Asset Quality NEED’s assets quality is at adequate levels with almost 99.5% on-time repayment rate during the period
under study.
However the rating is constrained by following weaknesses:
Moderate financial profile
Revenue has decreased during the period under study and stands at ` 24,729 (in thousands) for FY 2016 on
account of inability to scale up its portfolio. Further outstanding portfolio has been uneven during the period
under study and stands at Rs 118,722 (in thousands) as on 31/Mar/2016.
Operational expenses have declined to 8.7% in FY 2016 from 10.00% in FY 2014 on account of implementation
of better cost control measures.
Concentration risk
NEED is susceptible to portfolio/geographical concentration coupled with sociopolitical risk as 72.34 % of its
total outstanding portfolio as on 31/Mar/2016 is concentrated in State of Uttar Pradesh.
Adherence to compliance regulations
Considering current constitution and scale of operations, compliance observed is adequate; however, for
future expansion and broader financial inclusion, SMERA believes there is scope of improvement for the
same.
SMERA observed that the current constitution of NEED hinders the expansion of existing MFI business
growth in a smooth way and hence as informed by the management NEED have plans to demerge its
microfinance activities into a separate entity of Section-8 Company, Govt. of India and ultimately will aim for
getting NBFC-MFI accreditation from Reserve Bank of India in due course of time.
5
Moderate Systems
Considering the scale of operations, the current MIS system deployed in NEED is sufficient to access
complete micro finance solution. The demand collections are updated in the system on a daily basis and
same is reconciled at Head office. Further NEED conducts internal audit at regular interval and the
same is conducted by in house internal audit team.
Considering the projected growth, SMERA recommends NEED to strengthen its internal audit team and
refine its systems and processes to reduce the credit risk and operational risk
As informed by the management NEED is planning to develop in-house software including mobile
driven tracking for real tracking of day to day microfinance operations.
6
.
MFI BACKGROUND NETWORK OF ENTREPRENEURSHIP & ECONOMIC DEVELOPMENT (NEED) was established on
22nd June, 1995 as a Not for Profit entity under The Society Act, 1860 by Mr. Anil K. Singh after having
completed his post graduate study from Xavier Ranchi (Rural Management) and then after his long
association in advance research experience from IIM, Ahmedabad followed by his good length of
working experience in livelihoods cum micro entrepreneurship both in private and public institutions.
NEED with deeper penetration in the under-served states of Uttar Pradesh & Bihar is an organization of
280 social entrepreneurs in the entire organization i.e. MF and Non-MF activities focusing on following
areas
Market based skill training and entrepreneurship dev. (MBSED) as the lead agency of Ministry of
Textiles, DFID supported project in Bihar, World Bank sponsored JEEVIKA project. NEED has also been
recipient of National Award by a Sr. Policy Official of Ministry and Hon’ble Cabinet Ministry in an
august gathering. Kindly find a few photo attached herewith.
Promoting Pro-Poor Livelihoods& micro-enterprises including entrepreneurship,
Micro-finance way to promoting Social & Economic Enterprises including healthcare and sanitation,
Safe Drinking Kits,
Nutrition,
Creating a cadre of community based Village health Guides,
Community School Teachers
Micro-Planning with Village Councils with public and private service institutions.
The above diversity of services also supplements and supports the Micro-Credit Products of NEED and also
enhances the credentials and trustworthiness of relationship between NEED and Micro-Finance borrowers in
a very matured way The targeted communities mostly includes Minority groups, Youth, Artisans, Women,
Marginal farmers, Children and many others who are in a still very deprived and disadvantageous condition.
7
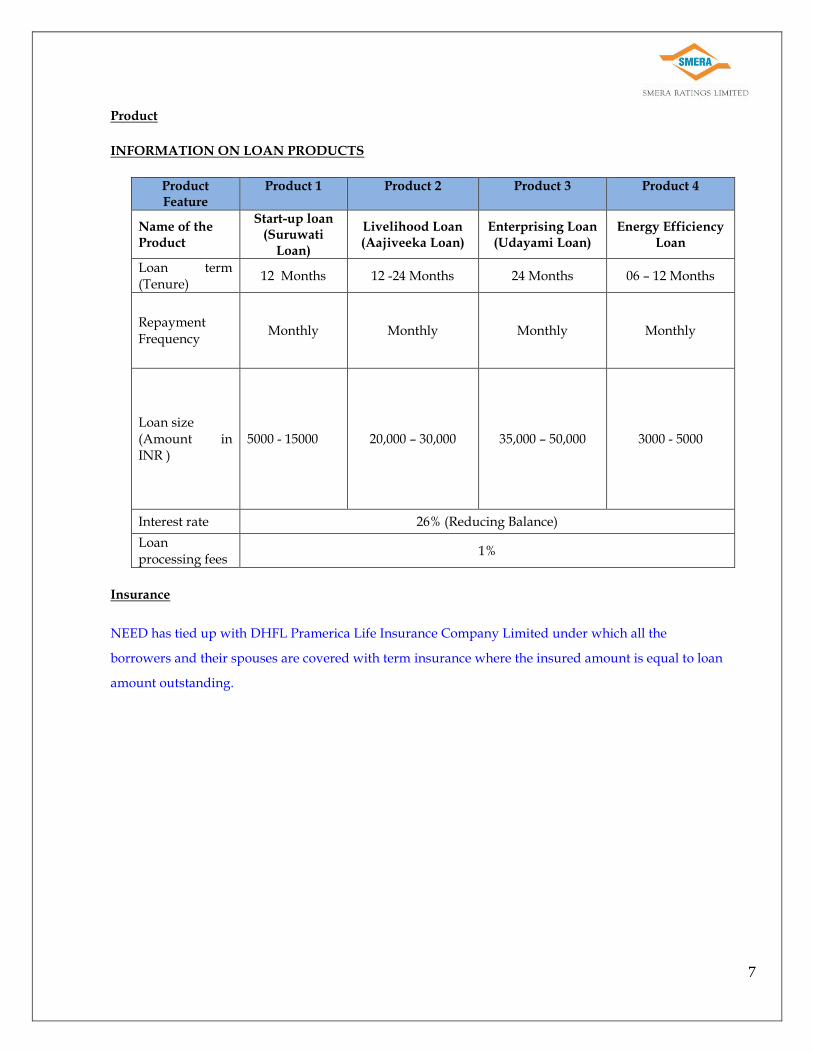
Product
INFORMATION ON LOAN PRODUCTS
Product Feature
Product 1 Product 2 Product 3 Product 4
Name of the Product
Start-up loan (Suruwati
Loan)
Livelihood Loan (Aajiveeka Loan)
Enterprising Loan (Udayami Loan)
Energy Efficiency Loan
Loan term (Tenure)
12 Months 12 -24 Months 24 Months 06 – 12 Months
Repayment Frequency
Monthly Monthly Monthly Monthly
Loan size (Amount in INR )
5000 - 15000 20,000 – 30,000 35,000 – 50,000 3000 - 5000
Interest rate 26% (Reducing Balance)
Loan processing fees
1%
Insurance
NEED has tied up with DHFL Pramerica Life Insurance Company Limited under which all the
borrowers and their spouses are covered with term insurance where the insured amount is equal to loan
amount outstanding.
8
Promoters’ Background
Mr. Anil Singh, CEO & Managing Director of NEED has done Post Graduate in Social Service (1978-80) with
specialization in Rural Management from Xavier Institute of Social Service (XISS). Mr. Anil Singh came in
contact with the pioneering Indian Institute of Management (IIM) Ahmedabad as Senior Research Fellow to
take-up a specific action research project in remote tribal villages of India. After working about 15 years in
the formal sector, he started working for social and economic entrepreurship. Mr. Singh has been selected as
a lifetime member of the Ashoka Global Fellowship Program and is a Fellow of the UK based initiative
Management in Development (MIND).
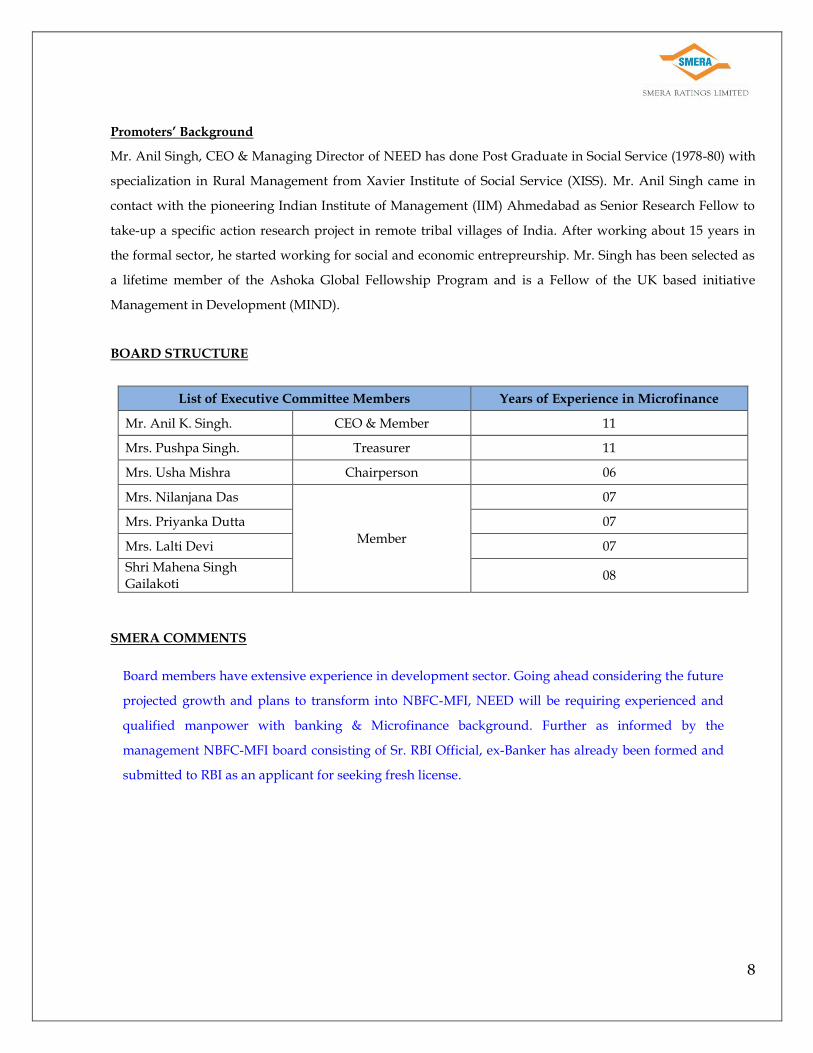
BOARD STRUCTURE
List of Executive Committee Members Years of Experience in Microfinance
Mr. Anil K. Singh. CEO & Member 11
Mrs. Pushpa Singh. Treasurer 11
Mrs. Usha Mishra Chairperson 06
Mrs. Nilanjana Das
Member
07
Mrs. Priyanka Dutta 07
Mrs. Lalti Devi 07
Shri Mahena Singh Gailakoti
08
SMERA COMMENTS
Board members have extensive experience in development sector. Going ahead considering the future
projected growth and plans to transform into NBFC-MFI, NEED will be requiring experienced and
qualified manpower with banking & Microfinance background. Further as informed by the
management NBFC-MFI board consisting of Sr. RBI Official, ex-Banker has already been formed and
submitted to RBI as an applicant for seeking fresh license.
9
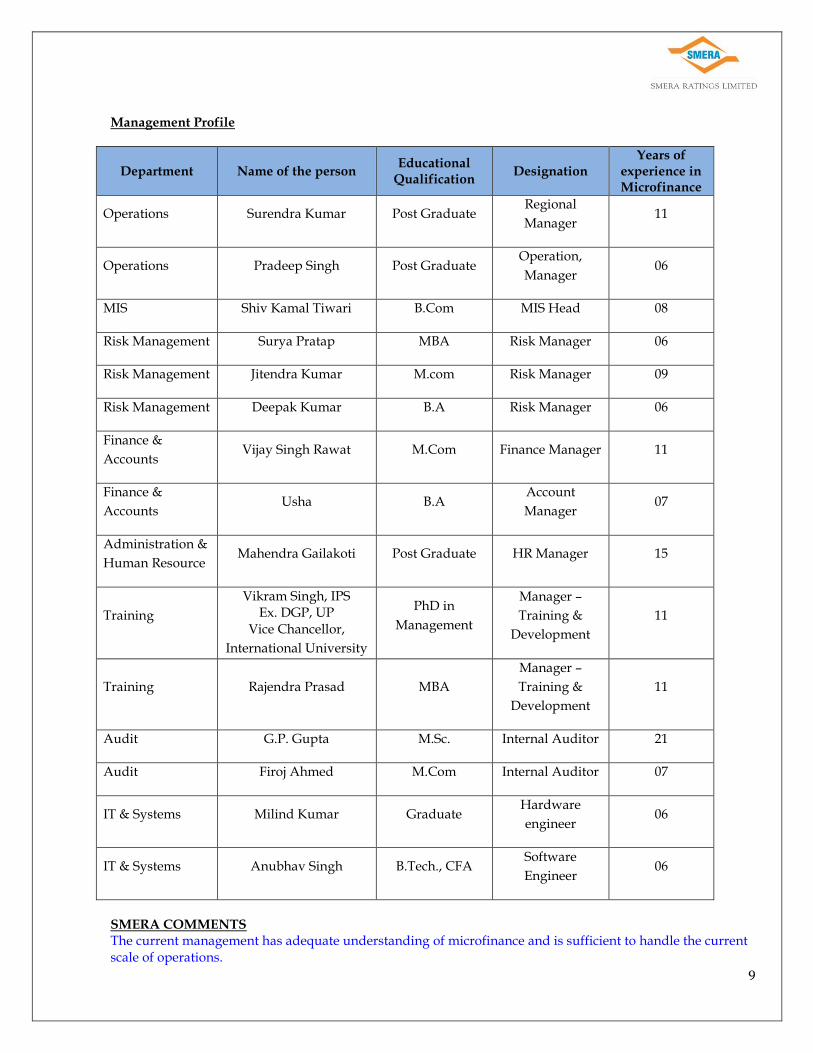
Management Profile
Department Name of the person Educational
Qualification Designation
Years of experience in Microfinance
Operations Surendra Kumar Post Graduate Regional
Manager 11
Operations Pradeep Singh Post Graduate Operation,
Manager 06
MIS Shiv Kamal Tiwari B.Com MIS Head 08
Risk Management Surya Pratap MBA Risk Manager 06
Risk Management Jitendra Kumar M.com Risk Manager 09
Risk Management Deepak Kumar B.A Risk Manager 06
Finance &
Accounts Vijay Singh Rawat M.Com Finance Manager 11
Finance &
Accounts Usha B.A
Account
Manager 07
Administration &
Human Resource Mahendra Gailakoti Post Graduate HR Manager 15
Training
Vikram Singh, IPS Ex. DGP, UP
Vice Chancellor,
International University
PhD in
Management
Manager –
Training &
Development
11
Training Rajendra Prasad MBA
Manager –
Training &
Development
11
Audit G.P. Gupta M.Sc. Internal Auditor 21
Audit Firoj Ahmed M.Com Internal Auditor 07
IT & Systems Milind Kumar Graduate Hardware
engineer 06
IT & Systems Anubhav Singh B.Tech., CFA Software
Engineer 06
SMERA COMMENTS The current management has adequate understanding of microfinance and is sufficient to handle the current scale of operations.
10
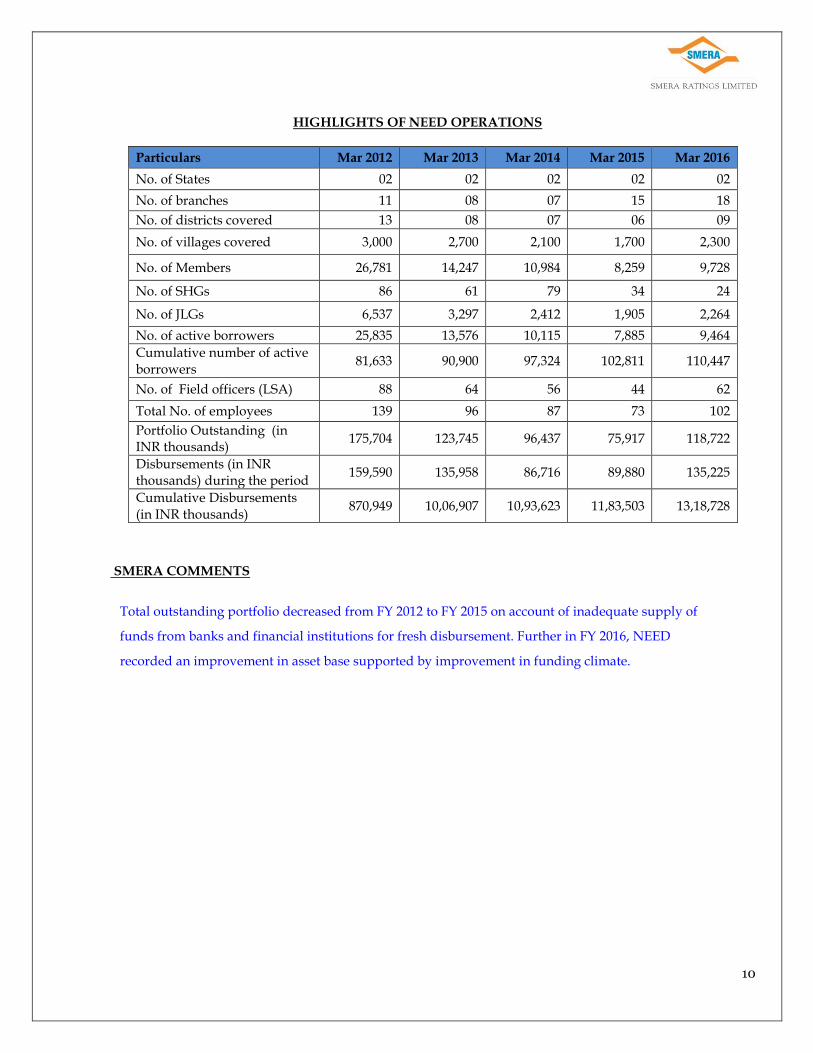
HIGHLIGHTS OF NEED OPERATIONS
Particulars Mar 2012 Mar 2013 Mar 2014 Mar 2015 Mar 2016
No. of States 02 02 02 02 02
No. of branches 11 08 07 15 18
No. of districts covered 13 08 07 06 09
No. of villages covered 3,000 2,700 2,100 1,700 2,300
No. of Members 26,781 14,247 10,984 8,259 9,728
No. of SHGs 86 61 79 34 24
No. of JLGs 6,537 3,297 2,412 1,905 2,264
No. of active borrowers 25,835 13,576 10,115 7,885 9,464
Cumulative number of active borrowers
81,633 90,900 97,324 102,811 110,447
No. of Field officers (LSA) 88 64 56 44 62
Total No. of employees 139 96 87 73 102
Portfolio Outstanding (in INR thousands)
175,704 123,745 96,437 75,917 118,722
Disbursements (in INR thousands) during the period
159,590 135,958 86,716 89,880 135,225
Cumulative Disbursements (in INR thousands)
870,949 10,06,907 10,93,623 11,83,503 13,18,728
SMERA COMMENTS
Total outstanding portfolio decreased from FY 2012 to FY 2015 on account of inadequate supply of
funds from banks and financial institutions for fresh disbursement. Further in FY 2016, NEED
recorded an improvement in asset base supported by improvement in funding climate.
11
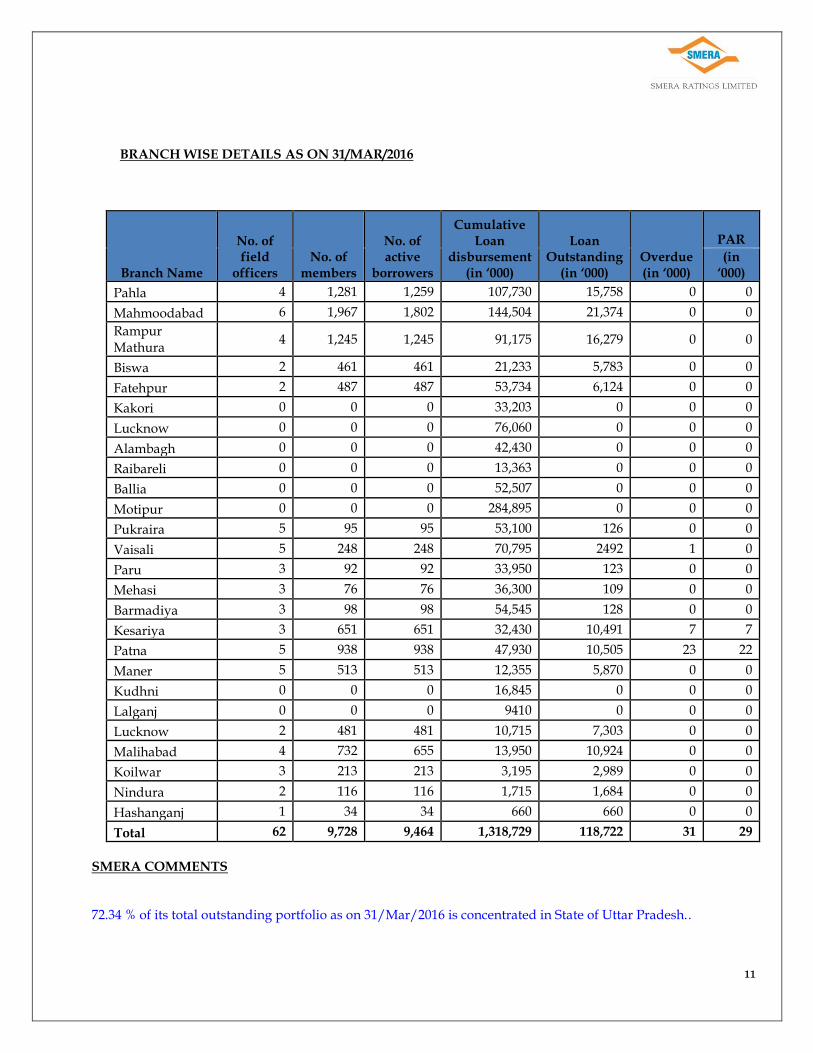
BRANCH WISE DETAILS AS ON 31/MAR/2016
Branch Name
No. of field
officers No. of
members
No. of active
borrowers
Cumulative Loan
disbursement (in ‘000)
Loan Outstanding
(in ‘000) Overdue (in ‘000)
PAR
(in ‘000)
Pahla 4 1,281 1,259 107,730 15,758 0 0
Mahmoodabad 6 1,967 1,802 144,504 21,374 0 0
Rampur Mathura
4 1,245 1,245 91,175 16,279 0 0
Biswa 2 461 461 21,233 5,783 0 0
Fatehpur 2 487 487 53,734 6,124 0 0
Kakori 0 0 0 33,203 0 0 0
Lucknow 0 0 0 76,060 0 0 0
Alambagh 0 0 0 42,430 0 0 0
Raibareli 0 0 0 13,363 0 0 0
Ballia 0 0 0 52,507 0 0 0
Motipur 0 0 0 284,895 0 0 0
Pukraira 5 95 95 53,100 126 0 0
Vaisali 5 248 248 70,795 2492 1 0
Paru 3 92 92 33,950 123 0 0
Mehasi 3 76 76 36,300 109 0 0
Barmadiya 3 98 98 54,545 128 0 0
Kesariya 3 651 651 32,430 10,491 7 7
Patna 5 938 938 47,930 10,505 23 22
Maner 5 513 513 12,355 5,870 0 0
Kudhni 0 0 0 16,845 0 0 0
Lalganj 0 0 0 9410 0 0 0
Lucknow 2 481 481 10,715 7,303 0 0
Malihabad 4 732 655 13,950 10,924 0 0
Koilwar 3 213 213 3,195 2,989 0 0
Nindura 2 116 116 1,715 1,684 0 0
Hashanganj 1 34 34 660 660 0 0
Total 62 9,728 9,464 1,318,729 118,722 31 29
SMERA COMMENTS
72.34 % of its total outstanding portfolio as on 31/Mar/2016 is concentrated in State of Uttar Pradesh..
12
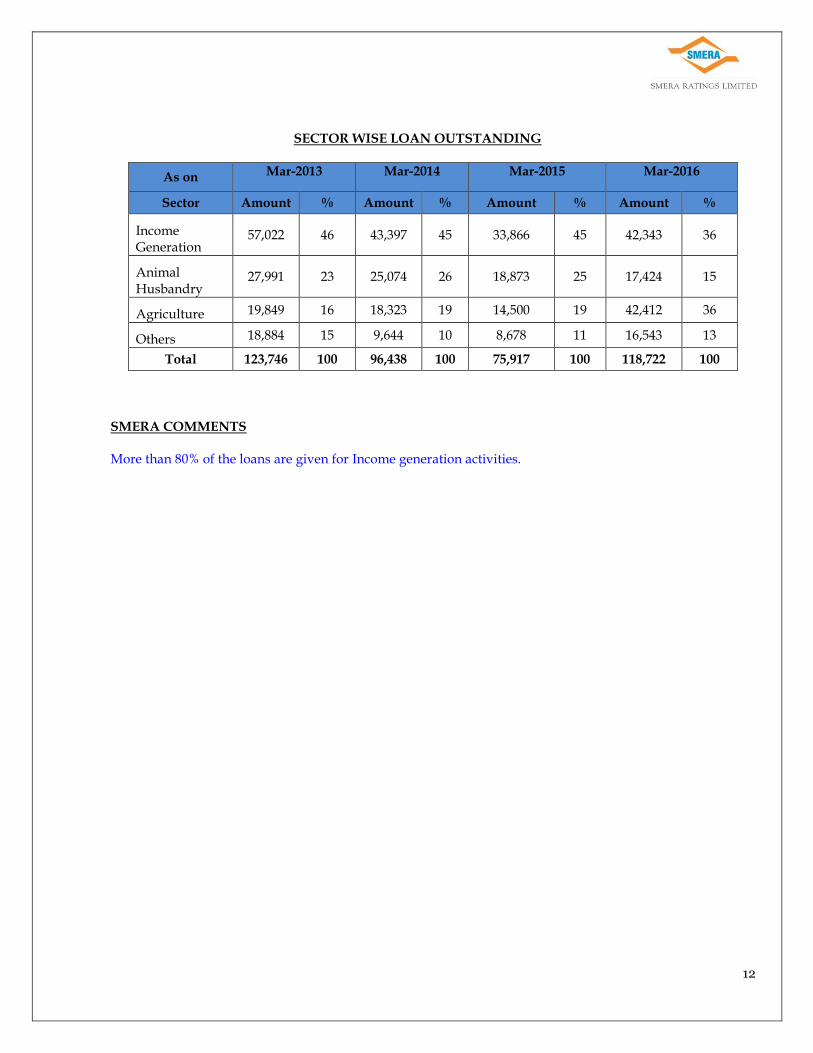
SECTOR WISE LOAN OUTSTANDING
As on Mar-2013
Mar-2014 Mar-2015 Mar-2016
Sector Amount % Amount % Amount % Amount %
Income Generation
57,022 46 43,397 45 33,866 45 42,343 36
Animal Husbandry
27,991 23 25,074 26 18,873 25 17,424 15
Agriculture 19,849 16 18,323 19 14,500 19 42,412 36
Others 18,884 15 9,644 10 8,678 11 16,543 13
Total 123,746 100 96,438 100 75,917 100 118,722 100
SMERA COMMENTS More than 80% of the loans are given for Income generation activities.
13
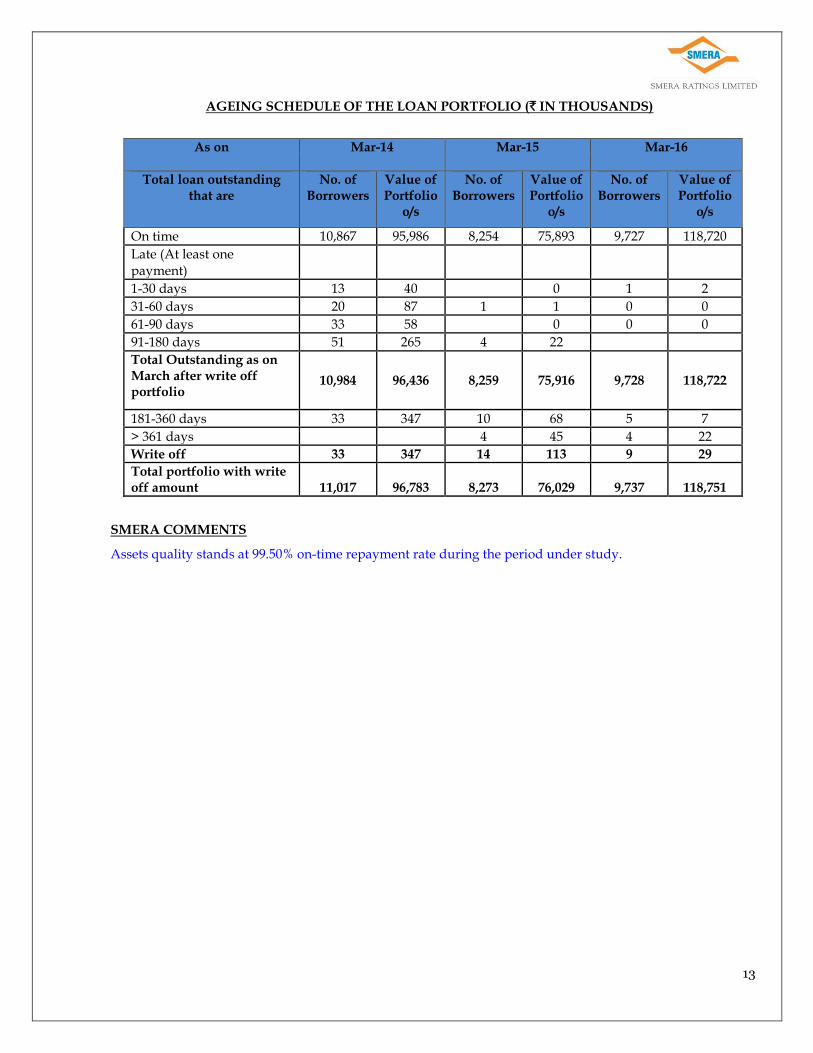
AGEING SCHEDULE OF THE LOAN PORTFOLIO (` IN THOUSANDS)
As on Mar-14 Mar-15 Mar-16
Total loan outstanding that are
No. of Borrowers
Value of Portfolio
o/s
No. of Borrowers
Value of Portfolio
o/s
No. of Borrowers
Value of Portfolio
o/s
On time 10,867 95,986 8,254 75,893 9,727 118,720
Late (At least one payment)
1-30 days 13 40 0 1 2
31-60 days 20 87 1 1 0 0
61-90 days 33 58 0 0 0
91-180 days 51 265 4 22
Total Outstanding as on March after write off portfolio
10,984 96,436 8,259 75,916 9,728 118,722
181-360 days 33 347 10 68 5 7
> 361 days 4 45 4 22
Write off 33 347 14 113 9 29
Total portfolio with write off amount 11,017 96,783 8,273 76,029 9,737 118,751
SMERA COMMENTS
Assets quality stands at 99.50% on-time repayment rate during the period under study.
14
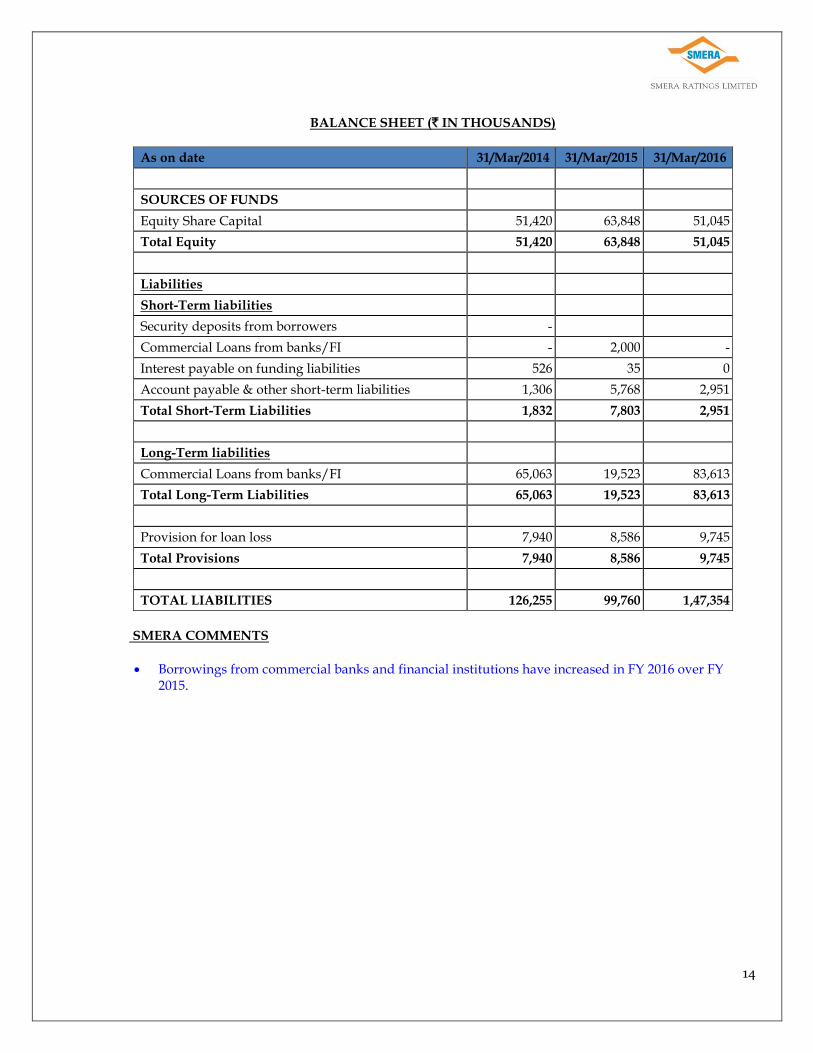
BALANCE SHEET (` IN THOUSANDS)
As on date 31/Mar/2014 31/Mar/2015 31/Mar/2016
SOURCES OF FUNDS
Equity Share Capital 51,420 63,848 51,045
Total Equity 51,420 63,848 51,045
Liabilities
Short-Term liabilities
Security deposits from borrowers -
Commercial Loans from banks/FI - 2,000 -
Interest payable on funding liabilities 526 35 0
Account payable & other short-term liabilities 1,306 5,768 2,951
Total Short-Term Liabilities 1,832 7,803 2,951
Long-Term liabilities
Commercial Loans from banks/FI 65,063 19,523 83,613
Total Long-Term Liabilities 65,063 19,523 83,613
Provision for loan loss 7,940 8,586 9,745
Total Provisions 7,940 8,586 9,745
TOTAL LIABILITIES 126,255 99,760 1,47,354
SMERA COMMENTS
Borrowings from commercial banks and financial institutions have increased in FY 2016 over FY 2015.
15
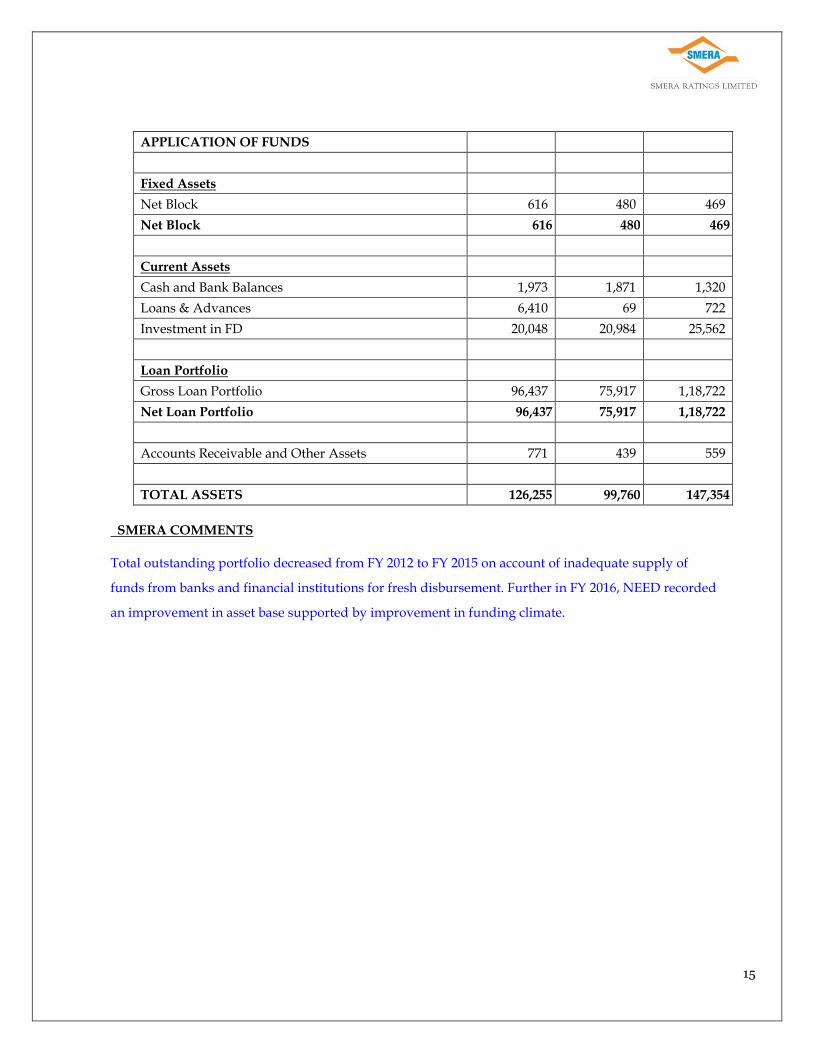
APPLICATION OF FUNDS
Fixed Assets
Net Block 616 480 469
Net Block 616 480 469
Current Assets
Cash and Bank Balances 1,973 1,871 1,320
Loans & Advances 6,410 69 722
Investment in FD 20,048 20,984 25,562
Loan Portfolio
Gross Loan Portfolio 96,437 75,917 1,18,722
Net Loan Portfolio 96,437 75,917 1,18,722
Accounts Receivable and Other Assets 771 439 559
TOTAL ASSETS 126,255 99,760 147,354
SMERA COMMENTS
Total outstanding portfolio decreased from FY 2012 to FY 2015 on account of inadequate supply of
funds from banks and financial institutions for fresh disbursement. Further in FY 2016, NEED recorded
an improvement in asset base supported by improvement in funding climate.
16
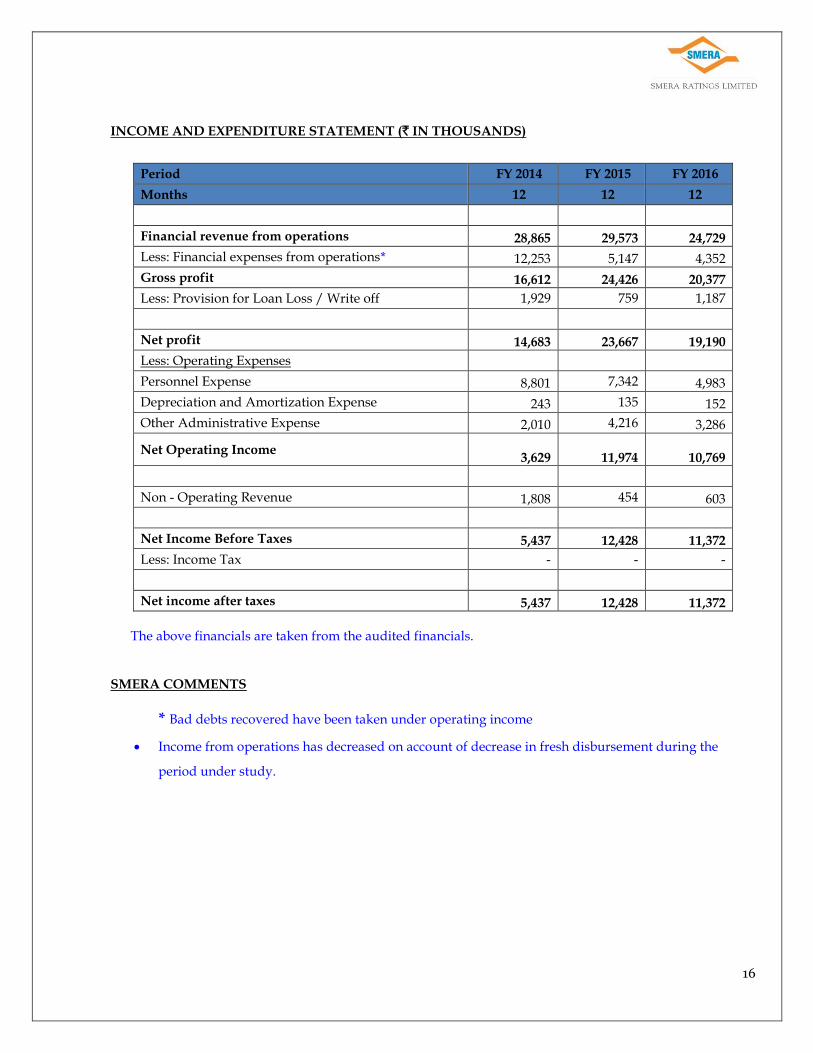
INCOME AND EXPENDITURE STATEMENT (` IN THOUSANDS)
Period FY 2014 FY 2015 FY 2016
Months 12 12 12
Financial revenue from operations 28,865 29,573 24,729
Less: Financial expenses from operations* 12,253 5,147 4,352
Gross profit 16,612 24,426 20,377
Less: Provision for Loan Loss / Write off 1,929 759 1,187
Net profit 14,683 23,667 19,190
Less: Operating Expenses
Personnel Expense 8,801 7,342 4,983
Depreciation and Amortization Expense 243 135 152
Other Administrative Expense 2,010 4,216 3,286
Net Operating Income
3,629
11,974
10,769
Non - Operating Revenue 1,808 454 603
Net Income Before Taxes 5,437 12,428 11,372
Less: Income Tax - - -
Net income after taxes 5,437 12,428 11,372
The above financials are taken from the audited financials.
SMERA COMMENTS
* Bad debts recovered have been taken under operating income
Income from operations has decreased on account of decrease in fresh disbursement during the
period under study.
17
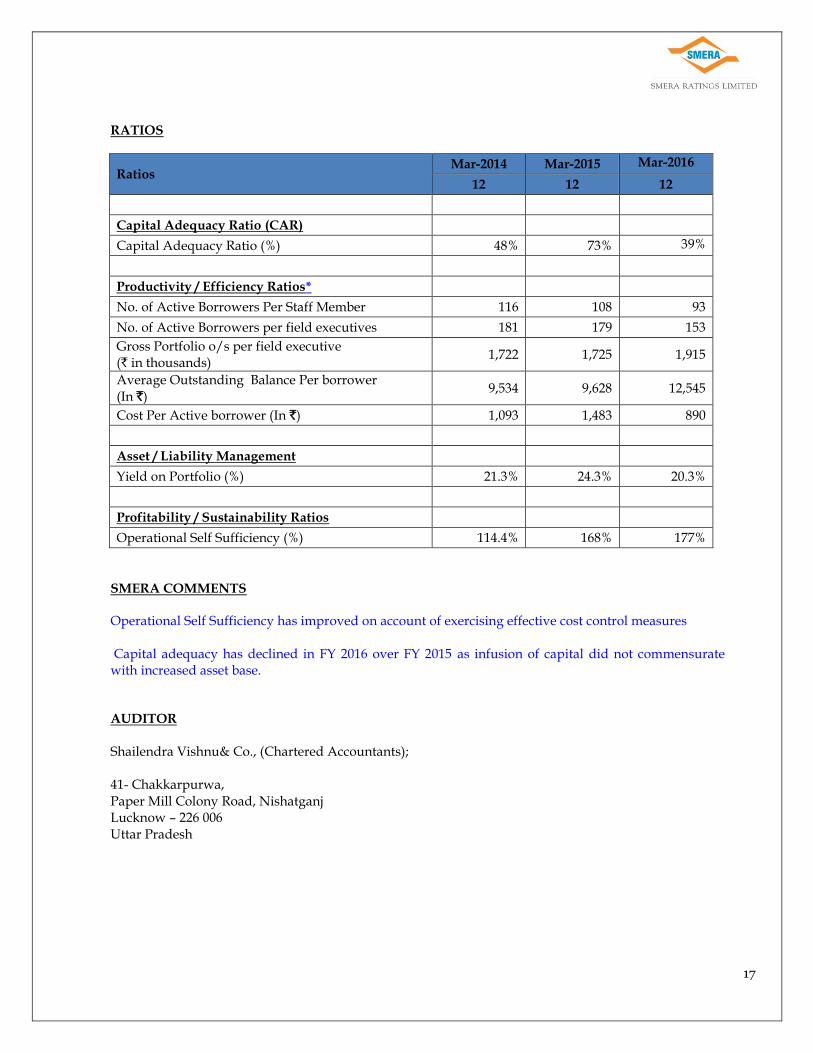
RATIOS
Ratios Mar-2014 Mar-2015 Mar-2016
12 12 12
Capital Adequacy Ratio (CAR)
Capital Adequacy Ratio (%) 48% 73% 39%
Productivity / Efficiency Ratios*
No. of Active Borrowers Per Staff Member 116 108 93
No. of Active Borrowers per field executives 181 179 153
Gross Portfolio o/s per field executive (` in thousands)
1,722 1,725 1,915
Average Outstanding Balance Per borrower (In `)
9,534 9,628 12,545
Cost Per Active borrower (In `) 1,093 1,483 890
Asset / Liability Management
Yield on Portfolio (%) 21.3% 24.3% 20.3%
Profitability / Sustainability Ratios
Operational Self Sufficiency (%) 114.4% 168% 177%
SMERA COMMENTS
Operational Self Sufficiency has improved on account of exercising effective cost control measures Capital adequacy has declined in FY 2016 over FY 2015 as infusion of capital did not commensurate with increased asset base. AUDITOR Shailendra Vishnu& Co., (Chartered Accountants); 41- Chakkarpurwa, Paper Mill Colony Road, Nishatganj Lucknow – 226 006 Uttar Pradesh
18
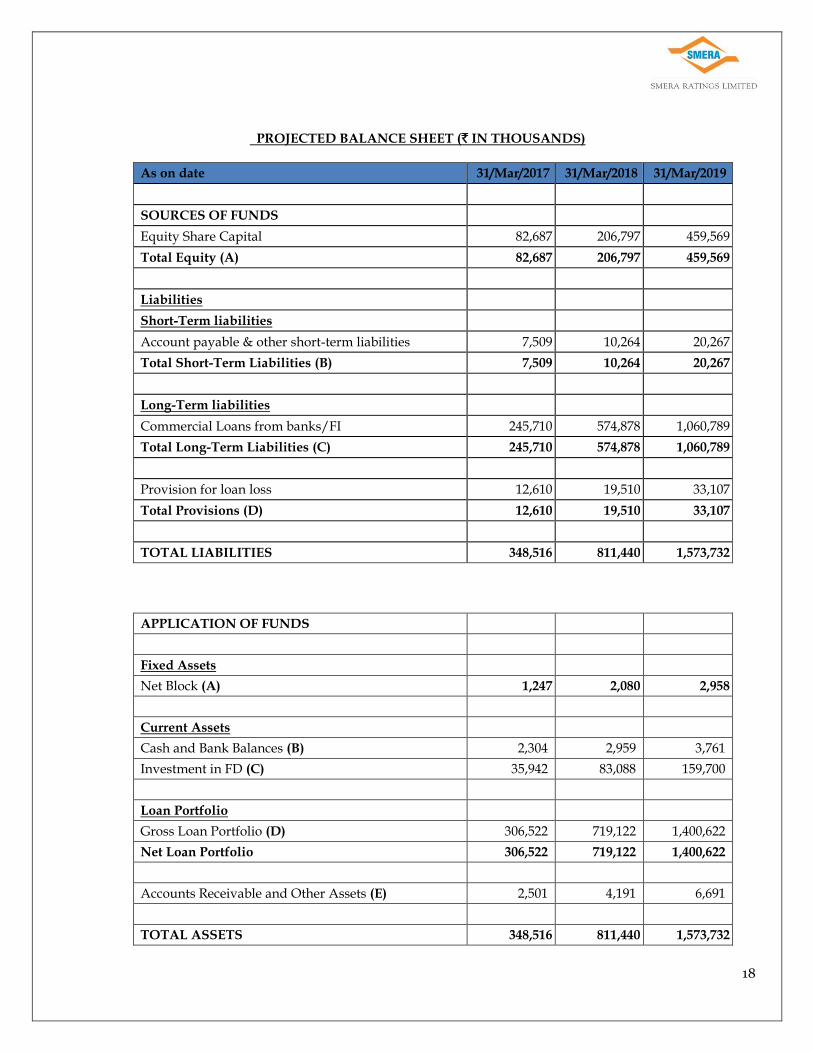
PROJECTED BALANCE SHEET (` IN THOUSANDS)
As on date 31/Mar/2017 31/Mar/2018 31/Mar/2019
SOURCES OF FUNDS
Equity Share Capital 82,687 206,797 459,569
Total Equity (A) 82,687 206,797 459,569
Liabilities
Short-Term liabilities
Account payable & other short-term liabilities 7,509 10,264 20,267
Total Short-Term Liabilities (B) 7,509 10,264 20,267
Long-Term liabilities
Commercial Loans from banks/FI 245,710 574,878 1,060,789
Total Long-Term Liabilities (C) 245,710 574,878 1,060,789
Provision for loan loss 12,610 19,510 33,107
Total Provisions (D) 12,610 19,510 33,107
TOTAL LIABILITIES 348,516 811,440 1,573,732
APPLICATION OF FUNDS
Fixed Assets
Net Block (A) 1,247 2,080 2,958
Current Assets
Cash and Bank Balances (B) 2,304 2,959 3,761
Investment in FD (C) 35,942 83,088 159,700
Loan Portfolio
Gross Loan Portfolio (D) 306,522 719,122 1,400,622
Net Loan Portfolio 306,522 719,122 1,400,622
Accounts Receivable and Other Assets (E) 2,501 4,191 6,691
TOTAL ASSETS 348,516 811,440 1,573,732
19
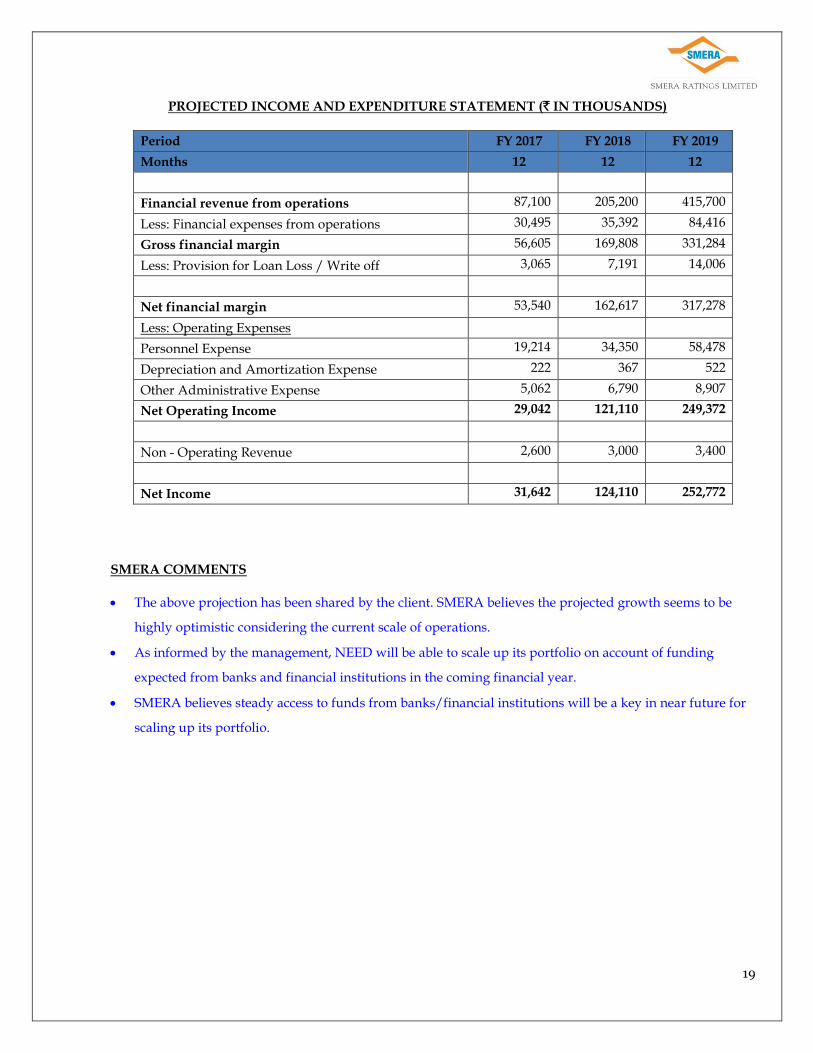
PROJECTED INCOME AND EXPENDITURE STATEMENT (` IN THOUSANDS)
Period FY 2017 FY 2018 FY 2019
Months 12 12 12
Financial revenue from operations 87,100 205,200 415,700
Less: Financial expenses from operations 30,495 35,392 84,416
Gross financial margin 56,605 169,808 331,284
Less: Provision for Loan Loss / Write off 3,065 7,191 14,006
Net financial margin 53,540 162,617 317,278
Less: Operating Expenses
Personnel Expense 19,214 34,350 58,478
Depreciation and Amortization Expense 222 367 522
Other Administrative Expense 5,062 6,790 8,907
Net Operating Income 29,042 121,110 249,372
Non - Operating Revenue 2,600 3,000 3,400
Net Income 31,642 124,110 252,772
SMERA COMMENTS
The above projection has been shared by the client. SMERA believes the projected growth seems to be
highly optimistic considering the current scale of operations.
As informed by the management, NEED will be able to scale up its portfolio on account of funding
expected from banks and financial institutions in the coming financial year.
SMERA believes steady access to funds from banks/financial institutions will be a key in near future for
scaling up its portfolio.
20
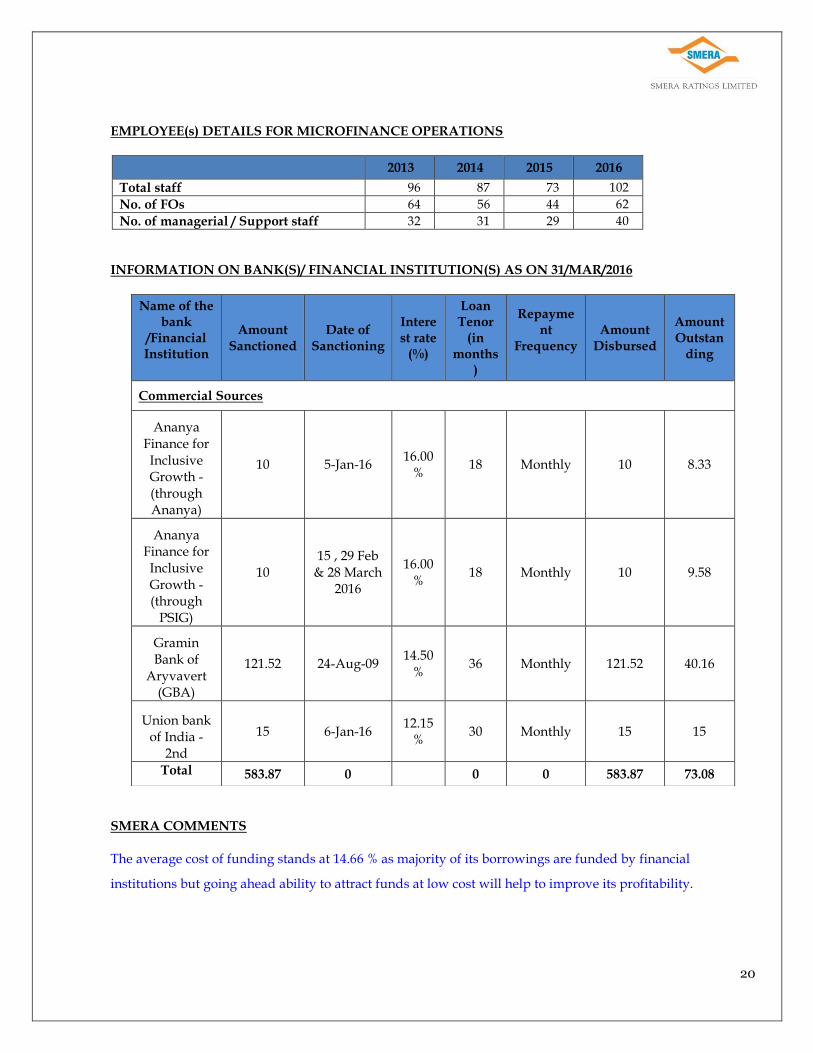
EMPLOYEE(s) DETAILS FOR MICROFINANCE OPERATIONS
2013 2014 2015 2016
Total staff 96 87 73 102
No. of FOs 64 56 44 62
No. of managerial / Support staff 32 31 29 40
INFORMATION ON BANK(S)/ FINANCIAL INSTITUTION(S) AS ON 31/MAR/2016
SMERA COMMENTS
The average cost of funding stands at 14.66 % as majority of its borrowings are funded by financial
institutions but going ahead ability to attract funds at low cost will help to improve its profitability.
Name of the bank
/Financial Institution
Amount Sanctioned
Date of Sanctioning
Interest rate
(%)
Loan Tenor
(in months
)
Repayment
Frequency
Amount Disbursed
Amount Outstan
ding
Commercial Sources
Ananya Finance for Inclusive Growth - (through Ananya)
10 5-Jan-16 16.00
% 18 Monthly 10 8.33
Ananya Finance for Inclusive Growth - (through
PSIG)
10 15 , 29 Feb
& 28 March 2016
16.00%
18 Monthly 10 9.58
Gramin Bank of
Aryvavert (GBA)
121.52 24-Aug-09 14.50
% 36 Monthly 121.52 40.16
Union bank of India -
2nd
15 6-Jan-16 12.15
% 30 Monthly 15 15
Total 583.87 0 0 0 583.87 73.08
21
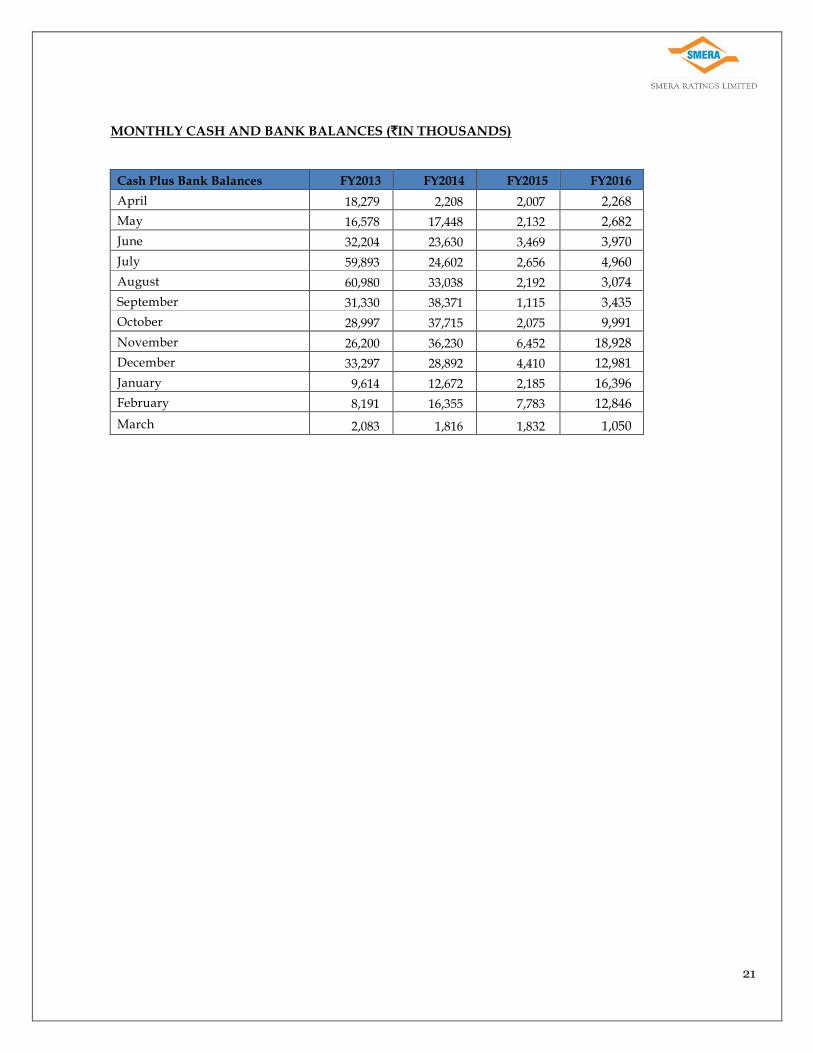
MONTHLY CASH AND BANK BALANCES (`IN THOUSANDS)
Cash Plus Bank Balances FY2013 FY2014 FY2015 FY2016
April 18,279 2,208 2,007 2,268
May 16,578 17,448 2,132 2,682
June 32,204 23,630 3,469 3,970
July 59,893 24,602 2,656 4,960
August 60,980 33,038 2,192 3,074
September 31,330 38,371 1,115 3,435
October 28,997 37,715 2,075 9,991
November 26,200 36,230 6,452 18,928
December 33,297 28,892 4,410 12,981
January 9,614 12,672 2,185 16,396
February 8,191 16,355 7,783 12,846
March 2,083 1,816 1,832 1,050
22
CURRENCY: All amounts in this report are in local currency unless otherwise stated.
----------------------------------------------------------------------------------------- -------------------------------------------
RIGHTS TO THE REPORT ARE WITH SMERA GRADINGS LIMITED (SMERA). THIS REPORT MAY NOT BE REPRODUCED IN WHOLE OR IN
PART IN ANY FORM OR MANNER WHATSOEVER. ------------------------------------------------------------------------------------------------------------------------------------ The SMERA – MFI Grading shall be read with the SMERA – MFI Grading Report on the subject issued by SMERA. All information contained in the SMERA – MFI Grading Report is obtained by SMERA from the subject and third party sources, and is believed to be accurate and reliable. Although reasonable care has been taken to ensure that the information in the Grading Report is true, such information is provided “as is” without any warranty of any kind and SMERA, in particular, makes no representation or warranty, express or implied, as to the accuracy, timeliness or completeness of any such information SMERA is not responsible for any errors in transmission and specifically states that SMERA shall have no financial liability whatsoever to the users of the Grading Report. The Grading does not constitute an audit and SMERA’s work is significantly different from that of an audit and accordingly, cannot be relied upon to provide the same level of assurance as an audit. Please note that the SMERA – MFI Grading Report is not a recommendation to purchase, sell or hold any securities and investors should take their own decision. In providing this Grading, SMERA does not underwrite the risks of any third party or that of the subject. SMERA is not liable to the Company or any third party in respect of any matter specified in the Grading Report. SMERA may revise, suspend or withdraw the Grading at any time in the future as a result of information changes in circumstances or unavailability of information. The SMERA – MFI Grading Report is not intended for distribution/ publication/ reproduction in any form without SMERA’s prior written approval.
-- End of Report --
Recommended