Mukti Ali
“The Influence Factors of local economic change in waterfront public space In Pantai Losari, Makassar”
International Conferences on 15th SENVAR (Sustainable Environmental Architecture) and 2nd AVAN (Asian Vernacular Architecture Network), Department of Architecture, Faculty of Engineering, Hasanuddin University, Makassar, November 14-‐15, 2014
P a g e | 1
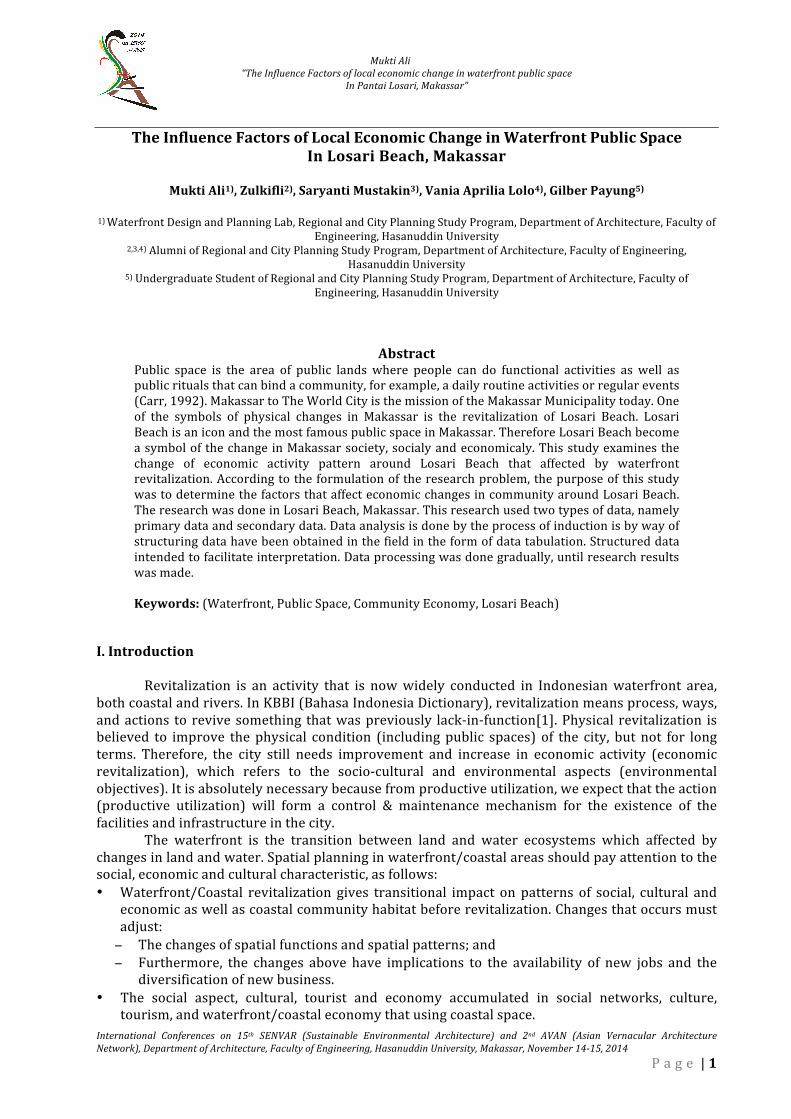
The Influence Factors of Local Economic Change in Waterfront Public Space In Losari Beach, Makassar
Mukti Ali1), Zulkifli2), Saryanti Mustakin3), Vania Aprilia Lolo4), Gilber Payung5)
1) Waterfront Design and Planning Lab, Regional and City Planning Study Program, Department of Architecture, Faculty of
Engineering, Hasanuddin University 2,3,4) Alumni of Regional and City Planning Study Program, Department of Architecture, Faculty of Engineering,
Hasanuddin University 5) Undergraduate Student of Regional and City Planning Study Program, Department of Architecture, Faculty of
Engineering, Hasanuddin University
Abstract
Public space is the area of public lands where people can do functional activities as well as public rituals that can bind a community, for example, a daily routine activities or regular events (Carr, 1992). Makassar to The World City is the mission of the Makassar Municipality today. One of the symbols of physical changes in Makassar is the revitalization of Losari Beach. Losari Beach is an icon and the most famous public space in Makassar. Therefore Losari Beach become a symbol of the change in Makassar society, socialy and economicaly. This study examines the change of economic activity pattern around Losari Beach that affected by waterfront revitalization. According to the formulation of the research problem, the purpose of this study was to determine the factors that affect economic changes in community around Losari Beach. The research was done in Losari Beach, Makassar. This research used two types of data, namely primary data and secondary data. Data analysis is done by the process of induction is by way of structuring data have been obtained in the field in the form of data tabulation. Structured data intended to facilitate interpretation. Data processing was done gradually, until research results was made. Keywords: (Waterfront, Public Space, Community Economy, Losari Beach)
I. Introduction
Revitalization is an activity that is now widely conducted in Indonesian waterfront area, both coastal and rivers. In KBBI (Bahasa Indonesia Dictionary), revitalization means process, ways, and actions to revive something that was previously lack-‐in-‐function[1]. Physical revitalization is believed to improve the physical condition (including public spaces) of the city, but not for long terms. Therefore, the city still needs improvement and increase in economic activity (economic revitalization), which refers to the socio-‐cultural and environmental aspects (environmental objectives). It is absolutely necessary because from productive utilization, we expect that the action (productive utilization) will form a control & maintenance mechanism for the existence of the facilities and infrastructure in the city.
The waterfront is the transition between land and water ecosystems which affected by changes in land and water. Spatial planning in waterfront/coastal areas should pay attention to the social, economic and cultural characteristic, as follows: • Waterfront/Coastal revitalization gives transitional impact on patterns of social, cultural and
economic as well as coastal community habitat before revitalization. Changes that occurs must adjust: − The changes of spatial functions and spatial patterns; and − Furthermore, the changes above have implications to the availability of new jobs and the
diversification of new business. • The social aspect, cultural, tourist and economy accumulated in social networks, culture,
tourism, and waterfront/coastal economy that using coastal space.
Mukti Ali
“The Influence Factors of local economic change in waterfront public space In Pantai Losari, Makassar”
International Conference on the 15th SENVAR (Sustainable Environmental Architecture) and the 2nd AVAN (Asian Vernacular Architecture Network , Department of Architecture, Faculty of Engineering, Hasanuddin University, Makassar, November 14-‐15, 2014 P a g e | 2
Makassar going forward to The World City is the mission of the Makassar Municipality today. One of the symbols of physical changes in Makassar is the revitalization of the Losari Beach. Losari Beach is an icon and the most famous public space in Makassar. Therefore Losari Beach become a symbol of the change in Makassar society, socialy and economicaly. Before 2012 Losari has only one platform (Losari Beach). And this time The Bugis-‐Makassar Platform was built. And now, the construction of Toraja – Mandar Platform currently just finished. Platform constructions are provide much of impact on community activities in Makassar, directly and indirectly. One change that can be seen is the change of economic activity pattern in that area[2]. This study examines the change of economic activity pattern around Losari Beach that affected by waterfront revitalization. According to the formulation of the research problem, the purpose of this study was to determine the factors that affect economic changes in community around Losari Beach.
This study aims to determine the level of influence of the waterfront public space revitalization against the increase of economic revitalization in the area around Losari Beach, seen from the changes in building function that occurred before and after revitalization. II. Literature Review II.1. Public Space
Public space on the Dictionary of Architecture and Construction (Cyril M. Harris, 1975): Public Area: any area which is free and open to the general public at all times, Public Space: 1. an area within abuilding to which there is free access by the public, such as a foyer or lobby, 2. in some codes, an area or piece of land legally designed for public use[3].
Public space on Wikipedia (http:en.wikipedia) explain that ‘public’ as adjective, is: having to do with the affairs or official of all people, as opposed to just a private group and public as a noun: the people and general, regardless of membership of any particular group[4].
After that, the meaning of ‘space’ is a set of points, each of which is uniquely specified by a set of coordinates. The number of coordinates specifying a point and the numbers of mutually perpendicular axes along which the coordinates lie are the same, and that is number of dimensions of the space. ‘We live in space that has at least four dimensions: up-‐down, left-‐right, forward-‐backward, and future-‐past’. As an addition, the meaning of ‘space’ based on Spatial Planning Dictionary, is a container that includes land space, sea space and air space as a unified region, where humans and other creatures live and do activities and maintain survival (UPR92): a three-‐dimensional cavity. And the meaning of place is: a location or position
In general, the definition of Public Space is the space used for all people without any limits and without any costs. Public Place is: location used for all people without any limits and costs. From the definition of the fundamental differences described between space and place is space scale, where space refers to the space that is wider or macro, while the place refers to space that are micro or footprint scale[5].
A good public space is a space that is growing and productive, popular and enjoyed by the public, as well as the means to him (Carr, 1992)[6]. So, we need a public space design that is able to incorporate the value of the human and natural environment. II.2. Revitalization
Revitalization including the conservation-‐preservation is part of the urban design efforts to maintain the physical heritage of ancient culture that has historical value and architectural aesthetic. Or rather an effort to preserve the built environment in order to remain in the original condition of the existing and prevent damage. Depending on the condition of the built environment to be preserved, then the effort is usually accompanied by the restoration, rehabilitation and/or reconstruction. So, revitalization is an attempt to vitalize a region or a part of town that was vital before, but then suffered a setback/degradation. In addition, the revitalization is the activity of modifying an environmental or cultural heritage objects for new application. Physical revitalization is believed to improve the physical condition (including public spaces) the city, but not for long.

Mukti Ali
“The Influence Factors of local economic change in waterfront public space In Pantai Losari, Makassar”
International Conferences on 15th SENVAR (Sustainable Environmental Architecture) and 2nd AVAN (Asian Vernacular Architecture Network), Department of Architecture, Faculty of Engineering, Hasanuddin University, Makassar, November 14-‐15, 2014
P a g e | 3
Therefore, the city still needs improvement and increase in economic activity (economic revitalization), which refers to the socio-‐cultural and environmental aspects (environmental objectives). It is absolutely necessary because from productive utilization, we expect that the action (productive utilization) will form a control & maintenance mechanism for the existence of the facilities and infrastructure in the city.
With the support of the control mechanism / revitalization plan control should be able to raise strategic issues of the region, both in the form of events / activities of the socioeconomic and physical character of the city. Urban design is a control dan pointing device to create a built environment that is accommodate the needs and demands of the new functionality.
II.3. Waterfront Area
Waterfront area is an urban area of which the land and water meet, and includes activities or buildings that are physically, socially, economically and culturally influenced by the characteristics of marine water body.
To ensure the realization of public conveniences in the area of the waterfront, the area of spatial planning should: − Figurative layout of the building and building height, hierarchical lines to keep the public convenience in enjoying panoramic coastal space;
− Existence of public space that can be accessed, used and enjoyed by the public easily and freely without any limitation of space, time and cost;
− Potential beach elements represented through the creative process, design, and take advantage from natural features such as sea/coastal/water in order to create ease and convenience of the public;
− Natural/Coastal potential to be developed as well conserved, such as sand, forests, flora and fauna of water, mangroves, cliffs / beach, contour, shade, sky, and scenic / panoramic;
− Embodiment of comfort on the beach in the form of elements, among others: − the silence; − scenic/panoramic beach; − nature of the village; − clarity of the water ripples and waves; − green hills and valleys; − coastal forest; − cleanliness of the sand; − blue sky; − shade around the beach.
II.4. State of the Art
The theme of this research discusses how far the influence of the revitalization of public space on the waterfront area change the pattern of economic activity in the study site in Losari Beach Makassar. Furthermore, for the second year of the research will be continue to the preparation of standards and manual planning or design of public spaces on the waterfront that is convenient to all activities carried out by the society. III. Research Method
Based on existing purpose of research, this research is a descriptive research, quantitative and qualitative. Quantitative data, qualitative, or visual images obtained through direct observation (primary data) and in printed form or other literature (secondary data). III.1. Data Collection Method
Data collection and processing is performed as follows:
Mukti Ali
“The Influence Factors of local economic change in waterfront public space In Pantai Losari, Makassar”
International Conference on the 15th SENVAR (Sustainable Environmental Architecture) and the 2nd AVAN (Asian Vernacular Architecture Network , Department of Architecture, Faculty of Engineering, Hasanuddin University, Makassar, November 14-‐15, 2014 P a g e | 4
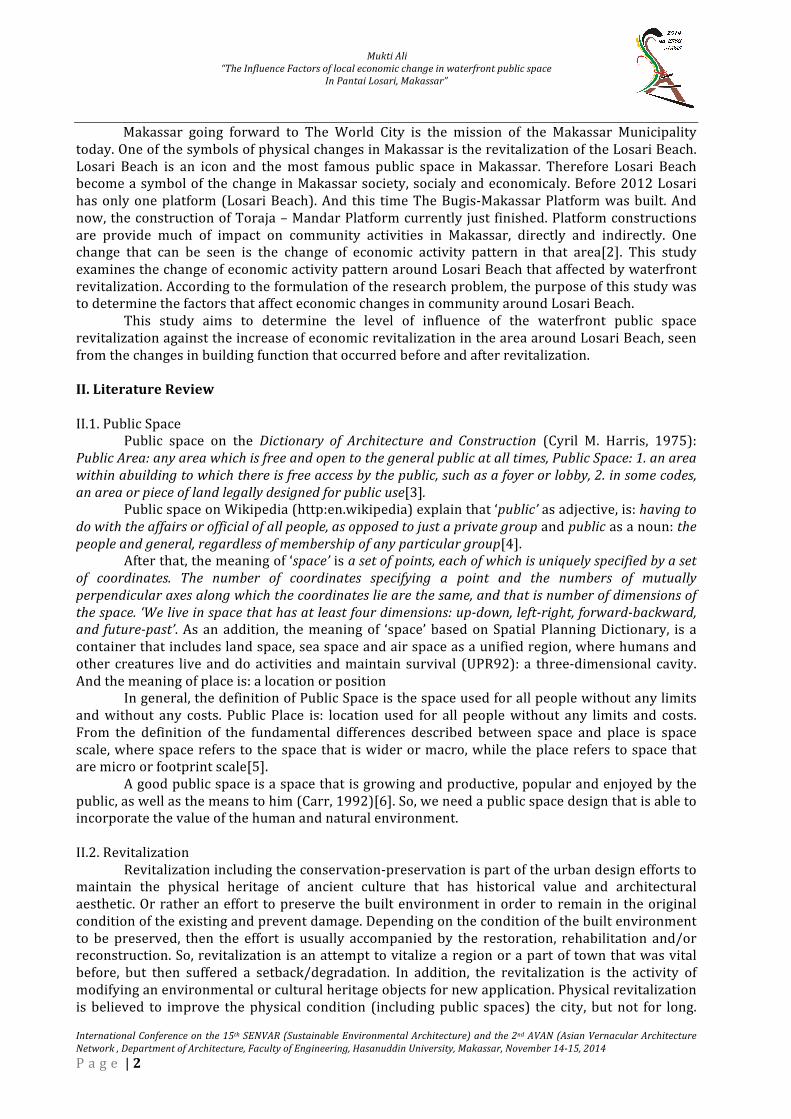
1. The field survey. The field survey was implemented in order to collect the primary data, by using a questionnaire interview to see people's opinions about the factors that affect community economy in waterfront public space in Losari Beach. 2. Inventory of survey data using questionnaires, and were processed using Microsoft Excel and SPSS 17.0. Losari Beach one area that serves as a public space in the city of Makassar[5]. In this area there are three pavillion as public space. Losari Beach also be a landmark of Makassar. The location is easily accessible from all directions because it is located in the center of the old city of Makassar. The study area includes the Losari sub-‐district, Bulogading sub-‐district and Kunjungmae sub-‐district in Ujung Pandang District of Makassar where delineation region bounded by the road: North : Bau Masepe St. South : Durian St. West : Makassar Strait East : Lamaddukelleng St. Losari Beach consists of open green space and at this time, several platforms was built. The green area in Losari Beach is 0,04 ha and 0.9 ha is non green.
Figure 1. Map of Research Area Source: Google Earth Image and Processed by Authors, 2014
Mukti Ali
“The Influence Factors of local economic change in waterfront public space In Pantai Losari, Makassar”
International Conferences on 15th SENVAR (Sustainable Environmental Architecture) and 2nd AVAN (Asian Vernacular Architecture Network), Department of Architecture, Faculty of Engineering, Hasanuddin University, Makassar, November 14-‐15, 2014
P a g e | 5
IV. Analysis and Discussion IV.1. Respondents Characteristic Analysis
Characteristics of the respondents in this research, reviewed from the social aspect in the researched area. Data related to the characteristics of the respondents obtained through the results of the questionnaire. In this study, 206 data from 206 respondents were collected through questionnaires. The respondents are people who live around the area of research, the owner or worker of business types such as Clothing Stores, Gold Shops, Souvenir Shops or giftshops, Restaurants, Mini Markets, and Hotels. IV.1.1. Age
Below is a table and chart the number of respondents by age in the area of Losari Beach.
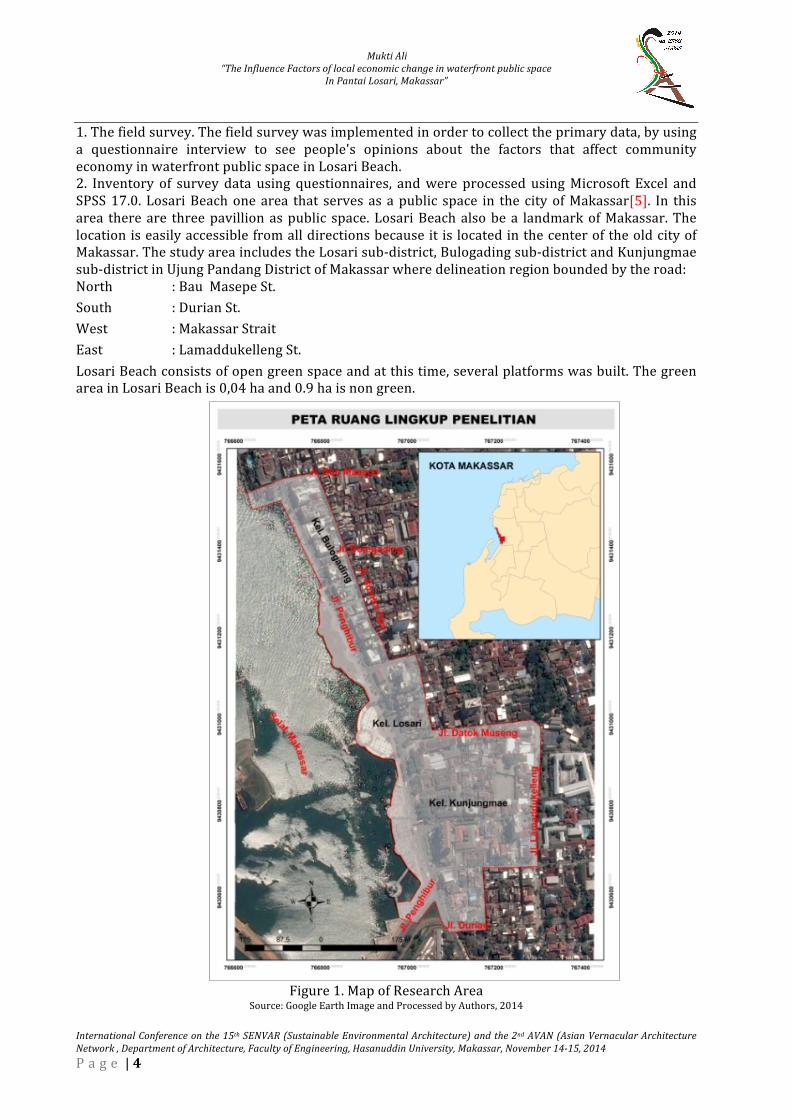
Table 1. Number of Respondents by age Age (Years) Counts Percentage (%)
<17 1 0,5
17 – 50 180 87,4
>50 25 12,1
Sum 206 100
Source: Analysis Research, 2014
Figure 2. Percentage of Respondents by Age
Based on the diagram above, it can be concluded that the characteristics of the respondents by age in the area of Losari Beach dominated by respondents aged 17-‐50 years. The number of respondents in this category are 180 people or 87.4%. IV.1.2. Sex
Below is a table and chart the number of respondents by sex in the area of Losari Beach.
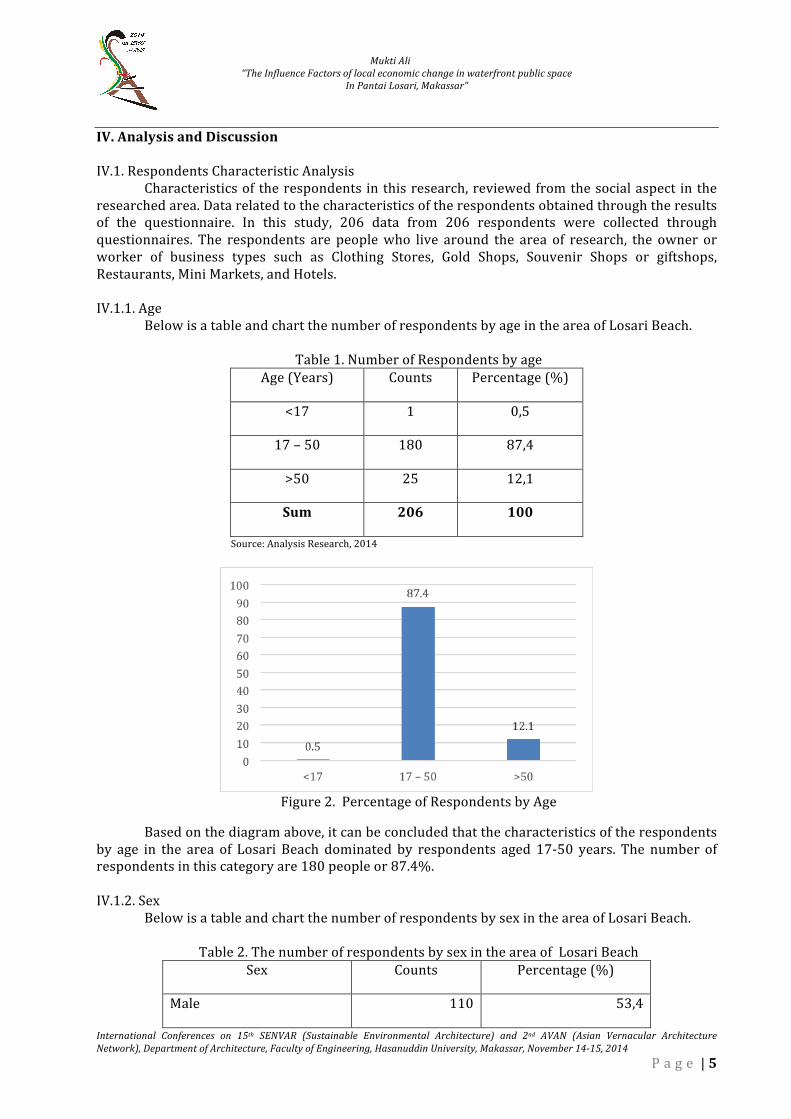
Table 2. The number of respondents by sex in the area of Losari Beach Sex Counts Percentage (%)
Male 110 53,4
Mukti Ali
“The Influence Factors of local economic change in waterfront public space In Pantai Losari, Makassar”
International Conference on the 15th SENVAR (Sustainable Environmental Architecture) and the 2nd AVAN (Asian Vernacular Architecture Network , Department of Architecture, Faculty of Engineering, Hasanuddin University, Makassar, November 14-‐15, 2014 P a g e | 6
Female 96 46,6
Sum 206 100
Source: Analysis Research, 2014
Figure 3. Percentage of Respondents by Sex
According to the table and diagram above, it can be concluded that the number of respondents with male gender more than the number of female respondents. The number of respondents with male gender are as many as 110 people or 53.4%.
IV.1.3. Education
Below is a table and chart showing the number of respondents by education levels.
Table 3. Number of Respondents by education levels
Source: Analysis Result, 2014
Education Levels Counts Percentage(%)
Elementary 43 20,87
Middle School 43 20,87
High School 53 25,7
Diploma/Bachelor 67 32,5
Sum 206 100
Mukti Ali
“The Influence Factors of local economic change in waterfront public space In Pantai Losari, Makassar”
International Conferences on 15th SENVAR (Sustainable Environmental Architecture) and 2nd AVAN (Asian Vernacular Architecture Network), Department of Architecture, Faculty of Engineering, Hasanuddin University, Makassar, November 14-‐15, 2014
P a g e | 7
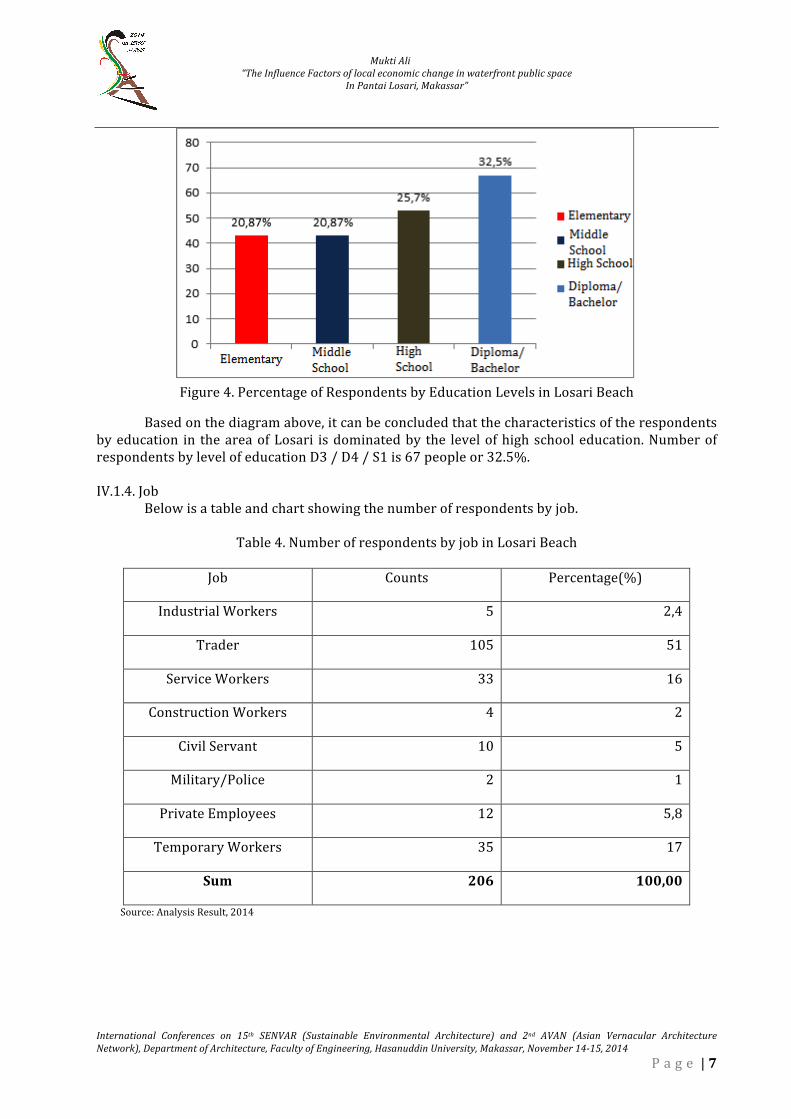
Figure 4. Percentage of Respondents by Education Levels in Losari Beach
Based on the diagram above, it can be concluded that the characteristics of the respondents by education in the area of Losari is dominated by the level of high school education. Number of respondents by level of education D3 / D4 / S1 is 67 people or 32.5%. IV.1.4. Job
Below is a table and chart showing the number of respondents by job.
Table 4. Number of respondents by job in Losari Beach
Job Counts Percentage(%)
Industrial Workers 5 2,4
Trader 105 51
Service Workers 33 16
Construction Workers 4 2
Civil Servant 10 5
Military/Police 2 1
Private Employees 12 5,8
Temporary Workers 35 17
Sum 206 100,00
Source: Analysis Result, 2014
Mukti Ali
“The Influence Factors of local economic change in waterfront public space In Pantai Losari, Makassar”
International Conference on the 15th SENVAR (Sustainable Environmental Architecture) and the 2nd AVAN (Asian Vernacular Architecture Network , Department of Architecture, Faculty of Engineering, Hasanuddin University, Makassar, November 14-‐15, 2014 P a g e | 8
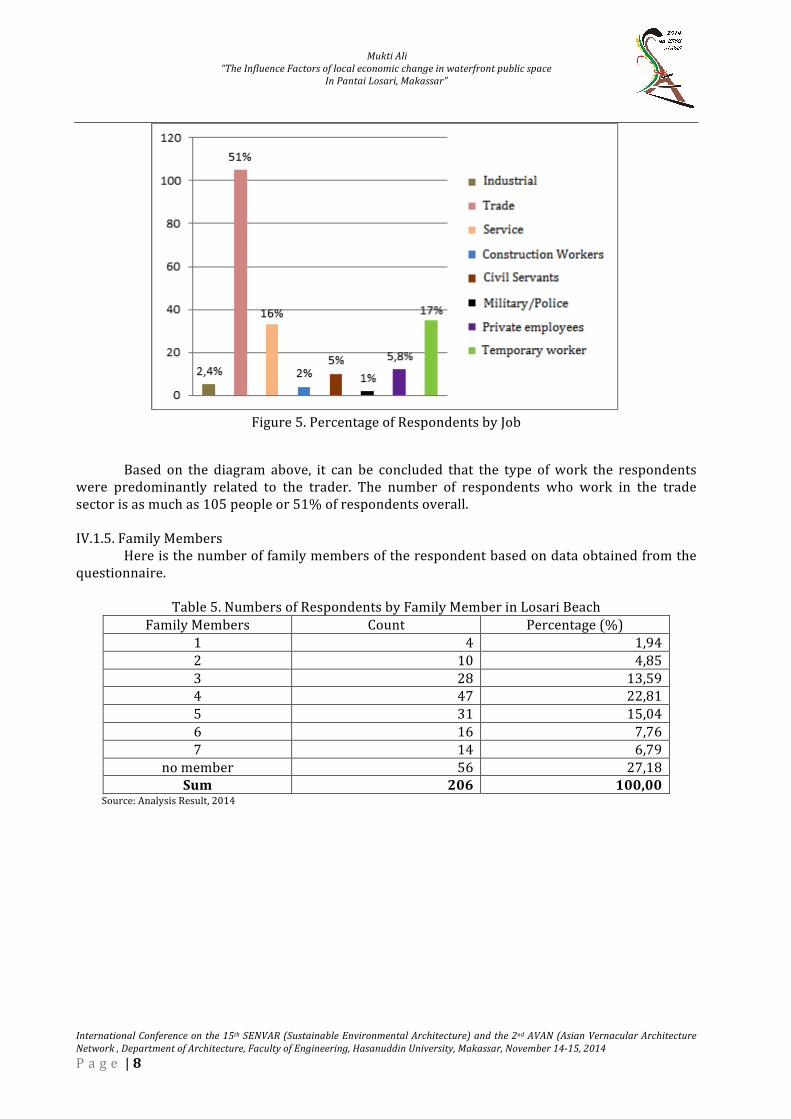
Figure 5. Percentage of Respondents by Job
Based on the diagram above, it can be concluded that the type of work the respondents were predominantly related to the trader. The number of respondents who work in the trade sector is as much as 105 people or 51% of respondents overall. IV.1.5. Family Members
Here is the number of family members of the respondent based on data obtained from the questionnaire.
Table 5. Numbers of Respondents by Family Member in Losari Beach
Family Members Count Percentage (%) 1 4 1,94 2 10 4,85 3 28 13,59 4 47 22,81 5 31 15,04 6 16 7,76 7 14 6,79
no member 56 27,18 Sum 206 100,00
Source: Analysis Result, 2014

Mukti Ali
“The Influence Factors of local economic change in waterfront public space In Pantai Losari, Makassar”
International Conferences on 15th SENVAR (Sustainable Environmental Architecture) and 2nd AVAN (Asian Vernacular Architecture Network), Department of Architecture, Faculty of Engineering, Hasanuddin University, Makassar, November 14-‐15, 2014
P a g e | 9
Figure 6. Percentage of Respondents by Family Members in Losari Beach
Based on the diagram above it can be concluded that the dominant respondents had family
size of 4 (four) people. This is shown by the data above that there are 47 people or 31.3% of the 150 respondents who had four (4) members of the family. Of the 206 respondents there were 56 respondents who do not have family members. That is because such type of employee respondents Clothing Stores, Restaurants, Hotels and Travel in the researched area. IV.1.6. Length of Stay
Here are the characteristics of respondents by long residency in the surrounding area of research.
Table 6. Number of Respondents by Lenght of Stay Lenght of stay (years) Counts Percentage (%)
< 1 3 1,45
1 – 10 105 51
10 -‐ 20 21 10,19
20 -‐ 30 36 9,7
>30 17 8,25
Not settled for long 24 11,65
Sum 206 100,00
Source: Analysis Result, 2014
Mukti Ali
“The Influence Factors of local economic change in waterfront public space In Pantai Losari, Makassar”
International Conference on the 15th SENVAR (Sustainable Environmental Architecture) and the 2nd AVAN (Asian Vernacular Architecture Network , Department of Architecture, Faculty of Engineering, Hasanuddin University, Makassar, November 14-‐15, 2014 P a g e | 10
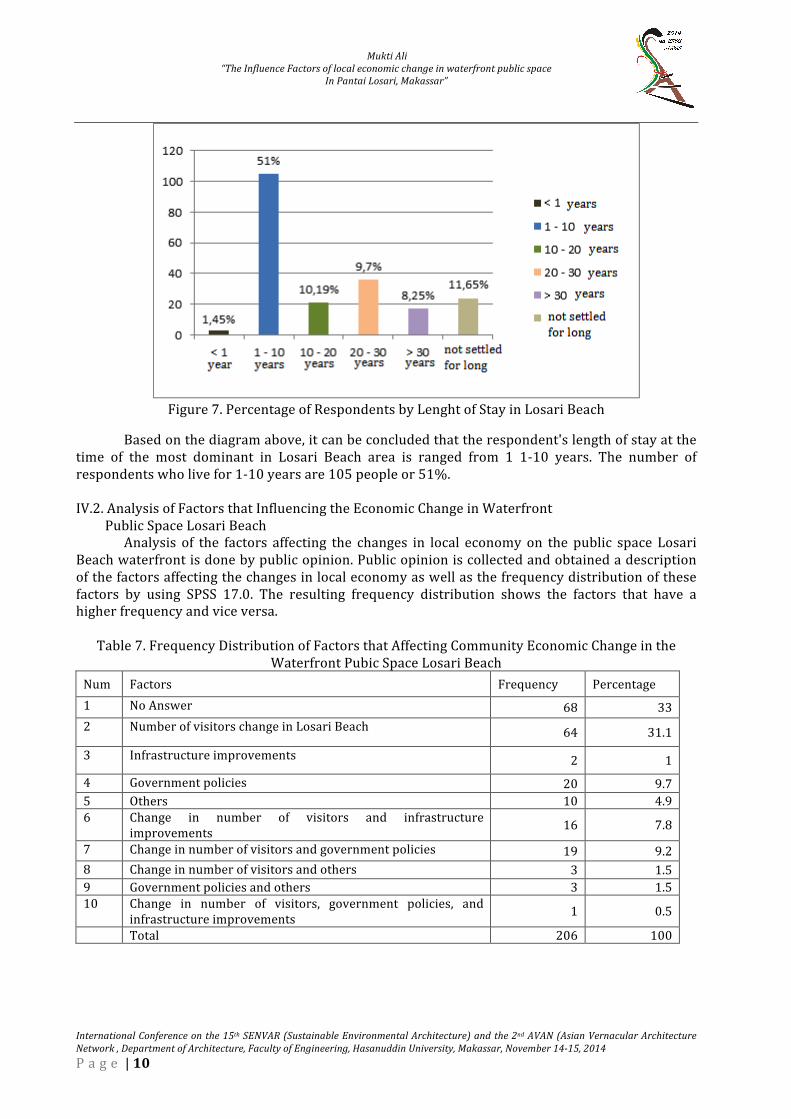
Figure 7. Percentage of Respondents by Lenght of Stay in Losari Beach
Based on the diagram above, it can be concluded that the respondent's length of stay at the time of the most dominant in Losari Beach area is ranged from 1 1-‐10 years. The number of respondents who live for 1-‐10 years are 105 people or 51%. IV.2. Analysis of Factors that Influencing the Economic Change in Waterfront Public Space Losari Beach
Analysis of the factors affecting the changes in local economy on the public space Losari Beach waterfront is done by public opinion. Public opinion is collected and obtained a description of the factors affecting the changes in local economy as well as the frequency distribution of these factors by using SPSS 17.0. The resulting frequency distribution shows the factors that have a higher frequency and vice versa.
Table 7. Frequency Distribution of Factors that Affecting Community Economic Change in the Waterfront Pubic Space Losari Beach
Num Factors Frequency Percentage 1 No Answer 68 33 2 Number of visitors change in Losari Beach 64 31.1
3 Infrastructure improvements 2 1
4 Government policies 20 9.7 5 Others 10 4.9 6 Change in number of visitors and infrastructure
improvements 16 7.8
7 Change in number of visitors and government policies 19 9.2 8 Change in number of visitors and others 3 1.5 9 Government policies and others 3 1.5 10 Change in number of visitors, government policies, and
infrastructure improvements 1 0.5
Total 206 100
Mukti Ali
“The Influence Factors of local economic change in waterfront public space In Pantai Losari, Makassar”
International Conferences on 15th SENVAR (Sustainable Environmental Architecture) and 2nd AVAN (Asian Vernacular Architecture Network), Department of Architecture, Faculty of Engineering, Hasanuddin University, Makassar, November 14-‐15, 2014
P a g e | 11
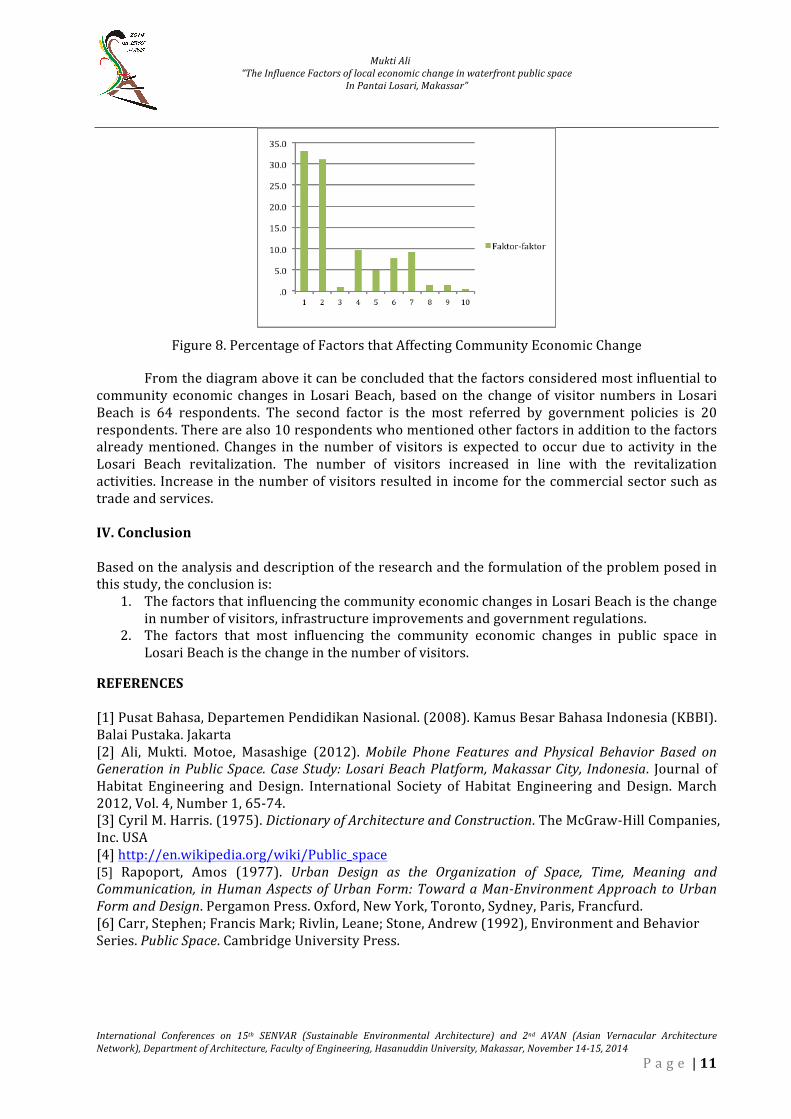
Figure 8. Percentage of Factors that Affecting Community Economic Change
From the diagram above it can be concluded that the factors considered most influential to community economic changes in Losari Beach, based on the change of visitor numbers in Losari Beach is 64 respondents. The second factor is the most referred by government policies is 20 respondents. There are also 10 respondents who mentioned other factors in addition to the factors already mentioned. Changes in the number of visitors is expected to occur due to activity in the Losari Beach revitalization. The number of visitors increased in line with the revitalization activities. Increase in the number of visitors resulted in income for the commercial sector such as trade and services. IV. Conclusion Based on the analysis and description of the research and the formulation of the problem posed in this study, the conclusion is:
1. The factors that influencing the community economic changes in Losari Beach is the change in number of visitors, infrastructure improvements and government regulations.
2. The factors that most influencing the community economic changes in public space in Losari Beach is the change in the number of visitors.
REFERENCES [1] Pusat Bahasa, Departemen Pendidikan Nasional. (2008). Kamus Besar Bahasa Indonesia (KBBI). Balai Pustaka. Jakarta [2] Ali, Mukti. Motoe, Masashige (2012). Mobile Phone Features and Physical Behavior Based on Generation in Public Space. Case Study: Losari Beach Platform, Makassar City, Indonesia. Journal of Habitat Engineering and Design. International Society of Habitat Engineering and Design. March 2012, Vol. 4, Number 1, 65-‐74. [3] Cyril M. Harris. (1975). Dictionary of Architecture and Construction. The McGraw-‐Hill Companies, Inc. USA [4] http://en.wikipedia.org/wiki/Public_space [5] Rapoport, Amos (1977). Urban Design as the Organization of Space, Time, Meaning and Communication, in Human Aspects of Urban Form: Toward a Man-‐Environment Approach to Urban Form and Design. Pergamon Press. Oxford, New York, Toronto, Sydney, Paris, Francfurd. [6] Carr, Stephen; Francis Mark; Rivlin, Leane; Stone, Andrew (1992), Environment and Behavior Series. Public Space. Cambridge University Press.
Recommended


![THERMAL COMFORT ANALYSIS OF HOME LIVING IN …senvar.event.upi.edu/file/ppt/[SENVAR20]_Qurrotul_Ayun_ABS-SENVAR-201461.pdfBased on SNI 03-6572-2001, TEMPERATURE CAN BE SAID TO BE COMFORTABLE](https://img.pdfslide.us/doc/110x75/6098f88e94e4d23a39234dba/thermal-comfort-analysis-of-home-living-in-senvar20qurrotulayunabs-senvar-201461pdf.jpg)