The Wider Surgical Team
Ian Eardley
Consultant Urologist
Leeds Teaching Hospital Trust

The Surgical Team
The Wider Surgical Team
• Loss of the “Surgical Firm”
• The RCS Extended Team Project
• Data from a Trainee Survey
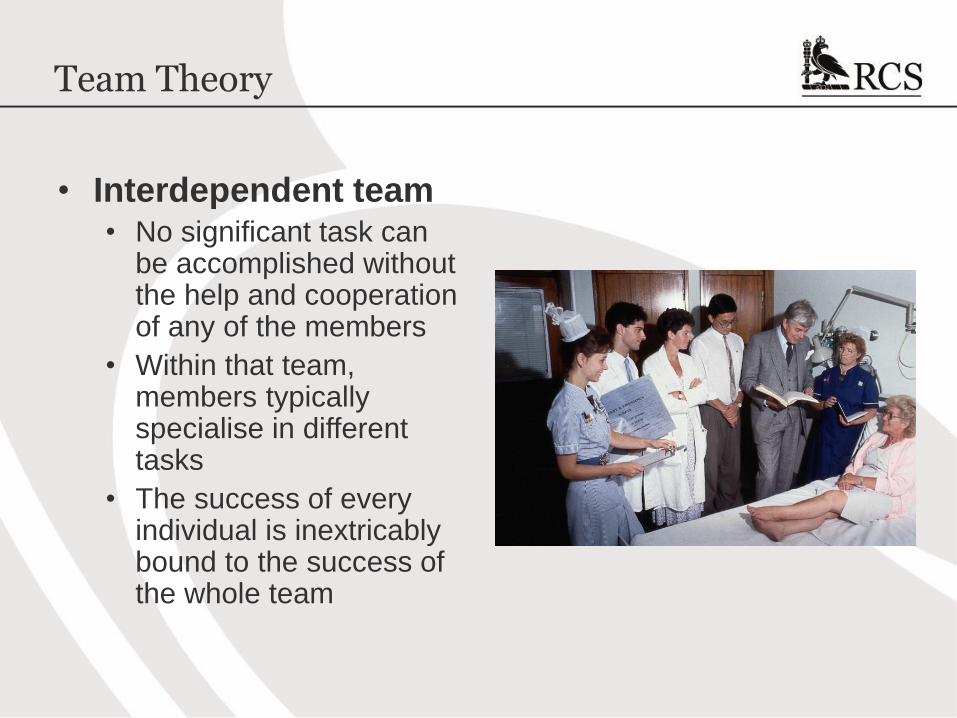
Team Theory
• Interdependent team • No significant task can
be accomplished without the help and cooperation of any of the members
• Within that team, members typically specialise in different tasks
• The success of every individual is inextricably bound to the success of the whole team

The Traditional Surgical Team
The traditional
surgical team
Continuity
Safety
Mentoring
Apprentice
Reassurance
Satisfaction

The Problems
Problems
Reduced numbers of Core trainees
Loss of surgical
FY1 posts
Money EWTR
Simap and
Jaeger

My “On Call” week
Friday Saturday Sunday Monday Tuesday Wednesday
Thursday
Consultant IE IE IE IE IE IE IE
SPR SPR1 SPR2 SPR2 SPR3 SPR3 SPR3 SPR3
CT CT1 - - CT2 - CT3 -
FY FY1 FY2 (Psych)
FY2 (Psych)
FY3 FY3 FY3 FY4
Overnight SPR
(at home)
Different SPR on every night
Overnight CT2
(on site)
Different Core trainee on every night Paper handover of overnight admissions
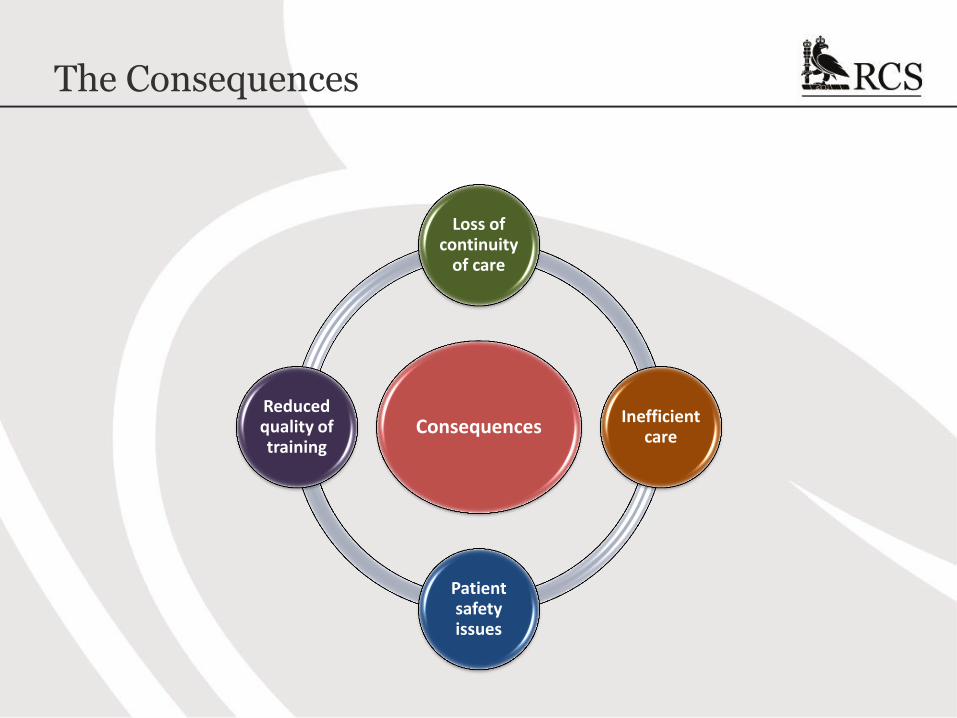
The Consequences
Consequences
Loss of continuity
of care
Inefficient care
Patient safety issues
Reduced quality of training

An Alternative Workforce
• Advanced practitioners
• Surgical care practitioners
• Physician associates
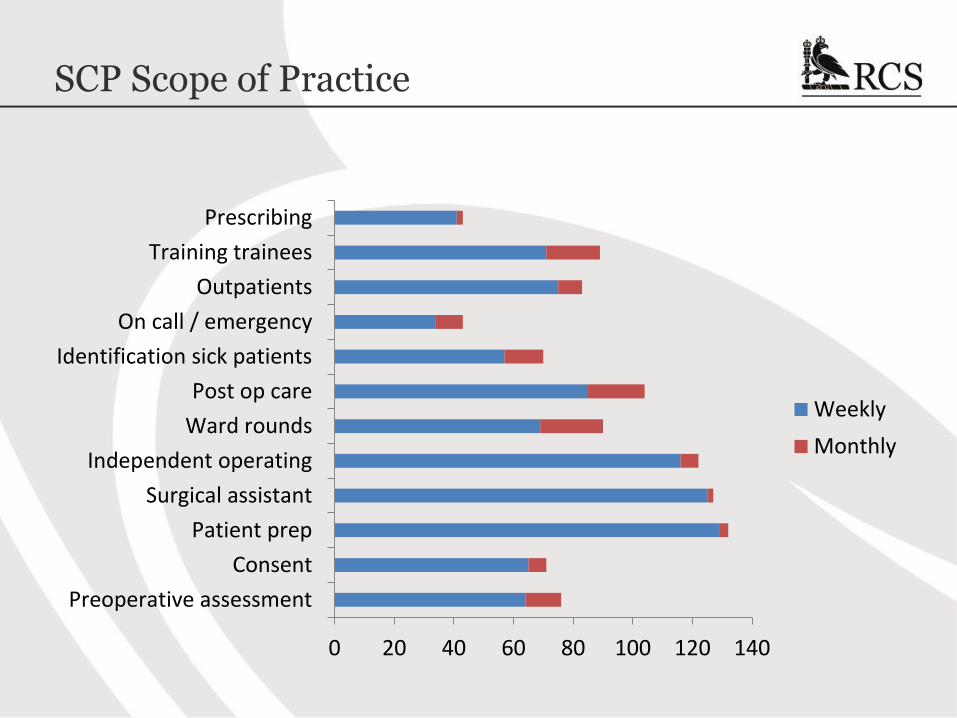
SCP Scope of Practice
0 20 40 60 80 100 120 140
Preoperative assessment
Consent
Patient prep
Surgical assistant
Independent operating
Ward rounds
Post op care
Identification sick patients
On call / emergency
Outpatients
Training trainees
Prescribing
Weekly
Monthly

SCP Scope of Practice
0 20 40 60 80 100 120 140
Preoperative assessment
Consent
Patient prep
Surgical assistant
Independent operating
Ward rounds
Post op care
Identification sick patients
On call / emergency
Outpatients
Training trainees
Prescribing
Weekly
Monthly

SCP Scope of Practice
0 20 40 60 80 100 120 140
Preoperative assessment
Consent
Patient prep
Surgical assistant
Independent operating
Ward rounds
Post op care
Identification sick patients
On call / emergency
Outpatients
Training trainees
Prescribing
Weekly
Monthly

SCP Scope of Practice
0 20 40 60 80 100 120 140
Preoperative assessment
Consent
Patient prep
Surgical assistant
Independent operating
Ward rounds
Post op care
Identification sick patients
On call / emergency
Outpatients
Training trainees
Prescribing
Weekly
Monthly

RCS Extended Team Project (HEE Funded)
Trainee Survey
• FY1 FY2 Core trainees
• Workload
• Work Type
Task Analysis
• Diary Exercise
• FY1 FY2 Core trainees
Case Studies
• Visit of selected units
• Examples of good practice
July 2015 Oct / Nov 2015 Nov / Dec 2015
Write up and Report by Feb 2016
To explore the potential role of an alternative workforce to support Junior Doctors
Trainee Survey: Methodology
• Online survey targeted at foundation doctors and surgical trainees
(up to ST3)
• The link to the survey was publicised to CST1-2 and ST3 surgical
trainees through the websites and social media platforms of the
RCS, Association of Surgeons in Training, and British Orthopaedic
Trainees Association
• All foundation and surgical trainees (CST1-2, ST3) in three LETBs
were sent the survey directly by email from their postgraduate dean
• The survey was in the field for four weeks during July 2015

Results
406
355
73
74
82
F1
F2
CST1
CST2
ST3+
Base: 990 doctors in training
Foundation doctors
There were 15,395 foundation doctors in the UK in 2013 (GMC, 2014)
77% of our sample were foundation doctors
This survey was completed by 5% of all doctors in foundation training
Chart 14: Current stage of training
Surgeons in training
There were 4,371 surgeons in training in England in 2014 (RCS, 2015)
15% of respondents to complete this survey were core surgical trainees; 8% were higher surgical trainees (ST3 or above)
This survey was completed by 5% of surgeons in training in England

Service versus Training
74%
59%
49%
% time on 'service requirements'
Foundation trainees
Core trainees
Surgical trainees
Chart 12: % of time in average week spent delivering service requirements Base: 990 doctors in training
Foundation doctors are more likely than surgical trainees to report that a higher proportion of their time is spent delivering service requirements – rather than training in surgery
Higher surgical trainees report that less than half their time (49%) is spent delivering service requirements
Core trainees report that 59% of their time is spent on service delivery
Task Analysis
13
15
7
86
104
106
83
16
70
9
2
26
13
11
19
13
10
4
60
53
62
103
16
30
33
34
67
16
54
19
Receiving bedside teaching
Attending formal/didactic teaching
Attending simulation teaching/training
Undertaking ward rounds
Completing discharge paperwork and admin
Other administrative tasks
Clerking and admitting new patients
In meetings (e.g. MDT, M&M)
Performing simple procedures on foundation curriculum
Performing core surgical skills and procedures
In theatre as primary surgeon
In theatre as an assistant
In theatre observing surgery
In outpatient clinics
Undertaking audit, research or CPD
Foundation trainees
Surgical trainees
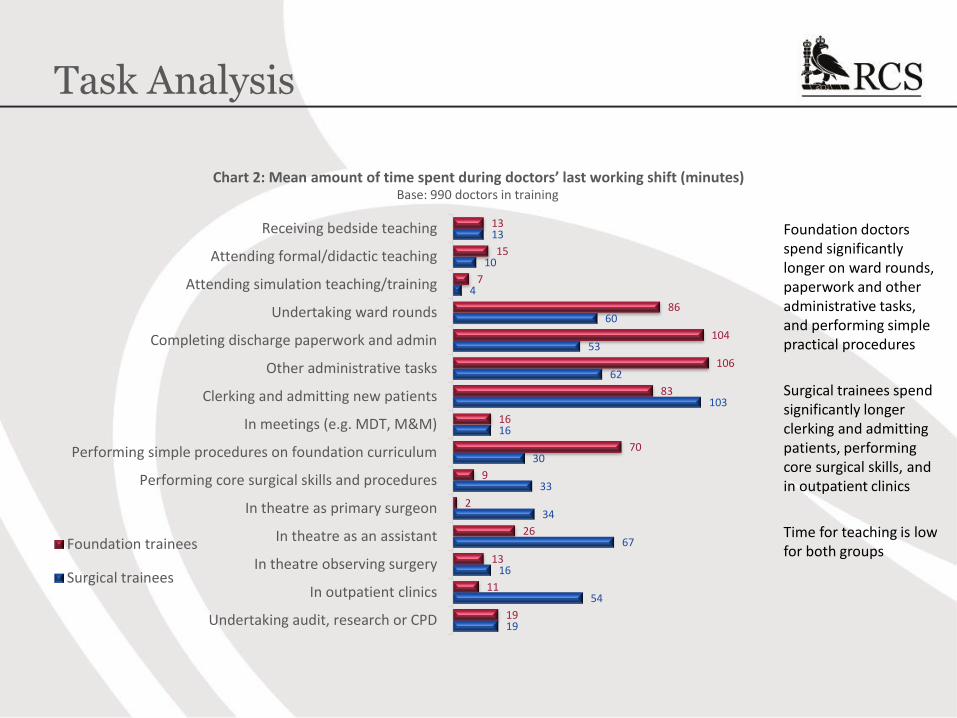
Chart 2: Mean amount of time spent during doctors’ last working shift (minutes) Base: 990 doctors in training
Foundation doctors spend significantly longer on ward rounds, paperwork and other administrative tasks, and performing simple practical procedures
Surgical trainees spend significantly longer clerking and admitting patients, performing core surgical skills, and in outpatient clinics
Time for teaching is low for both groups

Educational Value
4.6
3.7
4.6
2.2
3.7 3.6
4.2 3.9
4.2 4.1 3.8
4.6
2.0
3.9 3.9
4.9 4.5
4.1
Foundationtrainees
Surgical trainees
Chart 9: Mean educational value score (1-5) for each task Base: 990 doctors in training
Foundation doctors place highest educational value on receiving teaching, and clerking new patients
Surgical trainees place highest educational value on theatre time, receiving teaching and outpatient clinic work
Exposure to Common Surgical Conditions
84%
34%
20%
13%
79%
31%
79%
40%
95%
66%
68%
46%
87%
67%
93%
80%
90%
77%
82%
72%
84%
76%
87%
81%
Acute appendicitis
Acute limb ischaemia
Abdominal trauma
Ruptured aortic aneurysm
Acute urinary retention
Testicular torsion
Acute bowel obstruction
Fractured neck of femur
Foundationtrainees
CST1-2
ST3+
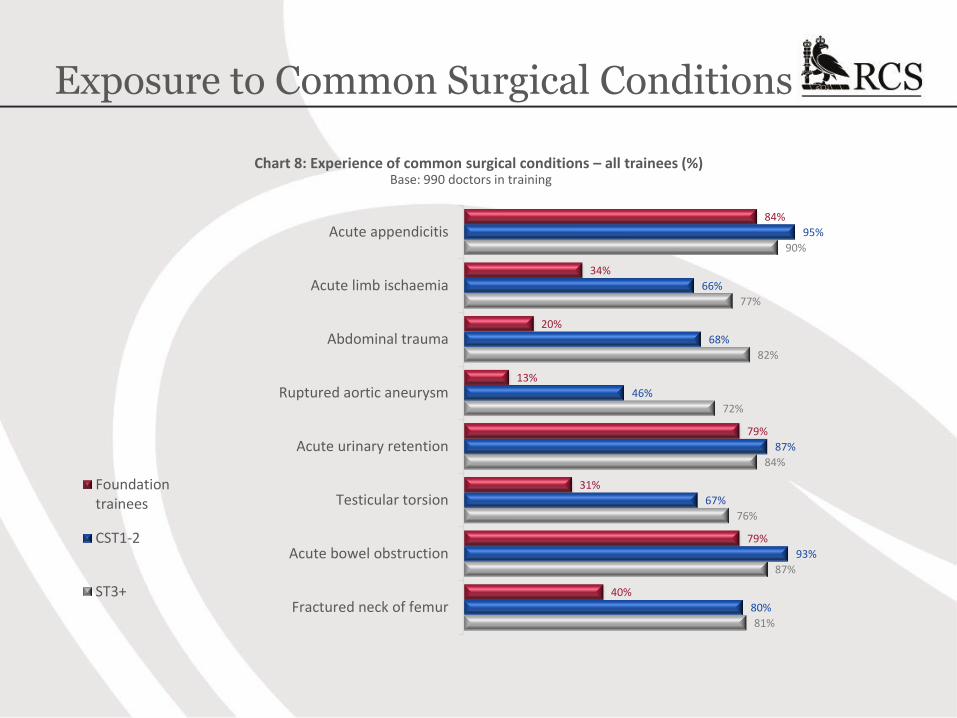
Chart 8: Experience of common surgical conditions – all trainees (%) Base: 990 doctors in training

Contracted Work Hours
45.3
47.4 47.7
48.4
50.8 51.1
Foundation traineesCore traineesHigher trainees
Average rota hours(weekly)
Average hoursworked (weekly)
Chart 11: Average week working hours in trainees’ surgical post
Base: 990 doctors in training
Overall, the 990 respondents were required to work an average of 45.8 hours and actually worked 49 hours on average, per week
Foundation doctors are required to work fewer hours than core and higher surgical trainees – and the hours they actually work are fewer than for surgical trainees
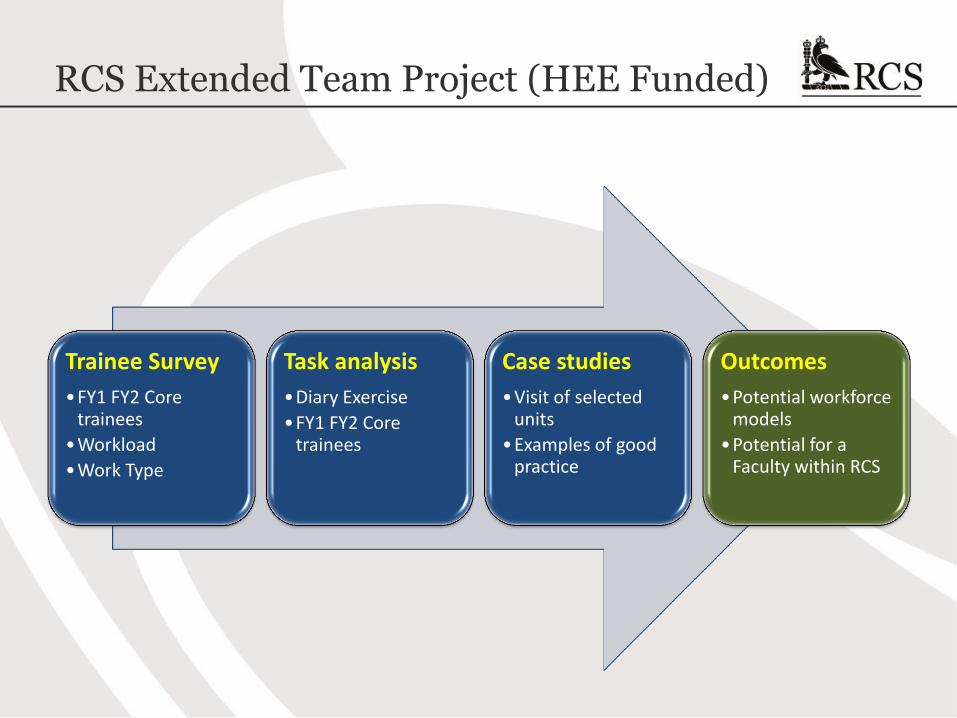
RCS Extended Team Project (HEE Funded)
Trainee Survey
•FY1 FY2 Core trainees
•Workload
•Work Type
Task analysis
•Diary Exercise
•FY1 FY2 Core trainees
Case studies
•Visit of selected units
•Examples of good practice
Outcomes
•Potential workforce models
•Potential for a Faculty within RCS
Recommended