The Swiss advertising market
Media and advertising: key facts and figures
Contents
Introduction Market description Overview of urban agglomerations and conurbations The economy The advertising market Further information/links
The Swiss advertising market, DMA175704
Page 2
Introduction
This presentation is aimed at providing an insight into Switzerland's population, economy, and media and advertising industries.We will be highlighting the particular characteristics of the country as well as key general information.To complete the picture, comparisons with neighboring countries are also included.Finally, links to detailed data sources are provided to allow for more in-depth study of the subjects covered.
The Swiss advertising market, DMA175704
Page 3
International comparison: population and age distribution
The Swiss advertising market, DMA175704
Page 4
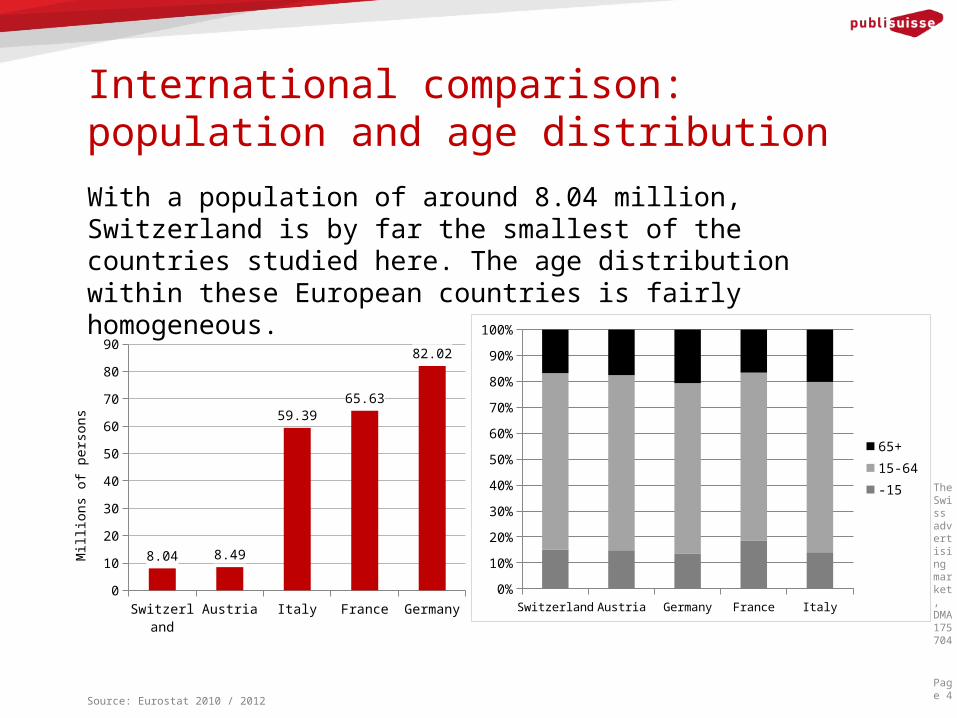
With a population of around 8.04 million, Switzerland is by far the smallest of the countries studied here. The age distribution within these European countries is fairly homogeneous.
Source: Eurostat 2010 / 2012
Switzerland Austria Italy France Germany0
10
20
30
40
50
60
70
80
90
8.04 8.49
59.3965.63
82.02
Mill
ions
of p
erso
ns
Switzerland Austria Germany France Italy0%
10%
20%
30%
40%
50%
60%
70%
80%
90%
100%
65+15-64-15
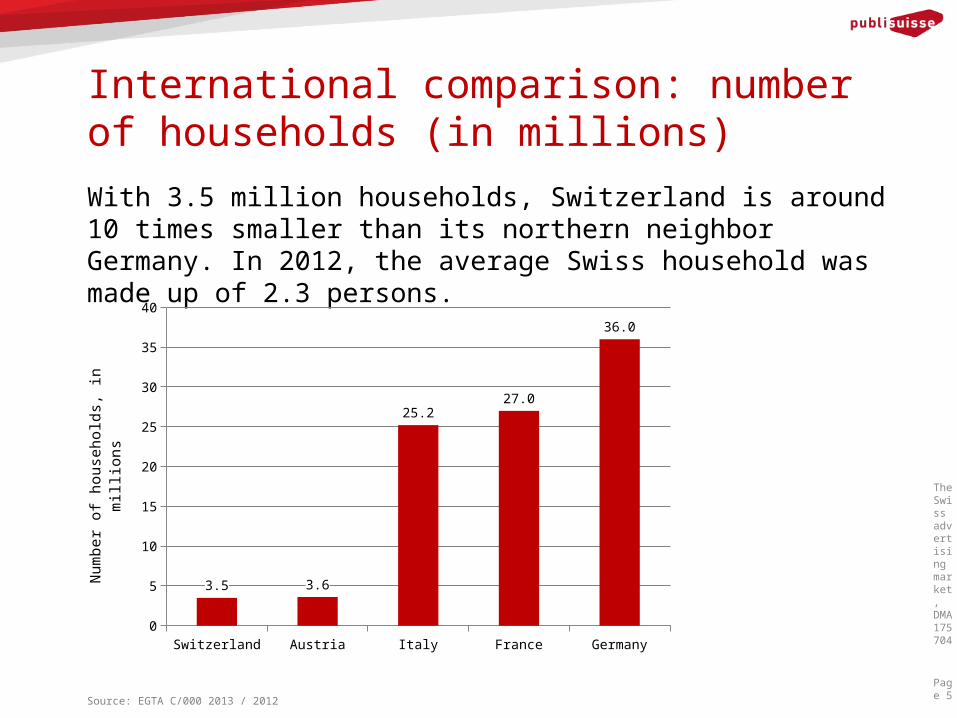
International comparison: number of households (in millions)
The Swiss advertising market, DMA175704
Page 5
With 3.5 million households, Switzerland is around 10 times smaller than its northern neighbor Germany. In 2012, the average Swiss household was made up of 2.3 persons.
Source: EGTA C/000 2013 / 2012
Switzerland Austria Italy France Germany0
5
10
15
20
25
30
35
40
3.5 3.6
25.227.0
36.0
Num
ber o
f hou
seho
lds,
in m
illion
s
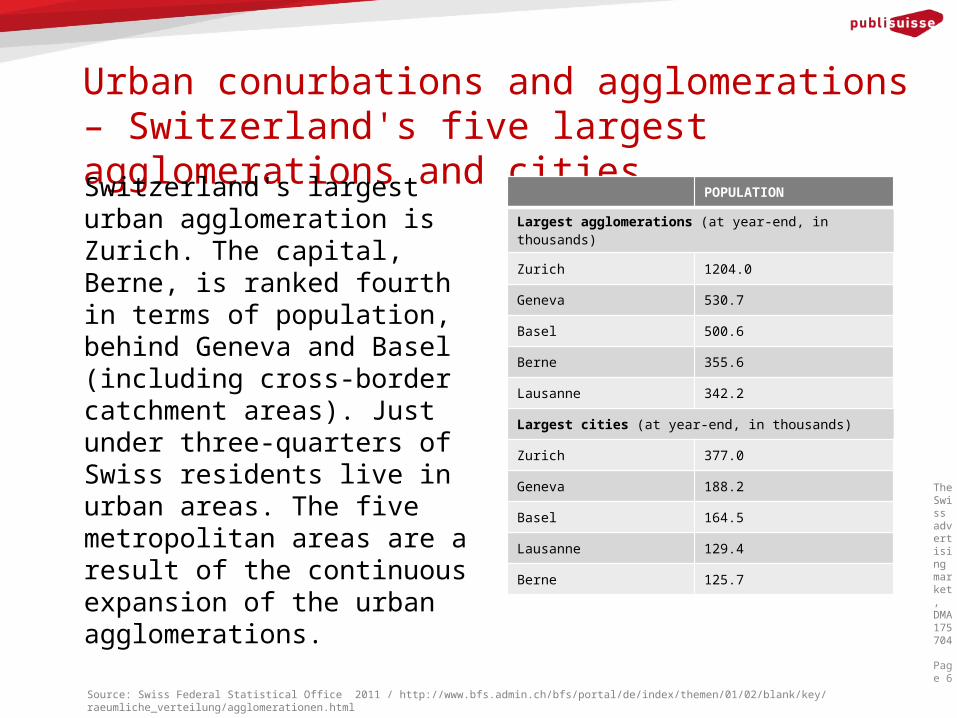
Urban conurbations and agglomerations – Switzerland's five largest agglomerations and citiesSwitzerland's largest urban agglomeration is Zurich. The capital, Berne, is ranked fourth in terms of population, behind Geneva and Basel (including cross-border catchment areas). Just under three-quarters of Swiss residents live in urban areas. The five metropolitan areas are a result of the continuous expansion of the urban agglomerations.
Source: Swiss Federal Statistical Office 2011 / http://www.bfs.admin.ch/bfs/portal/de/index/themen/01/02/blank/key/raeumliche_verteilung/agglomerationen.html
POPULATION
Largest agglomerations (at year-end, in thousands)
Zurich 1204.0
Geneva 530.7
Basel 500.6
Berne 355.6
Lausanne 342.2
Largest cities (at year-end, in thousands)
Zurich 377.0
Geneva 188.2
Basel 164.5
Lausanne 129.4
Berne 125.7
The Swiss advertising market, DMA175704
Page 6
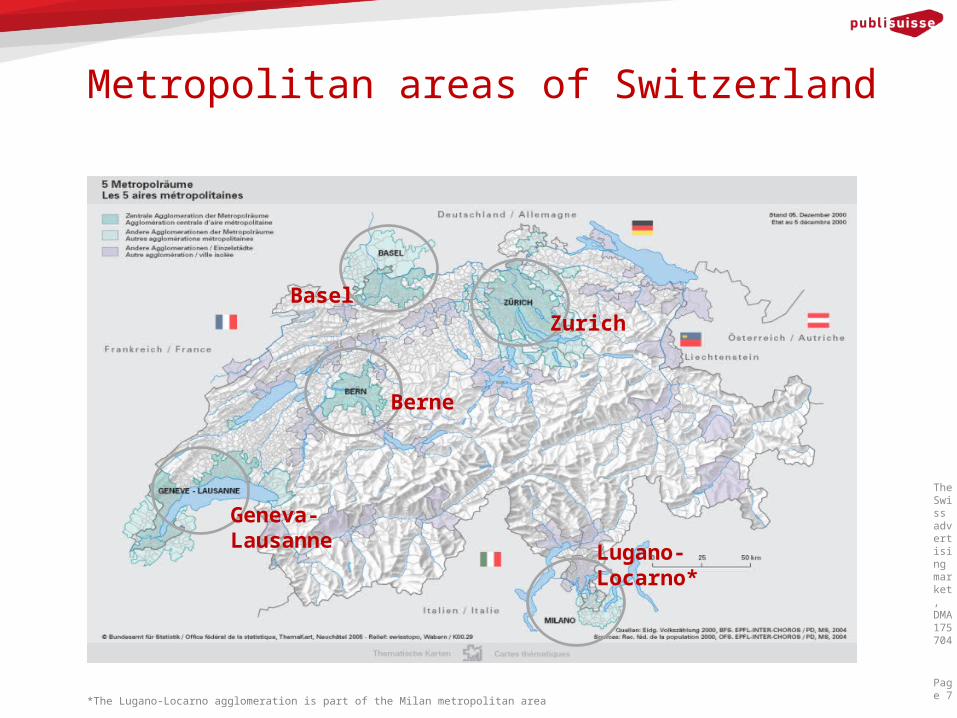
Metropolitan areas of Switzerland
Page 7*The Lugano-Locarno agglomeration is part of the Milan metropolitan area
BaselZurich
Berne
Geneva-Lausanne Lugano-
Locarno*
The Swiss advertising market, DMA175704
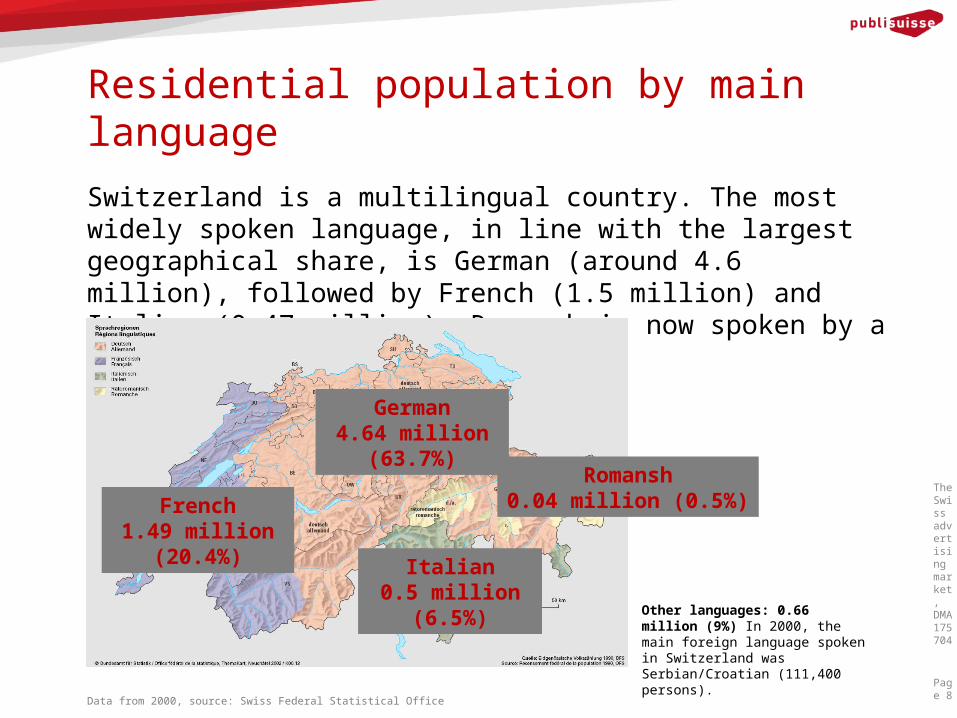
Residential population by main language
Page 8
Switzerland is a multilingual country. The most widely spoken language, in line with the largest geographical share, is German (around 4.6 million), followed by French (1.5 million) and Italian (0.47 million). Romansh is now spoken by a small minority only.
Data from 2000, source: Swiss Federal Statistical Office
Other languages: 0.66 million (9%) In 2000, the main foreign language spoken in Switzerland was Serbian/Croatian (111,400 persons).
German4.64 million
(63.7%)
French1.49 million
(20.4%) Italian0.5 million
(6.5%)
Romansh0.04 million (0.5%)
The Swiss advertising market, DMA175704
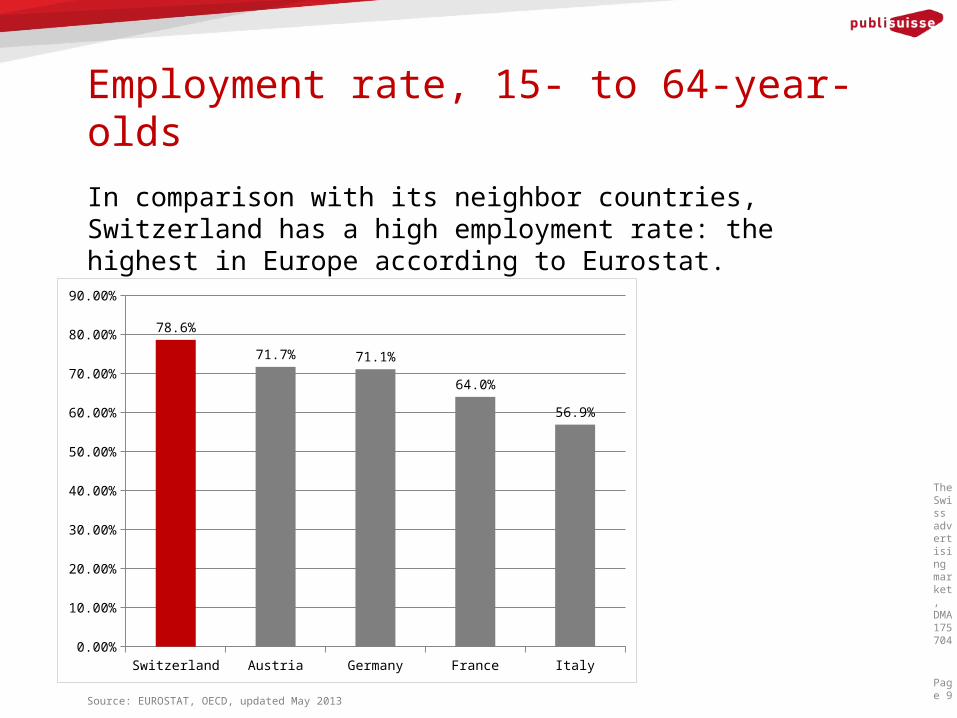
Employment rate, 15- to 64-year-olds
Page 9
In comparison with its neighbor countries, Switzerland has a high employment rate: the highest in Europe according to Eurostat.
Source: EUROSTAT, OECD, updated May 2013
Switzerland Austria Germany France Italy0.00%
10.00%
20.00%
30.00%
40.00%
50.00%
60.00%
70.00%
80.00%
90.00%
78.6%
71.7% 71.1%
64.0%
56.9%
The Swiss advertising market, DMA175704
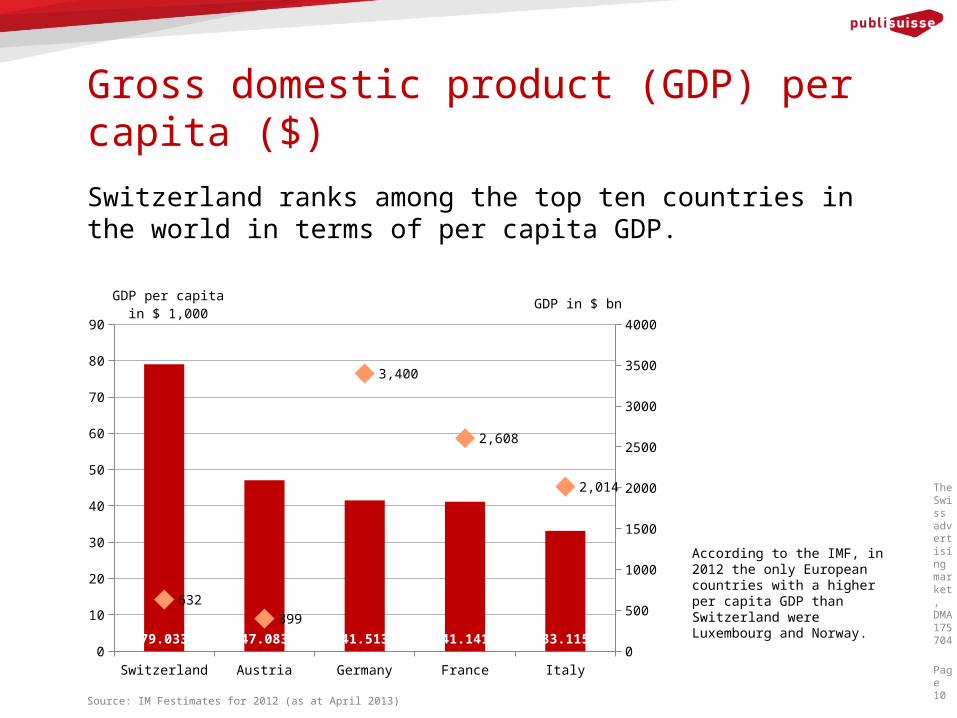
Gross domestic product (GDP) per capita ($)
Page 10
Switzerland ranks among the top ten countries in the world in terms of per capita GDP.
Source: IM Festimates for 2012 (as at April 2013)
According to the IMF, in 2012 the only European countries with a higher per capita GDP than Switzerland were Luxembourg and Norway.
Switzerland Austria Germany France Italy0
10
20
30
40
50
60
70
80
90
0
500
1000
1500
2000
2500
3000
3500
4000
79.033 47.083 41.513 41.141 33.115
632399
3,400
2,608
2,014
GDP in $ bnGDP per capita in $ 1,000
The Swiss advertising market, DMA175704
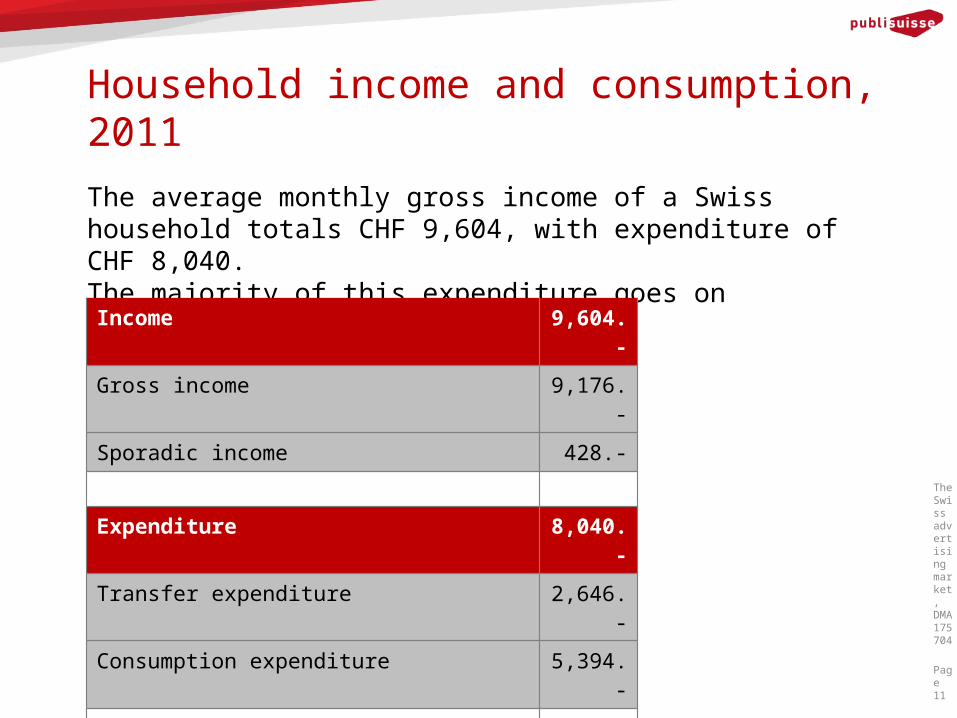
Household income and consumption, 2011
Page 11
The average monthly gross income of a Swiss household totals CHF 9,604, with expenditure of CHF 8,040.The majority of this expenditure goes on consumption.
Data: Swiss Federal Statistical Office, household income and expenditure 2011
Income 9,604.-
Gross income 9,176.-
Sporadic income 428.-
Expenditure 8,040.-Transfer expenditure 2,646.-
Consumption expenditure 5,394.-
Savings 1,209.-
The Swiss advertising market, DMA175704
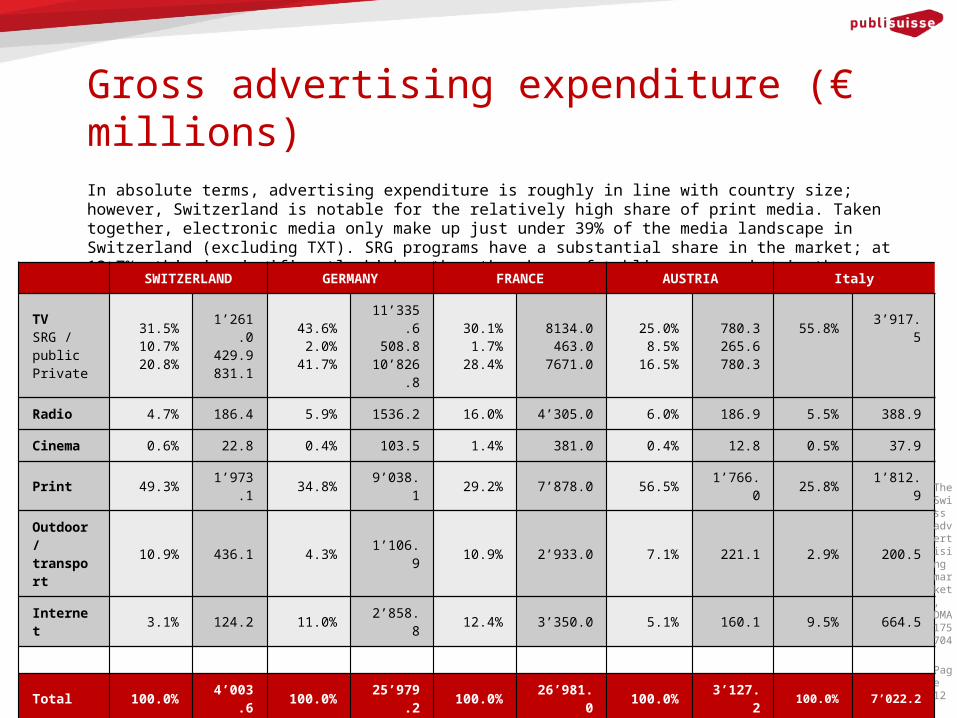
Gross advertising expenditure (€ millions)
Page 12
In absolute terms, advertising expenditure is roughly in line with country size; however, Switzerland is notable for the relatively high share of print media. Taken together, electronic media only make up just under 39% of the media landscape in Switzerland (excluding TXT). SRG programs have a substantial share in the market; at 12.7%, this is significantly higher than the share of public programming in the neighboring countries.
Data from 2012, source: EGTA C/000 2013 / Nielsen Company
SWITZERLAND GERMANY FRANCE AUSTRIA Italy
TVSRG / publicPrivate
31.5%10.7%20.8%
1’261.0429.9831.1
43.6%2.0%
41.7%
11’335.6508.8
10’826.8
30.1%1.7%
28.4%
8134.0463.0
7671.0
25.0%8.5%
16.5%
780.3265.6780.3
55.8% 3’917.5
Radio 4.7% 186.4 5.9% 1536.2 16.0% 4’305.0 6.0% 186.9 5.5% 388.9
Cinema 0.6% 22.8 0.4% 103.5 1.4% 381.0 0.4% 12.8 0.5% 37.9
Print 49.3% 1’973.1 34.8% 9’038.1 29.2% 7’878.0 56.5% 1’766.0 25.8% 1’812.9
Outdoor/transport 10.9% 436.1 4.3% 1’106.9 10.9% 2’933.0 7.1% 221.1 2.9% 200.5
Internet 3.1% 124.2 11.0% 2’858.8 12.4% 3’350.0 5.1% 160.1 9.5% 664.5
Total 100.0% 4’003.6 100.0% 25’979.2 100.0% 26’981.0 100.0% 3’127.2 100.0% 7’022.2
Source Media Focus Nielsen Media Research TNS Media International Focus Media Research Nielsen Media Research
The Swiss advertising market, DMA175704
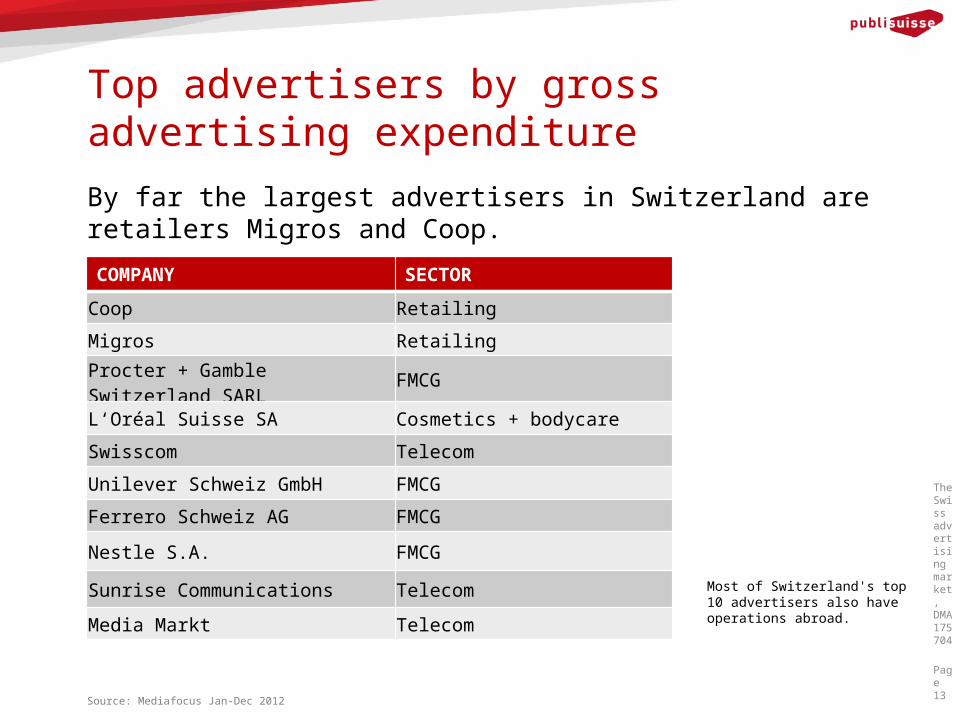
Top advertisers by gross advertising expenditure
Page 13
By far the largest advertisers in Switzerland are retailers Migros and Coop.
Source: Mediafocus Jan-Dec 2012
Most of Switzerland's top 10 advertisers also have operations abroad.
COMPANY SECTOR
Coop Retailing
Migros Retailing
Procter + Gamble Switzerland SARL FMCG
L‘Oréal Suisse SA Cosmetics + bodycare
Swisscom Telecom
Unilever Schweiz GmbH FMCG
Ferrero Schweiz AG FMCG
Nestle S.A. FMCG
Sunrise Communications Telecom
Media Markt Telecom
The Swiss advertising market, DMA175704
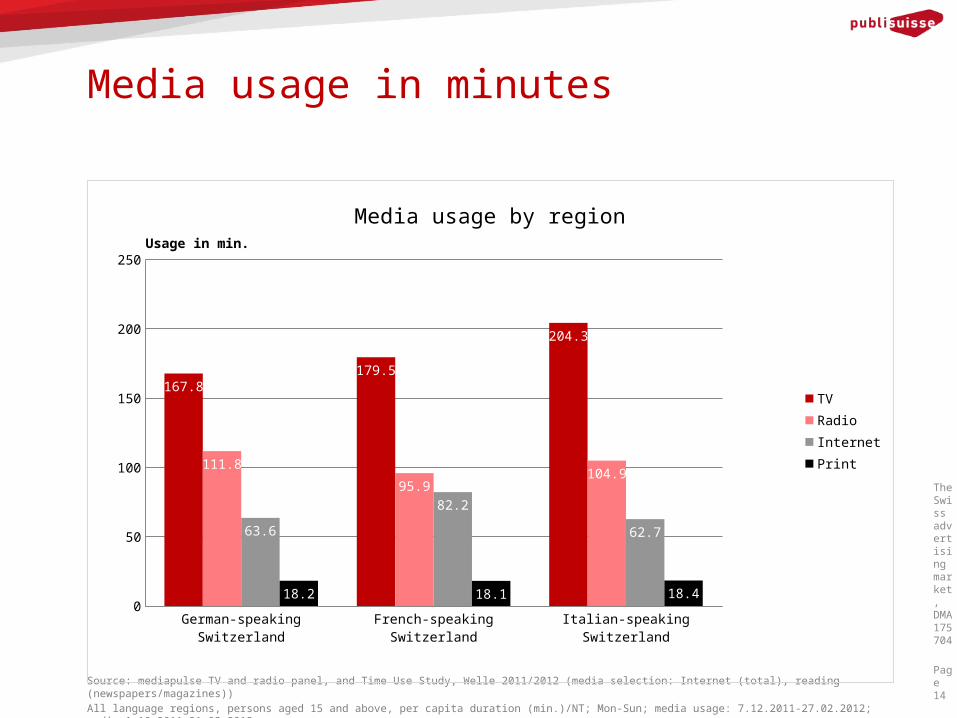
Media usage in minutes
Page 14Source: mediapulse TV and radio panel, and Time Use Study, Welle 2011/2012 (media selection: Internet (total), reading (newspapers/magazines))
All language regions, persons aged 15 and above, per capita duration (min.)/NT; Mon-Sun; media usage: 7.12.2011-27.02.2012; radio 1.10.2011-31.03.2012
German-speaking Switzerland French-speaking Switzerland Italian-speaking Switzerland0
50
100
150
200
250
167.8179.5
204.3
111.8
95.9104.9
63.6
82.2
62.7
18.2 18.1 18.4
Media usage by region
TVRadioInternetPrint
Usage in min.
The Swiss advertising market, DMA175704
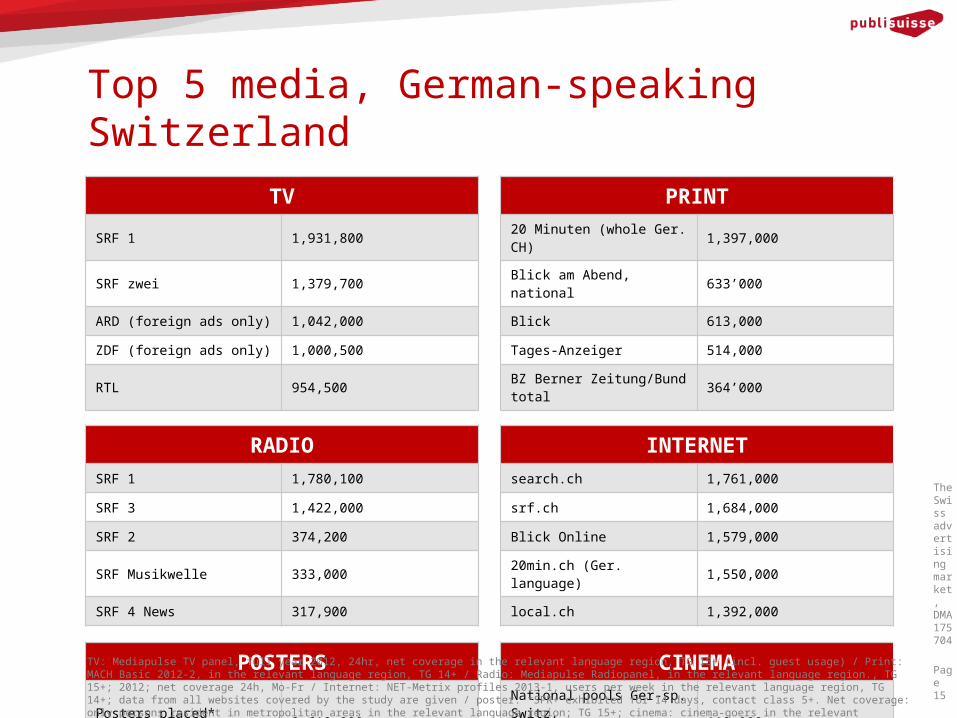
Top 5 media, German-speaking Switzerland
Page 15
TV PRINTSRF 1 1,931,800 20 Minuten (whole Ger. CH) 1,397,000
SRF zwei 1,379,700 Blick am Abend, national 633’000
ARD (foreign ads only) 1,042,000 Blick 613,000
ZDF (foreign ads only) 1,000,500 Tages-Anzeiger 514,000
RTL 954,500 BZ Berner Zeitung/Bund total 364’000
RADIO INTERNETSRF 1 1,780,100 search.ch 1,761,000
SRF 3 1,422,000 srf.ch 1,684,000
SRF 2 374,200 Blick Online 1,579,000
SRF Musikwelle 333,000 20min.ch (Ger. language) 1,550,000
SRF 4 News 317,900 local.ch 1,392,000
POSTERS CINEMAPosters placed* 39 urban areas 2,619,000 National pools Ger-sp. Switz.
Av. weekly cinema audience 118,000
TV: Mediapulse TV panel, full year 2012, 24hr, net coverage in the relevant language region, TG 15+ (incl. guest usage) / Print: MACH Basic 2012-2, in the relevant language region, TG 14+ / Radio: Mediapulse Radiopanel, in the relevant language region., TG 15+; 2012; net coverage 24h, Mo-Fr / Internet: NET-Metrix profiles 2013-1, users per week in the relevant language region, TG 14+; data from all websites covered by the study are given / poster: *SPR+ exhibited for 14 days, contact class 5+. Net coverage: only persons resident in metropolitan areas in the relevant language region; TG 15+; cinema: cinema-goers in the relevant language region 2012 ProCinema, P Cinecom
The Swiss advertising market, DMA175704
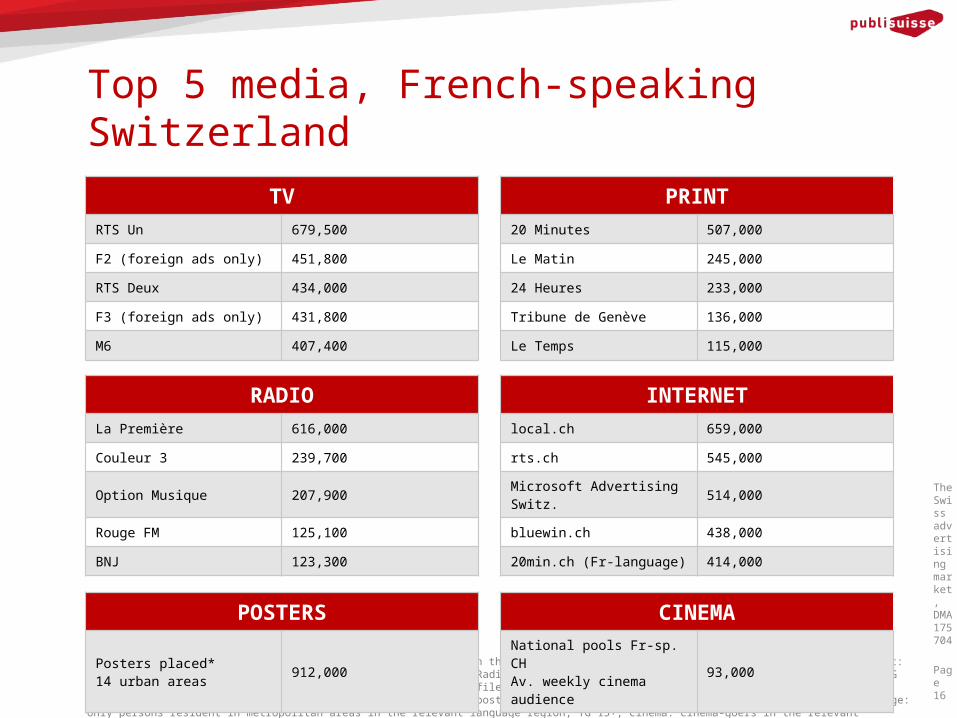
Top 5 media, French-speaking Switzerland
Page 16
TV: Mediapulse TV panel, full year 2012, 24hr, net coverage in the relevant language region, TG 15+ (incl. guest usage) / Print: MACH Basic 2012-2, in the relevant language region, TG 14+ / Radio: Mediapulse Radiopanel, in the relevant language region., TG 15+; 2012; net coverage 24h, Mo-Fr / Internet: NET-Metrix profiles 2013-1, users per week in the relevant language region, TG 14+; data from all websites covered by the study are given / poster: *SPR+ exhibited for 14 days, contact class 5+. Net coverage: only persons resident in metropolitan areas in the relevant language region; TG 15+; cinema: cinema-goers in the relevant language region 2012 ProCinema, P Cinecom
TV PRINTRTS Un 679,500 20 Minutes 507,000
F2 (foreign ads only) 451,800 Le Matin 245,000
RTS Deux 434,000 24 Heures 233,000
F3 (foreign ads only) 431,800 Tribune de Genève 136,000
M6 407,400 Le Temps 115,000
RADIO INTERNETLa Première 616,000 local.ch 659,000
Couleur 3 239,700 rts.ch 545,000
Option Musique 207,900 Microsoft Advertising Switz. 514,000
Rouge FM 125,100 bluewin.ch 438,000
BNJ 123,300 20min.ch (Fr-language) 414,000
POSTERS CINEMAPosters placed* 14 urban areas 912,000 National pools Fr-sp. CH
Av. weekly cinema audience 93,000
The Swiss advertising market, DMA175704
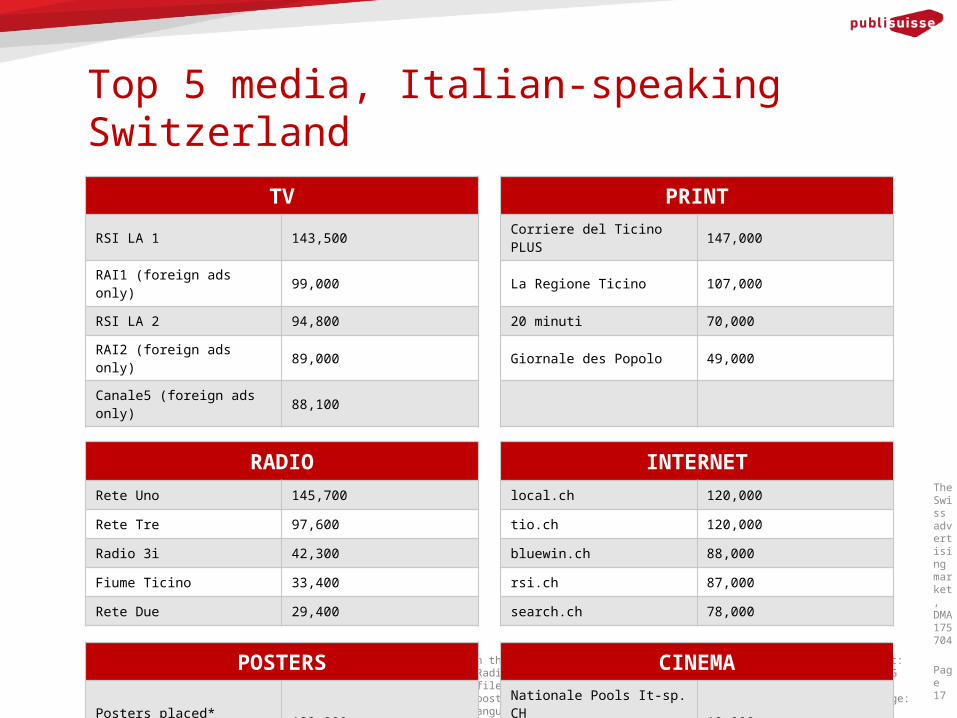
Top 5 media, Italian-speaking Switzerland
Page 17
TV: Mediapulse TV panel, full year 2012, 24hr, net coverage in the relevant language region, TG 15+ (incl. guest usage) / Print: MACH Basic 2012-2, in the relevant language region, TG 14+ / Radio: Mediapulse Radiopanel, in the relevant language region., TG 15+; 2012; net coverage 24h, Mo-Fr / Internet: NET-Metrix profiles 2013-1, users per week in the relevant language region, TG 14+; data from all websites covered by the study are given / poster: *SPR+ exhibited for 14 days, contact class 5+. Net coverage: only persons resident in metropolitan areas in the relevant language region; TG 15+; cinema: cinema-goers in the relevant language region 2012 ProCinema, P Cinecom
TV PRINTRSI LA 1 143,500 Corriere del Ticino PLUS 147,000
RAI1 (foreign ads only) 99,000 La Regione Ticino 107,000
RSI LA 2 94,800 20 minuti 70,000
RAI2 (foreign ads only) 89,000 Giornale des Popolo 49,000
Canale5 (foreign ads only) 88,100
RADIO INTERNETRete Uno 145,700 local.ch 120,000
Rete Tre 97,600 tio.ch 120,000
Radio 3i 42,300 bluewin.ch 88,000
Fiume Ticino 33,400 rsi.ch 87,000
Rete Due 29,400 search.ch 78,000
POSTERS CINEMAPosters placed* 4 urban areas 183,000 Nationale Pools It-sp. CH
Av. weekly cinema audience 10,000
The Swiss advertising market, DMA175704
Data sources/further information
Page 18
Data sourcesSwiss Federal Statistical Office: (www.bfs.admin.ch)TV and radio data: publicadata (www.publicadata.ch, www.telecontrol.ch, www.radiocontrol.ch)Print data: Mach Basic (www.wemf.ch)Internet data: Net-Metrix (www.net-metrix.ch)Outdoor advertising: SPR Plus (www.spr-plus.ch)Cinema advertising: Publicitas Cinecom
(www.publicitas.ch/cinecom)Foreign advertising: EGTA (www.egta.com)
Market informationGross advertising expenditure: Media Focus (www.mediafocus.ch)Net advertising expenditure: Werbestatistik Schweiz (www.wemf.ch)Media usage: Media consumption study 2013/mediacompassGross domestic product: International Monetary Fund (IMF)
Additional informationpublisuisse MediaGuide (www.publisuisse.ch/mediaguide)GfK-Vademecum (www.gfk.ch)
The Swiss advertising market, DMA175704
Recommended