The Maputo DeclarationImplementation in East Africa
PAP / EALA Seminar: 26-27 AprilRwanda

Background & Motivation... Africa’s common policy framework for agriculture-led socio-
economic growth ...
(accelerate agricultural growth, improve food security and strengthen environmental resilience); endorsed in 2003
6% Annual AgricultureProductivity growth rate
(by 2015)
10% Public Expenditureallocation to Agriculture
(by 2008)

Why CAADP?Level and quality of productivity should be able to position agriculture as an engine for GROWTH
Policy environment to provide desired incentives for both state and non-state players (Security, investments, Governance, etc…)
Institutional arrangements and capacity for effective and efficient implementation

CAADP implementation in EAC Country Dates when
Compacts signed IP Ready Technical review for the IP Business Meeting held
24-25 August 2009 Yes Yes (22-31 Aug 2011) Yes (14-15 March 2012)
Burundi
23-24 July 2010 Yes Yes (6-14 Sept 2010) Yes (27th Sept 2010)
Kenya
30-31 March 2007 Yes Yes (4-8 Dec 2009) Yes (8-9 Dec 2009)
Rwanda
30-31- March 2010 Yes Yes (2-10 Sept 2010) Yes (16-17 Sept 2010)
Uganda
6-8 July 2010 Yes Yes (20-31 May 2011) Yes (9-10 Nov 2011)
Tanzania
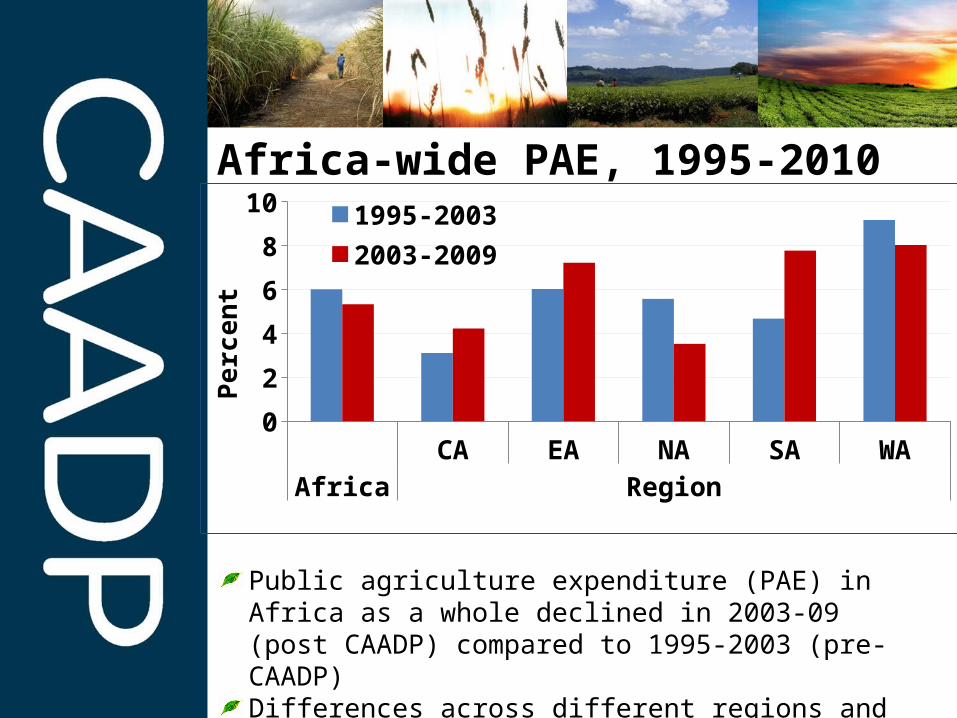
Africa-wide PAE, 1995-2010
Public agriculture expenditure (PAE) in Africa as a whole declined in 2003-09 (post CAADP) compared to 1995-2003 (pre-CAADP)Differences across different regions and countries
CA EA NA SA WAAfrica Region
0
2
4
6
8
10 1995-20032003-2009
Perc
ent

PAE in Central Africa, 2003-10
Increase in Burundi, Rep of Congo, and São Tomé and PrincipeDecline or stagnated in other countries, which also spend less than 5%
Buru
ndi
Cam
eroo
n
Cent
ral A
fr...
Chad
Cong
o, D
e...
Cong
o, R
ep.
Equa
toria
l...
Sao
Tom
e &
...
0
5
10
15 Central AfricaPe
rcen
t

PAE in East Africa , 2003-10
Many countries in East Africa spent 5-10% percent of total expenditure on agricultureSpending has increased over time in several countries (especially Ethiopia, Rwanda, Sudan)
Djib
outi
Ethi
opia
Keny
a
Mad
agas
car
Mau
ritius
Rwan
da
Seyc
helle
s
Sout
h Su
dan
Suda
n
Tanz
ania
Uga
nda0
510152025
East AfricaPe
rcen
t

PAE in North Africa , 2003-10
Spending has stagnated in Mauritania and is on a downward trend from the 10% target in the other countries
Alge
ria
Egyp
t
Mau
ritan
ia
Mor
occo
Tuni
sia0
5
10
15North Africa
Perc
ent
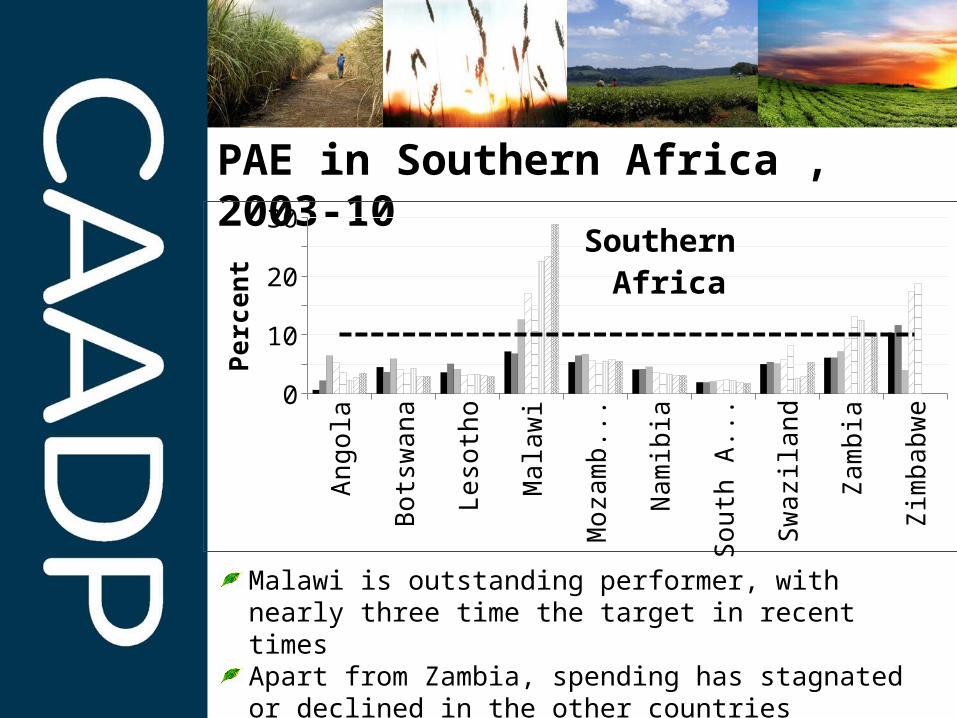
PAE in Southern Africa , 2003-10
Malawi is outstanding performer, with nearly three time the target in recent timesApart from Zambia, spending has stagnated or declined in the other countries
Ango
la
Bots
wan
a
Leso
tho
Mal
awi
Moz
ambi
que
Nam
ibia
Sout
h Af
rica
Swaz
iland
Zam
bia
Zim
babw
e05
1015202530 Southern
AfricaPe
rcen
t
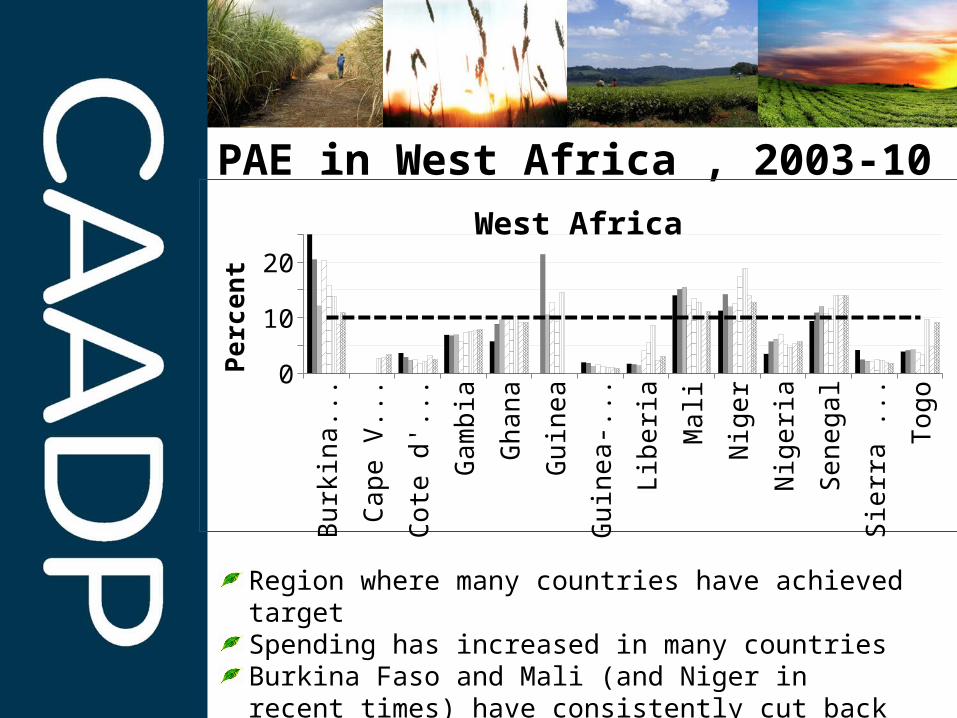
PAE in West Africa , 2003-10
Region where many countries have achieved targetSpending has increased in many countriesBurkina Faso and Mali (and Niger in recent times) have consistently cut back on spending to the target level
Burk
ina
Faso
Cape
Ver
de
Cote
d'Iv
oire
Gam
bia
Gha
na
Gui
nea
Gui
nea-
Bi...
Libe
ria
Mal
i
Nig
er
Nig
eria
Sene
gal
Sier
ra L
eone
Togo
05
10152025
West AfricaPe
rcen
t

Summary of progress & key questions (I)
Since 2003 when the declaration was made: Only 11 countries have surpassed the target in any year—Burkina Faso, Chad, Ethiopia, Ghana, Guinea, Malawi, Mali, Niger, Senegal, Zambia, and Zimbabweonly 7 have surpassed it in many years
Where expenditure has been increasing or is high:Especially among countries in east and west Africa, is it because they have observed positive returns or because they think the 10% is optimal?
Where the expenditure has been declining:Especially in Burkina Faso, Mali and Niger where the shares were higher than 10%, is it because they are not getting the expected returns?
Summary of progress & key questions (II)
For middle income countries with other sources of growth and development (esp. in North and Southern Africa), is it because returns to additional spending in agriculture is lower than in the other sectors?
Where expenditure has stagnated: Is it because they have reached equilibrium, where returns to additional spending in agriculture and non-agriculture are equal?
These questions reflect the issue of the composition of public agriculture expenditure (PAE):
Role of government: large variation over time reflects changing involvement of government in the sectorAccounting issue: PAE depends of how PAE is accounted for and reported in different countries
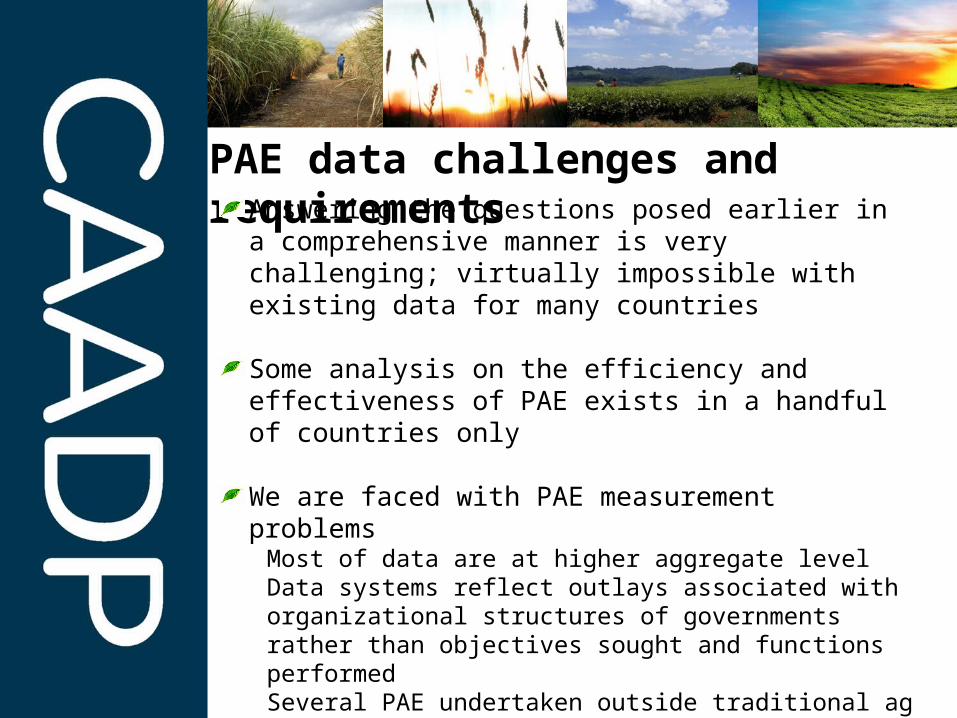
PAE data challenges and requirementsAnswering the questions posed earlier in a comprehensive manner is very challenging; virtually impossible with existing data for many countries
Some analysis on the efficiency and effectiveness of PAE exists in a handful of countries only
We are faced with PAE measurement problemsMost of data are at higher aggregate levelData systems reflect outlays associated with organizational structures of governments rather than objectives sought and functions performedSeveral PAE undertaken outside traditional ag MDAs
We need to do better for successful JSRs
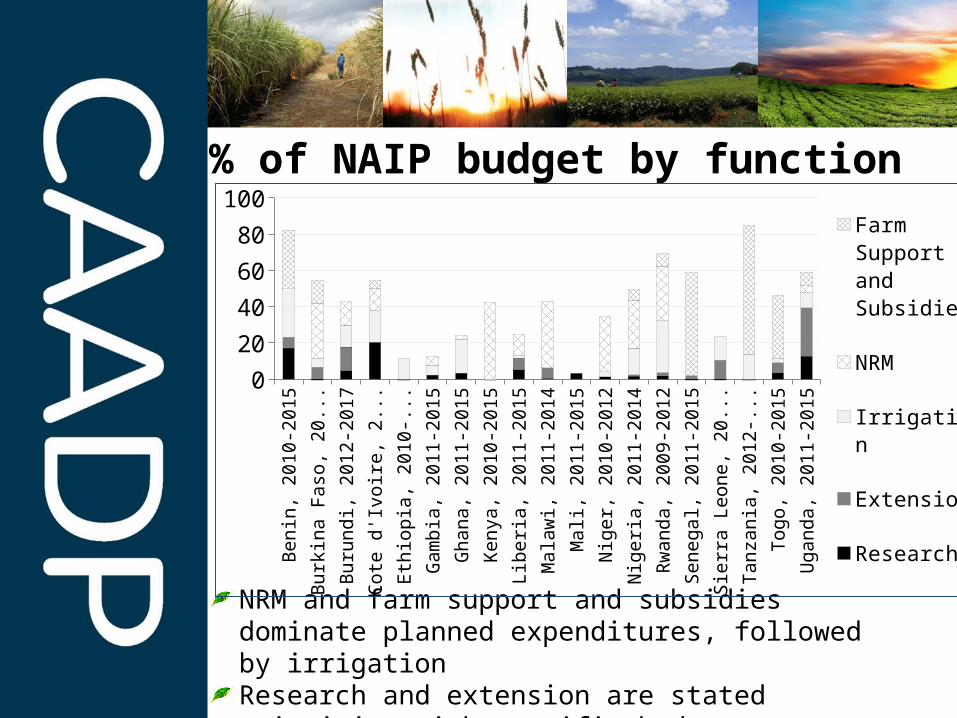
% of NAIP budget by function
NRM and farm support and subsidies dominate planned expenditures, followed by irrigationResearch and extension are stated priorities with specific budget allocations in a few countries only
Beni
n, 2
010-
2015
Burk
ina
Faso
, 201
1-20
15
Buru
ndi,
2012
-201
7
Cote
d'Iv
oire
, 201
0-20
15
Ethi
opia
, 201
0-20
20
Gam
bia,
201
1-20
15
Gha
na, 2
011-
2015
Keny
a, 2
010-
2015
Libe
ria, 2
011-
2015
Mal
awi,
2011
-201
4
Mal
i, 20
11-2
015
Nig
er, 2
010-
2012
Nig
eria
, 201
1-20
14
Rwan
da, 2
009-
2012
Sene
gal,
2011
-201
5
Sier
ra L
eone
, 201
0-20
14
Tanz
ania
, 201
2-20
16
Togo
, 201
0-20
15
Uga
nda,
201
1-20
15
0
20406080
100
Farm Support and Subsidies
NRM
Irrigation
Extension
Research
Role of Parliamentarians in CAADP (I)Country level support
Oversight on CAADP effectiveness • National budget / oversight e.g. Public Expenditure Review
(PER) & overview of the Medium Term Expenditure Framework (MTEF) is one example
• NAIP oversightGeneral prioritisation of agriculture as a channel of employment amongst youth (value addition in agribusiness) & wealth creation

Role of Parliamentarians in CAADP (II)Regional level support
RECs regional CAADP compacts and Regional Investment Plans will be key instruments in championing a systematic and coherent thrust to achieve, expand and up-scale regional agriculture business, markets, commerce and trade.EAC Regional Compact & Investment Plan?

Conclusions & Implications (I)
Transparency, accountability (M&E /MAF)
Evidence-based planning & reforms in capacity/ systems
Inclusiveness & collective responsibility
Inter-Ministerial Collaboration
“New” form of partnerships
Integrated & Comprehensive Plans/Programme
Investment Plans
Policy Reforms Institutions
Domestic / International financing
Incentives for trade/markets
Comprehensive & integrated
Conclusions & Implications (II)The amount of PAE in Africa as a whole increased rapidly, but at a slower pace than the growth in total expenditures resulting in a decline in the share of PAE in total expenditures for Africa as a wholeSome governments’ reports on compliance with the Maputo Declaration has generated controversy on what to count as PAE• resulting in a debate that may be polarizing behavior around
the fundamental issue of the investments needed to achieve development results
• i.e. what types of investment, how much of each type of investment, where should they be invested, and when should they be invested
Prioritization of investments has to be based on analysis of the efficiency and effectiveness of different types of public spending. Therefore, disaggregation of public expenditure data by type, across space, and over time is critical.
END
Recommended


![Maputo Corridor Mar2007[1]](https://img.pdfslide.us/doc/110x75/55cf9d24550346d033ac69df/maputo-corridor-mar20071.jpg)