1
The influence of industry concentration on merger motives – empirical
evidence from machinery industry mergers
Florian Geiger
European Business School Oestrich-Winkel (ebs), Endowed Chair of Banking and
Finance, Schloß Reichhartshausen, 65375 Oestrich-Winkel, Germany
January 2009
Abstract
Linking industrial organization theory and capital market research, we provide
empirical evidence that merger motives of firms are influenced by their prevailing
industry concentration. We analyze wealth effects for target, acquiring and rival firms
for 330 transactions in the machinery industry between 1997 and 2007. We show that
mergers in concentrated industries are primarily motivated to achieve productive
efficiency gains. This seems surprising as we rather expect monopolistic collusion
motives. For fragmented industries, on the other hand, we observe both, productive
efficiency and monopolistic collusion motives for firm mergers. In the absence of wealth
transfers there seems no indication for agency problems. Our findings suggest that the
traditional research on merger motives falls too short by not considering structural
market differences in form of industry concentration.
Keywords: Industry concentration, Merger motive, Event study, M&A
JEL-Classification: G14, G34
2
1. Introduction
Although the influence of market structure on success of corporations has long been
outlined by the industrial organization theory, only little is known about its specific
impacts on merger motives. By examining stock price reactions to merger
announcements, we examine how industry concentration influences merger decisions
and motives of the management.
Our argumentation seems simple. The motives of the management to engage in mergers
should be driven by their prevailing market environment where industry concentration
is a major aspect. We link to the industrial organization theory arguing that exogenous
market factors determine endogenous market conduct. This argumentation is similar to
Hou and Robinson (2006) who find that industry concentration influences the risk
behavior of firms, an assumption that is based on traditional views of Schumpeter
(1912) and Bain (1954). Industry concentration influences innovation dynamics and
distress risk of firms and directly impacts the process of creative destruction. We
suppose that this influence should be reflected also in the strategic merger motives of
the firm management. For example, as innovation dynamics and strive for efficiency
seems higher in highly competitive industries (Knott and Hart 2003), most mergers in
fragmented industries should be motivated by synergy gains in form of operational,
managerial or financial synergies. Contrarily, mergers in concentrated industries should
be primarily driven by monopolistic collusion motives, as tendencies to limit output,
raise product prices and/or lower factor prices (Chatterjee 1986) seem more promising.
Capital markets should recognize the impact of industry concentration and evaluate
those transactions differently.
We test three primary lines of arguments that explain merger motives (Trautwein 1990;
Fee and Thomas 2004; Sharur 2005). First, the efficiency theory that suggests mergers
are motivated by synergies and hence wealth creation depends on the fit of both
companies. Second, the monopolistic collusion theory that argues mergers (horizontal
and conglomerate mergers) are executed to improve market positioning and to achieve
market power. Third, the agency and hubris theories that assume either agency problems
in form of wealth transfers between acquiring and target shareholders, or hubris of the
management in form of overestimation of potential synergies and overpayment of the
target. By observing wealth effects of target, acquirer, and rival companies, we test how
specific industry characteristics influence merger motives of the management.
3
In our argumentation we tie financial research with industrial organization theory that
highlights the influence of market structure and competition on firm behavior. Although
previous research has in some cases included industry characteristics as determinant for
merger success (excess returns), to our knowledge this paper is the first that examines
the effect on merger motives. To fill this gap we test the efficiency, collusion and hubris
hypothesis under different conditions of market structure (i.e. concentrated and
fragmented markets). We base our analysis on 330 transactions between the 1997 to
2007 period, examining target, acquirer, combined entity and rival reactions. By
separating two groups of concentrated and fragmented industries we test the merger
motive by examining wealth effects (see for example Eckbo 1983; Stillmann 1983; Fee
and Thomas 2004; Sharur 2005) and by comparing correlations between change of
industry concentration and excess returns (Ghosh 2004).
We focus our analysis specifically on the machinery industry. Relative to other
industries such as banking, telecommunications or pharmaceuticals, the machinery
industry is sufficiently homogenous that general market trends and developments are
similar and, through its high fragmentation in sub-industries, it guarantees a
heterogeneity of industry concentration levels that allows to examine the impact on
merger motives.1 Comparing the amount of academic research, it seems that a cross-
industry analysis may fall too short to consider specific industry related market
developments and trends. As those trends could substantially influence merger motives,
we circumvent this problem by focusing on one industry.2
Using event study methodology, we find support for our initial hypothesis that industry
concentration influences merger motives of the management. Against our expectations,
transactions within highly concentrated industries are not motivated by monopolistic
collusion but rather by productive efficiency gains. In contrast, in fragmented industries
we detect both, productive efficiency and monopolistic collusions motives. Regardless
of the prevailing industry concentration there are no indications for agency and hubris
motives, as acquirer returns are positive and no wealth transfer between shareholders is
observed. We confirm those findings through a cross sectional analysis. Results show
1 The fragmentation can be observed, for example, in the concentration ratios published by the US
Census: the largest 20 machinery manufacturer in the US sum up to 27.8% market share compared to 56.3% in commercial banking or 78.8% in telecommunication
2 Although the analysis of M&A activity on shareholder value has generated a vast amount of academic research, results are to some extend contradictory. Especially acquirer reactions seem difficult to foresee as industrial dynamics and trends are difficult to compare across industries. This finding seems to be considered in the growing amount of econometric analysis for specific industries.
4
that wealth creation mechanics of mergers are different depending on their industry
concentration background (in some cases even opposed). Considering value maximizing
behavior of the management, those differences should consequently lead to different
merger motives of the management.
The remainder of the paper is structured as follows. We first introduce the machinery
industry before we give a brief overview over the academic merger motive research as
well as an outlook on some current views of the industrial organization theory.
Summarizing those findings we derive our hypotheses. In section three, we provide
some descriptive statistics on our sample, identify several factors that potentially
explain the observed wealth effects of the transaction and discuss our econometric
methodology. In section four, we conduct both univariate and multivariate analysis to
identify the determinants of the wealth effects and their impact on merger motives –
more specifically, we examine whether excess returns of transactions in fragmented or
concentrated industries have different cross-sectional determinants of merger success.
We conclude with a discussion of our findings (section five).
2. Market characteristics and literature review
2.1. Basic market characteristics
The analysis of the influence of industry concentration on merger motives needs to
focus on an industry with unique characteristics: heterogeneity within the concentration
ratios of its sub-industries (to allow for the analysis of influence on merger motives) and
homogeneity with regard to specific market trends and developments (to guarantee that
merger motives are not influenced by a general divergence of industry trends). In our
opinion, the machinery industry fulfills these requirements.
First, the various machinery sub-industries provide sufficient heterogeneity. For
example, the market for manufacturing of printing machines (SIC 3555) is very
concentrated with a limited amount of rivals, each with high market shares. On the other
hand, markets such as machine tools manufacturing (SIC 3541) are highly fragmented
and characterized by low market concentration. Basing our analysis on the four-digit
SIC code industry classification, we examine more than 37 different sub-industries with
nine industries to be classified as a concentrated industry (Herfindahl-Hirschman index
> 0.18). This heterogeneity in sub-industry market concentration allows us to examine
the impact on merger motives of firms.
5
Second, the machinery industry is sufficiently homogenous that general macroeconomic
trends are similar across machinery sub-industries. Although the intensity of trends may
be different, we observe the following trends in all submarkets of the machinery
industry. First, the shift of sales markets towards emerging countries that makes a global
footprint of all machinery manufacturers more and more essential. Second, the trend to
realize efficiency improvements and the pressure for cost savings as competition from
low cost countries, but also pressure from own customers (that delegate their own cost
pressure to the manufacturers) increase the need for operational excellence. Third, the
dynamics in innovation and technological development, as low cost competitors
increase the need for technological leadership. In contrast to a cross-industry
comparison, this basic homogeneity allows us to reduce dilution of results through a
general divergence of industry trends.
2.2 Research theories on merger motives
Although the decision to merge is often driven by a complex pattern of motives that
cannot be put into a single approach, academic research has developed some major
theories that help to explain underlying motives and assumptions. However, a final
answer to the motivations behind the merger has not been found, as it is difficult for
economic researchers to identify the sources of gains with their coarse information set
(Andrade, Mitchell et al. 2001). This paper tries to bring additional light into this topic
by suggesting to consider the influence of industry concentration in the academic
research of merger motives. In the following, we shortly introduce the three theories we
test for and explain how these motives can be identified observing capital market
reactions of stakeholder firms:
The first theory is the efficiency or synergy theory. It states that mergers are executed to
achieve synergies, compromising financial synergies (lower cost of capital), operational
synergies (combination of operations and knowledge transfer) and/or managerial
synergies (when the acquirer`s management possesses superior management skills and
abilities). In fact, synergies are often cited as key argument to improve productive
efficiency and to justify management actions (Porter 1987). Capron (1999) argues that
cost synergies are often driven by asset divestitures (physical assets and cutback of
personnel), while revenue-enhancing synergies emphasize the redeployment of the
resources to enhance revenue capabilities of the firm. Empirical research shows that a
relationship between net present value of the synergies and announcement day return
6
exists, although revenue-enhancing synergies are less valuated than cost-reduction
synergies (Comment and Jarrell 1995; Walker 2000; Houston, James et al. 2001). Fee
and Thomas (2004) find evidence consistent with improved productive efficiency and
buying power as sources of gains to horizontal mergers. Andrade and Stafford (2004)
highlight that mergers are an effective mean for industries with excess capacity to
rationalize and induce exit. To identify an productive efficiency motive in firm mergers,
empirical research suggests to examine capital market reactions (Eckbo 1983; Fee and
Thomas 2004; Sharur 2005). Following the literature, the positive impact of synergies
and productive efficiency gains is reflected in positive capital market evaluations for
target and acquiring companies to merger announcements. In contrast, share price
reactions of rival companies are not clearly determinable as both positive and negative
excess returns can be argued. For example, if the merging parties achieve a more
efficient production/market positioning then rivals should be worse off as competitive
disadvantages result (Schumann 1993). The opposite effect occurs, if the merger
induces a positive signal indicating that the rivals are able to copy the efficiency gain of
the merging companies (e.g. better production routines).
The second theory is the monopolistic collusion theory arguing mergers (horizontal and
conglomerate mergers) are executed to improve market positioning and to gain market
power. Trautwein (1990) summarizes that the monopoly theory´s record appears to be
weak, as most studies show that the primary reason for mergers is not to achieve
monopoly power. This is confirmed by recent studies. For example, Fee and Thomas
(2004) found in their investigation of upstream and downstream product-market effects
only little evidence for monopolistic collusion. Evidence on the monopoly
consequences of mergers can be identified by observing target, acquirer and rival
reactions. As an improvement of the market positioning is achieved there should be a
positive wealth gain to target and acquirer shareholders. Additionally, also competitors
should benefit through collusive mergers since the positioning of all companies in the
industry is improved. This is as collusion mergers have a tendency to limit output, raise
product prices and/or lower factor prices (Chatterjee 1986). However, a positive rival
reaction for itself cannot finally prove monopolistic collusion motives (Stillmann 1983;
Eckbo and Wier 1985). Consequently, we apply an additional methodology to
strengthen the interpretation of results. We follow the approach of Gosh (2004) and test
whether a positive correlation between shareholder wealth gains and change in industry
7
concentration exist. The combination of those approaches allows to identify competitive
collusion motives of the firm.
The third line of reasoning focuses on the explanation why mergers often destroy wealth
for bidding shareholders. It includes the agency theory (managers who maximize their
own utility) and hubris theory (overestimation of management`s abilities). Empirical
studies show that at least part of the large price increases in the target firm shares are
attributed to a general wealth transfer from bidder to target. Roll (1986) argues that
hubris is necessary to explain why managers do not abandon unfavorable takeover
offers also since reflection would suggest that such bids are likely to represent positive
errors in valuation. Seyhun (1990) finds that mergers are value destroying for acquiring
firms and conclude that takeovers are motivated by agency problems or hubris. Walking
and Long (1984) find that the existence or absence of managerial resistance to a
takeover bid is directly related to the target management's personal wealth changes
induced by takeovers. We test for the hubris or agency motive by assessing whether
negative acquirer returns are observed and/or a wealth transfer between target and
acquirer shareholder exists.
Although in academic literature there exist also other theories such as the process theory
(limited information, organizational routines and political power) or the disturbance
theory (merger waves are caused by economic disturbances) we focus on the tree lines
of arguments introduced before (efficiency/synergy, monopolistic collusion and
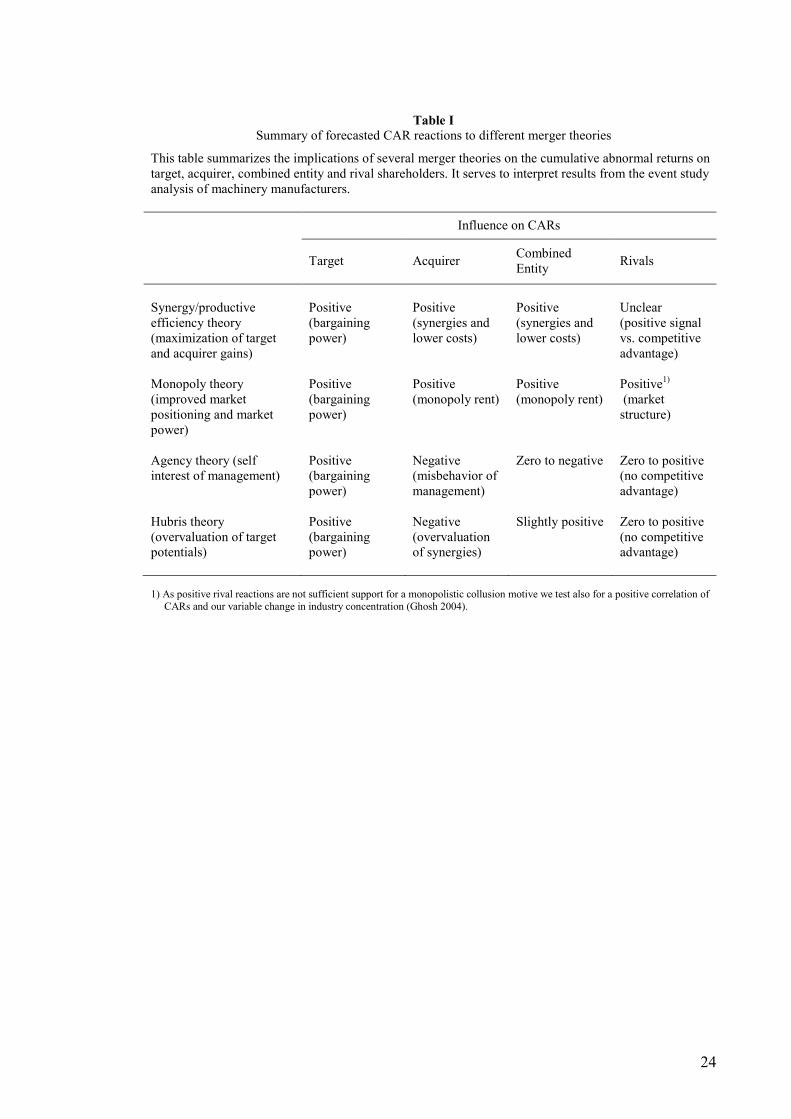
agency/hubris motives). 3 Table I summarizes expected capital market reactions to
cumulative abnormal returns of target, bidder, combined entity and rivals following the
introduced theories.
2.3 Influence of industry structure and related empirical evidence
Although this study is to our knowledge the first that specifically analyses and
empirically tests the impact of industry concentration on merger motives, the impact of
industry characteristics has long been addressed by the industrial organization theory.
One of the key questions industrial organization theory tries to answer is how market
structures influence performance and profitability of firms. Empirical research confirms
a relationship between market structure and firm profitability, although results were
often weak (Weiss 1974). The probably most known model to explain firm performance
3 For more information see the summary on merger motives of Trautwein (1990)
8
is called the structure-conduct-performance (SCP) paradigm (Slade 2004). The SCP
holds that exogenous market structure (in our case industry concentration) determines
endogenous market conduct (the way in which the firms in that industry interact), which
in turn determines firm performance (profitability). Although this model has
experienced much criticism, arguing that the cause and effect are backwards (Demsetz
1973) and showing that shows cross-industry differences in profits are sometimes not
positively related to market structure (Hirschey 1985; Rumelt 1991), recent research
resumed the discussion about the influence of industry characteristics on firm
performance.
For example, Slade (2004) finds in his empirical analysis of 14 nonferrous-metal mining
and refining markets strong support for the SCP model. Firms profits are positively and
significantly related to the structure of their markets, and this relationship holds in all
specifications that were estimated. Similar evidence was also provided by Azzam
(1997) in a analysis of the US beef packing industry. He empirically confirms the
tradeoff between market power and cost efficiency from increased concentration.
Contrarily, Morrison Paul (2003) provides evidence of substantive cost economies
implying economic motivations for observed concentration, consolidation, and
diversification. Hou and Robinson (2006) show that there is a link between industrial
concentration and overall stock returns. Their empirical analysis proves that firms in
more concentrated industries earn lower returns, even after controlling for size, book-to-
market, momentum, and other return determinants. They argue that a high industry
concentration either insulates firms from undiversifiable distress risk by high barriers to
entry, or decreases their risk-behavior because they engage in less innovation (Knott
and Hart 2003), and thereby command lower expected returns (risk based explanation).
We conclude that there seems to be an influence of market structure on firm
performance and that exogenous factors impact endogenous market conduct, which in
turn influences firm performance. We transfer this linkage to merger motives of firms.4
By analyzing merger performance (wealth creation) and the exogenous factor industry
concentration we observe how the endogenous market conduct (in our case merger
motives) is influenced. Similar to Hou and Robinson (2006) we focus on industry
concentration as a key variable to determine underlying market structures. 4 In fact, this linkage was partially considered in the classical capital market research, where industry
concentration is sometimes included as a independent variable to test for its influence on value generation. However, in this paper we are not only interested to measure impacts on excess returns but to examine whether merger motives depend on prevailing industry structures.
9
2.4 Influence of industry concentration on merger motives
We develop our research hypotheses by transferring the main argument of the industrial
organization theory to the specific situation of an M&A decision – the market structure
(exogenous factor) influences the conduct and performance of firms (endogenous
factor). Using industry concentration as main determinant of market structure (see for
example Hou and Robinson (2006), Curry and George (1983)), we examine how merger
motives of firms are influenced by observing capital market reactions of target, acquirer
and rival firms.
We assume that certain merger motives or merger strategies are, in different industry
concentration environments, more promising than others. As merger motivations are
focused on maximizing shareholder value, merger strategies should be different for
various industry concentration backgrounds. For example, the collusion effect should be
higher for companies in already concentrated markets (Chatterjee 1986) while in
fragmented industries this effect seems more difficult to achieve. Considering both,
internal risk-affinity and external effect side, we presume that industry concentration
influences merger motives of the management. As a direct parameterization seems
difficult, we derive hypotheses based on subsamples of concentrated and fragmented
industries:
Concentrated industries allow their market participants for a dominant market
positioning. Firms can take use of scale advantages and are able to limit output, raise
product prices and/or lower factor prices (Chatterjee 1986). On the other hand, market
pressure and competition for innovation dynamics and efficiency leadership is less than
in fragmented industries (Knott and Hart 2003). Furthermore, market concentration
often goes along with firm size concentration. Moeller, Schlingemann et al. (2004)
found the larger a company the more it is prone to hubris or agency problems. Those
empirical findings lead us to our first hypothesis:
Hypothesis I: In concentrated industries monopolistic collusion motives should
dominate merger decisions; furthermore, acquirers are more likely to fall for
hubris or agency problems
As we described in section 2.1 the machinery industry is characterized by trends for
internationalization, innovation dynamics and operational efficiency. As competitive
pressure is especially strong for fragmented industries, the merger motive synergy
10
(financial, operational and managerial) will play a major role. In contrast to
concentrated industries, fragmented industries will face difficulties in achieving
potential gains from monopolistic collusion. A strong increase in market shares is less
probable than in concentrated industries. Our hypothesis is as follows:
Hypothesis IIa: Fragmented industries strive for efficiency improvements,
monopolistic collusion and/or hubris is not a major motive
On the other hand, competitive pressure forces companies for any enhancement of their
strategic positioning. As a result, if a sufficient market share gain can be achieved than
also collusion rents should be a good argument for a merger.
Hypothesis IIb: If a high change in industry concentration is observed for
fragmented industries then monopolistic collusion can be a motive for firm mergers The confirmation or rejection of those hypotheses creates a general understanding of the
validity of the assumption that industry concentration influences merger motives of the
management.
3. Data and methodology
3.1. Sample composition
Our sample includes merger & acquisitions from the Thomson Financial One Banker
deal database announced between January 1, 1997 and December 31, 2007. For our
analysis we included all transactions that fulfill the following requirements (table II):
• The acquirer is a machinery manufacturer (mid description machinery) and has
sufficient stock information via Datastream available
• The transaction is a majority investment (>50% share after deal completion) and
the acquirer did not own a majority stake in the target company before
• The deal value is at least USD 20m
• The acquirer primary SIC code is within the two-digit SIC-code classification
"35" but not part of computer equipment and office machines5
• Transactions of one acquirer do not overlap within the estimation period of 250
days to avoid dilution of effects
5 We excluded: 3570 computer & office equipment, 3571 electronic computers, 3572 computer storage
devices, 3575 computer terminals, 3576 computer communication equipment, 3577 computer peripheral equipment
11
• Transaction details are confirmed through Factiva press research
This screening procedure gives us a total sample of 330 relevant transactions that
provide the basis for our data analysis. Table III shows descriptive statistics about the
data composition.
To examine rival reactions to merger announcements we identify 880 relevant rival
firms from the Thomson Financial Peer Analysis database. In our analysis, we consider
any company as rival company (besides the bidder and target) that reports its primary 4-
digit SIC code in the industry where acquirer and target company overlap. If there is no
overlapping, we use the primary SIC code segment of the acquirer to test for rival
reactions. For the rival portfolio, we include all companies with revenues larger than
USD 1m where sufficient share data through Datastream was available. For the average
deal in our sample, we identify 23 rival firms to calculate announcement period
abnormal returns.
To measure the industry concentration we compute a sales-based Herfindahl Hirschman
index (HHI) in the industry where the acquirer´s and target´s four-digit SIC-code
overlap (see for example Hou and Robinson 2006). The calculation of the industry
concentration measure requires detailed information regarding market share information
of firms in each sub-industry. We obtain the data using the Thomson Financial database,
where we also included available "private company" information. The annual HHI is
computed as follows:
HHI = ∑ ������
where s is the respective market share of firm i and n the number of all (public and
private) companies in the respective industry. The HHI can range from almost zero to
one (when one firm possesses 100% market share) with a higher value indicating a
higher degree of concentration in the relevant industry. Following the guidelines of the
US Antitrust Division of the Department of Justice we consider all industries with an
HHI index greater than 0.18 as highly concentrated.
3.2 Factors that explain the value creation from machinery M&A
We analyze the influence on merger motives by measuring determinants of wealth
creation through several cross-sectional factors that are closely related to industry
characteristics. We furthermore include some standard control variables to examine
whether capital market reactions are connected to other determinants of wealth creation
12
and to test whether value generation mechanics are different in fragmented and
concentrated industries. Table IV provides an overview of the variables we include in
our analyses.
3.2.1 Industry concentration and market structure variables
Industry characteristics determine merger motives and capital market reactions of
mergers. To grasp the influence of industry characteristics following variables are
included in the analysis: the industry concentration ratio, the change in the industry
concentration and industry growth.
As first variable we examine industry concentration. Research has shown that industry
concentration plays an important part in determining market power, business behavior
and performance of companies (Curry and George 1983) and also is a suitable measure
of barriers to entry (Hou and Robinson 2006). For our analysis, we measure the market
concentration as a sales based Herfindahl Hirschman index and use it as a suitable
indicator for classifying the different sub-industries. We use the industry concentration
to perform univariate and multivariate subsample analysis. Comparing the different
wealth determinants we analyze whether our initial hypotheses can be confirmed. We
include a dummy variable (1= concentrated) to test for the effects of market
concentration and to perform univariate subsample analysis. For the cross-sectional
analysis we use metric measures of industry concentration.
As second variable we examine the change of industry concentration from the year of
the merger to the next. For the univariate analysis this variable allows to further
distinguish between underlying productive efficiency versus competitive collusion
motives. We apply an approach of Gosh (2004) who states that a positive correlation
between shareholder wealth gains and changes in industry concentration is consistent
with the competitive collusion or market power theory. This procedure seems necessary
as the simple analysis of target, acquirer and rival returns only yields insufficient
evidence for underlying merger motives (see section 2.2). Through combination of both
procedures we gain a more reliable evaluation of merger motives. We separate the
mergers into two groups one with above average change of industry concentration and
one with below average change of industry concentration.
Third, we include the respective industry growth as a variable in our analysis. Through
analyzing annual growth rates, underlying industry dynamics can be observed a suitable
way. According to Clelland, Douglas et al. (2006) there will be a higher level of
13
competition in an industry with a lower growth rate, reflecting an increasingly zero-sum
game of mutual dependence. The lower the growth rate the greater the intensity of
rivalry between firms and the greater the influence on the relationship between value
creation and its efficacy in producing a competitive advantage. As rivalry is an indicator
similar to industrial concentration this variable helps to test whether our hypotheses
persist. We calculate the annual growth rates based on the data we obtain through the
Thomson One Banker database. We include a dummy variable to distinguish positive
(=1) or negative (=0) market growth of the respective four-digit industry.
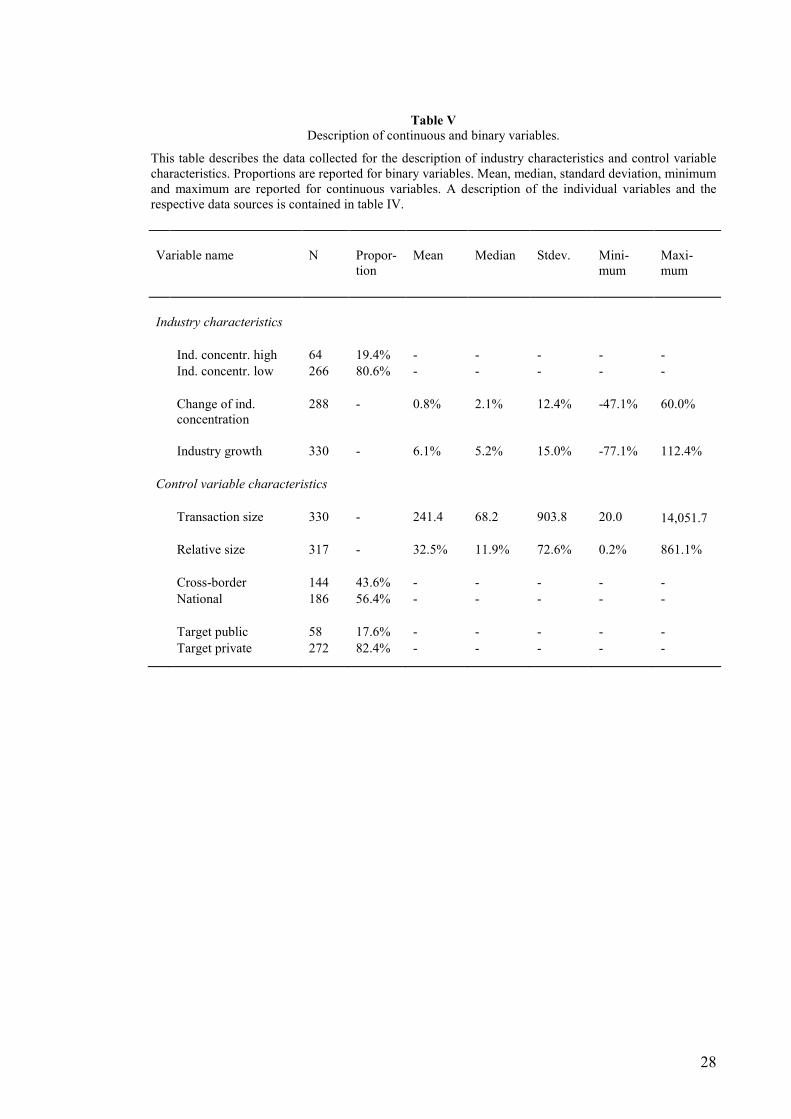
Table V presents descriptive statistics about the variable composition of our industry
characteristics data set. In our data sample 266 transactions operate in a relatively low
concentrated industry environment, while 64 transactions take place in concentrated
industries (HHI greater than 0.18). The average change in the industry concentration
(HHI) is 0.8%. In our datasample the average growth rate per year equals 6.1%.
3.2.2 Control variables
For the multivariate regression we define standard control variables to test whether
determinants of wealth creation are similar in fragmented and concentrated industries.
We include the following criteria into our analysis: transaction size (absolute and
relative), cross-border M&A and public versus private takeover.
First, we include the deal size of the transaction. It seems intuitive, that the larger the
deal size, the higher potential implications of the transaction should be for acquirer as
well as for target companies. Higher transaction sizes should result in higher synergies
and facilitate monopolistic collusion. We include deal-size as an absolute measure.
Second, we include relative size calculated as deal size divided by the bidder's market
capitalization at T-21. Asquit, Bruner et al. (1983) found that bidder returns increase with
the relative size of the target. Moeller, Schlingemann et al. (2004) state that a high
(relative) deal size can also be associated to hubris or agency problems. By
incorporating the variable "relative size" we consider if the relative size of the merging
firms is disparate.
Third, we examine the impact of cross border transactions as internationalization is one
of the key trends in machinery manufacturing. Chatterjee, Lubatkin et al. (1992) found
an inverse relationship between perceptions of cultural differences and shareholder
gains. Dennis, Dennis et al. (2002) argue that this cultural distance should induce higher
costs for post merger integration. Instead, Morosini, Shane et al. (1998) found that the
14
access to the targets diverse set of routines embedded in different cultures has a positive
association to acquisition performance. We include a dummy variable (1 = cross border)
to account for cross border effects in stock price reactions.
Fourth, we consider the target´s public or private status. Earlier research shows that
equity offers for the acquisition of public targets have lower returns, while offers for the
acquisition of private firms have higher abnormal returns for bidding shareholders
(Fuller, Netter et al. 2002). Moeller, Schlingemann et al. (2004) found that
announcement returns for shareholders of small acquirers are not affected by the public
or private status of the companies. We assume that stock prices should react more
positively to acquirer shareholders when bidding for a private company compared to
lower returns when bidding for a public company. We include a dummy variable (1 =
private) to account for the public/private status of the target firm.
3.3 Calculating announcement period abnormal returns
We use standard event study methodology to calculate abnormal returns for target,
bidder, combined entity as well as rival companies. We estimate abnormal returns to
firm i at date t (ARit) as ARit = Rit -αi - βiRmt, where Rmt is the return of the relevant
country specific Datastream machinery index. 6 Our market model parameters are
estimated over an observation period of 250 trading days starting at day T-300 to T-50
relative to the announcement date. We exclude all companies with less trading days
available from our sample. We use the announcement date as reported by Thomson
financial and crosschecked the data using press research via Factiva. To obtain the
cumulative abnormal return (CAR) of a transaction we perform an ordinary leased
squared (OLS) regression over six different event windows ranging between two days
[-1;1] and 20 days [-10;10] around the announcement date. We estimate the combined
wealth effect of the merging companies as the cumulative abnormal return (CAR) to a
value-weighted portfolio of the acquirer and target (Bradley, Desai et al. 1988). We
weight the merging firms with their respective market values of equity for day T-21
relative to the announcement date. To estimate CARs for rival companies, we create
value-weight rival portfolios (excluding acquirer and target) for the relevant primary
four-digit SIC code where bidder and target overlap.
6 Abnormal returns describe the difference between the expected return and the actual return observed in the market
15
To test for statistical significance of the cumulated abnormal returns we follow the
recommendation of Harrington and David (2007) and apply the test statistic of
Boehmer, Musumeci et al. (1991), an enhancement of the approach by Patell (1976).
The test considers the likely difference in cross-sectional return variance between the
estimation period from T-300 to T-50 and the event window. The test statistic z follows a
student t-distribution with T-2 degrees of freedom. The test results appear to be robust
also in the absence of event-induced variance increases (Serra 2004).
4. Empirical results
4.1 Univariate analysis
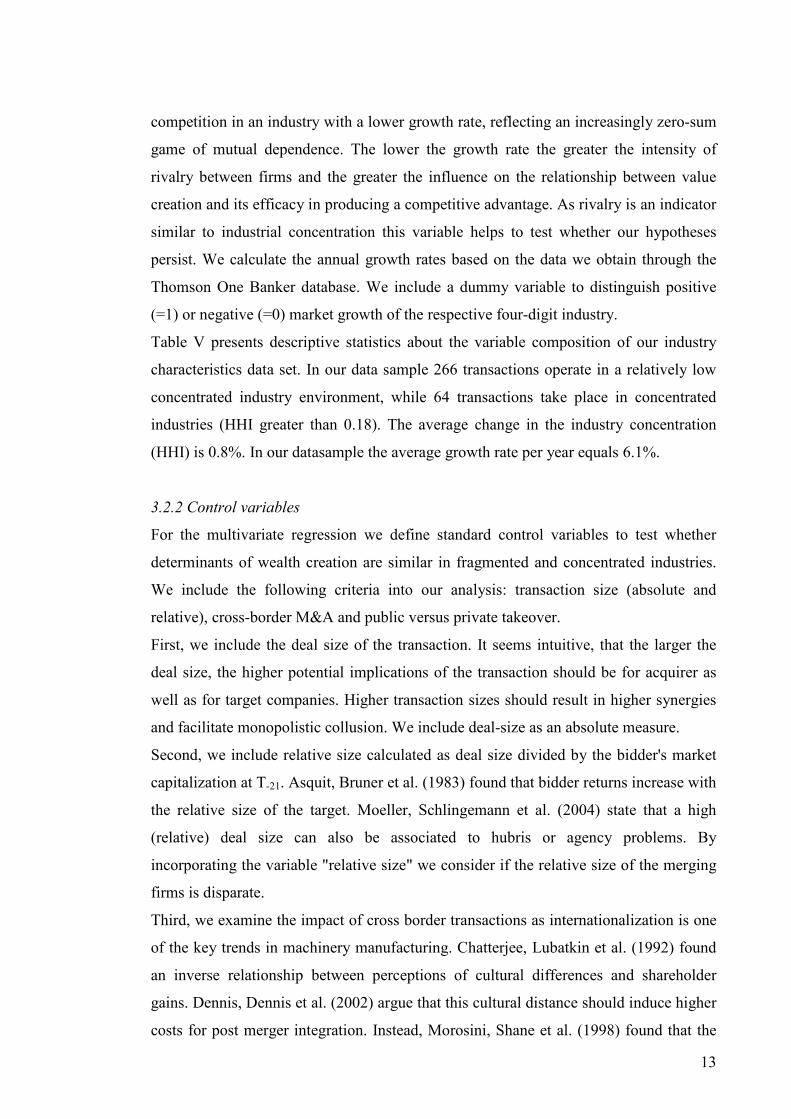
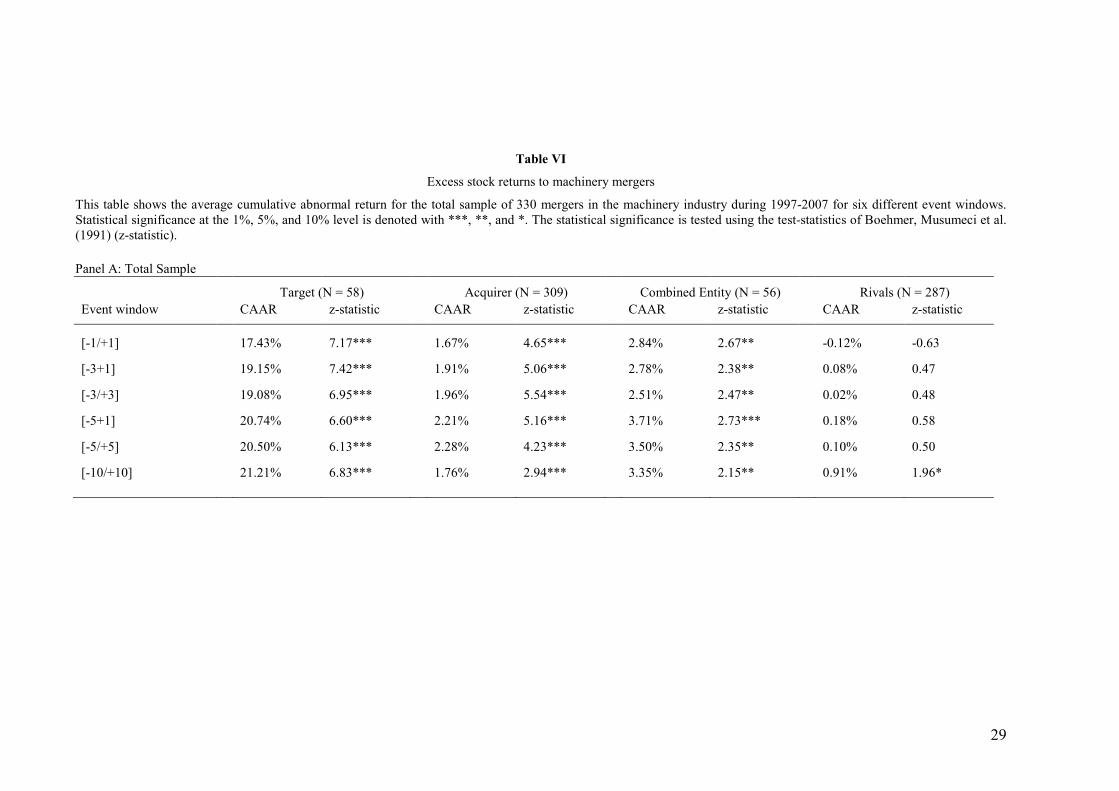
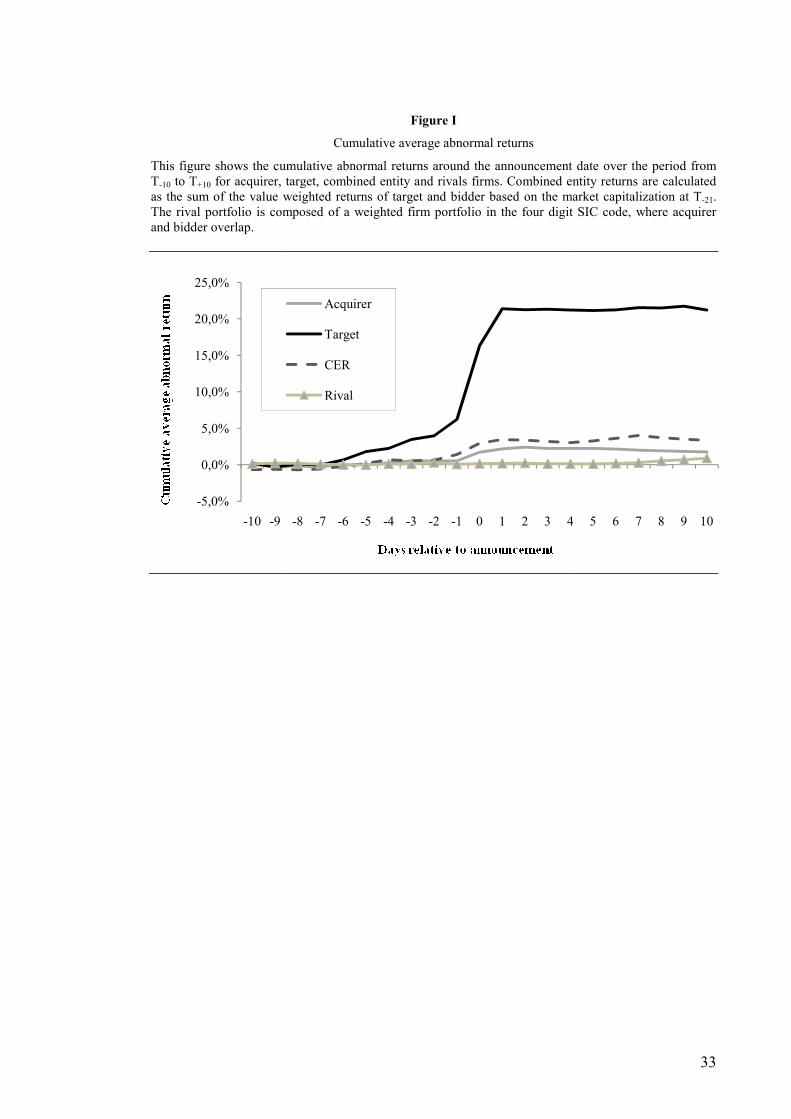
Table VI shows the abnormal stock returns for the full sample of machinery mergers.
We find that significant wealth gains accrue to both shareholders of target and bidding
firms. We observe statistically significant results for all of our six event windows with
target gains of 17.4%-21.2% while acquirer's shareholders profit between 1.7% and
2.3%. This finding strengthens the assumption that mergers in the machinery industry
are not motivated by management hubris or agency problems, but to create value for
their shareholders. This is confirmed when we examine the correlation between the
cumulative average abnormal returns between acquirer and bidder. We observe no
evidence for possible wealth transfers between target and bidder shareholders (compare
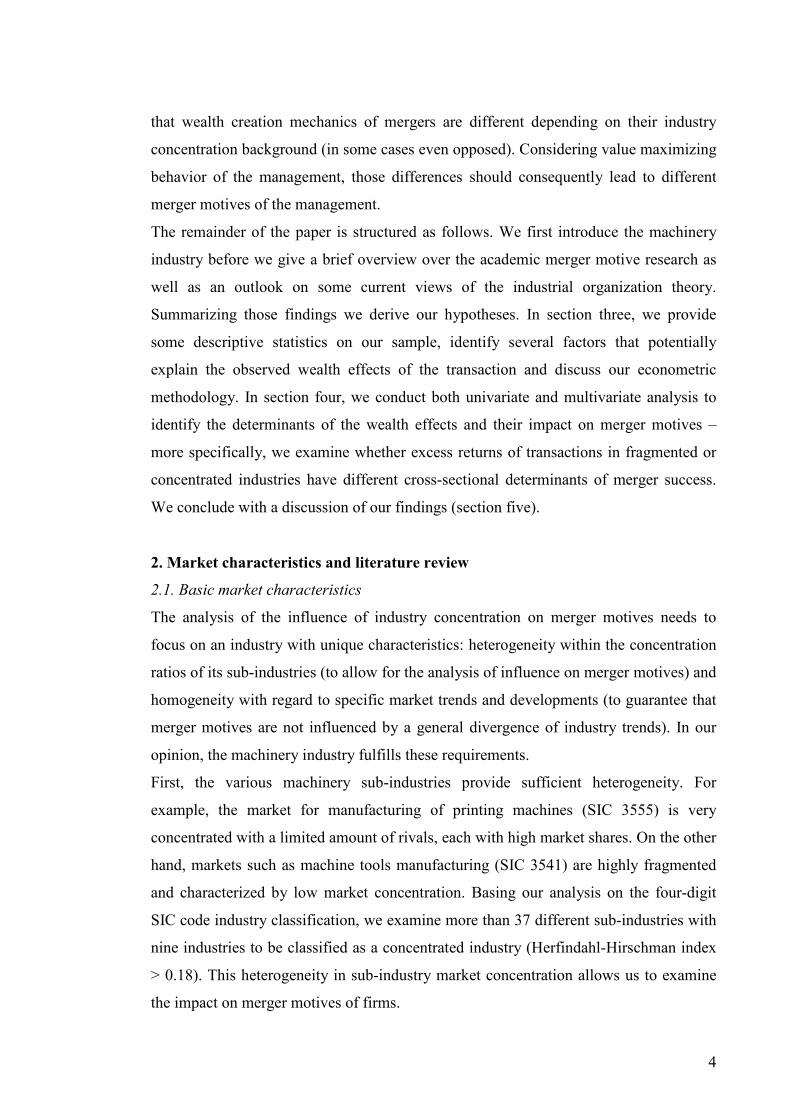
Berkovitch and Narayanan (1993)). An illustration about the dynamic development of
abnormal returns can be seen in figure I.
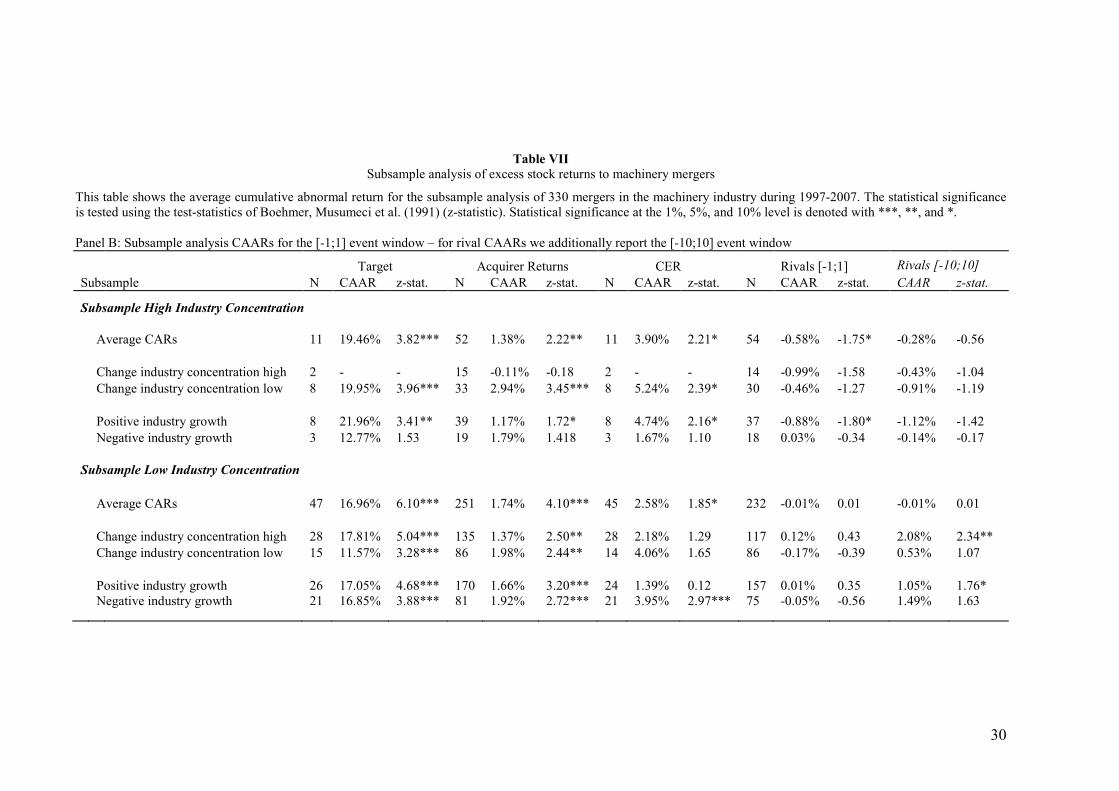
To test our hypotheses on the influence of merger motives we perform a subsample
analysis (table VII) where we observe abnormal returns in the [-1;1] event window
around the announcement date. Capital market reactions of transactions in fragmented
and highly concentrated industries indicate a general positive abnormal announcement
return for target, acquirer and combined entity shareholders. This allows us to exclude
agency or hubris theories as no wealth transfers can be detected. The results also show,
that acquirer returns are not significantly different in concentrated or fragmented
industries, sustaining the recent evidence that firm performance is negatively correlated
to industry concentration (Hou and Robinson 2006). At least in the case of merger
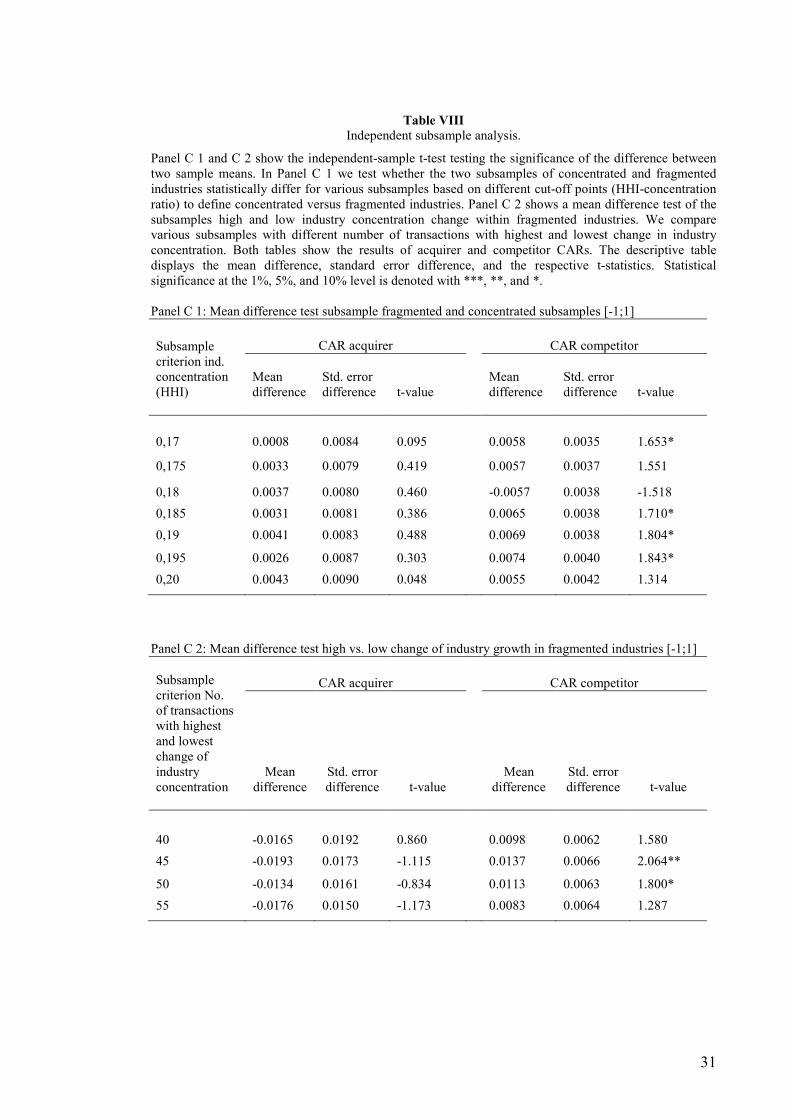
situations this finding cannot be confirmed (see table VIII). Interesting is also the
interpretation of rival reactions. Applying an independent sample t-test we observe that
the capital market reactions are statistically different for fragmented and concentrated
industries (table VIII). For concentrated industries significantly negative rival reactions
16
(-0.58% CAR) result, an indication that no competitive collusion motive prevails, as in
this case a positive market signaling should occur (compare e.g. Eckbo 1983). Our
finding is confirmed when we additionally analyze the change in industry concentration.
Examining the correlation between abnormal returns and change in industry
concentration we observe a negative correlation factor of -0.33%. As in Gosh (2004),
we take this as an indicator to reject monopolistic collusion motives for concentrated
industries. In a reverse conclusion, those finding indicate that mergers in concentrated
industries are primarily dominated by efficiency gains. This seems interesting as this
contradicts our hypothesis that primarily monopolistic collusion motives should be
expected in concentrated industries. A possible explanation could be that the
incremental utility gain through competitive collusion in already concentrated industries
is low.
To test the hypotheses on fragmented industries we divide the subsample further,
focusing on the variable change of industry concentration. Again this analysis yields
interesting results especially for rival returns. We observe that capital market reactions
significantly differ for those transactions that are accompanied by a high change of
industry concentration versus. those that are accompanied by a low change in industry
concentration (table VIII). This finding allows to find evidence for both motives,
competitive collusion and productive efficiency. First, the sample of transactions in
fragmented industries, where we observe a high change in industry concentration, seems
to be motivated by monopolistic collusion. Rival returns experience a substantial
positive signal resulting in 2.08% abnormal returns in the [-10;10] event window. This
evidence is further strengthened when we compare the correlation of the forty
transactions with the highest change in industry concentration with the rival abnormal
returns. We detect a positive correlation of 36% (Ghosh 2004), a finding that is in line
with competitive collusion motive. Second, support for the productive efficiency motive
can be found in those transactions with low change in industry concentration. We
observe negative rival returns around the announcement date and a correlation between
change of industry concentration and excess returns of 0%. Although statistical
significance is low we interpret this as inconsistent with monopolistic collusion
motives. Consequently, the results only allow to partially confirm the hypotheses we
made about merger motives in fragmented industries. Apparently, both motives
(competitive collusion and productive efficiency) exist in fragmented industries
17
(rejection of H IIa). However, the competitive collusion motive only prevails, when a
high change in market concentration can be observed (confirmation of H II b).
Summing up, our initial hypothesis that industry concentration influences merger
motives of the management finds empirical support. While in highly concentrated
industries no indication for competitive collusions exists (decreasing marginal utility),
we identify in fragmented industries both kind of motives, competitive collusion and
productive efficiency. To strengthen the observations of the univariate analysis and to
filter dilution effects we jointly examine the defined industry and control variables and
conduct a multivariate analysis in the following section.
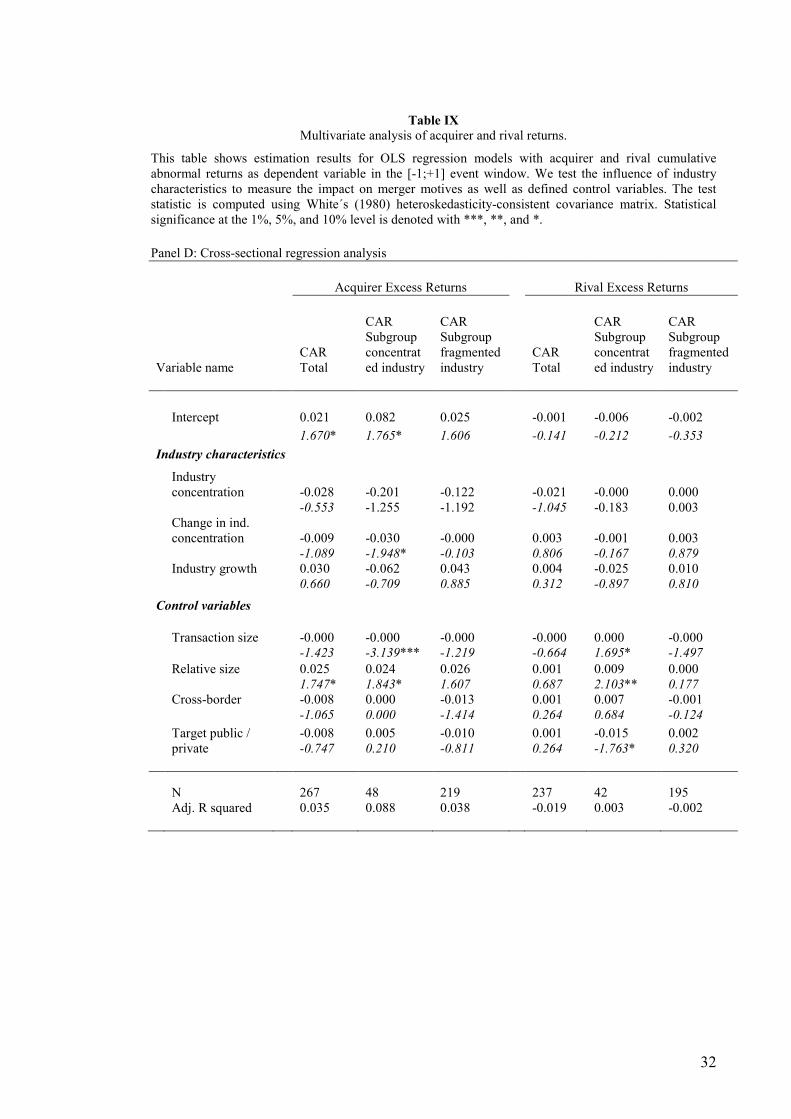
4.2 Cross-sectional regression analysis
By comparing the wealth mechanics of fragmented and concentrated industries we gain
further evidence of the influence of industry concentration on merger motives. As we
are interested in measuring the influence on merger motives and not on CARs, we need
to separately compare the wealth mechanics for transactions in fragmented and
concentrated industries. Consequently, we perform two multivariate analyses (for
fragmented and concentrated industries) of the defined variables to jointly measure the
effect on shareholder value using the cumulative abnormal return over the [-1;+1] event
window as dependent variable. We perform the cross sectional analysis for the
cumulative abnormal returns of acquirer and rivals, as those provide important insights
into wealth creation mechanism. The results are shown in table IX. We compute all test
statistics using White´s (1980) heteroskedasticity-consistent covariance matrix.
The main finding of the multivariate analysis is that wealth mechanics are different in
industries with varying industry concentration backgrounds. Comparing the regression
results of abnormal returns we observe that cause and effect relationships are not the
same for transactions in concentrated or fragmented industries, in some cases even
opposed. This is most true for rival reactions. All defined variables (with the exception
of relative size of an transactions) show opposite coefficients for mergers in
concentrated and fragmented industries. Besides its low statistical significance this
indicates, that the wealth effects on rival companies are exactly opposite. For
concentrated industries, we observe that all variables regarding industry characteristics
have a negative coefficient. That implies, the higher the industry concentration, the
change in industry concentration, or the industry growth the more "damage" is
attributed to shareholders of rival firms. Exactly the opposite relations determine wealth
18
creation in fragmented industries. The same holds true for the defined control variables
(except relative size). Apparently, strategies to interact with rivals (i.e. merger motives)
are different for companies with varying industry concentration background. But also
for acquirer returns we observe this relationship. In concentrated industries results show
a positive coefficient and relationship of acquirer abnormal returns with the variables
cross-border and target/public and a negative with industry growth (statistically not
significant). For fragmented industries, the relationships are exactly the other way
round. These findings indicate that the wealth creation mechanics are different
depending on the industry concentration level.
With regard to the interpretation on merger motives we observe a significantly negative
relationship between change in industry concentration and acquirer abnormal returns in
concentrated industries. This supports our interpretation that competitive collusion in
concentrated markets is less rewarded by capital markets than productive efficiency
motives. For transactions in fragmented industries we do not yield statistically
significant results for this variable. As we suspect both, monopolistic collusion and
productive efficiency, motives behind the transactions this confirms our univariate
results.
Regardless of the industry concentration, the (absolute) transaction size has a significant
inverse relationship (negative coefficient) with acquirer abnormal returns while the
relative transaction size has a positive relationship. If a large relative size indicates
possible synergies between target and acquirer than the results show that in both
industry environments a positive relationship between abnormal returns and possible
synergies exists. This again points the positive effect of productive efficiency gains. The
negative correlation with the (absolute) transaction size for concentrated industries can
be explained in two ways. First, as a larger target implies more integration risk,
abnormal returns are negative. However, we then would have expected a similar relation
for the relative size of the target. Second, as a larger target implies larger market share
gains we see that again monopolistic collusion is not rewarded in the case of
concentrated industries.
The public and private status influences abnormal returns of acquirer and rivals
differently in concentrated and fragmented industries. While a public target in
concentrated markets is rewarded by higher acquirer returns it harms shareholder
returns of rival companies. We again provide a risk based explanation. As firms in
concentrated industries are more prone to risk aversity (Hou and Robinson 2006) they
19
are better off acquiring targets that are publicly listed. Similar to the argument of
Helwege, Pirinsky et al. (2007), public companies imply better available information
reducing risk of integration. In fragmented industries acquirer shareholders react
negatively to a target public status. In this case, apparently risk aversity does not pay
and consequently all merger options should be evaluated by the firm management.
Summarizing, in the cross sectional regression analysis we show that the wealth
creation mechanism are different for fragmented and concentrated industries.
Considering value maximizing behavior of the management this should lead to different
merger motives in M&A situations. Furthermore, the findings regarding underlying
merger motives in concentrated and fragmented industries confirm the results of the
univariate analysis. We find additional support for our hypothesis that industry
concentration influences merger motives.
5. Summary and conclusion
Our objective in this paper is to examine the impact of industry concentration on merger
motives of companies. We investigate share price reactions to merger announcements
for a sample of 330 transactions in the machinery industry between 1997 and 2007. We
limit to machinery transactions because of its unique market characteristics
(homogeneity of general market trends and heterogeneity of industry concentration in
submarkets). Linking industry specific trends, academic research of merger motives and
industrial organization theory we derive our research hypothesis. Conducting univariate
analysis and multivariate regression we gain valuable insights into determinants of
merger motives. First, we show that merger motives in concentrated and fragmented
industries are different. We observe that competitive collusion is not a major motive for
firms in concentrated industries and that those mergers are primarily driven by
productive efficiency gains. Although this finding can be attributed to the general weak
evidence of collusive merger motives (Trautwein 1990), we find evidence that in
fragmented industries both, collusion and productive efficiency, are prevailing motives
of the firm mergers. Second, the cross sectional regression supports this finding
analyzing acquirer and rival excess returns. We show that there is a substantial
difference of wealth creation mechanics for fragmented and concentrated industries,
indicating different success factors for M&A transactions (especially the impact on rival
excess returns is exactly opposite). Assuming value maximizing behavior of the
management, those different wealth creation mechanics should lead to different merger
20
motives of the management depending on their underlying level of industry
concentration.
In conclusion, our results provide some additional perspective to the empirical analysis
of research motives of mergers. Linking industrial organization theory with the financial
research on merger motives, we argue that the analysis of merger motives will gain
additional refinement if market characteristics such as industry concentration is
considered. Our empirical analysis of the machinery industry (subsample) proves that
merger motives depend on industry concentration background. As this paper is the first
that analyzes this relationship the question how industry structure influences merger
decision remains unanswered. We believe that this field of research should be a fruitful
topic for further research.
21
Bibliography: Andrade, G., M. Mitchell, et al. (2001). "New Evidence and Perspectives on Mergers." Journal
of Economic Perspectives 15(2): 103-120.
Andrade, G. and E. Stafford (2004). "Investigating the economic role of mergers " Journal of
Corporate Finance 10(1): 1-36.
Asquit, P., R. F. Bruner, et al. (1983). "The gains to bidding firms from mergers." Journal of
Financial Economics 11(1-4): 121-139.
Azzam, M. A. (1997). "Measuring Market Power and Cost-Efficiency Effects of Industrial
Concentration." The Journal of Industrial Economics 45(4): 377-386.
Bain, S. J. (1954). "Economies of Scale, Concentration, and the Condition of Entry in Twenty
Manufacturing Industries " The American Economic Review 44(1): 15-39.
Berkovitch, E. and M. P. Narayanan (1993). " Motives for Takeovers: An Empirical
Investigation." The Journal of Financial and Quantitative Analysis 28(3): 247-263.
Boehmer, E., J. Musumeci, et al. (1991). "Event-study methodology under conditions of event-
induced variance." Journal of Financial Economics 30(2): 253-272.
Bradley, M., A. Desai, et al. (1988). "Synergistic Gains from Corporate Acquisitions and their
Division between the Stockholders of Target and Acquiring Firms." Journal of
Financial Economics 21(1): 3-40.
Capron, L. (1999). "The Long-Term Performance of Horizontal Acquisitions." Strategic
Management Journal 20(11): 987-1018.
Chatterjee, S. (1986). "Types of Synergy and Economic Value: The Impact of Acquisitions on
Merging and Rival Firms." Strategic Management Journal 7(2): 119-139.
Chatterjee, S., M. H. Lubatkin, et al. (1992). Cultural Differences and Shareholder Value in
Related Mergers: Linking Equity and Human Capital, John Wiley & Sons. 13: 319-334.
Clelland, J. I., J. T. Douglas, et al. (2006). "Testing Resource-based and Industry Factors in a
Multi-level Model of Competitive Advantage Creation " Academy of Management
Journal 5(1): 1-24.
Comment, R. and G. A. Jarrell (1995). "Corporate focus and stock returns." Journal of Financial
Economics 37(1): 67-87.
Curry, B. and K. D. George (1983). "Industrial Concentration: A Survey." Journal of Industrial
Economics 31(3): 203-255.
Demsetz, H. (1973). "Industry Structure, Market Rivalry, and Public Policy." journal of Law
and Economics 16(1): 1-9.
Dennis, D., D. Dennis, et al. (2002). "Global diversification, industrial diversification and firm
value." Journal of Finance 57(5): 1951-1979.
22
Eckbo, B. E. and P. Wier (1985). "Antimerger Policy under the Hart-Scott-Rodino Act: A
Reexamination of the Market Power Hypothesis." Journal of Law and Economics 28(1):
119-149.
Eckbo, E. B. (1983). "Horizontal Mergers, Collusion, and Stockholder Wealth." Journal of
Financial Economics 11(1-4): 241-273.
Fee, E. C. and S. Thomas (2004). "Sources of gains in horizontal mergers: evidence from
customer, supplier, and rival firms." Journal of Financial Economics 74(3): 423-460.
Fuller, K., J. Netter, et al. (2002). "What Do Returns to Acquiring Firms Tell Us? Evidence
from Firms that Make Many Acquisitions." Journal of Finance 57(4): 1763-1793.
Ghosh, A. (2004). "Increasing Market Share as a Rationale for Corporate Acquisitions." Journal
of Business Finance & Accounting 31(1-2): 209-247.
Harrington, E. S. and G. S. David (2007). "All Events Induce Variance: Analyzing Abnormal
Returns When Effects Vary across Firms." Journal of Financial & Quantitative Analysis
42(3): 229-256.
Helwege, J., C. Pirinsky, et al. (2007). "Why Do Firms Become Widely Held? An Analysis of
the Dynamics of Corporate Ownership." The Journal of Finance 62(3): 995-1028.
Hirschey, M. (1985). "Market Structure and Market Value." Journal of Business 58(1): 89-98.
Hou, K. and T. D. Robinson (2006). "Industry Concentration and Average Stock Returns."
Journal of Finance 61(4): 1927-1956.
Houston, J. F., C. M. James, et al. (2001). "Where do merger gains come from? Bank mergers
from the perspective of insiders and outsiders." Journal of Financial Economics 60(2-3):
285-331.
Knott, A. M. and P. Hart (2003). Does competition increase innovation? New evidence from old
industries. Working Paper, Mack Center for Technological Innovation.
Moeller, S. B., F. P. Schlingemann, et al. (2004). "Firm size and the gains from acquisitions."
Journal of Financial Economics 73(2): 201-228.
Morosini, P., S. Shane, et al. (1998). "National Cultural Distance and Cross-Border Acquisition
Performance." Journal of International Business Studies 29(1).
Morrison Paul, J. C. (2003). "Cost Economies: A Driving Force for Consolidation and
Concentration?" Southern Economic Journal 70(1): 110-127.
Patell, J. (1976). "Corporate Forecasts of Earnings per Share and Stock Price Behavior:
Empirical Tests." Journal of Accounting Research 14(2): 246-276.
Porter, M. E. (1987). "From Competitive Advantage to Corporate Strategy." Harvard Business
Review 65(3): 43-59.
Roll, R. (1986). "The Hubris Hypothesis of Corporate Takeovers." The Journal of Business
59(2): 197-216.
23
Rumelt, P. R. (1991). "How much does industry matter?" Strategic Management Journal 12(3):
167-185.
Schumann, L. (1993). "Patterns of Abnormal Returns and the Competitive Effects of Horizontal
Mergers." Review of Industrial Organization 8(6): 679-696.
Schumpeter, J., Ed. (1912). The Theory of Economic Development. Cambridge.
Serra, A. P. (2004). "Event Study Tests: a brief survey." Revista Electrónica de Gestao
Organizacional 2(3): 248-255.
Seyhun, H. N. (1990). "Do Bidder Managers Knowingly Pay Too Much for Target Firms?"
Journal of Business 63(4): 1439-1466.
Sharur, H. (2005). "Industry structure and horizontal takeovers: Analysis of wealth effects on
rivals, suppliers, and corporate customers." Journal of Financial Economics 76(1): 61-
98.
Slade, E. M. (2004). "Competing models of firm profitability." International Journal of
Industrial Organization 22(3): 289-308.
Stillmann, R. (1983). "Examining Antitrust Policy Towards Horizontal Mergers." Journal of
Financial Economics 11(1-4): 225-240.
Trautwein, F. (1990). "Merger Motives and Merger Prescriptions." Strategic Management
Journal 11(4): 283-295.
Walker, M. M. (2000). "Corporate Takeovers, Strategic Objectives, and Acquiring-Firm
Shareholder Wealth." Financial Management 29(1): 53-66.
Walking, R. and M. Long (1984). "Agency Theory, Managerial Welfare, and Takeover Bid
Resistance." Rand Journal of Economics 15(1): 54-68.
Weiss, L. W. (1974). The Concentration-Profits Relationship and Antitrust. Industrial
Concentration: The New Learning. . J. H. Goldschmid, H. M. Mann and J. F. Weston.
New York, Columbia University Press: 184-233.
White, H. (1980). "A heteroskedasticity-consistent covariance matrix estimator and a direct test
for heteroskedasticity." Econometrica 48: 817-838.
24
Table I Summary of forecasted CAR reactions to different merger theories
This table summarizes the implications of several merger theories on the cumulative abnormal returns on target, acquirer, combined entity and rival shareholders. It serves to interpret results from the event study analysis of machinery manufacturers.
Influence on CARs
Target Acquirer Combined Entity Rivals
Synergy/productive efficiency theory (maximization of target and acquirer gains)
Positive (bargaining power)
Positive (synergies and lower costs)
Positive (synergies and lower costs)
Unclear (positive signal vs. competitive advantage)
Monopoly theory (improved market positioning and market power)
Positive (bargaining power)
Positive (monopoly rent)
Positive (monopoly rent)
Positive1)
(market structure)
Agency theory (self interest of management)
Positive (bargaining power)
Negative (misbehavior of management)
Zero to negative Zero to positive (no competitive advantage)
Hubris theory (overvaluation of target potentials)
Positive (bargaining power)
Negative (overvaluation of synergies)
Slightly positive Zero to positive (no competitive advantage)
1) As positive rival reactions are not sufficient support for a monopolistic collusion motive we test also for a positive correlation of CARs and our variable change in industry concentration (Ghosh 2004).
25
Table II
Sample selection
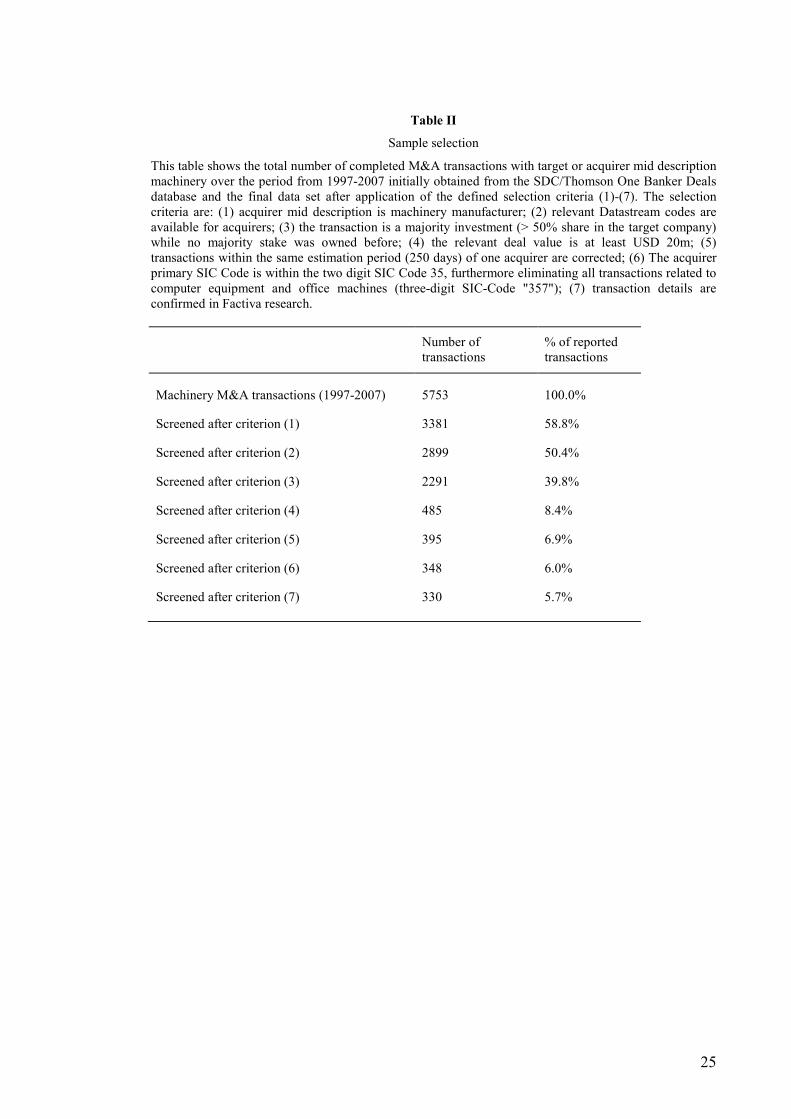
This table shows the total number of completed M&A transactions with target or acquirer mid description machinery over the period from 1997-2007 initially obtained from the SDC/Thomson One Banker Deals database and the final data set after application of the defined selection criteria (1)-(7). The selection criteria are: (1) acquirer mid description is machinery manufacturer; (2) relevant Datastream codes are available for acquirers; (3) the transaction is a majority investment (> 50% share in the target company) while no majority stake was owned before; (4) the relevant deal value is at least USD 20m; (5) transactions within the same estimation period (250 days) of one acquirer are corrected; (6) The acquirer primary SIC Code is within the two digit SIC Code 35, furthermore eliminating all transactions related to computer equipment and office machines (three-digit SIC-Code "357"); (7) transaction details are confirmed in Factiva research.
Number of transactions
% of reported transactions
Machinery M&A transactions (1997-2007) 5753 100.0%
Screened after criterion (1) 3381 58.8%
Screened after criterion (2) 2899 50.4%
Screened after criterion (3) 2291 39.8%
Screened after criterion (4) 485 8.4%
Screened after criterion (5) 395 6.9%
Screened after criterion (6) 348 6.0%
Screened after criterion (7) 330 5.7%
26
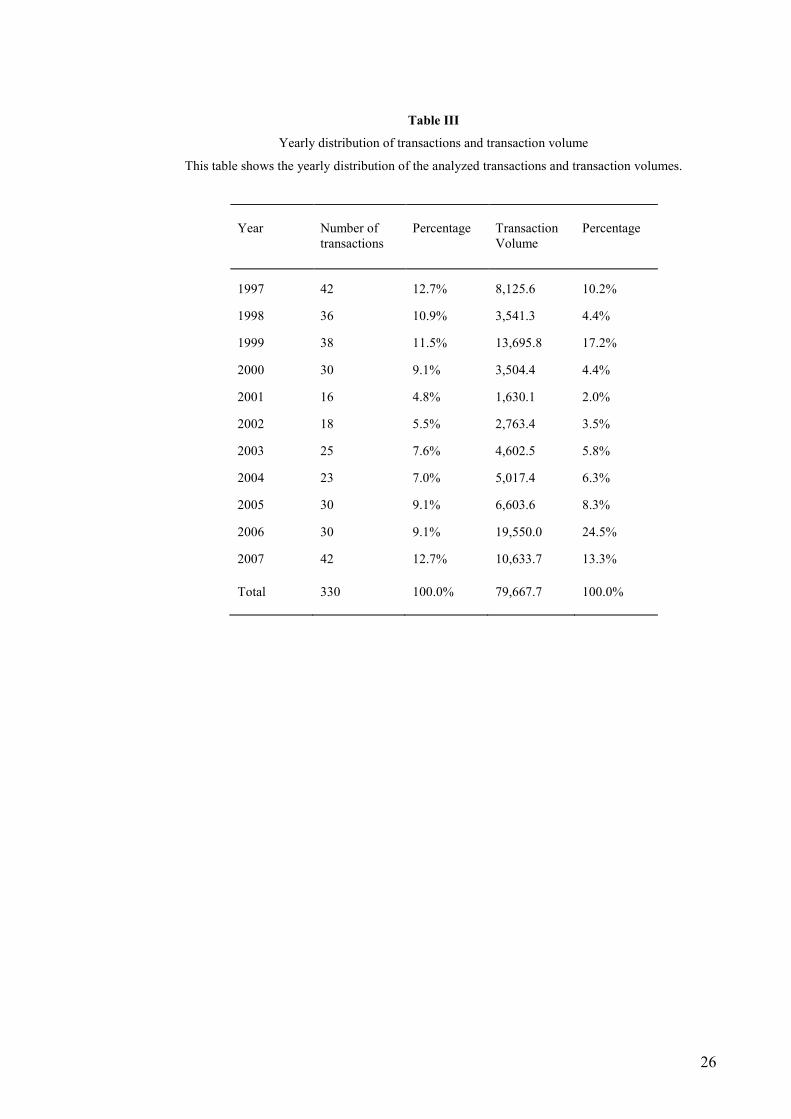
Table III
Yearly distribution of transactions and transaction volume
This table shows the yearly distribution of the analyzed transactions and transaction volumes.
Year Number of transactions
Percentage Transaction Volume
Percentage
1997 42 12.7% 8,125.6 10.2%
1998 36 10.9% 3,541.3 4.4%
1999 38 11.5% 13,695.8 17.2%
2000 30 9.1% 3,504.4 4.4%
2001 16 4.8% 1,630.1 2.0%
2002 18 5.5% 2,763.4 3.5%
2003 25 7.6% 4,602.5 5.8%
2004 23 7.0% 5,017.4 6.3%
2005 30 9.1% 6,603.6 8.3%
2006 30 9.1% 19,550.0 24.5%
2007 42 12.7% 10,633.7 13.3% Total 330 100.0% 79,667.7 100.0%
27
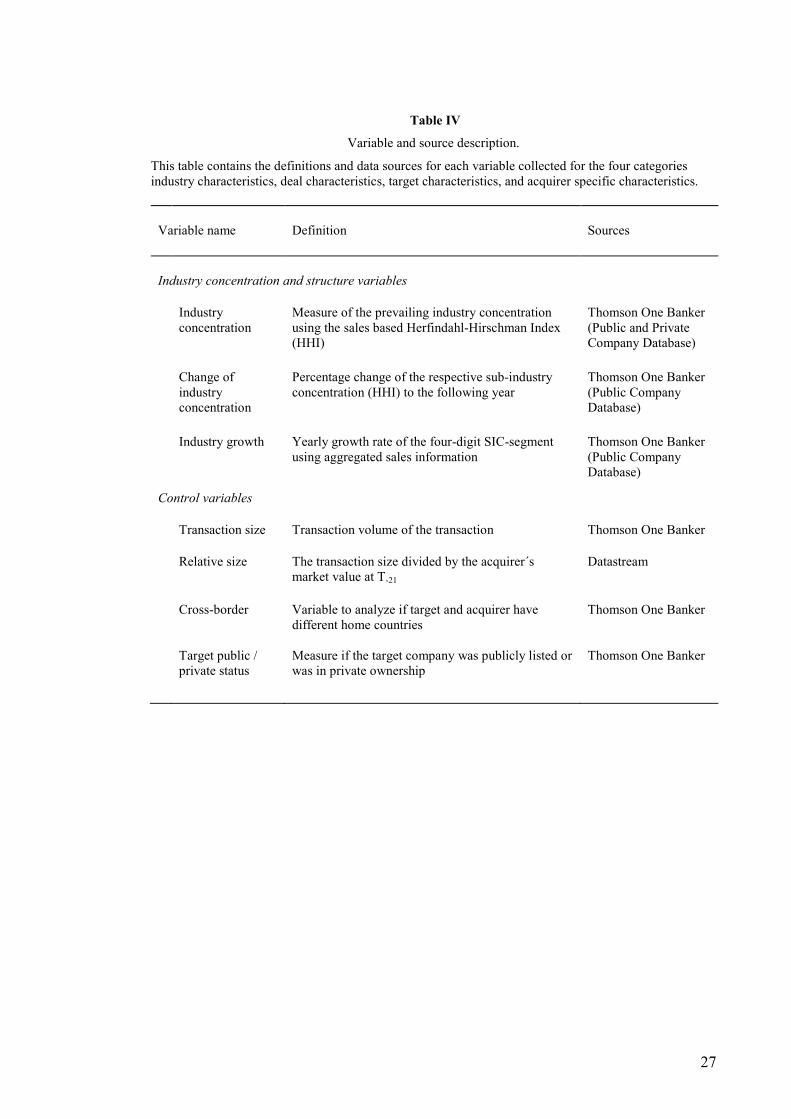
Table IV
Variable and source description.
This table contains the definitions and data sources for each variable collected for the four categories industry characteristics, deal characteristics, target characteristics, and acquirer specific characteristics.
Variable name Definition Sources
Industry concentration and structure variables
Industry concentration
Measure of the prevailing industry concentration using the sales based Herfindahl-Hirschman Index (HHI)
Thomson One Banker (Public and Private Company Database)
Change of industry concentration
Percentage change of the respective sub-industry concentration (HHI) to the following year
Thomson One Banker (Public Company Database)
Industry growth Yearly growth rate of the four-digit SIC-segment
using aggregated sales information Thomson One Banker (Public Company Database)
Control variables
Transaction size Transaction volume of the transaction Thomson One Banker
Relative size The transaction size divided by the acquirer´s market value at T-21
Datastream
Cross-border Variable to analyze if target and acquirer have
different home countries Thomson One Banker
Target public / private status
Measure if the target company was publicly listed or was in private ownership
Thomson One Banker
28
Table V Description of continuous and binary variables.
This table describes the data collected for the description of industry characteristics and control variable characteristics. Proportions are reported for binary variables. Mean, median, standard deviation, minimum and maximum are reported for continuous variables. A description of the individual variables and the respective data sources is contained in table IV.
Variable name N Propor-tion
Mean Median Stdev. Mini-mum
Maxi-mum
Industry characteristics
Ind. concentr. high 64 19.4% - - - - - Ind. concentr. low 266 80.6% - - - - -
Change of ind. concentration
288 - 0.8% 2.1%
12.4% -47.1% 60.0%
Industry growth 330 - 6.1% 5.2% 15.0% -77.1% 112.4%
Control variable characteristics
Transaction size 330 - 241.4 68.2 903.8 20.0 14,051.7
Relative size 317 - 32.5% 11.9% 72.6% 0.2% 861.1%
Cross-border 144 43.6% - - - - - National 186 56.4% - - - - -
Target public 58 17.6% - - - - - Target private 272 82.4% - - - - -
29
Table VI
Excess stock returns to machinery mergers
This table shows the average cumulative abnormal return for the total sample of 330 mergers in the machinery industry during 1997-2007 for six different event windows.Statistical significance at the 1%, 5%, and 10% level is denoted with ***, **, and *. The statistical significance is tested using the test-statistics of Boehmer, Musumeci et al.(1991) (z-statistic).
Panel A: Total Sample
Target (N = 58) Acquirer (N = 309) Combined Entity (N = 56) Rivals (N = 287)Event window CAAR z-statistic CAAR z-statistic CAAR z-statistic CAAR z-statistic
[-1/+1] 17.43% 7.17*** 1.67% 4.65*** 2.84% 2.67** -0.12% -0.63
[-3+1] 19.15% 7.42*** 1.91% 5.06*** 2.78% 2.38** 0.08% 0.47
[-3/+3] 19.08% 6.95*** 1.96% 5.54*** 2.51% 2.47** 0.02% 0.48
[-5+1] 20.74% 6.60*** 2.21% 5.16*** 3.71% 2.73*** 0.18% 0.58
[-5/+5] 20.50% 6.13*** 2.28% 4.23*** 3.50% 2.35** 0.10% 0.50
[-10/+10] 21.21% 6.83*** 1.76% 2.94*** 3.35% 2.15** 0.91% 1.96*
30
Table VIISubsample analysis of excess stock returns to machinery mergers
This table shows the average cumulative abnormal return for the subsample analysis of 330 mergers in the machinery industry during 1997-2007. The statistical significanceis tested using the test-statistics of Boehmer, Musumeci et al. (1991) (z-statistic). Statistical significance at the 1%, 5%, and 10% level is denoted with ***, **, and *.
Panel B: Subsample analysis CAARs for the [-1;1] event window – for rival CAARs we additionally report the [-10;10] event window
Target Acquirer Returns CER Rivals [-1;1] Rivals [-10;10]Subsample N CAAR z-stat. N CAAR z-stat. N CAAR z-stat. N CAAR z-stat. CAAR z-stat.
Subsample High Industry Concentration
Average CARs 11 19.46% 3.82*** 52 1.38% 2.22** 11 3.90% 2.21* 54 -0.58% -1.75* -0.28% -0.56
Change industry concentration high 2 - - 15 -0.11% -0.18 2 - - 14 -0.99% -1.58 -0.43% -1.04Change industry concentration low 8 19.95% 3.96*** 33 2.94% 3.45*** 8 5.24% 2.39* 30 -0.46% -1.27 -0.91% -1.19
Positive industry growth 8 21.96% 3.41** 39 1.17% 1.72* 8 4.74% 2.16* 37 -0.88% -1.80* -1.12% -1.42Negative industry growth 3 12.77% 1.53 19 1.79% 1.418 3 1.67% 1.10 18 0.03% -0.34 -0.14% -0.17
Subsample Low Industry Concentration
Average CARs 47 16.96% 6.10*** 251 1.74% 4.10*** 45 2.58% 1.85* 232 -0.01% 0.01 -0.01% 0.01
Change industry concentration high 28 17.81% 5.04*** 135 1.37% 2.50** 28 2.18% 1.29 117 0.12% 0.43 2.08% 2.34**Change industry concentration low 15 11.57% 3.28*** 86 1.98% 2.44** 14 4.06% 1.65 86 -0.17% -0.39 0.53% 1.07
Positive industry growth 26 17.05% 4.68*** 170 1.66% 3.20*** 24 1.39% 0.12 157 0.01% 0.35 1.05% 1.76*Negative industry growth 21 16.85% 3.88*** 81 1.92% 2.72*** 21 3.95% 2.97*** 75 -0.05% -0.56 1.49% 1.63
31
Table VIII Independent subsample analysis.
Panel C 1 and C 2 show the independent-sample t-test testing the significance of the difference between two sample means. In Panel C 1 we test whether the two subsamples of concentrated and fragmented industries statistically differ for various subsamples based on different cut-off points (HHI-concentration ratio) to define concentrated versus fragmented industries. Panel C 2 shows a mean difference test of the subsamples high and low industry concentration change within fragmented industries. We compare various subsamples with different number of transactions with highest and lowest change in industry concentration. Both tables show the results of acquirer and competitor CARs. The descriptive table displays the mean difference, standard error difference, and the respective t-statistics. Statistical significance at the 1%, 5%, and 10% level is denoted with ***, **, and *. Panel C 1: Mean difference test subsample fragmented and concentrated subsamples [-1;1] Subsample criterion ind. concentration (HHI)
CAR acquirer CAR competitor Mean difference
Std. error difference t-value
Mean difference
Std. error difference t-value
0,17 0.0008 0.0084 0.095 0.0058 0.0035 1.653*
0,175 0.0033 0.0079 0.419 0.0057 0.0037 1.551
0,18 0.0037 0.0080 0.460 -0.0057 0.0038 -1.518
0,185 0.0031 0.0081 0.386 0.0065 0.0038 1.710*
0,19 0.0041 0.0083 0.488 0.0069 0.0038 1.804*
0,195 0.0026 0.0087 0.303 0.0074 0.0040 1.843*
0,20 0.0043 0.0090 0.048 0.0055 0.0042 1.314
Panel C 2: Mean difference test high vs. low change of industry growth in fragmented industries [-1;1] Subsample criterion No. of transactions with highest and lowest change of industry concentration
CAR acquirer CAR competitor
Mean difference
Std. error difference t-value
Mean difference
Std. error difference t-value
40 -0.0165 0.0192 0.860 0.0098 0.0062 1.580
45 -0.0193 0.0173 -1.115 0.0137 0.0066 2.064**
50 -0.0134 0.0161 -0.834 0.0113 0.0063 1.800*
55 -0.0176 0.0150 -1.173 0.0083 0.0064 1.287
32
Table IX Multivariate analysis of acquirer and rival returns.
This table shows estimation results for OLS regression models with acquirer and rival cumulative abnormal returns as dependent variable in the [-1;+1] event window. We test the influence of industry characteristics to measure the impact on merger motives as well as defined control variables. The test statistic is computed using White´s (1980) heteroskedasticity-consistent covariance matrix. Statistical significance at the 1%, 5%, and 10% level is denoted with ***, **, and *. Panel D: Cross-sectional regression analysis
Acquirer Excess Returns Rival Excess Returns
Variable name CAR Total
CAR Subgroup concentrated industry
CAR Subgroup fragmented industry
CAR Total
CAR Subgroup concentrated industry
CAR Subgroup fragmented industry
Intercept 0.021 0.082 0.025 -0.001 -0.006 -0.002 1.670* 1.765* 1.606 -0.141 -0.212 -0.353 Industry characteristics
Industry concentration -0.028 -0.201 -0.122 -0.021 -0.000 0.000
-0.553 -1.255 -1.192 -1.045 -0.183 0.003
Change in ind. concentration -0.009 -0.030 -0.000 0.003 -0.001 0.003
-1.089 -1.948* -0.103 0.806 -0.167 0.879 Industry growth 0.030 -0.062 0.043 0.004 -0.025 0.010 0.660 -0.709 0.885 0.312 -0.897 0.810 Control variables
Transaction size -0.000 -0.000 -0.000 -0.000 0.000 -0.000 -1.423 -3.139*** -1.219 -0.664 1.695* -1.497 Relative size 0.025 0.024 0.026 0.001 0.009 0.000 1.747* 1.843* 1.607 0.687 2.103** 0.177 Cross-border -0.008 0.000 -0.013 0.001 0.007 -0.001 -1.065 0.000 -1.414 0.264 0.684 -0.124 Target public /
private -0.008 0.005 -0.010 0.001 -0.015 0.002
-0.747 0.210 -0.811 0.264 -1.763* 0.320
N 267 48 219 237 42 195 Adj. R squared 0.035 0.088 0.038 -0.019 0.003 -0.002
This figure shows the cumulative abnormal returns around the T-10 to T+10 for acquirer, tas the sum of the value weighted returns of target and bidThe rival portfolio is composed of a weighted firm portfolio in the four digit SIC code, where acquirer and bidder overlap.
-5,0%
0,0%
5,0%
10,0%
15,0%
20,0%
25,0%
-10 -9
Figure I
Cumulative average abnormal returns
mulative abnormal returns around the announcementtarget, combined entity and rivals firms. Combined entity returns are calculated weighted returns of target and bidder based on the market capitalization at Tmposed of a weighted firm portfolio in the four digit SIC code, where acquirer
-8 -7 -6 -5 -4 -3 -2 -1 0 1 2 3 4
Acquirer
Target
CER
Rival
33
date over the period from ntity returns are calculated
market capitalization at T-21.t SIC code, where acquirer
4 5 6 7 8 9 10
Recommended