Purdue UniversityPurdue e-Pubs
Open Access Theses Theses and Dissertations
2013
The Impact of Availability of Vegetarian MenuItems on Consumers' Behavioral IntentionMengwei YuePurdue University
Follow this and additional works at: https://docs.lib.purdue.edu/open_access_theses
Part of the Advertising and Promotion Management Commons, Business Administration,Management, and Operations Commons, Management Sciences and Quantitative MethodsCommons, and the Marketing Commons
This document has been made available through Purdue e-Pubs, a service of the Purdue University Libraries. Please contact [email protected] foradditional information.
Recommended CitationYue, Mengwei, "The Impact of Availability of Vegetarian Menu Items on Consumers' Behavioral Intention" (2013). Open Access Theses.110.https://docs.lib.purdue.edu/open_access_theses/110

Graduate School ETD Form 9 (Revised 12/07)
PURDUE UNIVERSITY GRADUATE SCHOOL
Thesis/Dissertation Acceptance
This is to certify that the thesis/dissertation prepared
By
Entitled
For the degree of
Is approved by the final examining committee:
Chair
To the best of my knowledge and as understood by the student in the Research Integrity and Copyright Disclaimer (Graduate School Form 20), this thesis/dissertation adheres to the provisions of Purdue University’s “Policy on Integrity in Research” and the use of copyrighted material.
Approved by Major Professor(s): ____________________________________
____________________________________
Approved by: Head of the Graduate Program Date
Mengwei Yue
The Impact of Availability of Vegetarian Menu Items on Consumers' Behavioral Intention
Master of Science
Douglas C. Nelson
Barbara A. Almanza
Chun-Hung Tang
Douglas C. Nelson
Barbara A. Almanza 10/10/2013

i
i
THE IMPACT OF AVAILABILITY OF VEGETARIAN MENU ITEMS ON
CONSUMERS‟ BEHAVIORAL INTENTION
A Thesis
Submitted to the Faculty
of
Purdue University
by
Mengwei Yue
In Partial Fulfillment of the
Requirements for the Degree
of
Master of Science
December 2013
Purdue University
West Lafayette, Indiana

ii
ii
致我已在天堂的最爱的母亲
和给予我无私关怀的男友李智仁
以及普渡大学 11级旅游酒店管理系全体同学

iii
iii
ACKNOWLEDGEMENTS
This research project won‟t have been possible without the support and help of many
people.
The success of my academic journey is due to the love and encouragement of my dearest
mother Yihong. If it weren‟t for her loving consideration and great confidence in me
through these years without a word of complaint, I don‟t think I would be who I am today.
Although she left me and rested in peace forever, I will always remember everything she
had taught me and love her forever. My boyfriend, Brian li, I really appreciate for his
love and support since the beginning of my graduate life and his accompany during my
hardest time.
I would like to express my gratuity to my committee: Dr. Nelson, Dr. Almanza and Dr.
Tang. My sincere and deepest gratitude goes first and foremost to my chair thesis
instructor, Dr. Nelson, for his wisdom, patience and encouragement kept through my long
journey. His generous encouragement and illuminating guidance help walking my
through all the stages of accomplishing this thesis. His passionate attitude and humorous
lifestyle will continuously influence my future career path and personal life. Dr. Almanza

iv
iv
and Dr. Tang also supported and assisted me through the thesis process by their
remarkable insights and valuable input.
Thought out this education process, I have been richly rewarded to meet a number of
friends. I owe heartfelt acknowledgements to my dearest friends Zhuoyang Li, Jiaqi Zhu,
Menglu Gao, Jiejing Ding and Li Ge for sharing the invaluable assistance during data
collection process. Additionally, I would like to thank Effie Zhang and Wenyu Zou for
providing accommodation and delicious meals during the final period of my thesis.
Finally, I am very grateful for the people I met in the last two years. All of them made my
graduate life a valuable and unforgettable experience in my life.

v
v
TABLE OF CONTENTS
Page
LIST OF TABLES ....................................................................................................... vii
LIST OF FIGURES ..................................................................................................... viii
ABSTRACT .......................................................................................................... ix
CHAPTER 1. INTRODUCTION ...............................................................................1
1.1 The Restaurant Industry and Increasing Weight-Related Health Issues.... 1
1.2 Vegetarian Group, Vegetarian Diets and Benefits ................................... 2
1.3 Menu Labeling and Vegetarian-Friendly Menus ..................................... 4
CHAPTER 2. LITERATURE REVIEW ....................................................................7
2.1 Overweight, Obesity and Health Concerns .............................................. 8
2.2 Vegetarian Trend and Benefits ................................................................ 9
2.3 Vegetarian-Friendly Menus .................................................................. 16
2.4 Factors that Influence Consumers‟ Food Choices and Menu Labels ...... 17
2.5 Theory of Planned Behavior ................................................................. 21
2.6 Research Questions and Hypotheses ..................................................... 26
CHAPTER 3. METHODOLOGY ............................................................................ 28
3.1 Instrument Design................................................................................. 28
3.2 Data Collection ..................................................................................... 32
3.3 Data Analysis ....................................................................................... 33
CHAPTER 4. RESULTS ......................................................................................... 35
4.1 Demographics of the Sample ................................................................ 35
4.2 Consumers‟ Beliefs in Vegetarian Diets ................................................ 38
4.3 Preliminary Analysis............................................................................. 39
4.4 Effects of Availability of Vegetarian Items on Behavioral Intention ...... 41

vi
vi
Page
4.5 Theory of Planned Behavior Model Test ............................................... 43
4.5.1 Attitude and Behavioral Beliefs ...................................................... 44
4.5.2 Subjective Norms and Normative Beliefs ....................................... 47
4.5.3 Perceived Behavior Control and Control Beliefs ............................ 48
4.5.4 Intention..…………...……………………………………………...49
4.5.5 Hypotheses Testing ........................................................................ 51
4.6 Significant Relationship: Demographic and Variables ........................... 52
4.6.1 Gender and Intention ...................................................................... 52
4.6.2 Age and Attitude ............................................................................ 54
CHAPTER 5. CONCLUSION ................................................................................. 56
5.1 Results of the Research Questions......................................................... 56
5.2 Implication and Application .................................................................. 64
5.3 Limitation ............................................................................................. 67
5.4 Suggestions for Future Research ........................................................... 70
REFERENCES .......................................................................................................... 73
APPENDICES
Appendix A Introduction for Participants .................................................................. 83
Appendix B Menu 1 (Non-Vegetarian Items)............................................................. 85
Appendix C Menu 2 (20% Vegetarian Items) ............................................................ 86
Appendix D Menu 3 (80% Vegetarian Items) ............................................................ 87
Appendix E Questionnaire ......................................................................................... 88

vii
vii
LIST OF TABLES
Table ......................................................................................................................... Page
Table 4.1 Sample Demographic ..................................................................................... 37
Table 4.2 Participants‟ Beliefs in Vegetarian Diets ........................................................ 39
Table 4.3 Cronbach‟s Alpha of Each Factor ................................................................... 41
Table 4.4 Means and Standard Deviations of Variables among Three Menus ................ 43
Table 4.5 Linear Regressions of Behavioral Beliefs on Attitude ..................................... 45
Table 4.6 Comparison among Components of Attitude .................................................. 46
Table 4.7 Means and Standard Deviations of Factors of Behavioral Beliefs ................... 47
Table 4.8 Linear Regression of Normative Beliefs on Subjective Norms........................ 48
Table 4.9 Summary of Linear Regression Analysis of Control Beliefs on Perceived
Behavioral Control ........................................................................................ 49
Table 4.10 Linear Regression of Attitude, Subjective Norms, Perceived Behavioral
Control and Past Behavior on Intention ......................................................... 51
Table 4.11 Hypotheses Testing Results .......................................................................... 52
Table 4.12 The Influence of Gender on Respondents‟ Dining Intentions for Three Menus
...................................................................................................................... 54
Table 4.13 The Effects of Age on Attitude for Three Menus .......................................... 55

viii
viii
LIST OF FIGURES
Figure ........................................................................................................................ Page
Figure 1. Framework and Hypotheses. ........................................................................... 26

ix
ix
ABSTRACT
Yue, Mengwei. M.S., Purdue University, December, 2013. The Impact of Availability of
Vegetarian Menu Items on Consumers' Behavioral Intention. Major Professor: Douglas C.
Nelson.
The purpose of this study is to find out how the availability of vegetarian menu items
affects customers‟ behavioral intention using the theory of planned behavior and the
impact vegetarian-friendly menus have on vegetarian as well as non-vegetarian customers
when they make their restaurant selections. This paper also discussed the implications for
a vegetarian lifestyle on the food service industry and menu development in restaurants.
Seven hypotheses related to the relationship among attitudes, subjective norms, perceived
behavioral control, past behavior and dining intention were tested. Participants were
asked to fill out a survey based on three menus with no vegetarian items, 20% vegetarian
items and 80% vegetarian items. Two hundreds and twenty-eight surveys were completed
and collected in the atrium of Marriott Hall on the West Lafayette campus of Purdue
University using 4 iPads between June 18th
and Jun 30th in 2013. The gathered data were
tested by several statistical analyses such as descriptive, t-test, simple linear regression,
multiple linear regression, one-way ANOVA analysis and Tukey-Kramer comparison.
Perceived behavioral control was not a significant predictor for consumers‟ dining

x
x
intention from this study. The impact of the number of vegetarian items on restaurants‟
menus was supported in this research by a comparison of the different percentages of
vegetarian menu items. The results indicate that consumers perceived that the menu with
a majority of vegetarian items was significantly healthier compared with the menu of no
or few vegetarian items. Even though no significant differences in consumers‟ dining
intention were discovered among menus, descriptive data of consumers‟ dining intention
showed the appropriate percentage of vegetarian items on restaurants‟ menus is between
20% and 80%. In addition, among all demographic factors, gender and age appeared to
be significantly related to consumers‟ intention of dining in restaurants with more
vegetarian menu items. Female consumers who are 60 and older are more interested in
menus with more vegetarian items, consumers who often go out to eat and more often to
spend more than $12 per meal are more willing to dine in the restaurant with a lot of
vegetarian items on its menu. Based on these results, restaurants may wish to adjust their
menu design strategies to provide a few more vegetarian options. These actions should
prove mutually beneficial to restaurants and consumers by providing customers the
opportunity to make wiser choices while building a healthier, more reliable and
responsible image for the restaurants.

1
1
CHAPTER 1. INTRODUCTION
1.1 The Restaurant Industry and Increasing Weight-Related Health Issues
The restaurant industry with its large number of small businesses creates a huge
impact on the economy of the United States. With a sales projection of $632 billion
in 2012, the industry accounted for four percent of the U.S. gross domestic product
(National Restaurant Association, 2012). Dining out has become one of the most
important parts of many people‟s daily lives. People can choose from a variety of
restaurants and these choices span the range from quick-service restaurants to luxury
five star operations.
At the same time, obesity has become a serious health concern for many people
leading to the rising appeal of healthy food. The incidence of overweight and obesity
has increased throughout the world and the food service industry has been implicated
if not blamed entirely for this situation (Edwards, Engström, & Hartwell, 2005).
More than one-third of U.S. adults (35.7 percent) are obese. Many chronic diseases,
such as type 2 diabetes, some types of heart diseases and cancers are highly related to
overweight and obesity (World Health Organization, 2012). Excessive weight issues
contribute to the death of more than 2.8 million adults each year, and have become
one of the major mortality risk factors globally (World Health Organization, 2012).

2
2
Several studies have identified an association between the increase in food eaten away
from home, overconsumption and the prevalent causes of overweight and obesity
(Diliberti, Bordi, & Conklin, 2004; Lachat et al., 2012). Restaurants often serve large
portion sizes, which significantly increases customers‟ energy intake. They usually
contain more calories, saturated fat, cholesterol, and sodium but less vitamins, minerals
and other micronutrients compared with home-cooked food (Diliberti et al., 2004;
Guthrie, Lin, & Frazao, 2002; Lachat et al., 2012).
1.2 Vegetarian Group, Vegetarian Diets and Benefits
Vegetarian diets have been shown to be beneficial in combating the overweight and
obesity situation (American Dietetic Association Report, 2009). Even people not making
major shifts in their diets are becoming aware of these benefits. Vegetarian diets are often
associated with a number of health advantages, including lower blood cholesterol levels,
higher blood alkalinity, lower blood pressure levels and lower risk of hypertension and
type 2 diabetes. Vegetarians also tend to have a lower body mass index (BMI) and lower
overall cancer rates (American Dietetic Association Report, 2009). More and more
people are becoming aware of how standard American fare not only hurts our health but
also harms the environment and encourages cruelty to animals (Hirschler, 2008).
The Vegetarian Resource Group (VRG) has been polling adults periodically since 1994
to establish the number of true vegetarians; those individuals who do not eat meat,
poultry, or fish. VRG only classifies those who say they never eat these products as true
vegetarians. However, many other people who consider themselves vegetarian may

3
3
occasionally consume meat, poultry, or fish. From the VRG survey in 2009, 3.4 percent
of the U.S. adult population claims to be strict vegetarians, which equates to
approximately 7.5 million adults. The vegetarian segment has the potential to grow.
Cultivate Research found that seven percent of respondents claimed they were willing to
give up meat (all forms) entirely (Vegetarian Consumer Trends Report, 2005).
“Veganism is moving from marginal to mainstream in the United States” (Hill, 2011).
Vegetarianism can be adopted for different reasons. Health is the leading driver for
vegetarian food consumption among non-vegetarians. Cultivate Research found that "the
primary reasons noted for decline in meat consumption were due to the desire to attain a
healthier diet, to reduce fat and cholesterol, and to lose weight” (Vegetarian Consumer
Trends Report, 2005). Almost three-quarters, 73 percent, of semi-vegetarians who
reduced their meat consumption over the last year considered one of those three reasons
to be the primary reason for their decision. Another reason for avoiding meat
consumption is out of respect for sentient life. Such ethical motivations have been
codified under various religious beliefs and by animal rights organizations. Other
motivations for vegetarianism are political, environmental, cultural, aesthetic or
economic (Meng, 2009).
Even among vegetarians there are varieties of the diet: an ovo-vegetarian diet includes
eggs but not dairy products, a lacto-vegetarian diet includes dairy products but not eggs,
and an ovo-lacto vegetarian diet includes both eggs and dairy products. A vegan, or strict

4
4
vegetarian diet excludes all animal products, including eggs, dairy, beeswax and honey.
Vegans also avoid animal products such as leather for clothing and goose-fat for shoe
polish. Semi-vegetarians are people who avoid eating red meat, but they eat milk and
dairy products, fish and poultry. They eat a largely meatless diet but are not completely
vegetarian (American Dietetic Association, 2009).
Vegetarians are usually able to put together a relative satisfying meal in some restaurants,
but the variety and quality of the selections are limited (Cobe, 2003). This situation has
improved in the last few years. The U.S. market for processed vegetarian foods (foods
like meat analogs, nondairy milks, and vegetarian entrees that directly replace meat or
other animal products) was estimated to be $1.17 billion in 2006 (Mintel International
Group Limited, 2007). People‟s health concerns have led many restaurants to offer a
greater diversity and quality of non-meat options in their menu (Yee, 2004). A survey of
chefs found that vegetarian dishes were considered “hot” or “a perennial favorite” by 71%
of survey participants and vegan dishes by 63%. Fast-food restaurants are beginning to
offer salads, veggie burgers, and other meatless options. Most university foodservices
offer vegetarian options (American Dietetic Association Report, 2009). While the
industry appears to responding to the new food service trend, research about vegetarian
items, menus or restaurants is very limited.
1.3 Menu Labeling and Vegetarian-Friendly Menus
Menu planning and development are of primary importance in food service operations as
the menu is the cornerstone upon which every successful restaurant is built. A menu is
5
5
simply defined as "a list of the foods and beverages available for purchase" (Labensky,
Ingramet, & Labensky 2001). Mill (2001) viewed the menu as both "a contract with the
customer" specifying what will be served, and as a marketing tool for the establishment.
Antun and Gustafson (2005) noted that the menu drives purchasing, hiring, and
profitability. Encompassing all these aspects, the menu is an expression of the positioning
and overall marketing plan of the operation (Frei, 1995; Shock, Bowen, & Stefanelli,
2004). A useful approach is one in which menu offerings are driven by target market
consumer preferences (Kivela, 2003; Miner, 1996).
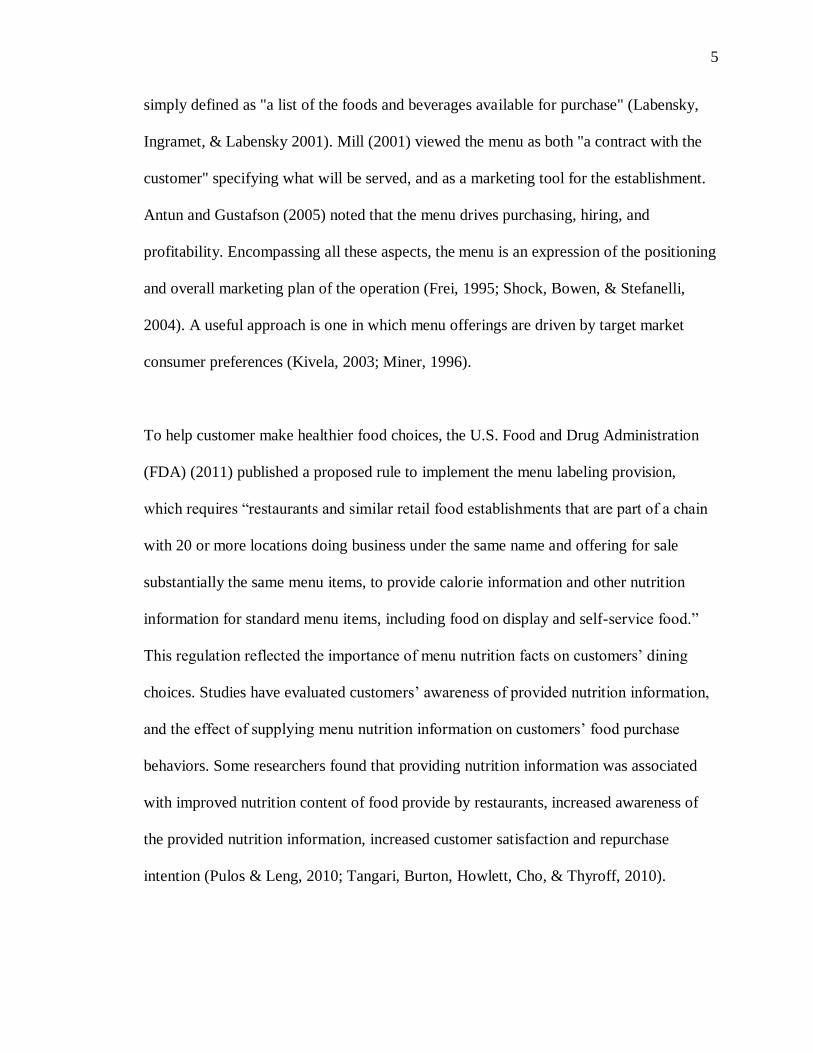
To help customer make healthier food choices, the U.S. Food and Drug Administration
(FDA) (2011) published a proposed rule to implement the menu labeling provision,
which requires “restaurants and similar retail food establishments that are part of a chain
with 20 or more locations doing business under the same name and offering for sale
substantially the same menu items, to provide calorie information and other nutrition
information for standard menu items, including food on display and self-service food.”
This regulation reflected the importance of menu nutrition facts on customers‟ dining
choices. Studies have evaluated customers‟ awareness of provided nutrition information,
and the effect of supplying menu nutrition information on customers‟ food purchase
behaviors. Some researchers found that providing nutrition information was associated
with improved nutrition content of food provide by restaurants, increased awareness of
the provided nutrition information, increased customer satisfaction and repurchase
intention (Pulos & Leng, 2010; Tangari, Burton, Howlett, Cho, & Thyroff, 2010).

6
6
Based on the fact that restaurant nutrition labeling is expected to have a positive effect on
customers‟ health and help reduce the overweight and obesity problems; the vegetarian
trend may have a similar positive influence. In response to consumer demand, menus
seem to be including an increasing number of vegetarian entrees among the items offered
(Perry, McGuire, Neumark-Sztainer, & Story, 2001). While the trend towards healthier
menu items includes vegetarian items, research articles on vegetarians related to
restaurants and menu options are very limited.
While vegetarian menu options may be an important consideration for many when
selecting food in a restaurant, the traditional purchase drivers such as taste, price, and
convenience are also important to consumers of vegetarian foods. Finding an optimal
balance to maximize profitability and customer satisfaction in this niche market requires
careful analysis. This research will use three menus with different percentages of
vegetarian items to measure customers‟ purchase intention and find out which
combination will attract the most consumers.
The purpose of this study is to find out how the availability of vegetarian menu items
affects customers‟ behavioral intention in choosing restaurants using the theory of
planned behavior and to determine the impact vegetarian-friendly menus have on
vegetarian as well as non-vegetarian customers when they make their restaurant
selections. This paper will also discuss the implication for a vegetarian lifestyle on the
food service industry and menu development in restaurants.

7
7
CHAPTER 2. LITERATURE REVIEW
Nowadays, customers can choose among a variety of restaurants, from quick-service
restaurants to five-star luxury restaurants. In order to attract customers, the restaurant
industry is trying very hard to focus on issues important to today‟s consumers. One of the
more important issues is the overweight and obesity problem. The food service industry‟s
response to the „obesity crisis‟ and consumer demands is crucial, as the solution may well
be a „two-way street‟ involving both consumers and the industry (Edwards, et al., 2005).
A lot of studies have looked into this problem and have come up with some solutions for
both customers and the industry. Some researchers declared that portion control can
prevent customers from eating too much fat at one meal (Diliberti et al., 2004;
Matthiessen, Fagt, Biltoft-Jensen, Beck, & Ovesen, 2002; Rolls, Roe, Kral, Meengs &
Wall, 2004). A study done by Gifford (2002), suggested that the only way to counter the
incidence of overweight and obesity is through major changes in national dietary policies.
One of the suggestions from the U.S. Department of Health & Human Services in 2005 to
increase access to fruit and vegetables has proved to be beneficial for many consumers
(Berkow & Barnard, 2006). Veggie diets have been found to result in a lower risk for
many diseases (Ornish, 1996). Vegetarianism and vegetarians are becoming an important
part for the restaurant industry as the unavoidable market segment. Restaurants with
vegetarian items on their menu can attract vegetarians as well as customers who want to

8
8
have more vegetables and fruits in their diets. There are very few studies talking about
the percentage of vegetarian items on restaurant menus. So this study is trying to fill this
gap in this important research area by using the theory of planned behavior. This research
will look at customers‟ planned behavior in relationship to dining in a restaurant based on
different percentages of vegetarian items on the menu. It will evaluate participants‟
attitude, control factors and influence of others.
2.1 Overweight, Obesity and Health Concerns
Being either overweight or obese is becoming the norm both in developing and
developed countries (Ammerman, Leung, & Cavallo, 2006). Sixty-eight percent of adults
aged 20 years and older in the U.S. have a Body Mass Index (BMI) of 25 or higher,
which means they are overweight or obese (Flegal, Carroll, Ogden, & Johnson, 2010). In
South Africa in 2003, 56.2% of the adult population was recorded as overweight or obese
(Demographic & Health Survey, 2003). Overweight and obesity problems can result in
serious and even life threatening health issues such as coronary heart disease, diabetes,
hypertensions, osteoarthritis, type 2 diabetes and some kinds of cancers (Berkow &
Barnard, 2006). Some studies have even proved that overweight and obesity are
associated with lower quality of life and greater risk of morbidity (Pi-Sunyer, 1999;
Allison, Faith, & Heo, 2003). In 2008, the medical costs associated with obesity in the
United States totaled about $147 billion (Finkelstein, Trogdon, Cohen, & Dietz, 2009).
Some people consider restaurants to be at least partially responsible for the rising obesity
rates because of the use of large portion sizes, product bundling and buffets. A Minnesota

9
9
study found that eating at “fast-food” restaurants is positively correlated with an
increased BMI and decreased vegetable consumption (Baker, Schootman, Barnidge, &
Kelly, 2006). Because of the obesity epidemic and its subsequent medical costs, federal
and local governments in the U.S. are “recommending nutrition education, encouraging
exercise, and asking the food and beverage industry to promote healthy practices
voluntarily” (Grotz, 2006).
Instead of pursuing short-term business profits, restaurants are encouraged to launch new
menus with calorie information and change marketing strategies to respond to the
overweight and obesity problem. In response to this problem, a number of food operators
have pledged to eliminate super-sizing (Rolls, 2003). Smaller product portions, clearer
labeling and improved nutritional content have been pledged by members of the Food
and Drink Federation (Gilliver, 2004). Besides these steps, more vegetarian options on
the menu can also be helpful.
2.2 Vegetarian Trend and Benefits
Vegetarianism is a dietary pattern characterized by the consumption of plant foods and
the avoidance of some or all animal products (Perry et al., 2001). The vegetarian
population can be divided into eight categories by what is included or eliminated from
their diet. They are occasional-vegetarians, semi-vegetarians, pesco-vegetarians, lacto-
ova vegetarians, vegans, raw foodists and fruitarians (Shani & DiPietro, 2008).
Occasional-vegetarians eat all kinds of animal products and have a vegetarian diet when
they want to keep a balanced diet. Semi-vegetarians are people who avoid eating red

10
10
meat, but they eat milk and dairy products, fish and poultry. Different from semi-
vegetarians, pesco-vegetarians just eat fruits and vegetables, milk and dairy products,
eggs and fish but avoid other animal products. Lacto-ovo vegetarians, lacto-vegetarians
and vegans are the most well know types of vegetarians. The lacto-ovo vegetarian
consumes dairy products and eggs, but avoid all other animal products. Lacto vegetarians
consume only dairy products and no other kinds of animal products. Vegans do not
consume animal products of any kind including honey. Raw foodists are vegans who do
not cook or heat food, but eat it in its natural, raw state. Fruitarians eat only fresh fruits
and food that is technically considered as fruits, such as cucumbers and tomatoes.
In order to provide the best food and service to vegetarians, restaurants must make an
effort to understand the motives for becoming a vegetarian. From Shani and DiPietro‟s
article in 2008, these motives can be divided into two groups, eco-centric ones and
anthropocentric ones. Eco-centric vegetarians are people who opt for vegetarianism for
external reasons. Some people opt for the vegetarian lifestyle mainly because of group
influence; for example, they are raised in a family with vegetarians or they belong to
social vegetarian groups. Ethical considerations have a strong influence on the
motivations behind people‟s food choices (Linderman & Vaananen, 2000). So the second
most common eco-centric reason for being vegetarian is caring about animals‟ welfare.
Many are motivated to become vegetarians because of feelings of guilt associated with
killing animals (Janda & Trocchia, 2001). Other motives including environmental reasons
and humanitarians reasons. Some vegetarians support the view that animal farms produce
disproportional animal waste ending up in rivers and streams. Many of the forests in

11
11
South and Central America have been cut down to make room for cattle pastures and
ranching (World Animal Foundation, 2007). Because it takes 12.9 pounds of grains to
produce one pound of beef (Engel, 2004), some vegetarians believe that a vegetarian diet
can help feed more of the starving poor, instead of livestock. Another consideration is
religious beliefs. All the major world‟s religions direct their believer‟s eating habits. For
example, Buddhism strictly forbids eating animals because they perceive animals to be
human souls in different bodily form.
Anthropocentric vegetarians are people who opt to become vegetarians because of their
own benefits. For example, they may be health-concerned vegetarians due to medical
constraints (Berkoff, 2004). They may also believe that the vegetarian diets are simply
healthier (Maurer, 2002). Many people become vegetarians with the intention to better
manage their weight. Some people simply find the taste, texture, smell and/or sight of
meat-based foods unappealing. Regardless if they are eco-centric or anthropocentric
vegetarians, we can conclude that most vegetarians are people concerned about health,
weight, environment or human issues. Today, most vegetarians are not viewed as radical
or odd, their vegetarian lifestyle is reported to be more knowledge based and is less likely
to be based on common misconceptions (Pribis, Pencak & Grajales, 2010).
A vegetarian diet is thought to meet many of the recommended dietary guidelines. The
Dietary Guidelines for Americans are jointly issued and updated every 5 years by the
Department of Agriculture (USDA) and the Department of Health and Human Services
(HHS) (2010). The newest guideline published in 2010 suggests people consume more of

12
12
certain foods and nutrients such as fruits, vegetables, whole grains, fat-free and low-fat
dairy products; this is exactly what most vegetarians choose to eat. The guidelines also
educate people to consume fewer foods with sodium (salt), saturated fats, trans fats,
cholesterol, added sugars, and refined grains. Twenty-nine previous studies have
previously noted that vegetarians tend to have a lower body weight than non-vegetarians
(Singh, Sabate, & Fraser, 2003). Vegetarian diets containing fiber and complex
carbohydrates have a lower energy density and result in a lower calorie intake (Radhika,
Sudha, Sathya, Ganesan, & Mohan, 2008). The fact that overweight and obesity are less
frequent in vegetarians can be seen as supporting the claim that vegetarian diets can help
prevent overweight and obesity.
In addition to diseases related to the rise in obesity, other diseases have been linked to
meat consumption such as type 2 diabetes and certain cancers like lung, gastrointestinal
and colon cancer. (Thorogood, Mann, Appleby & Mcpherson, 1994; Fraser, 1999). To
avoid problems associated with meat consumption, some have turned to vegan diets.
Vegan diets have been found to help improve control of blood lipids (Ornish, 1996;
Barnard, Scialli & Bertron, 2000), blood pressure (Berkow & Barnard, 2006), diabetes,
reversal of cardiac atherosclerosis (Ornish, 1996) and provide additional benefits related
to certain cancers (Thorogood, et al., 1994). A study followed 1905 vegetarians for 11
years in the Federal Republic of Germany; lower rates of cancer deaths were observed for
lung and gastrointestinal cancers in males, gastrointestinal cancers in females and colon
cancer in both genders (Fraser, 1999). Persky et al.‟s 1992 study included a total of 75
adolescent girls, 35 vegetarians and 40 non-vegetarians. The results suggest that

13
13
adolescent vegetarian girls have significantly higher levels of DHS (luteal
dehydroepiandrosterone sulfate) than adolescent non-vegetarian girls. Previous literature
suggests that DHS may provide some degree of protection against breast cancer. A very
large study followed 27,530 vegetarians and non-vegetarians for 21 years in California.
That study showed that those who consumed mostly vegetarian foods had lower age-
specific mortality rates than those who consumed meat and meat related foods (Fraser,
1999). Venderley and Campbell (2006) tried to determine if a vegetarian diet can provide
sufficient energy and an appropriate range of carbohydrate, fat and protein intakes to
support performance and health for athletes. They found sufficient evidence to indicate
that a well-planned vegetarian diet can meet the energy and macro- and micro-nutrient
needs of an athlete and may reduce the risk for certain chronic diseases.
Living a vegetarian lifestyle poses unique vegetarian nutrition needs. Without meat or
animal byproducts, essential vitamins and nutrients can dwindle in the body (Weiss,
Fogelman & Bennett, 2004). Calcium, omega 3, iron, zinc and B12 are the most
common nutrition that may be lacking in vegetarian diets (Kiran, Ramnath, Khushiani,
& Singh, 1994). While being a vegetarian can result in nutrition deficiencies, there are
many healthy substitutes available to provide a well-balanced and nutritious diet
(Remera, Neuberta & Manza, 1999). All kinds of vegetarian diets can be nutritionally
balanced, but it will take some planning to do this (Remera et al., 1999). Although
vegetarians are at a risk of some kinds of nutrition deficiency, the top motivation of
choosing vegetarian diets is people‟s health concern (Singh et al., 2003). Nowadays,
more people chose to become occasional-vegetarians or semi-vegetarians instead of

14
14
vegans to avoid the risk of nutrition deficiency (Berkoff, 2004). In 2003, the American
Dialect Society (2004) voted “flexitarian” (semi-vegetarians) as the year's most useful
word and defined it as "a vegetarian who occasionally eats meat".
According to research conducted by the Vegetarian Resource Group in 2009, there are
almost eight million vegetarians in the U.S. The proportion of young people who
consider themselves as vegetarians is even higher, 6%-11%. The percent of adult
Americans who consider themselves vegetarians has remained relatively constant. A
2012 Gallup poll found that five percent of American adults consider themselves to be
vegetarians, largely unchanged from the six percent who were identified as vegetarians in
1999 and 2001 (Newport, 2012). The poll also showed that two percent consider
themselves to be „vegans‟. Unmarried adults are more than twice as likely as married
adults to be vegetarians. Vegetarianism appears to be slightly more prevalent among
women than among men. Whereas the number of vegetarians has become relatively static,
the number of meat-reducer and red-meat-avoiders is increasing. More people are trying
to restrict meat consumption and add more veggie options in their diet (Singh, et al.,
2003).
Some food and beverage processors have recognized the importance of providing
vegetarian options; they have created and produced many new products to meet the needs
of vegetarians; such as, soy milk, veggie sausages and imitation meat products (Shani &
DiPietro, 2008). In contrast, many restaurants have not added more vegetarian items of
good quality into their menus. Many menus do not contain a sufficient number of

15
15
vegetarian items to satisfied dietary wishes of their vegetarian or occasional-vegetarian
customers (Cobe, 2003; Kuhn, 2006). The number of individuals who do not order meat
when dining out should be sufficient to get restaurant‟s attention. More than 50 percent of
people who eat in a restaurant order a dish without meat, poultry or fish sometimes, often,
or always (Vegetarian Resource Group, 2009). In 2012, consumer-spending data
indicated that 46.4% of the total food dollar spent by consumers or $631.8 billion is spent
in restaurants (National Restaurant Association, 2012). If the number of people ordering
vegetarian dishes has remained constant since 2008, the resulting impact of vegetarians
on dollars spent when dining out is $42.3 billion.
Despite the popularity of vegetarian diets and apparent financial impact on restaurants,
the impact of a vegetarian friendly menu attracting and maintaining a customer base has
not been well researched in the academic field. From my personal observation, the
keywords such as vegetarian lifestyle, vegetarian customers and vegetarian menu options
have appeared more frequently in trade newspapers and magazines in recent years but not
in scholarly journals. Vegetarian Times and VegNews are magazines that talk about the
vegetarian lifestyle and recipes. Vegetarian Times was a 2009 Maggie Award finalist:
Lifestyles & Alternative Lifestyles/Consumer category. VegNews is read by more than
225,000 people in 38 countries and was named one of the “Best 50 Magazines” by the
Chicago Tribune (#18) and the country‟s “Best Lifestyle Magazine” in 2008, 2009, and
2010 (Vegetarian Times, 2013). Although trade newspapers and magazines have
frequently provided information about vegetarian lifestyles, there has not been enough
academic research in the field of vegetarian friendly menus and restaurants and is

16
16
therefore, the proposed as the focus of this study. This study will use the theory of
planned behavior to research vegetarian-friendly restaurants. The goal is to determine if
vegetarian-friendly restaurants attract vegetarians as well as non-vegetarians and how
consumers‟ attitudes affect their dining choices related to this kind of restaurant.
Finally,this study can provide restaurants ideas on how to market vegetarian-friendly
menus.
2.3 Vegetarian-Friendly Menus
Recently, some restaurants have attempted to improve their menus and attract new
customers by adding healthy menu items. For example, a restaurant called Uno Chicago
Grill was awarded one of the America's Healthiest Casual Dining Spots by the Health
magazine in 2008. This recognition was due at least in part to their whole-grain pasta,
brown rice, organic coffees and teas, and flatbread pizzas that have half the calories of
their deep-dish counterparts. In addition, customers can add a salad to their pizza for half-
price because, according to the memo in the menu, “we want you to get some greens in
your diet.”
When dining out, many vegetarians find it difficult to find restaurants that serve fruit,
vegetables and whole grain products (Tabacchi, 2006). It would appear that restaurant
menus are geared towards meat eaters, and their vegetarian offerings are often limited to
meat dishes without meat. If vegetarians or people who want to try vegetarian dishes eat
out frequently, it may be difficult for them to get the type of diet they desire. Although

17
17
there is a growing number of strict vegetarian restaurants, vegetarians often go to non-
vegetarian places because they are accompanying relatives and friends who prefer a
meat-based meal (Shani & DiPietro, 2008). If the vegetarian has trouble finding items on
the menu, then he or she may just sit without purchasing food. So if a restaurant can meet
the needs of vegetarians as well as non-vegetarians, it should see an increase in revenue.
A vegetarian-friendly restaurant is one that is able to provide services that make
vegetarians feel comfortable. Although literature about this kind of restaurant is really
limited, there seems to be a few characteristics that vegetarian-friendly restaurants have
in common. Menus in vegetarian-friendly restaurants offer clear indication about what
items are vegetarian, or what kind of dishes can be converted into vegetarian dishes; for
example, using tofu instead of meat (Shani & DiPietro, 2008). There should be a variety
of vegetarian or vegan options on the menu. Vegetarian-friendly restaurants take steps to
prevent meat from contaminating vegetarian dishes. Managers from vegetarian-friendly
restaurants educate their employees on the different types of vegetarianism and the
various food items that can be consumed by each of the types (Lydecker, 1998).
2.4 Factors that Influence Consumers‟ Food Choices and Menu Labels
There are a lot of factors that may affect a customer‟s selection of a menu item.
Understanding eating behaviors and the determinants of dining choices is critical in
investigating the role of vegetarian items on a restaurant‟s menu and to help customers
make more healthy food choices.

18
18
Eating behaviors are affected by many factors,and the effects vary for different
individuals throughout different life stages (Kearney, Hulshof, & Gibney, 2001; Rozin &
Vollmecke, 1986; Young & Nestle, 2007). The factors that influence people‟s food
choices can be grouped into three categories: biological, social, cultural, and
psychological.
Biological factors including innate taste biases and some genetically based
predispositions to determine certain common characteristics of human food preferences
and choices. The difference between individuals‟ sensory responsiveness to some food
compounds can also be attributed to biological factors (Rozin & Vollmecke, 1986).
Social and cultural factors that affect people‟s attitude, values and expectations about
appropriate food choices and intake are formed in certain social and cultural contexts
through their interactions with other individuals (Jastran, Bisogni, Sobal, Blake, &
Devine, 2009; Marshall & Bell, 2003). Factors such as the presence of eating companions,
the number of eating companions present, and the social relationships between the people
eating together can also influence consumers‟ food choice and intake (De Castro, 1994;
Herman, Roth, & Polivy, 2003). Many psychological factors also have significant
impacts on people‟s eating behavior (Rozin & Vollmecke, 1986). For example, ambiance
of the eating environment, including eating locations, ambient temperatures, lighting,
sounds, physical surrounding of the eating environment, the availability of food and the
presentation of food could also influence people‟s food choices (Stroebele & De Castro,
2004)

19
19
Customers are seeking healthy items to eat at home as well as in restaurants. In the
National Restaurant Association's "What's Hot in 2011" survey of more than 1,500
professional chefs, over half rated meatless/vegetarian entrées and vegan entrées as a "hot
trend." Nearly a quarter considered meatless/vegetarian entrées a "perennial favorite,"
while 17 percent gave that rating to vegan entrées (National Restaurant Association,
2011). In response to this trend and to meet new government regulations, many
restaurants now include more health information or health labels such as calorie content
and grams of fats and carbohydrates on their menus. Nutritional information presented on
menu items has been shown to have stronger effects on consumer food practices than
nutritional information presented on packaged food products (Kozup, Creyer, & Burton,
2003). A study conducted by Hwang and Lorenzen in 2008 suggests that when
restaurants provide nutritional information about healthy menu choices, customers are
more likely to recognize the healthiness of these items and select them over unhealthy
options. Moreover, customers appear willing to pay more for healthier options. Based on
the Hwang and Lorenzen (2008) study, the most effective menu includes nutritional
information about calories, macronutrients and fat. By contrast, another study made a
conclusion that the provision of calorie and fat content information on the menus did not
modify the food ordering behavior for the majority of adolescents (Yamamotoa,
Yamamotob, Yamamotob, & Yamamoto, 2005). The authors still hold the view that the
provision of the nutrition information should be encouraged because it resulted in some
calorie/fat reduction by some of the adolescents and it did not adversely affect the
restaurants‟ revenue. The inconsistent results of the effect of health information on food
choices might partially be due to the different research methods, diverse populations and

20
20
restaurants being studied. Given that research indicated that providing health information
did affect the healthiness of restaurant purchase intention (Yamamotoa et al., 2005;
Hwang, & Lorenzen, 2008), restaurants with vegetarian item options may benefit from
providing customers more vegetarian choices and health information. Existing hospitality
management research suggests consumer purchase intention, value and quality
assessments can be affected by changes in menu item labeling (Wansink, Painter, & Van
Ittersum, 2001). But the way in which the information is presented could potentially be
improved. For example, research on price presentation has found that organizing unit
price information on a unit price list from low to high unit prices led consumers to spend
less money (Russo, 1977). Therefore, organizing menu items on a menu from more
healthy to less healthy may lead consumers to order healthier food. Dayan and Bar-Hillel
(2011) found that people tend to order food items at the top and bottom of menu lists
more than items at the middle of menu lists. In addition, research examining the
effectiveness of labels on the front of packaged foods finds that a „„traffic light‟‟ labeling
system, which uses red, green, and yellow traffic light symbols on packages to indicate
fat, saturated fat, sugar, and salt levels, can help consumers identify healthier food
choices (Sonnenberga et al., 2013). Based on this previous literature, it is a reasonable
assumption that vegetarian-friendly restaurants can increase purchase behavior and sales
of vegetarian items by adding them near the top of the menu. The impact of adding
vegetarian choice should be further increases through providing nutritional information in
the proper format.
21
21
A review of the relevant literature revealed no clear definition as to what percentage of
vegetarian items on a menu makes the restaurant a vegetarian restaurant. Ned Barker, a
hotel industry veteran and principal of Grill Ventures Consulting, searched menus for
“top restaurants” in major U.S. cities and found that coastal cities had a greater
percentage of vegetarian menu items than their Midwest counterparts. He also found that
eight of the “10 best” had at least one enticing vegetarian item on the menu (Barker &
Swift, 2009). The aim of this research is to find out how varying numbers of vegetarian
items on a menu influences customers‟ willingness to dine in a particular restaurant.
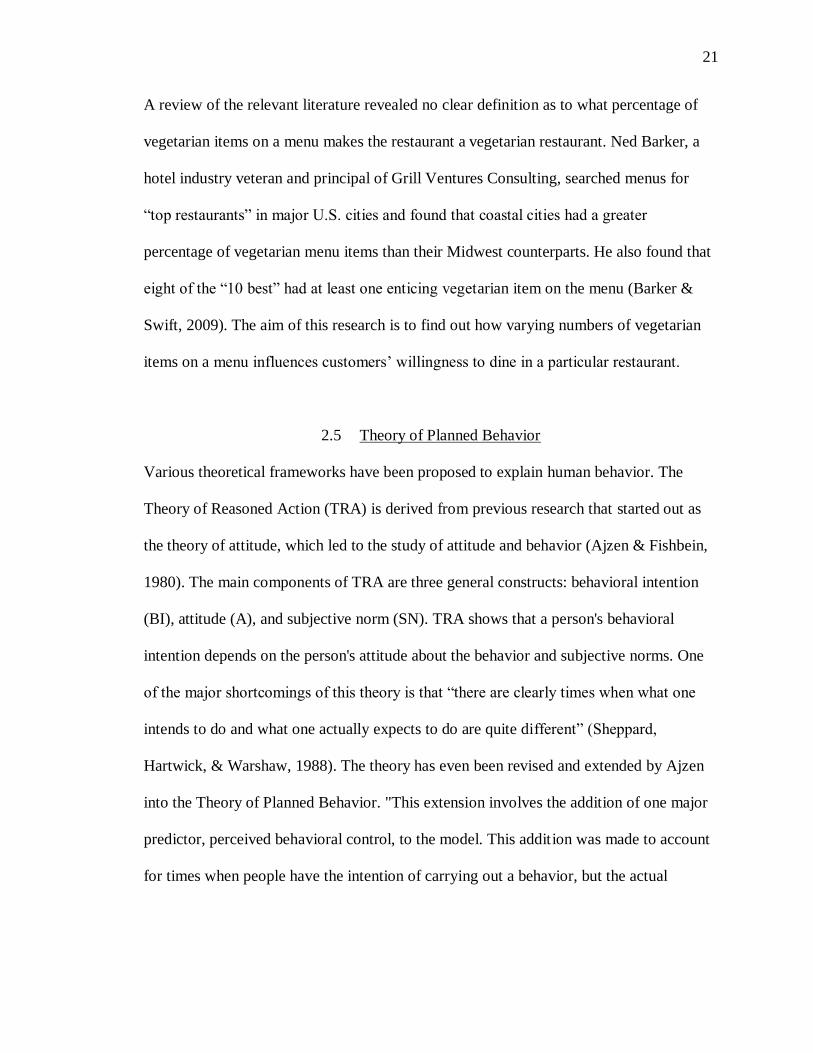
2.5 Theory of Planned Behavior
Various theoretical frameworks have been proposed to explain human behavior. The
Theory of Reasoned Action (TRA) is derived from previous research that started out as
the theory of attitude, which led to the study of attitude and behavior (Ajzen & Fishbein,
1980). The main components of TRA are three general constructs: behavioral intention
(BI), attitude (A), and subjective norm (SN). TRA shows that a person's behavioral
intention depends on the person's attitude about the behavior and subjective norms. One
of the major shortcomings of this theory is that “there are clearly times when what one
intends to do and what one actually expects to do are quite different” (Sheppard,
Hartwick, & Warshaw, 1988). The theory has even been revised and extended by Ajzen
into the Theory of Planned Behavior. "This extension involves the addition of one major
predictor, perceived behavioral control, to the model. This addition was made to account
for times when people have the intention of carrying out a behavior, but the actual

22
22
behavior is thwarted because they lack confidence or control over behavior" (Miller,
2005).
The Theory of Planned Behavior (TPB) was designed to predict and explain human
behavior in a specific context (Ajzen, 1991). Behavioral intention is a central component
in the TPB. According to Ajzen (1991), behavioral intention is used to indicate an
individual‟s likelihood to undertake a particular behavior. Willingness to dine in a
particular restaurant is a kind of behavioral intention. Human intentions are guided by
three kinds of considerations: behavioral beliefs, normative beliefs and control beliefs.
Behavioral beliefs are about the likely outcomes of the behavior and the evaluations of
these outcomes. They can produce a favorable or unfavorable attitude, which is defined
as an individual‟s overall evaluation of the specific behavior (Ajzen, 1991, Ajzen, Czasch
& Flood, 2009). This may include, for example, how customers evaluate menus with
different percentages of vegetarian items. Some people may view vegetarian items
healthy while others do not. The normative expectations of others and motivations to
comply with these expectations produce normative beliefs, which result in perceived
social pressure or subjective norms. Normative beliefs are an individual‟s estimate of the
view of other people such as their family, friends and co-workers (Ajzen, 1991, Ajzen et
al., 2009). Beliefs about the presence of factors that may facilitate or impede performance
of the behavior and the perceived power of these factors are called control beliefs, which
give rise to perceived behavioral control. Perceived behavioral control refers to an
individual‟s perception of the ease or difficulty of conducting the behavior (Ajzen, 1991;
Huchting, Lac, & LaBrie, 2008). As a general rule, the more favorable the attitude and

23
23
subjective norm, and the greater the perceived control, the stronger the person‟s intention
to perform the behavior. Finally, given a sufficient degree of actual control over the
behavior, people are expected to carry out their intentions when the opportunity arises.
TPB has been widely used in social psychology, and the model has been supported by
many studies (Perugini & Bagozzi, 2001). It has also been applied in the field of
hospitality and tourism to examine travel motivations and customer satisfaction in hotels
and restaurants (Hsu & Huang, 2012; Cheng, Lam, & Hsu, 2005b). Cheng et al. (2005b)
tested the TPB model in restaurants and add past behavior into the model. The results
demonstrated the strong predictive power of the original TPB model was significantly
improved by the inclusion of past behavior. In order to explain eco-friendly planned
behavior in hotels, a study designed to test and modify the TPB by including
environmental concerns, perceived customer effectiveness and environmentally
conscious behaviors. The findings from the structural equation modeling showed that the
proposed model had a satisfactory fit to the data and better predicted hotel customers‟
intention than the original TPB (Hana & Kimb, 2010). Another researcher applied the
theory of planned behavior (TPB) to investigate the interactive influence of the green
consumption cognition of consumers regarding the restaurant service industry. The green
consumption cognition, green consumption attitude, green subjective norms, and green
perceived behavioral control of consumers were shown to have a significantly positive
influence on customers‟ behavioral intention to patronize the restaurant (Lien, Huang, &
Chang, 2012).

24
24
The influence of past behavior (PB) on current and future behavior is an issue that has
been extensively studied by behavioral scientists. Quellette and Wood (1998) hypothesize
that PB is directly related to future behavior and other TPB constructs, and conclude that
both PB and PB frequency are significant predictors of both future behavior and
behavioral intention. Cheng, Lam, & Hsu. (2005a) determined that the frequency of
certain types of past behavior had a direct influence on behavioral intention when
choosing a destination. Conner & Abraham (1998) showed that past experience was an
accurate predictor of behavioral intention in the hospitality and tourist sectors. Therefore,
it is reasonable to assume how frequently people consume vegetarian foods and eat in
restaurants will affect where and how often they consume meals away from home.
Overall, TPB model can be applied to test people‟s intention for certain behaviors. It has
been tested in the hospitality industry many times, but not for vegetarian-friendly
restaurants. The theory of planned behavior was proven helpful in explaining the variance
in the behavioral intentions for various behaviors; however the ability of the TPB
variables to predict behavior was not as strong as for predicting intention. So this
research used the TPB model to test customers‟ dining intention instead of dining
behavior related to restaurants with menus that had a different percentage of vegetarian
items. This model will help explain the dining behavior of vegetarians as well as non-
vegetarians in vegetarian-friendly restaurants by measuring their attitude, subjective
norms and the control factors of their purchase intentions.

25
25
The TPB has been the basis of research in a wide variety of fields. It has also been
employed in many studies to analyze behavior in relation to meals and foods. These
include the analyses of factors affecting the consumption of a low-fat diet (Armitage &
Conner, 1999), sugar restricted foods by college students (Masalu & Astrøm, 2003),
sugar-free products by youth (Messina, Saba, Vollono, Leclercq, & Piccinelli, 2004),
fruits and vegetables (Kellar & Abraham, 2005) and the changes in dietary behavior by
diabetics (Blue, 2007). However, no previous research has been found that addressed the
influence of vegetarian food on dining behavior in a restaurant setting. The present study
was designed to help fill this research gap.
The framework used in the development of this study was the Theory of Planned
Behavior (TPB). The availability of vegetarian items on a menu may influence customers‟
purchase intention so as to affect their actual dining behavior. So this study is trying to
measure customers‟ intention towards vegetarian items on the menu of a restaurant.
Intention is influenced by attitude, subjective norms and perception of control over the
behavior. Overall, based on the TPB, the present study postulated that restaurant
customers‟ positive or negative evaluation of the availability of vegetarian items on the
restaurant menu (favorable/unfavorable attitude), their perceived level of social pressure
to purchase or not to purchase (high/low subjective norms) and their perceived ease or
difficulty in dining at the restaurant (high/low perceived behavioral control) and their past
experience (past behavior) will significantly contribute to an increase or decrease in their
intention to dine in a restaurant with different percentages of vegetarian items on the
menu.

26
26
Figure 1. Framework and Hypotheses.
2.6 Research Questions and Hypotheses
Based on the theoretical framework and previous studies, this research aims at answering
the following research questions and testing the validity of seven hypotheses. The
research questions include the following seven questions.
1. Does the availability of vegetarian menu items affect customers‟ intention to dine in a
particular restaurant?
2. Do other people‟s (friends, relatives etc.) opinions on availability of vegetarian menu
items affect customers‟ intention to dine in a particular restaurant?
3. Do perceived control factors influence customers‟ intention to dine in a restaurant with
vegetarian menu?
4. Do customers‟ past dining experiences affect their intention to dine in a restaurant with
a vegetarian menu?
5. Will the percentage of vegetarian menu items affect people‟s attitude, subjective norms
and behavioral intention towards dining in the restaurant?

27
27
6. What are consumers‟ perception of vegetarian diets and vegetarian food in restaurants?
7. Does gender, age, education or income have an influence on their attitude toward
menus with vegetarian items or their intention of dining in a restaurant with a vegetarian-
friendly menu?
In order to address the research questions above and verify the theory in a restaurant
setting with vegetarian menu options, researchers propose the following hypotheses.
H1: Behavioral beliefs towards vegetarian items will positively impact the subjects‟
attitude to dine in a restaurant with vegetarian items on its menu.
H2: Normative beliefs of dining partners towards vegetarian items will positively impact
the subjects‟ subjective norms to dine in a restaurant with vegetarian items on its menu.
H3: Control Beliefs have a positive impact on the subjects‟ perceived behavior control to
dine in a restaurant with vegetarian items on its menu.
H4: Attitude towards vegetarian items on a menu will positively impact the subjects‟
intention to dine in a restaurant with more vegetarian items on its menu.
H5: The subjective norm for consumption of vegetarian foods will have a positive impact
on the subjects‟ intention to dine in a restaurant with more vegetarian items on its menu.
H6: Perceived behavioral control has a positive impact on the subjects‟ intention to dine
in a restaurant with more vegetarian items on its menu.
H7: Past dining experience positively affect customers‟ purchase intention of dinning in a
restaurant with vegetarian menus.
28
28
CHAPTER 3. METHODOLOGY
This study utilized the Theory of Planned Behavior (TPB) as the basis for the model used
to determine consumer response to varying levels of vegetarian entrée on a menu (see
Figure 1). The survey was conducted in the atrium of Marriott Hall on the West Lafayette
campus of Purdue University. Participants were solicited from people visiting the atrium.
They were asked to fill out an online survey using 4 iPads. A vegetarian sample was
collected by sending emails to members from Indiana Vegetarian Association. The data
were collected between Jun 18th
and Jun 30th
in 2013. That time period was selected
because it was the time that new students and their parents visited the campus in large
number. Descriptive analysis, t-test, multiple linear regression, Tukey-Kramer
comparison test and one-way ANOVA were used to analyze the data.
3.1 Instrument Design
The entrée part of three menus were designed according to the percentage of vegetarian
items on the menu and ranged from no vegetarian options, 20% vegetarian and 80% meat
items to 80% vegetarian and 20% non-vegetarian choices menus. Menu items selected
included salads, sandwiches, burgers, pasta, grilled and battered items. Every participant
was given one of the three menus and a questionnaire. All menu non-vegetarian food
items were from the chain restaurant Chili‟s Grill and Applebee‟s. Chili‟s and Applebee‟s

29
29
were selected because they are well-known chain restaurants with a wide range of items
on their website. Vegetarian food items were selected from a magazine called EatingWell.
The vegetarian items selected included only dairy products without any other animal
products; they accorded with lacto-vegetarian diets and can be accepted by most of
vegetarians. A green “V” was used to label vegetarian items. Each menu included ten
entrees, Menu 1 had no vegetarian items, Menu 2 had two vegetarian items and eight
non-vegetarian items while Menu 3 consisted of eight vegetarian items and two non-
vegetarian items. In terms of their prices, the prices of non-vegetarian items were
borrowed from chain restaurants while vegetarian items were listed about one dollar
cheaper than non-vegetarian items as suggested by the vegetarian magazine.
Measures for TPB constructs shown in Figure 1 were derived from the literature review
and sample questionnaire from Ajzen‟s official website (Ajzen, 2013). After reviewing
the menu, respondents were asked to choose one dish he or she would likely order. This
was done to ensure all respondents reviewed the menu before answering the remaining
survey questions. In the next section, participants are asked to answer questions by
selecting the number that best represents how they feel about the menu using 7-point
Likert-type rating scales. Five to six items were formulated to assess each of the theory‟s
major constructs: Attitude, perceived norm, perceived behavior control and intention. For
example, participants were asked evaluate to what extent the food described on the menu
would make dining in the restaurant pleasant or unpleasant, healthy or unhealthy, a good
value or a rip-off. Statements measuring their subjective norms directly included: “Most
people who are important to me like me to dine in a restaurant with this menu.” and

30
30
“Most people whose opinions I value would approve me to dine in a restaurant with this
menu.” Participants were also asked to choose from strongly agree to strongly disagree in
terms of statements related to their perceived behavior control like: “Whether or not I
dine in a restaurant with this menu is entirely up to me.” and “I am confident that if I
wanted to I could dine in a restaurant with this menu.” Statements measuring their
purchase intention included “How likely are you to dine in a restaurant with this menu?”
and “How often would you dine in a restaurant with this menu?”
With respect to each salient behavior outcome, items were formulated to assess the
strength of the behavioral beliefs and the evaluation of the outcome. Based on previous
literature describing some of the benefits related to eating a vegetarian diet, researchers
developed statements related to the behavioral beliefs including: “Dining in a restaurant
with this menu would help me maintain a good weight”, “Dining in a restaurant with this
menu would help me live longer.”, “Dining in a restaurant with this menu would help me
against some kinds of diseases.”, “Dining in a restaurant with this menu would make me
an environmental-friendly person.”, “Dining in a restaurant with this menu is consistent
with my religious beliefs.” In order to measure their evaluation of the outcome,
participants were asked to rate from extremely good to extremely bad on a seven point
scale statements like: “For me to have an appropriate balance of vegetarian and non-
vegetarian items in my every meal is”, “For me to eat vegetarian dishes when dining in a
restaurant is”.

31
31
With respect to each salient normative referent, items were formulated to assess the
strength of the descriptive normative belief and the motivation to comply with the
referent group. There were some items measuring beliefs from participants‟ families and
friends and to what extent people are motivated to comply with their families and friends‟
beliefs. The contents of families and friends‟ beliefs section were similar to those in the
behavioral beliefs section in the first part. For example, “My families and friends think
that dining in a restaurant with this menu would help me maintain a good weight.” and
“My families and friends think that dining in a restaurant with this menu would help me
live longer.”
There were limitations as to which questions could be asked to measure the perceived
control factors because this survey was not based on a real restaurant with a specific
location and facility. Only questions related to families‟ and friends‟ resistance to the
menu and affordability of dining in the restaurant were asked. Questions like: “How often
do families and friends try to prevent you from dining in a restaurant?” and “How often
are you able to afford to dine in a restaurant $12 and up per meal?” were asked to show
people‟s control belief strength. Their level of agreement to statements like: “If my
families and friends try to prevent me from dining in a restaurant, it would make it more
difficult for me to dine in a restaurant with this menu.” and “If I have to spend more than
$12 for a meal in a restaurant with this menu, it would make it more difficult for me to
dine there.” were used by researchers to evaluate the power of these control factors.

32
32
Quellette and Wood (1998) state that past experience and behavior can explain more of
the variance in behavioral intention than can attitude, subjective norm, and perceived
behavioral control individually. So this study measured participants‟ past behavior of
patronizing restaurants with the question: “How often do you dine out?” and “How often
do you dine out at a restaurant where your bill is $12 and up per meal?”
The last part of the questionnaire was used to determine participants‟ demographic
factors. It included questions related to gender, age, education background, income and if
the person was vegetarian.
3.2 Data Collection
This study targeted vegetarian customers as well as non-vegetarian customers. Data were
collected in a two-week period from Jun 18th
to Jun 30th 2013, during Purdue‟s STAR
program. This time period offers a required orientation program for new, domestic first-
year and new transfer students. During this time, new students and their parents from all
over the U.S. came to visit the university. They came from different states and had
diverse backgrounds. Since entire families visited the campus, a relatively diverse group
with respect to age was expected to participate. The study was conducted in the atrium of
Marriot Hall on the West Lafayette Campus of Purdue University. The reason of
choosing this location was the expected volume of foot traffic due to a restaurant in the
building, the HTM bistro for quick-service, a full-service restaurant called the John
Purdue Room and a coffee house called Lavazza. The survey was conducted during
lunchtime when students and their parents came to have lunch or just enjoy a cup of

33
33
coffee. Two desks were set to collect the data, one was beside the location where people
waited for their food from Bistro, and the other was located just outside the main entrance
of the building where the majority of the people would enter or leave. Four iPads were
used to collect the data; two of them were set on each desk for participants to fill out the
online survey. People that participated in this survey received a chocolate or a cookie as
compensation. To increase the number of vegetarians in the study, vegetarians were
contacted by using an email list obtained from the Vegetarian Association in Indiana.
3.3 Data Analysis
All data analyses were performed using SAS (version 9.3, SAS Institute Inc., Cary, NC).
Only surveys that are at least 90% completed will be included in the analyses. The
questions that were not answered were treated as missing values in the data analyses.
Descriptive statistics including frequencies, means, and standard deviations were used to
describe the demographic characteristics of the study sample and the respondents‟
preferences for different menus. Cronbach‟s alpha and item analysis statistics were used
to evaluate the internal consistency and guide if the statements used to measure one
variable could be used together or separately. Hypothesized relationships among the TPB
constructs (as illustrated in Figure 1) were investigated using simple linear regression and
sequential multiple linear regression. Multiple linear regression and structural equation
modelling (SEM) are usually presented for empirical studies of TRA and TPB (Hankinsa,
Frencha & Hornea, 2000). Structural equation models go beyond ordinary regression
models to incorporate multiple independent and dependent variables as well as
34
34
hypothetical latent constructs. While multiple linear regression is often used to simply
test the model in a certain setting. This study did not include any other latent variables, so
multiple linear regression was performed. Specifically, Bonferroni, Scheheef, LSD and
Tukey tests were performed to analyze the differences among the three menus. One-way
analyses of variance (ANOVAs) were conducted to compare differences among the three
menus in terms of each variable and examine associations between demographic
characteristics and their vegetarian consumption behavioral intention. Significance was
reported at P<.05 to all tests.

35
35
CHAPTER 4. RESULTS
A total of 229 questionnaires were collected from participants in the atrium of Marriott
Hall on the West Lafayette campus of Purdue University. Seventeen questionnaires were
returned by participants from the Indiana Vegetarian Association. Of the 246 surveys that
were started, only the 238 surveys were at least 90% completed were kept for analysis.
Because of Purdue‟s Institutional Review Board requirements, responses by participants
under 18 years old of age were eliminated. Finally, 228 questionnaires remained for
analysis. A copy of the research questionnaire is attached in the Appendix E. Among the
209 non-vegetarian respondents, 69 of them used Menu 1, which had no vegetarian-items,
70 used Menu 2 with 20% vegetarian items and 70 used Menu 3 with 80% vegetarian. In
contrast, seven respondents from the Indiana Vegetarian Association filled the
questionnaire based on Menu 1, while five used Menu 2 and seven used Menu 3.
4.1 Demographics of the Sample
Demographic information included age, gender, educational level and income range is
shown in Table 4.1. Of the 228 respondents, 51.8% were females and 48.2% were males.
The ages of respondents ranged from 19 to 75 with a mean age of 33.2 years. The age
distribution was skewed with over half of the respondents aged between 19 and 29 years
(59.6%) with a SD=1.13. On average, the survey participants were highly educated, as

36
36
expected because of the location of the study. The largest category of respondents were
the bachelor degree group (31.1%), followed by the master degree group (30.2%), the
doctor-degree group (19.3%) and the high-school-diploma group (19.3%) (SD=1.03). An
individual annual income range of $10,000 to $29,999 was reported by the largest
proportion of survey participants (38.1%), and an income range of $50,000 to $69,999
was reported by the smallest proportion of respondents (6.6%). This was expected
because of the number of the participants were students at Purdue University. Among
these 228 questionnaires, there are 209 non-vegetarians (91.6%) and 19 vegetarian
participants (8.4%). Based on the information from a recent Gallup‟s poll, five percent of
American adults consider themselves to be vegetarians (Newport, 2012). So this sample
consisting of 8% vegetarians and 92% non-vegetarians is close to the distribution found
in the US population.

37
37
Table 4.1
Sample Demographic
Non-Vegetarian
n %
Vegetarian
n %
Gender
Male 100 47.8 10 52.6
Female 109 52.2 9 47.4
Age
19-29 130 62.1 6 31.6
30-39 42 20.1 3 15.8
40-49 15 7.2 3 15.8
50-59 11 5.3 5 26.3
60 and older 11 5.3 2 10.5
Education
High School diploma 40 19.1 4 21.1
Bachelor‟s degree
65 31.1 6 31.6
Master‟s degree 63 30.1 6 31.6
Doctor‟s degree 41 19.6 3 15.8
Individual Annual Income
Below $10,000 59 28.2 1 5.3
$10,000 to $29,999 84 40.2 3 15.8
$30,000 to $49,999 19 9.1 5 26.3
$50,000 to $69,999 12 5.7 3 15.8
$70,000 to $99,999 19 9.1 4 21.1
$100,000 or more 16 7.7 3 15.8

38
38
4.2 Consumers‟ Beliefs in Vegetarian Diets
The questionnaire included several questions testing respondents‟ beliefs regarding
vegetarian diets or vegetarian food (Table 4.2). About 35% of the respondents thought
having an appropriate balance of vegetarian and non-vegetarian items in every meal was
good, 30% of them thought it was very good and 14% of them held the view that it was
fair, the word used to measure the lowest positive rating in the seven-point Likert-scale.
In total, a majority of participants (79%) supported the view that they should have an
appropriate balance of vegetarian and non-vegetarian food in their meals. Participants
were also asked to rate the health status of eating vegetarian food. It appears that the
majority of the respondents (42%, 11% and 18%) believed that eating vegetarian food
was healthy, extremely healthy and somewhat healthy, respectively. Only 6% of
participants believed that eating vegetarian food is unhealthy.
It seems respondents perceived vegetarian food as a healthy food choice and they know
the importance of having a good balance of vegetarian and non-vegetarian food in their
diets. However, when asked their opinions concerning eating vegetarian dishes when
dining in a restaurant, only 28% of the participants chose good and 13% chose very good.
Nearly 25% of them thought that it was neither good nor bad. Sixteen percent of the
respondents believed that ordering vegetarian food in a restaurant was poor, bad and even
a very bad thing to do. When asked about their opinion of including less meat in their
diets, only 35% chose “good” or “very good”. It seems participants perceived vegetarian
food as good and healthy choices but they also insisted that meat food was indispensable,
especially when eating in a restaurant.

39
39
Table 4.2
Participants’ Beliefs in Vegetarian Diets (n=228)
Statements Very
Bad
(Extrem
ely
Unhealt
hy)
Bad
(Unhealt
hy)
Poor
(Somewhat
Unhealthy)
Neither
Good
Nor
Bad
(Neutral)
Fair
(Somewhat
Healthy)
Good
(Healt
hy)
Very
Good
(Extrem
ely
Healthy)
Appropriate
balance
0% 0% 3% 18% 14% 35% 30%
Eating
vegetarian
dishes
3% 4% 9% 25% 18% 28% 13%
Eating
vegetarian food
0% 1% 5% 23% 18% 42% 11%
Eating less meat 3% 7% 15% 21% 19% 20% 15%
4.3 Preliminary Analysis
The reliability, the internal consistency of items that assessed the different components of
the theory of planned behavior directly were tested by calculating Cronbach‟s Alpha. A
commonly accepted rule of thumb for describing internal consistency using Cronbach's
Alpha is 0.70 (Kline, 1999). Table 4.3 displays the reliability coefficients of six of the
seven factors; intention was not included because only one statement was used to

40
40
measure respondents‟ intention of dining in a restaurant with a particular menu. The
Cronbach‟s Alpha coefficients were above 0.70 for all factors except for perceived
behavioral control (.033) and control beliefs (0.50). For the factors for which Cronbach‟s
Alpha coefficients were less than 0.7, the two questions that had been initially grouped
were split and were used individually for analysis. This was done because while they
could not be grouped, they did represent important parts of each of the two factors. For
example, questions “How often do families and friends try to prevent you from dining in
a restaurant?” and “How often are you able to dine in a restaurant $12 and up per meal?”
were used to test respondents‟ control beliefs of dining in a restaurant. The first question
was testing how other participants‟ opinions affect respondents‟ intention of dining in a
restaurant while the second one questioned how the costs of a meal influenced their
dining decision, both are important components of control beliefs. So these two questions
were used individually in data analysis as control beliefs (A) and control beliefs (B). Just
as control beliefs, the factor perceived behavior control was assessed in statements
“Whether or not I dine in a restaurant with this menu is entirely up to me.” as perceived
behavior control (A) and “I am confident that if I wanted to I could dine in a restaurant
with this menu.” as perceived behavior control (B).

41
41
Table 4.3
Cronbach’s Alpha of Each Factor
Factors Cronbach’s Alpha
Attitude 0.83
Subjective Norms 0.79
Perceived Behavioral Control 0.33
Behavioral Beliefs 0.76
Normative Beliefs 0.88
Control Beliefs 0.50
Past Behavior 0.78
4.4 Effects of Availability of Vegetarian Items on Behavioral Intention
Each participant completed their survey based on one of the three menus. Menu 1 had no
vegetarian items, Menu 2 contains 20% vegetarian items while Menu 3 included 80%
vegetarian items. A one-way analysis of variance was used to analyze the effect of the
availability of vegetarian menu items on respondents‟ attitude, subjective norms,
perceived behavioral control and most importantly, their intentions to dine in a particular
restaurant.
ANOVA analysis indicated that the variables including attitude, behavioral beliefs and
normative beliefs were significantly different among the three menus. By contrast, no
significant difference among the three menus was discovered for subjective norms,
control beliefs, perceived behavioral control and intention. (Table 4.4)
42
42
The Tukey-Kramer Comparisons test (Table 4.4) indicated that there was a significant
difference between Menu 1 and Menu 3 (p=0.0177) as well as Menu 2 and Menu 3
(p=0.0484) in terms of the attitude variable. This means that participants‟ attitude towards
a 80% vegetarian item menu was significantly different from their attitude towards a no
vegetarian item menu and a 20% vegetarian item menu. By contrast, no significant
difference was found in participants‟ attitude between the menu with no vegetarian items
and the one with only 20% percentage vegetarian items. Since Menu 3 had the highest
mean for attitude, it indicated that respondents had a significantly more favorable attitude
towards a menu with 80% vegetarian items.
Significant differences were also found among menus for some of the other factors tested.
There was a significant difference between Menu 1 and Menu 3 (PBB=0.0064;
PNB=0.0067), Menu 2 and Menu 3 (PBB=0.0246; PNB=0.0250) in terms of behavioral
beliefs and normative beliefs, respectively. There was no significant difference between
Menu 1 and Menu 2 for either factor. Participants held a favorable belief and attitude
towards the menu with 80% vegetarian items compared with the 20% vegetarian item
menu and non-vegetarian menu, but they thought there was no difference between the
menu with no vegetarian items and the menu with only 20% vegetarian items.

43
43
Table 4.4
Means and Standard Deviations of Variables among Three Menus
Menu 1 Menu 2 Menu 3
Variable Mean Std Dev Mean Std Dev Mean Std Dev
Attitude 5.20a 1.18 5.32
a 1.13 5.76
b 1.07
SN 4.97 1.13 5.01 0.99 4.94 0.83
PBC (A) 5.83 1.24 5.86 1.32 6.00 0.95
PBC (B) 5.70 1.08 5.61 1.27 5.67 1.07
Intention 4.90 1.37 5.10 1.08 4.99 1.34
BB 4.01a 1.02 4.08
a 0.82 4.50
b 0.93
NB 4.16a 1.07 4.25
a 1.08 4.72
b 0.97
CB (A) 2.51 1.31 2.69 1.49 2.54 1.37
CB (B) 4.21 1.50 4.24 1.21 4.09 1.40
Note. SN=Subjective Norm; PBC=Perceived Behavior Control; BB=Behavioral Beliefs;
NB=Normative Beliefs; CB=Control Beliefs. Control Beliefs (A) = “How often do families and friends try to prevent you from dining in a restaurant?” Control Beliefs (B) = “How
often are you able to afford dining in a restaurant $12 and up per meal?” Perceived
Behavioral Control (A) = “Whether or not I dine in a restaurant with this menu is entirely
up to me.” Perceived Behavioral Control (B) = “I am confident that if I wanted to I could dine in a restaurant with this menu.” Menu 1: Non-vegetarian item menu; Menu 2: 20%
vegetarian item menu; Menu 3: 80% vegetarian item menu. Values are mean scores on a
seven-point scale (1=extremely good/likely/agree, 7=extremely bad/unlikely/disagree). Means in the same rows with different superscripts were significantly different at α=0.05.
4.5 Theory of Planned Behavior Model Test
The mean scores measuring the respondents‟ attitude, subjective norm and perceived
behavioral control with regard to the three menus were calculated respectively. Higher
scores denoted more favorable attitude, subjective norms, or higher level of perceived
44
44
behavior control. Table 4.4 presents the mean values and standard deviations for the
theory of planned behavior variables. Multiple linear regression analysis was used to test
the relationship between each variable for the three menu groups respectively.
4.5.1 Attitude and Behavioral Beliefs
Linear regression analysis found that behavioral beliefs was significantly associated with
participants‟ attitudes (t1=4.04 p1=0.0001; t2=5.32 p2,0.0001; t3=3.59 p3=0.0006) (Table
4.5), meaning that the respondents who held a more favorable belief that outcomes
associated with dining in a restaurant with a certain menu were more likely to have
positive attitude towards that menu. So Hypothesis 1 was supported. From Table 4., the
mean value of behavioral beliefs and attitude for Menu 3 was the highest, followed by
Menu 2 and Menu 1 and the difference was significant (PBB=0.0044, PAttitude=0.0104). It
indicated that respondents had a more favorable belief and attitude towards a menu with
80% vegetarian items because they agreed vegetarian items were healthy, “would help
maintain a good weight”, “help liver longer” and “help against some diseases”

45
45
Table 4.5
Linear Regressions of Behavioral Beliefs on Attitude
Menu 1 Menu 2 Menu 3
Correlation β SE P β SE P β SE P
BB-Attitude 0.52 0.13 0.0001 0.75 0.14 <0.0001 0.46 0.13 0.0006
Note. R21=0.20; R
22=0.29; R
23=0.16. BB=Behavioral Beliefs Menu 1: Non-vegetarian item menu;
Menu 2: 20% vegetarian item menu; Menu 3: 80% vegetarian item menu.
Three statements measured respondents‟ perception of pleasantness, health and value of
dining in a restaurant with each of three different menus. Comparative analyses were
carried out to determine whether the three components of the attitude variable were
statistically significantly different among the three menus. The result (Table 4.6) showed
that the different percentage of vegetarian item on menus only affected respondents‟
perception of health significantly (p=0.0007) but had no significant influence on
participants‟ pleasantness or value perceptions (p=0.7385 and p=0.3247, respectively).

46
46
Table 4.6
Comparison among Components of Attitude
Menu1 Menu2 Menu3
Variable Components Means Std.
Dev
Means Std.
Dev
Means Std.
Dev
df F P
Attitude Pleasant
-Unpleasant
5.86 1.15 5.71 1.21 5.80 1.13 227 0.30 0.7385
Healthy
-Unhealthy
4.87a 1.43 5.11
a 1.38 5.74
b 1.24 228 7.55 0.0007
Great Value
-Rip-off
5.30 1.30 5.22 1.30 5.76 1.39 227 1.13 0.3247
Note. Menu 1: Non-vegetarian item menu; Menu 2: 20% vegetarian item menu; Menu 3: 80% vegetarian
item menu. Values are mean scores on a seven-point scale (1=extremely good/likely/agree,
7=extremely bad/unlikely/disagree).
Table 4.7 demonstrated that for all the factors measuring participants‟ behavioral beliefs,
participants gave the highest mean score for the 80% vegetarian item menu. Take the
statement “Dining in the restaurant with this menu would be healthy” as an example, the
mean score for Menu 3 was 4.7681, and for Menu 1 was only 4.0448. But the difference
for the statement “Dining in a restaurant with this menu would make me an
environmental-friendly person” among the three menus was not significant; respondents
thought there was no relationship between the percentage of vegetarian item in a menu
and environmental-friendly beliefs.

47
47
Table 4.7
Means and Standard Deviations of Factors of Behavioral Beliefs
Menu 1 Menu 2 Menu 3
Factors of Mean Std Dev Mean Std Dev Mean Std Dev
Behavioral Beliefs
Healthy 4.0448a 1.5219 4.1286
a 1.2732 4.7681
b 1.2384
Maintain a good weight 3.8806a 1.2735 4.0571
a 1.0886 4.3768
b 1.4048
Help live longer 3.7910a 1.3876 3.8571
a 1.1201 4.4783
b 1.3241
Against diseases 3.7463a 1.2594 3.8571
a 1.1071 4.2754
b 1.1867
Environmental-friendly 4.5672 1.5976 4.5143 1.5011 4.5797 1.3763
Note. Menu 1: Non-vegetarian item menu; Menu 2: 20% vegetarian item menu; Menu 3: 80% vegetarian item menu. Values are mean scores on a seven-point scale (1=extremely
good/likely/agree, 7=extremely bad/unlikely/disagree). Means in the same rows with
different superscripts were significantly different at α=0.05.
4.5.2 Subjective Norms and Normative Beliefs
Normative beliefs was significantly associated with respondents‟ subjective norms
(p1<0.0001; p2=0.0003; p3=0.0169) for Menu 1, Menu 2 and Menu 3 (Table 4.8). So
Hypothesis 2 was supported. Normative beliefs proved to be a strong predictor for
participants‟ subjective norms according to this sample.

48
48
Table 4.8
Linear Regressions of Normative Beliefs on Subjective Norms
Menu 1 Menu 2 Menu 3
Correlation β SE P β SE P β SE P
NB-SN 0.61 0.11 <0.0001** 0.38 0.10 0.0003** 0.14 0.10 0.0169*
Note. R21=0.34; R
22=0.17; R
23=0.02. *Significant at the p<0.05 level. **Significant at the p<0.01
level. NB=Behavioral Beliefs SN=Subjective Norms. Menu 1: Non-vegetarian item menu; Menu 2: 20% vegetarian item menu; Menu 3: 80% vegetarian item menu.
4.5.3 Perceived Behavior Control and Control Beliefs
From this survey, control beliefs was not a good predictor of the respondents‟ perceived
behavior control. CB (A) was only significantly associated with PBC (A) for respondents
taking the survey with Menu 2 and CB (B) significantly related to PBC (A) only for the
Menu 3 group. For other ten combinations, the relationship between control beliefs and
perceived behavior control were not significant (Table 4.9). So Hypothesis 3 was not
supported

49
49
Table 4.9
Summary of Linear Regression Analysis of Control Beliefs on Perceived Behavioral
Control
Menu 1 Menu 2 Menu 3
Correlation β SE P β SE P β SE P
CB (A)-PBC (A) -0.18 0.12 0.1204 -0.37 0.10 0.0003** -0.15 0.08 0.0775
CB (B)-PBC (A) -0.08 0.10 0.4475 -0.16 0.10 0.1187 -0.19 0.09 0.0393*
CB (A)-PBC (B) 0.06 0.10 0.5308 0.23 0.13 0.0775 0.08 0.08 0.3149
CB (B)-PBC (B) 0.08 0.09 0.3629 0.16 0.13 0.1950 0.06 0.09 0.5137
Note. *Significant at the p<0.05 level. **Significant at the p<0.01 level; CB (A) =Control Beliefs (A); CB (B) =Control Beliefs (B); Control Beliefs (A) = “How often do families and
friends try to prevent you from dining in a restaurant”; Control Beliefs (B) = How often are
you able to afford dining in a restaurant $12 and up per meal?” PBC (A) =Perceived
Behavior Control statement A; PBC (B) =Perceived Behavior Control statement
B;Perceived Behavioral Control (A) = “Whether or not I dine in a restaurant with this
menu is entirely up to me.” Perceived Behavioral Control (B) = “I am confident that if I wanted to I could dine in a restaurant with this menu.” Menu 1: Non-vegetarian item menu;
Menu 2: 20% vegetarian item menu; Menu 3: 80% vegetarian item menu.
4.5.4 Intention
This research used the statement “How likely are you to dine in a restaurant with this
menu” to measure participants‟ intention of dining in a restaurant. They chose a number
from one (which represented for extremely unlikely) to seven (extremely likely).
Although no significant difference was found for the intention variable among the three
menus (Table 4.4), the restaurant with the 20% vegetarian item menu got the highest
mean score, followed by the 80% vegetarian item menu and the no vegetarian item menu.

50
50
It somewhat indicated that the respondents preferred some vegetarian items on the menu,
but too many would likely reduce their intention to dine in that restaurant.
To examine the predictive ability of the attitude, subjective norms, perceived behavior
control and past behavior on respondents‟ purchase intention, multiple linear regression
was performed. The results showed that attitude, subjective norms and PBC (B) were
very predictive of the respondents‟ intention of dining in the restaurant with a certain
menu for all of the three menus (Table 4.10). Hypotheses 4 and 5 were supported,
indicating attitude and subjective norm were appropriate factors for predicting customers‟
intention to dine in a restaurant with a vegetarian menu. Since there were two statements
measuring perceived behavior control and they could not compose a single variable with
a good internal consistency (Cronbach‟s Alpha=0.33), both of them were used in the
model for linear regression individually. Only PBC (B) was a significant factor
explaining respondents‟ intention of dining in a restaurant with the three menus, PBC (A)
was not a good predictor for all of the three menus. For past behavior, Hypothesis 7 was
only supported in the Menu 3 group, but was not supported by respondents from the
Menu 1 and Menu 2 groups; there was no correlation between their dining experience in
the past and their intention to dine in a certain restaurant based on the number of
vegetarian items on the menu.

51
51
Table 4.10
Linear Regression of Attitude, Subjective Norms, Perceived Behavior Control and Past
Behavior on Intention
Menu 1 Menu 2 Menu 3
Variables β SE P β SE P β SE P
Attitude 0.17 0.11 0.016* 0.22 0.10 0.0315* 0.26 0.12 0.0282*
SN 0.54 0.14 0.0002** 0.29 0.14 0.0421* 0.53 0.16 0.0015**
PBC (A) 0.17 0.10 0.0919 -0.05 0.09 0.5333 -0.14 0.13 0.2905
PBC (B) 0.33 0.13 0.0112* 0.30 0.10 0.0046** 0.42 0.13 0.0019**
PB 0.01 0.10 0.8933 -0.14 0.09 0.1215 -0.30 0.12 0.0128*
Note. R21=0.57; R
22=0.44; R
23=0.52. *Significant at the p<0.05 level. **Significant at the p<0.01
level. SN=Subjective Norm; PBC (A) =Perceived Behavior Control statement A; PBC (B)
=Perceived Behavior Control statement B;Perceived Behavioral Control (A) = “Whether
or not I dine in a restaurant with this menu is entirely up to me.” Perceived Behavioral
Control (B) = “I am confident that if I wanted to I could dine in a restaurant with this menu.”
Menu 1: Non-vegetarian item menu; Menu 2: 20% vegetarian item menu; Menu 3: 80%
vegetarian item menu.
4.5.5 Hypotheses Testing
According to Table 4.11, Hypotheses 1, 2, 4 and 5 were supported for all of the three
menu scenarios. Attitude, subjective norms and perceived behavioral control are useful
factors in predicting customers‟ intention of choosing a restaurant with menus including
vegetarian items. Hypotheses 1, 6 and 7 were only partly supported while Hypothesis 3
was not supported.

52
52
Table 4.11
Hypotheses Testing Results
Hypothesis Correlation Results
H1 BB---Attitude Supported
H2 NB---SN Supported
H3 CB---PBC Not supported
H4 Attitude---Intention Supported
H5 SN---Intention Supported
H6 PBC---Intention Partly Supported
H7 PB---Intention Partly Supported
Note. SN=Subjective Norm; PBC=Perceived Behavior Control; BB=Behavioral Beliefs;
NB=Normative Beliefs; CB=Control Beliefs.
4.6 Significant Relationship: Demographic and Variables
T-test and generalized linear model tests were performed to determine any significant
relationships between age, gender, income, education, against questions of preference and
intention. Only the relationship between gender and intention, age and attitude were
identified and will be discussed in the following sections.
4.6.1 Gender and Intention
T-test was used to test if the correlation between gender and intention was significant at a
95% confidence level. Table 4.12 demonstrates that only in the Menu 3 group was the
significance established. Females expressed a greater intention to dine in a restaurant
with Menu 3 than did males. No statistically significant difference was found between the

53
53
gender for Menu 1 and Menu 2 participants. The mean value of dining in a restaurant
with a no vegetarian item menu was 5.03 for the males but just 4.78 for females. When
female respondents answered the same question based on a menu with 20% vegetarian
items, the value increased to 5.08, similar to the males‟ score of 5.12. For a menu with 80%
vegetarian items, the mean value measuring females‟ intention to dine in the restaurant
increased to 5.29 while males dropped to 4.68 and the difference was significant,
indicating females preferred menus with more vegetarian items than males.
ANOVA analysis indicated a significant difference exited between Menu 3 and the other
two menu groups for female participants (p=0.0215). Females expressed a greater
intention to dine in restaurants with 80% vegetarian items on menus. In contrast, although
no significant difference was discovered for male participants, males were less likely to
dine in a restaurant with 80% vegetarian items on menus from the mean values.

54
54
Table 4.12
The Influence of Gender on Respondents’ Dining Intentions for Three Menus
Menu 1
(F=0.74; P=0.4634)
Menu 2
(F=0.13; P=0.8953)
Menu 3
(F=-2.01; P=0.0494)
Gender Lsmean Lsmean Lsmean
Male 5.03 5.12 4.68
Female 4.78b 5.08
b 5.29
a
Note. Menu 1: Non-vegetarian item menu; Menu 2: 20% vegetarian item menu; Menu 3: 80%
vegetarian item menu. Values are mean scores on a seven-point scale (1=extremely good/likely/agree, 7=extremely bad/unlikely/disagree).
4.6.2 Age and Attitude
The generalized linear model (GLM) analysis shown in Table 4.13 revealed that the
effect of age on attitude was significant only for respondents who completed the survey
based on Menu 3 (p=0.0097). The participants who were 60 and older had a more
favorable attitude towards menus with more vegetarian items, followed by participants
aged between 30 and 39 years.
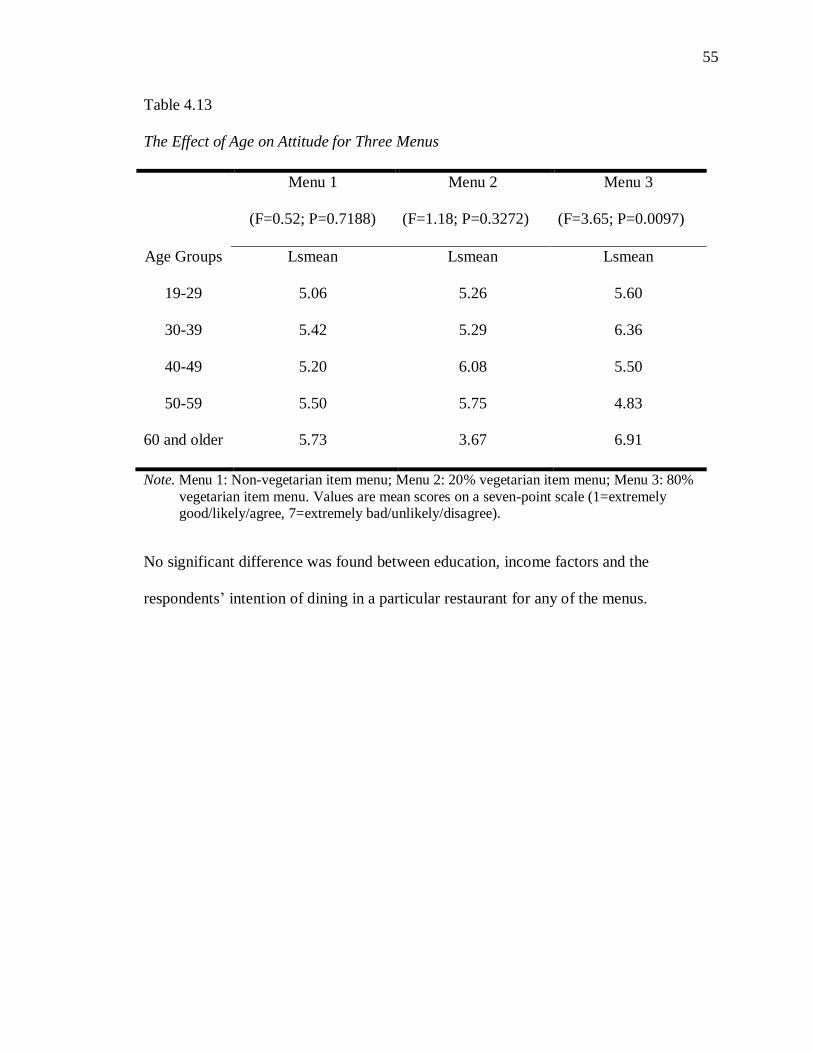
55
55
Table 4.13
The Effect of Age on Attitude for Three Menus
Menu 1
(F=0.52; P=0.7188)
Menu 2
(F=1.18; P=0.3272)
Menu 3
(F=3.65; P=0.0097)
Age Groups Lsmean Lsmean Lsmean
19-29 5.06 5.26 5.60
30-39 5.42 5.29 6.36
40-49 5.20 6.08 5.50
50-59 5.50 5.75 4.83
60 and older 5.73 3.67 6.91
Note. Menu 1: Non-vegetarian item menu; Menu 2: 20% vegetarian item menu; Menu 3: 80%
vegetarian item menu. Values are mean scores on a seven-point scale (1=extremely good/likely/agree, 7=extremely bad/unlikely/disagree).
No significant difference was found between education, income factors and the
respondents‟ intention of dining in a particular restaurant for any of the menus.

56
56
CHAPTER 5. CONCLUSION
5.1 Results of the Research Questions
This research sought to answer seven major research questions related to the effect of the
availability of vegetarian menu items on consumers‟ attitude, subjective norms, perceived
behavior control and intention of dining in a restaurant. Therefore, comparisons were
made on consumers‟ attitude, intentions and preferences among menus with a different
percentage of vegetarian items. Supplementary exploratory questions about people‟s
perception of vegetarian diets and vegetarian-friendly menus were asked to help provide
guidance for the foodservice businesses on how the varying levels of vegetarian items on
a menu will impact their market. In addition, beliefs that influence consumers‟ attitude,
subjective norms and perceived behavior control were assessed.
The research questions proposed in Chapter 2 include (1) Does the attitude of availability
of vegetarian menu items affect customers‟ purchase intention of the restaurant? (2) Do
other people‟s (friends, relatives etc.) opinions of availability of vegetarian menu items
affect customers‟ intention to dine in a particular restaurant? (3) Do their perceived
control factors influence customers‟ dining intention in a restaurant with a vegetarian
menu? (4) Does customers‟ past dining experience affect customers‟ purchase intention
of dinning in a restaurant with vegetarian menu? (5) Will a different percentage of

57
57
availability vegetarian menu items affect people‟s attitude, subjective norms and
behavioral intention towards dining in the restaurant? (6) What are consumers‟
perception of vegetarian diets and vegetarian food in a restaurant? (7) Does gender, age,
education or income have an influence on their attitude toward menus with vegetarian
items or their intention of dining in a restaurant with a vegetarian-friendly menu?
Research Question 1: Consumers‟ attitude towards the availability of vegetarian items on
a menu are reflected by three questions, inquiring consumers‟ perception of the
pleasantness, health and value of dining in a restaurant based on their reaction to menus
with differing percentages of vegetarian items. The likelihood of dining in a restaurant
was measured by using a seven-point Likert scale to assess consumers‟ intention to dine
in a restaurant. Multiple linear regression indicated that consumers‟ attitude affected their
intention of dining in a restaurant with a non-vegetarian menu, a 20% vegetarian menu
and even an 80% vegetarian menu. Hypothesis 4 stated that a positive attitude towards
vegetarian items on a menu will positively impact the subjects‟ intention to dine in a
restaurant with more vegetarian items on its menu is supported. More specifically,
consumers are more likely to dine in a restaurant if they believe the menu items including
vegetarian food will make their dining experience more pleasant, healthy and valuable. In
the present study, it is worth noting that the attitude dimension among study variables
was the key driver of behavioral intention. This finding, which aligned with previous
studies (Bansal & Taylor, 1999), implied that customers‟ favorable or unfavorable
evaluation of the vegetarian items on a menu is important in determining their intention
to dine in a restaurant with vegetarian-friendly menus. This finding can be used to guide

58
58
the development of efficient marketing strategies for restaurant operators. As noted
earlier, customers‟ attitude related to experience of dining in a restaurant with a particular
menu had a direct impact on their behavioral intention. Thus, for restaurant operators, it
would be effective to actively inform existing and potential customers about expected
enjoyable outcomes and positive enjoyable consequences of dining in their restaurants
(e.g. eating fresh and healthy foods, being more socially responsible and learning and
implementing healthy ideas in their own lives).
Comparative studies were carried out to determine whether the three components of the
attitude variable were statistically significant different among the three menus. The
results showed that consumers perceived menus with more vegetarian items as healthier.
But the pleasantness and value of dining in that restaurant were not significant different
among the three menus. Consumers perceive vegetarian food as healthy but did not
believe that it would make their dining experience significant more pleasant or provide a
greater value. Numerous consumer studies have pointed to the primary role of taste as a
factor that directs consumers‟ food choice in general (Grunert, Bech-Larsen & Bredahl,
2000; Richardson, MacFie & Shepherd, 1994; Urala & La hteenma ki, 2003). Consumers
may assume that because a food is described as “healthy” it will not taste good (Verbeke,
2006). So vegetarian items are perceived as healthy choices but not as a way to increase
the pleasantness of the dining experience. In addition, because the price was the same for
vegetarian and non-vegetarian menu items, participants did not associate an increase of
vegetarian items on the menu with being more economical. if consumers believe that the

59
59
taste of the food will be sacrificed to make it healthy and the price is not reduced, they
may not choose vegetarian food when dining out.
From the results of respondents‟ beliefs towards vegetarian items on a restaurant‟s menu,
to some extent they agree vegetarian food can help them live long and prevent diseases
but they did not think a vegetarian diet was associated with environment protection. This
finding is partly consistent with a previous study indicating that over half (53 percent) of
current vegetarians eat a vegetarian diet to improve their overall health and not out of
environmental concerns (Vegetarian Times, 2008). Simple linear regression indicated
that positive behavioral beliefs towards vegetarian items would positively impact the
subjects‟ attitude to dine in a restaurant with vegetarian items on its menu. From Ajzen‟s
study in 1991, people will have an attitude toward a phenomenon based on their overall
evaluation of their beliefs. Nutrition and health organization like the U.S. Food and Drug
Administration (FDA) and the Centers for Disease Control and Prevention (CDC) can
cooperate with educational institutions and medical institutions to enter into the
communities and public places to hold exhibitions and lectures, provide free
consultations, display instructional videos and distribute paper-based materials to educate
people about the benefits of having more vegetarian food in their daily diet. This action
may help generate positive beliefs towards vegetarian food including when dining in
restaurants. This will mean that restaurants offering more vegetarian items may be poised
to increase their market share if the anticipated shift in consumer beliefs occurs.

60
60
Research Question 2: The views of people who are important to participants and the
impacts of those views on the participants‟ dining intentions were measured by four
statements. The relationship between subjective norms and consumers‟ intention of
dining in a restaurant with vegetarian items on its menu was marginally significant.
Subjective norms proved to be a only a marginal predictor for consumers‟ intention of
dining in a restaurant with vegetarian items on its menu. Thus, while marketing and
public relations campaigns should be directed towards the general public with a goal of
forming a positive restaurant image among all members of the society, the greater impact
will be on the individual directly with only small impact resulting from a positive
influence can be exerted on potential consumers through subjective norm. Programs
which include roles of relevant others such as family members, friends and colleagues to
encourage individuals to participate in a restaurant vegetarian food promotion program
should be developed to help maximize subjective norm.
Research Questions 3 and 4: In terms of perceived behavior control, no significant
association was found between consumers‟ dining intention and their perceived behavior
control. Thus, the Hypothesis 6 that perceived behavior control has a positive impact on
the subjects‟ intention to dine in a restaurant with more vegetarian items on its menu was
not supported. Oh and Hsu (2001) indicated that because control beliefs measure
different aspects, they are often questioned. For example, in the context of dining in
restaurants with vegetarian-friendly menus, consumers may have the financial ability but
lack time for dining in a restaurant with vegetarian options. Other consumers may have
limited financial ability to dine in a restaurant but an ample amount of time for them to
61
61
dine there. Therefore, the control beliefs construct needs to be further explored to find a
more acceptable model for assessing the relationship between control beliefs and
perceived behavioral control.
Additionally, past behavior was proved to be significantly associated with consumers‟
dining intention only for the menu with 80% vegetarian item (Menu 3). Past behavior
was measured by consumers‟ frequency of dining out and their frequency of dining in a
restaurant where the meal cost is $12 and up. So consumers who often go out to eat and
spend more than $12 per meal are more willing to dine in the restaurant with a lot of
vegetarian items on its menu. Eating more often in restaurants was found to be positively
correlated with an increased BMI and decreased vegetable consumption (Roll, 2003).
People who often go out to eat may want to have more vegetarian choices to help keep
their BMI at health levels. Usually, vegetarian items have a similar or a slightly lower
price compared with meat items, some consumers may have thought vegetarian food was
overpriced. However, consumers who often spend $12 and up per meal may be better
able to afford the vegetarian items on their menu even if they were a little over priced
compared with meat items. Restaurant operators who are willing to add vegetarian items
on their menus should target consumers who dine out frequently and are willing to spend
more than 12 dollars for a meal. According to these results, menus with more vegetarian
items may be more suitable for full-service restaurants compared with fast-food
restaurants since consumers purchasing food in full-service restaurants frequently have
relatively stronger purchase ability.

62
62
Research Question 5: The findings of this study suggest that even though no significant
difference in consumers‟ dining intention was discovered between menus based on the
mean values for the question “How likely are you to dine in a restaurant with this menu?”,
people are slightly more likely to choose restaurants with 20% vegetarian items and 80%
meat items on its menu, followed by restaurants with 80% vegetarian items and 20%
meat items on its menu. It indicated that consumers would like some vegetarian items on
the menu. However, if the majority of the menu items were vegetarian, then the number
of consumers who are likely to dine in the restaurant decreases. The results showed that it
is good for restaurant operators to include some vegetarian items in their menus but not
too much. The exact amount is likely to depend on restaurant type.
As stated earlier, consumers‟ beliefs, attitude and perceived social beliefs towards the
three different menus were significant different. . The results indicate that consumers
perceived the menu with a majority of vegetarian items was significantly healthier than
the menu with no or few vegetarian items. But no significant difference was discovered
between the non-vegetarian item menu and the 20% vegetarian item menu in terms of
consumers‟ dining beliefs. In terms of consumers‟ beliefs and attitude, adding a few
vegetarian items on menus would not influence their perception of the health value of
dining in the restaurant, but when the percentage of vegetarian items increased to 80%,
consumers had a strong sense that it was a healthy menu. Based on this result, there
would be two marketing strategies for restaurant operators. If their target market is
consumers who pay more attention to the taste of food and are meat lovers, restaurants
may include no more than 20% vegetarian items on their menus since some people
63
63
assume that healthy food tastes bad (Verbeke, 2006). For those restaurants who target
consumers who are health conscious and do not mind spending more on healthy food, a
menu with up to 80% vegetarian items may attract them and increase revenue for the
restaurant.
Research Question 6: Measured by a seven-point Liket scale, more than two thirds of the
participants (71%) consumers rated vegetarian food as healthy choices. When asked
about the perception of having an appropriate balance of vegetarian food and non-
vegetarian food, over half of the participants scored it as “very good” and “good”.
Compared with consumers‟ realization of the benefits of vegetarian food, only 41% of the
respondents reported eating vegetarian when dining in restaurants as “good” and “very
good”. This phenomenon can be plausibly explained in that consumers already know the
importance of vegetarian food but when they dine out in restaurants, meat dishes would
be their first choices, likely related to their taste preferences and the fact that many
restaurants‟ famous dishes are meat items.
Research Question 7: The results demonstrated that females are more likely to dine in a
restaurant with more vegetarian food available on the menu, which was consistent with
the survey conducted by Vegetarian Times in 2008. That study found that 59 percent of
the vegetarians were female. The results from other previous studies have found that
female have higher positive attitudes and intentions for eating a healthful diet compared
to males (Glanz et al., 1994). The effect of age on consumers‟ dining attitude was also
found to be significant. Consumers who were 60 years and older were more interested in

64
64
menus with more vegetarian items. This can be explained by a previous study that found
that older people tended to pay more attention to the nutrient content when selecting food,
compared with younger people (He, Fletcher & Rimal, 2004). However, people aged
between 30 and 39 years were found to have a second most favorable attitude towards
menus with more vegetarian items. The reason for this group willing to see increased
numbers of vegetarian items on the menu was not readily apparent. Other demographic
factors such as income and education were found to have no impact on people‟s dining
attitudes or intentions related to menus with vegetarian options. Based on the results of
this study, male consumers between the ages of 20 and 29 or 40 and 59 years may be at a
risk of not consuming enough vegetarian food in their diets. While nutrition and public
health groups should target educational materials at those populations, there may not be a
lot to gain by restaurants spend much of their marketing dollars promoting vegetarian
food items to those populations. In contrast, marketing vegetarian-friendly menus to
senior females is more likely to have a positive effect on a restaurant‟s patronage.
5.2 Implication and Application
Although a lot of studies have been done on healthy diets and the impact of nutrition
information and nutrition labeling on consumers‟ intentions and food choices in
restaurants, few research studies have looked at how vegetarian food influence customers‟
dining intentions and behaviors. This research tried to fill the gap in previous analyses by
focusing on the characteristics of vegetarians and vegetarian recipes. This study also
evaluated consumers‟ perception about the availability of vegetarian menu items and how
it affects consumers‟ attitude, subjective norms, perceived behavior control and intention

65
65
of dining in the restaurant. In addition, this study tried to determine the impact of a
different percentage of vegetarian items on menus on dining intentions. Although this
research is exploratory, it broadens researchers‟ horizons beyond nutrition information to
another promising area of research and provides a basis for future explorations in this
field.
Another theoretical contribution of this research is that it applied the theory of planned
behavior in restaurants with vegetarian menus and proved that the theory could explain
consumers‟ intention of dining in a restaurant with a vegetarian menu by attitude,
subjective norms and past behavior.
In addition to the theoretical contribution, this research also has significant implication in
regards to practical applications. The necessity of vegetarian items on restaurants‟ menus
was supported in this research by the comparison of different percentage of vegetarian
menu items. This study found that the appropriate percentage of vegetarian items on
restaurants‟ menus is between 20% and 80%. Based on these results, restaurants may
wish to adjust their menu design strategies to provide a few more vegetarian options.
These endeavors would mutually benefit the restaurants and consumers by endowing
customers with the ability to make wiser choices while building a healthier, more reliable
and responsible image for the restaurants.
The 2010 dietary guidelines for Americans suggest that people should consume more
fruits, vegetables and whole grains (Department of Human and Health Services, 2010).

66
66
The results of this study showed that although the perception of importance of consuming
more vegetarian food is high and the attitude towards eating vegetarian dishes in
restaurants is favorable, this did not necessarily translate in to behavioral intentions.
While it is important for the public health professionals to educate consumers through
nutrition education programs or media in order for them to have a better understanding of
vegetarian food and the relationship between dietary intake and the risk of associated
chronic diseases, this may not be enough. People need to be convinced that vegetarian
entrée are just and pleasurable to consume as their meat counterparts. The main entrée or
famous dishes in many restaurants are meat items except for pure vegetarian restaurants.
This indicates that many restaurants recognize that the majority of their customers prefer
the taste of meat. However, while many customers may prefer meat, they are also
looking favorably on vegetarian items. This is clear by participants‟ selection of a menu
with at least 20 percent vegetarian items over a menu with no vegetarian items. So
operators of restaurants should include not only vegetarian items on their menu but also
improve their cuisine to provide special and delicious vegetarian entrees, attracting new
vegetarian consumers without losing any regular consumers. However this may not be
enough, creative pricing may be required to get consumers to try vegetarian entrees in the
first place.
In terms of marketing, restaurants operators should have different marketing strategies
towards specific market segments. This research found that female consumers tend to
prefer more vegetarian items when dining out, senior consumers have the stronger
intention to choose a restaurant with more vegetarian items compared with young people.

67
67
The relationship between participants‟ past behavior and their dining intention indicated
that consumers who dine out frequently and spent more on each meal are willing to dine
in a restaurant with more vegetarian items on its menus. So restaurants operators should
train their servers to recommend vegetarian items to their loyal consumers who spend
more than $12 per meal and preferred healthy items based on their previous history with
the restaurant.
5.3 Limitation
First, restricted by time and financial concerns, the study sample was a convenience
sample which was not randomly selected or stratified. The place where the survey
conducted was located on the campus of Purdue University, although the data was
collected during open campus period, a majority of the participants was primarily
comprised of university students, faculty and staff. This resulted in a severely skewed
distribution of education level and income. More than 80% of respondents held at least a
college degree (n=169), nearly 20% percent of the respondents had a doctor‟s degree.
Additionally, the age distribution of the sample was also skewed with 62% respondents in
the 19-29 year age group, and only 22 (10.6%) respondents were older than 50. Since a
lot of students filled out the survey, 68.4% respondents report an annual income below
$30,000. While still a valid study of an important demographic, the skewed demographic
characteristics of the research sample reduced the applicability of the results to the
general population.
Non-vegetarian data were collected on the campus of Purdue University while the
vegetarian sample were solicited through the Indiana Vegetarian Association by sending

68
68
survey links in emails. Distinct data sources may generate inconsistent data. Only 19
vegetarians participant in this research is not enough to represent the vegetarian group.
Due to the small vegetarian sample size, no analyses between vegetarian and non-
vegetarian people were conducted.
Secondly, consumers‟ attitude, preference and intention of dining in a restaurant were
measured based on three menus that were non-vegetarian menu, 20% vegetarian menu
and 80% vegetarian menu. Only ten entrées were displayed on each menu and the items
were chose from menus of chain restaurants Applebee and Chili‟s Grill. The vegetarian
items were selected from a magazine called EatingWell. Respondents‟ perception may
not be sufficient to reflect the effects of the availability of vegetarian items, because they
may just enjoy a certain kind of food or even a cooking method like barbecue that was
not represented on any of the menus. Additionally, ten entrées without appetizer, dessert
and sides meant the menus did not give participants a complete picture of each restaurant.
Further, the fact that only non-vegetarian menu, 20% vegetarian menu and 80%
vegetarian menu were used in the survey, made it impossible to determine the optional
levels of vegetarian items restaurant menus. The results may not be applied to other
menus such as ethnic or quick-service restaurants since the menus used in this study were
designed based on menus of full-service restaurants. Because this study was not carried
out in an actual restaurant, other important elements in actual restaurants were not
included. This severely limited the researchers‟ ability to measure control belief and
behavior.

69
69
Statements assessed the variables from the theory of planned behavior were drawn out
from relevant literature. No pilot study was done to test the reliability and validity of the
questionnaire before the general study. While the results indicated that most of the factors
were properly measured, perceived behavior control and control beliefs had low
Cronbach‟s Alphas and therefore could not be combined into a single variable. Therefore,
the reliability all factors could not accurately be assessed.
Furthermore, the theory of planned behavior has its own limitations. The theory of
planned behavior is better at predicting deliberate behaviors, which are conscious and
planned. However, eating behavior is not as cognitive and rational as other behavior;
instead, people‟s food choices in daily life are often unconscious, emotional, or even
impulsive, and can be affected unconsciously by a lot of psychological factors such as
environmental influences, personality, feelings, emotional factors, etc. (Barker & Swift,
2009). A majority of people perceived vegetarian food as healthy choices, so dining in a
restaurant with vegetarian menu seems a kind of health related behavior. Given that most
individuals' health behaviors are influenced by their personal emotion and affect-laden
nature, this is a decisive drawback for predicting health-related behaviors by using theory
of planned behavior. (Dutta-Bergman, 2005) Additionally, while the theory of planned
behavior model does consider normative influences, it still does not take into account
environmental or economic factors that would definitely influence people‟s eating
behavior.

70
70
5.4 Suggestions for Future Research
As discussed in limitation section, due to the deficiency of the theory of planned behavior,
future research investigating people‟s dinning behavior should include more factors such
as environmental factors, emotional status and physiological effects like satiety, hunger
and appetite, etc. into account. Other theories from sociology or psychology fields may
be applied to explain the variance in eating behavior with vegetarian diets and vegetarian-
friendly menus.
The effect of the availability of vegetarian menu items on consumers‟ food choices is also
underscored by the underlying complexity of people‟s dining intention. As discussed
earlier, people‟s daily food choices are not completely rational and could be affected by
many factors unconsciously (Barker & Swift, 2009; Chadwick, Crawford, & Ly, 2013;
Jacquier, Bonthoux, Baciu & Ruffieux, 2012); sometimes people are not even aware of
the decisions they make about what to eat (Sobal & Wansink, 2007). Thus, the effects of
different percentages of vegetarian items on restaurants‟ menus on people‟s dinning
intention might not only be attributed to the changes in people‟s cognitive beliefs due to
the provided information. Future researches could further explore how other factors like
the formats and description of the vegetarian menu items, the price comparison of
vegetarian and non-vegetarian items influence consumers‟ dining intention.
Adding more menu items including appetizer, dessert and sides would be helpful to
improve the diversity of the menu and make the menu more realistic for consumers‟ meal
selection. If studies can be carried out in a realistic restaurant setting, the effects of

71
71
providing vegetarian items on the menu on consumers‟ preference, intention and even
real behavior can be tested by using various menus at different meal times such as lunch
and dinner. Future research could also be conducted in many types of restaurant settings;
for example, fast-food restaurants, fine-dining restaurants and various ethnic restaurants.
If future studies are carried out in an actual restaurant, consumers‟ dining behavior can be
tested instead of only their behavioral intentions. Consumers‟ dining behavior can be
measured by tracking their ordering items and how much they spend on vegetarian items.
Different ethnic restaurants have different percentage of vegetarian food on their menus.
For example, Mexican restaurants provide bean-based dishes and most of them are
vegetarian. Future studies can investigate the appropriate percentage of vegetarian menu
items in different ethnic restaurants. The future study can also be designed to test the
impact of availability of vegetarian items and pricing strategies and to examine the
combined and incremental impact of each component on the purchase of vegetarian foods
in a restaurant. It would also be interesting for future research to examine and compare
the effects of more kinds of vegetarian and non-vegetarian item combination on menus,
which can help restaurant operators develop attractive menu items with vegetarian food,
and formulate appropriate marketing and operation strategies to meet the market needs.
According to a research conducted by Gallup‟s poll in 2012, about 6 percent of U.S.,
adults considering themselves as vegetarians. Future research focused more on people
who follow a vegetarian-inclined diet can be used as a comparison study between the
perception and preference of vegetarian consumers and those of non-vegetarian

72
72
consumers. The results may help restaurant enrich their menus and improve marketing
strategies to attract more vegetarians without losing non-vegetarian consumers.
Future research can also be done to double check the effect of perceived behavior control
on consumers‟ dining intention with vegetarian menus by using more organized and
comprehensive series of questions focusing on every aspects of perceived behavior
control factors instead of only two questions as was used in this research.

REFERENCES

73
73
REFERENCES
Allison, D.B., Faith, M.S., & Heo, M. (2003). Hypothesis concerning the U-shaped
relation between body mass index and mortality. American Journal of Epidemiology,
146, 339-349.
Ajzen, I., Czasch, C., & Flood, M. G. (2009). From intentions to behavior
implementation intention, commitment, and conscientiousness. Journal of Applied
Social Psychology, 39(6), 1356–1372.
Ajzen, I., & Fishbein, M. (1980). Understanding attitudes and predicting social behavior.
Englewood Cliffs. NJ: Prentice-Hall.
Ajzen, I. (1991). The theory of planned behavior. Organizational Behavior and Human
Decision Processes, 50, 179-211.
Ajzen‟s Official Website. (2013). Icek Ajzen. Retrieved from
http://people.umass.edu/aizen/.
American Dietetic Association. (2009). Position of the American Dietetic Association:
vegetarian diets. Journal of the American Dietetic Association 2009,109, 1266-1282.
American Dialect Society. (2004). 2003 words of the year. Retrieved from
http://www.americandialect.org/2003_words_of_the_year
Ammerman, A. S., Leung, M. M., & Cavallo, D. (2006). Addressing disparities in the
obesity epidemic. North Carolina Medical Journal, 67(4), 301-304.
Antun, J. M., & Gustafson, C. (2005). Menu success: a menu analysis of awarded fine
dining restaurants and private clubs. Journal of Culinary Science and Technology,
4(4), 51-66.
Armitage, C. J., & Conner, M. (1999). Distinguishing perceptions of control from self-
efficacy: Predicting consumption of a low-fat diet using the theory of planned
behavior. Journal of Applied Social Psychology, 29(1), 72-90.
Baker, E.A., Schootman, M., Barnidge, E., & Kelly, C. (2006).The role of race and
poverty in access to foods that enable individuals to adhere to dietary guidelines.
Preventing Chronic Disease, 76, 15-26.
Bansal, H. S., & Taylor, S. F. (1999). Beyond service quality and customer satisfaction:
investigating additional antecedents of service provider switching intentions.
Academy of Marketing Science, 75-82.

74
74
Barker, M., & Swift, J. A. (2009). The application of psychological theory to nutrition
behaviour change. Proceedings of the Nutrition Society, 68(2), 205-209.
Barnard, N.D., Scialli, A.R., & Bertron, P. (2000). Effectiveness of a low- fat vegetarian
diet in altering serum lipids in healthy premenopausal women. The American Journal
of Cardiology, 85 (8), 969-972.
Berkoff, N. (2004). Meatless for diabetics. Foodservice Director, 32.
Berkow, S. E., & Barnard, N. D. (2006). Blood pressure regulation and vegetarian diets.
Nutrition Reviews, 63(1), 1-8.
Blue, C. L. (2007). Does the theory of planned behavior identify diabetes-related
cognitions for intention to be physically active and eat a healthy diet? Public Health
Nursing, 24, 141–150.
Chadwick, P. M., Crawford, C. & Ly, L. (2013). Human food choice and nutritional
interventions. Nutrition Bulletin, 38(1), 36-42.
Cheng, S., Lam, T., & Hsu, C, H. C. (2005a). Negative word-of-mouth communication
intention: an application of the theory of planned behavior. Journal of Hospitality &
Tourism Research, 30(1), 95-116.
Cheng, S., Lam, T., & Hsu, C. H.C. (2005b). Testing the sufficiency of the theory of
planned behavior: a case of customer dissatisfaction responses in restaurants.
International Journal of Hospitality Management, 24 (4), 475–492.
Cobe, P. (2003). Power plants. Restaurant Business, 102(18), 38-43.
Conner, M, & Abraham, C. (1998). Conscientiousness and the theory of planned
behavior: towards a more complete model of the antecedents of intentions and
behavior. Personality and Social Psychology Bulletin, 27(11), 1547-1561.
Dayan, E., & Bar-Hillel, M. (2011). Nudge to nobesity II: Menu positions influence food
orders. Judgment and Decision Making, 6(4), 333-342.
De Castro, J. M. (1994). Family and friends produce greater social facilitation of food
intake than other companions. Physiology & Behavior, 56(3), 445-455.
Demographic and Health Survey (2003). Department of Health, online. Retrieved from
http://www.doh.gov.za/facts/index.html/.
Diliberti, N., Bordi P.L., & Conklin M.T. (2004). Increased portion size leads to increased
energy intake in a restaurant meal. Obesity Research, 12, 562–568.

75
75
Dutta-Bergman, M. J. (2005). Theory and practice in health communication campaigns: a
critical interrogation. Health Communication, 18(2), 103-122.
Edwards, J. S. A., Engström, K., & Hartwell, H. J. (2005). Overweight, obesity and the
food service industry. Food Service Technology, 5, 85–94.
Engel, J. M. (2004). Taking hunger seriously. Croatian Journal of Philosophy, 4(10), 29-
57.
Finkelstein, E. A., Trogdon, J. G., Cohen, J. W., & Dietz, W. (2009). Annual medical
spending attributable to obesity: payer- and service-specific estimates. Health Affairs,
28(5), 822-831.
Flegal, K.M., Carroll, M.D., Ogden, C.L., & Johnson, C.L. (2010). Prevalence and trends
in obesity among US adults, 1999-2008. The Journal of American Medical
Association, 288(14), 1723-1727.
Food and Drug Administration. (2011). Food labeling: nutrition labeling of standard
menu items in restaurants and similar retail food establishments notice of proposed
rulemaking. Retrieved from
http://www.fda.gov/downloads/Food/IngredientsPackagingLabeling/UCM249276.pdf
Fraser, G. E. (1999). Associations between diet and cancer, ischemic heart disease, and
all-cause mortality in non-Hispanic white California Seventh-day Adventists.
American Journal of Clinic Nutrition, 70, 532-538.
Frei, B. T. (1995). The menu as money maker. Restaurants and Institutions, 105(6),
144-145.
Glanz, K., Patterson, R. E., Kristal, A. R., DiClemente, C. C., Heimendinger, J., Linnan,
L., & McLerran, D. F. (1994). Stages of Change in Adopting Healthy Diets: Fat,
Fiber, and Correlates of Nutrient Intake. Health Education & Behavior, 21(4), 499-
519.
Gifford, K.D. (2002). Dietary fats, eating guides and public policy: history, critique and
recommendations. American Journal of Medicine, 113, 89–106.
Gilliver, D. (2004). Obesity: „we‟re working on it‟, promises industry. Public Health
News, 12, 1.
Grotz, V. L. (2006). A look at food industry responses to the rising prevalence of
overweight. Nutrition Reviews, 64(2), 48-52.

76
76
Grunert, K. G., Bech-Larsen, T., & Bredahl, L. (2000). Three issues in consumer quality
perception and acceptance of dairy products. International Dairy Journal, 10, 575-
584.
Guthrie, J. F., Lin, B. H., & Frazao, E. (2002). Role of food prepared away from home in
the American diet, 1977-78 versus 1994-96: changes and consequences. Journal of
Nutrition Education Behavior, 34, 140-150.
Hana, H., & Kimb, Y. (2010). An investigation of green hotel customers‟ decision
formation: Developing an extended model of the theory of planned behavior.
International Journal of Hospitality Management, 29(4), 659–668.
Hankinsa, M., Frencha, D., & Hornea, R. (2000). Statistical guidelines for studies of the
theory of reasoned action and the theory of planned behavior. Psychology & Health,
15(2), 151-161.
Health magazine. (2008). Healthiest Chain Restaurant in America. Retrieved from
http://www.health.com/health/article/0,,20410143,00.html.
Herman, C. P., Roth, D.A., & Polivy, J. (2003). Effects of the presence of others on food
intake: a normative interpretation. Psychological Bulletin, 129(6), 873-886.
He, S., Fletcher, S., & Rimal, A. (2004). Nutrition consideration in food choice. Journal
of Food Distribution Research, 35(1), 124-126.
Hill, M. (2011). Vegan diets no longer on the fringe. Retrieved from
http://www.suntimes.com/lifestyles/food/3242660-423/vegan-diet-veganism-vegans-
meat.html.
Hirschler, C. A. (2008). An examination of vegans‟ beliefs and experiences using critical
theory and auto ethnography (Doctor‟s Dissertation).
Hsu, C. H. C., & Huang, S. (2012). An extension of the theory of planned behavior model
for tourists. Journal of Hospitality & Tourism Research, 36(3), 390-417.
Huchting, K., Lac, A., & LaBrie, J. W. (2008). An application of the theory of planned
behavior to sorority alcohol consumption. Addictive Behaviors, 33(4), 538–551.
Hwang, J., & Lorenzen, C. L. (2008). Effective nutrition labeling of restaurant menu and
pricing of healthy menu. Journal of Foodservice, 19(5), 270–276.
Jacquier, C., Bonthoux, F., Baciu, M., & Ruffieux, B. (2012). Improving the effectiveness
of nutritional information policies: Assessment of unconscious pleasure mechanisms
involved in food-choice decisions. Nutrition Review, 70(2), 118-131.

77
77
Janda, S., & Trocchia, P.J. (2001). Vegetarianism: Toward a greater understanding.
Psychology & Marketing, 18(12), 1205-1240.
Jastran, M. M., Bisogni, C. A., Sobal, J., Blake, C., & Devine, C. M. (2009). Eating
routines: Embedded, value based, modifiable, and reflective. Appetite, 52(1), 127-
136.
Kearney, J.M., Hulshof, K.F., & Gibney, M.J. (2001). Eating patterns--temporal
distribution, converging and diverging foods, meals eaten inside and outside of the
home implications for developing FBDG. Public Health Nutrition, 4(2B), 693-698.
Kellar, I., & Abraham, C. (2005). Randomized controlled trial of a brief research-based
intervention promoting fruit and vegetable consumption. British Journal of Health
Psychology, 10, 543–558.
Kline, P. (1999). The handbook of psychological testing (2nd ed.). London: Routledge.
Kiran, R., Ramnath, V., Khushiani, K., & Singh. P. P. (1994). Iron deficiency and anemia
in vegetarian mothers and their newborns. Indian Journal of Clinical Biochemistry,
9(2), 100-102.
Kivela, J. (2003). Results of a qualitative approach to menu planning using control and
experimental groups. Journal of Foodservice Business Research, 6(4), 43-65.
Koletzko,B., Cooper, K., Makrides, M., & Uauy, R. (2008). Pediatric nutrition in
practice. New York, NY: Nestle Nutrition Institute.
Kozup, J. C., Creyer, E. H., & Burton, S. (2003). Making healthful food choices: the
influence of health claims and nutrition information on consumers' evaluations of
packaged food products and restaurant menu items. Journal of Marketing, 67, 19-34.
Kuhn, K. (2006). A minute on the clock: Simon Rimmer. Caterer & Hotelkeeper.
196(4453), 9.
Labensky, S., Ingram, G. G., & Labensky, S. R. (2001). Webster's new world dictionary
of culinary arts. New York, NY: Prentice Hall.
Lachat, C., Nago, E., Verstraeten, R., Roberfroid, D., Van Camp, J., & Kolsteren, P.
(2012). Eating out of home and its association with dietary intake: a systematic
review of the evidence. Obesity Reviews, 13, 329–346.
Lien, C., Huang, C., & Chang, H., (2012). The influence of green consumption cognition
of consumers on behavioral intention - A case study of the restaurant service industry.
African Journal of Business Management, 6 (26), 7888-7895.

78
78
Linderman, M., & Vaananen, M. (2000). Measurement of ethical food choice motives.
Appetite, 34, 55-59.
Lydecker, T. (1998).Veg out. Restaurant Business, 97(5), 68-74.
Marshall, D., & Bell, R. (2003). Meal construction: exploring the relationship between
eating occasion and location. Food Quality and Preference, 14, 53–64.
Masalu, R. M., & Astrøm, A. N. (2003). The use of the theory of planned behaviour to
explore beliefs about sugar restriction. American Journal of Health Behavior, 27, 15–
24.
Matthiessen, J., Fagt, S., Biltoft-Jensen, A., Beck, A. M., & Ovesen, L. (2002). Size
makes a difference. Public Health Nutrition, 6(1), 65–72.
Maurer, D. (2002). Vegetarianism, movement of moment? Philadelphia: Temple
University Press.
Meng, J. (2009). Origins of attitudes towards animals. (Unpublished doctoral
dissertation). The University of Queensland, Australia.
Messina, F., Saba, A., Vollono, C., Leclercq, C., & Piccinelli, R. (2004). Beliefs and
attitudes towards the consumption of sugar-free products in a sample of Italian
adolescents. European Journal of Clinical Nutrition, 58, 420–428.
Miller, K. (2005). Communications theories: perspectives, processes, and contexts. New
York, NY: McGraw-Hill.
Mill, R. C. (2001). Restaurant management. Upper Saddle River, NJ: Prentice-Hall.
Miner, T. (1996). Customer focused menu marketing. Cornell Hotel & Restaurant
Administration Quarterly, 37(3), 36-42.
Mintel International Group Limited. (2007). Vegetarian foods. Chicago, IL: Mintel
International Group Limited.
National Restaurant Association. (2011). What‟s hot in 2011. Retrieved from
http://www.restaurant.org/Home.
National Restaurant Association. (2012). Restaurant industry operations report. Retrieved
from http://www.restaurant.org/News-Research/Research/Operations-Report.
Newport, F. (2012). In U.S., 5% consider themselves vegetarians. Retrieved from
http://www.gallup.com/poll/156215/Consider-Themselves-Vegetarians.aspx.

79
79
Oh, H., & Hsu, C. H. C. (2001). Volitional degrees of gambling behaviors. Annals of
Tourism Research, 28(3), 618-637.
Ornish, D. (1996). Dr. Dean Ornish‟s program for reversing heart disease. New York: Ivy.
Perry, C.L., McGuire, M.T., Neumark-Sztainer, D., & Story, M. (2001). Characteristics of
vegetarian adolescents in a multiethnic urban population. Journal of Adolescent
Health, 29, 406-416.
Persky, V. W., Chatterton, R. T., Van Horn, L. V., Grant, M.D., Langenberg, P., & Marvin,
J. (1992). Hormone levels in vegetarian and non-vegetarian teenage girls: potential
implications for breast cancer risk. The Journal of Cancer Research, 52, 578-587.
Perugini, M., & Bagozzi, R. P. (2001). The role of desires and anticipated emotions in
goal-directed behaviours: Broadening and deepening the theory of planned behavior.
British Journal of Social Psychology, 40(1), 79–98.
Pi-Sunyer, F.X. (1999). Medical hazards of obesity. Annuals of Internal Medicine, 119,
655-660.
Pribis, P., Pencak, R. C., & Grajales, T. (2010). Beliefs and attitudes toward vegetarian
lifestyle across generations. Nutrients, 2, 523-531.
Pulos, E. & Leng, K. (2010). Evaluation of a voluntary menu-labeling program in
full-service restaurants. American Journal of Public Health, 100(6), 1035-1039.
Quellette, J. A., &Wood, W. (1998). Habit and intention in everyday life: The multiple
processes by which past behavior predicts future behavior. Psychological Bulletin,
124(1), 54-74.
Richardson, N., MacFie, H., & Shepherd, R. (1994). Consumer attitudes to meat eating.
Meat Science, 36 (1/2), 57-65.
Radhika, G., Sudha, V., Sathya, R.M., Ganesan, A., & Mohan, V. (2008). Association of
fruit and vegetable intake with cardiovascular risk factors in urban south Indians.
British Journal of Nutrition, 99, 398–405.
Remera, T., Neuberta, A., & Manza, F. (1999). Increased risk of iodine deficiency with
vegetarian nutrition. British Journal of Nutrition, 81(1), 45-49.
Rolls, B.J., Roe, L.S., Kral, T.V.E., Meengs, J.S., & Wall, D.E. (2004). Increasing the
portion size of a package snack increases energy intake in men and women. Appetite
42, 63–69.
80
80
Rolls, B.J. (2003). The supersizing of America: portion size and the obesity epidemic.
Nutrition Today, 38, 42–53.
Rozin, R. P., & Vollmecke, T. A. (1986). Food likes and dislikes. Annual Review of
Nutrition, 6, 433-456.
Russo, J. E. (1977). The value of unit price information. Journal of Marketing Research,
14(2), 193-201.
Sheppard, B.H., Hartwick, J. & Warshaw, P.R (1988). The theory of reasoned action: A
meta-analysis of past research with recommendations for modifications and future
research. Journal of Consumer Research, 15, 325–343.
Shani, A., & DiPietro, R. B. (2008). Vegetarians: a typology for foodservice menu
development. FIU Review, 25(2), 66-73.
Sobal, J., & Wansink, B. (2007). Kitchenscapes, tablescapes, platescapes, and
foodscapes: influences of microscale built environments on food intake. Environment
and Behavior, 39, 124-142.
Shock, P. J., Bowen, J. T., & Stefanelli, J. M. (2004). Restaurant marketing for owners
and managers. Hoboken, NJ: John Wiley & Sons.
Singh, P.N., Sabate, J., & Fraser, G.E. (2003). Does low meat consumption increase life
expectancy in humans? The American Journal of Clinical Nutrition, 78 (3), 526-532.
Sonnenberga, L., Gelsomina, E., Levyb, D. E., Riisc, J., Barracloughd, S., & Thorndikee,
A. N. (2013). A traffic light food labeling intervention increases consumer awareness
of health and healthy choices at the point-of-purchase. Preventive Medicine, 57(4),
253–257.
Stroebele, N., & De Castro, J. M. (2004). Effect of ambience on food intake and food
choice. Nutrition, 20(9), 821–838.
Tabacchi, M. (2006). Attract new vegetarian and health-conscious diners with flavorful,
meat-free menu items. Nadon's Restaurant News, 18.
Tangari, A. H., Burton, S. Howlett, E. Cho, Y., & Thyroff, A. (2010). Weighing in on fast
food consumption: the effects of meal and calorie disclosures on consumer fast food
evaluations. The Journal of Consumer Affairs, 44(3), 431-462.
Thorogood, M., Mann, J., Appleby, P., & Mcpherson, K., (1994). Risk of death from
cancer and ischaemic heart disease in meat and non-meat eaters. British Medical
Journal, 308, 1667-1670.

81
81
Urala, N., & La¨hteenma¨ ki, L. (2004). Attitudes behind consumers‟ willingness to use
functional foods. Food Quality and Preference, 15, 793–803.
U.S. Department of Health & Human Services, U.S. Department of Agriculture (2005).
Dietary Guidelines for Americans, 2005. Retrieved from
http://www.health.gov/dietaryguidelines/dga2005/document/default.htm
U.S. Department of Health & Human Services, U.S. Department of Agriculture (2010).
Dietary Guidelines for Americans, 2010. Retrieved from
http://www.health.gov/dietaryguidelines/2010.asp
Vegetarian Consumer Trends Report. (2005). Cultivate research. Retrieved from
www.cultivateresearch.com.
Vegetarian Resource Group. (2009). How many vegetarians are there? Retrieved from
http://www.vrg.org/press/2009poll.htm.
Vegetarian Times. (2008). Vegetarianism in American. Retrieved from
http://www.vegetariantimes.com/article/vegetarianism-in-america/.
Vegetarian Times. (2013). Vegetarianism in American. Retrieved from
http://www.vegetariantimes.com/article/vegetarianism-in-america/.
Venderley, A. M., & Campbell, W.W. (2006). Vegetarian diets nutritional considerations
for athletes. British Journal of Sports Medicine, 36 (4), 293-305.
Verbeke, W. (2006). Functional foods: Consumer willingness to compromise on taste for
health? Food Quality and Preference, 17(1-2), 126–131.
Wansink, B., Painter, J.M., & Van Ittersum, K. (2001). Descriptive menu labels‟ effect on
sales. Cornell Hotel and Restaurant Administrative Quarterly, 42(6), 68-72.
Weiss, R., Fogelman, Y., & Bennett, M. (2004). Severe vitamin B12 deficiency in an
infant associated with a maternal deficiency and a strict vegetarian diet. Journal of
Pediatric Hematology/Oncology, 26(4), 270-271.
World Animal Foundation. (2007). Vegetarianism. Retrieved from
http://worldanimalfoundation,homestead,com/FACT_SHEET_Vegetarianism,pdf.
World Health Organization. (2012). Obesity and overweight. Retrieved from
http://www.who.int/mediacentre/factsheets/fs311/en/index.html
Yamamotoa, J. A., Yamamotob, J. B., Yamamotob, B. E., & Yamamoto, L. G. (2005).
Adolescent fast food and restaurant ordering behavior with and without calorie and
fat content menu information. Journal of Adolescent Health, 37, 397–402.

82
82
Yee, L. (2004). Meatless manifesto. Restaurants & Institutions, 31-34.
Young, L. R., & Nestle, M. (2002). The contribution of expanding portion size to the U.S.
obesity epidemic. American Journal of Public Health, 92 (2), 246-249.

APPENDICES

83
83
Appendix A Introduction for Participants
Purpose of Research
The purpose of this study is to find out how the availability of vegetarian menu items
affects customers‟ behavioral intention.
Specific Procedures
Step 1, you will be presented a menu and be asked to choose an entree you would likely
order based on this menu.
Step 2, you then will be asked to circle the number from 1-7 that best represents how you
feel about this menu for each statement.
Step 3, you will be asked for some demographic information only includes gender, age,
vegetarian status, income and education.
Duration of Participation
The research may take up to 10 minutes.
Risks
The research is minimal risk, which means it is no greater than you would encounter in
daily life. However, breach of confidentiality is a risk because it is an on-line survey and
the safeguards used to minimize this risk can be found in the confidentiality section.
Benefits
There are no direct benefits to individuals, but your participation is very important to
society. This research may be able to help restaurants develop their competitive
advantages in their industry.
Compensation
You can choose a small gift including a pen or a cookie.
Confidentiality
The project's research records may be reviewed by departments at Purdue University
responsible for regulatory and research oversight. The survey is totally anonymous and
all data will be reported in aggregate form to protect participants‟ privacy. All the
information collected will not be used for any other purposes except for the research. The

84
84
research records will be stored under the researcher‟s Qualtrics account for about three
months until the project ends. The research records will be deleted after the project ends
and nothing except the thesis will be maintained. Additionally, they may not be used for
any future research purposes. The results will only be disseminated during the defense in
October, 2013 at Purdue University.
Voluntary Nature of Participation
You do not have to participate in this research project. If you agree to participate you can
withdraw your participation at any time without penalty.
Contact Information:
If you have any questions about this research project, you can contact Douglas C. Nelson
and 765-496-2498 or [email protected]. If you have concerns about the treatment of
research participants, you can contact the Institutional Review Board at Purdue
University, Ernest C. Young Hall, Room 1032, 155 S. Grant St., West Lafayette, IN
47907-2114. The phone number for the Board is (765) 494-5942. The email address is
Documentation of Informed Consent
I have had the opportunity to read this consent form and have the research study
explained. I have had the opportunity to ask questions about the research project and my
questions have been answered. I am prepared to participate in the research project
described above. I will receive a copy of this consent form after I sign it.
I agree
I do not agree

85
85
Appendix B Menu 1 (Non-Vegetarian Items)
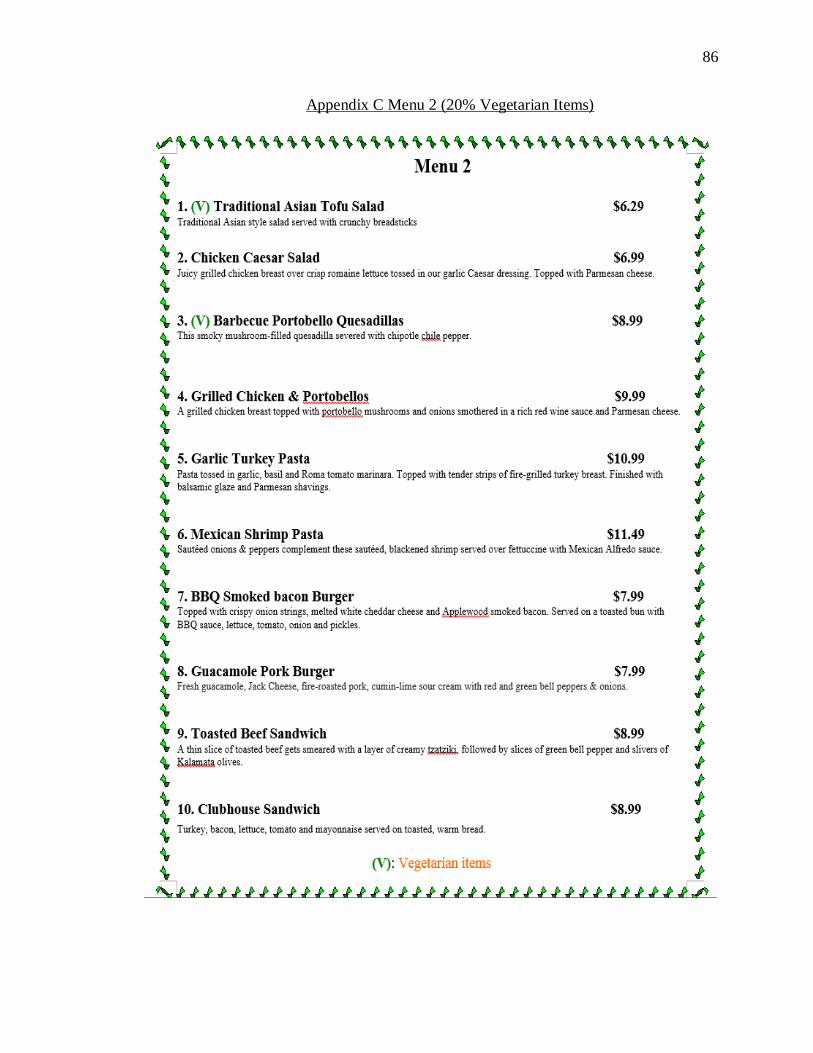
86
86
Appendix C Menu 2 (20% Vegetarian Items)

87
87
Appendix D Menu 3 (80% Vegetarian Items)
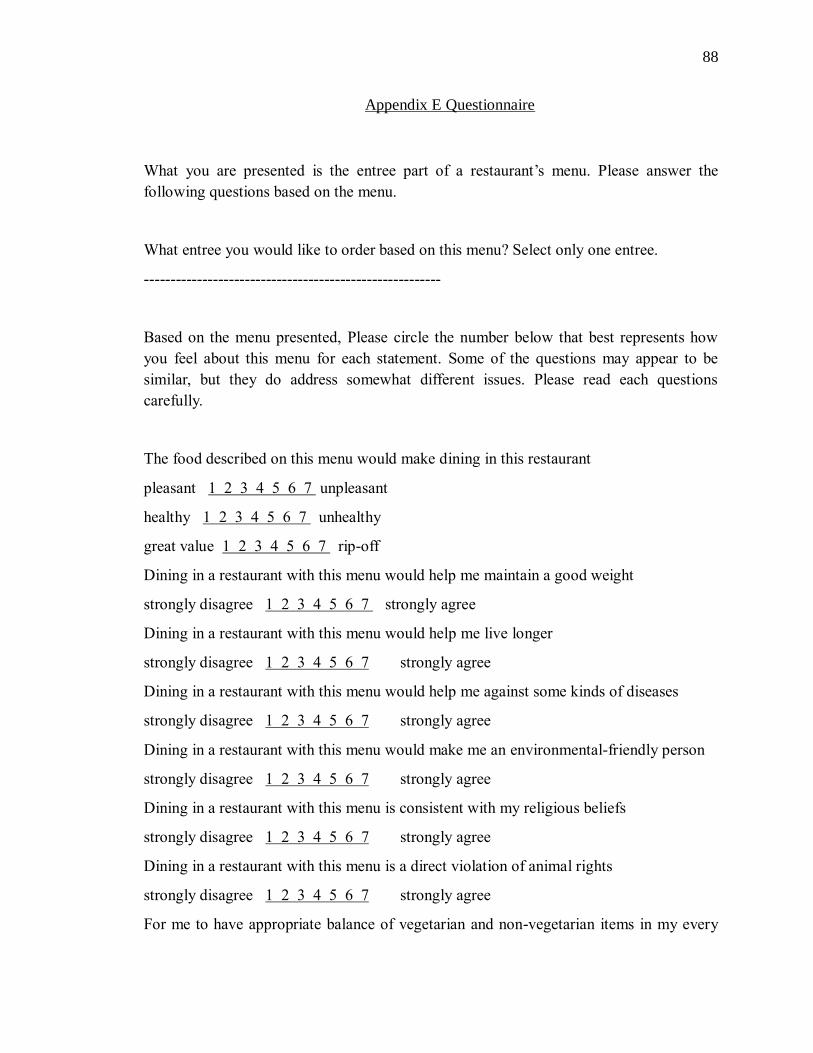
88
88
Appendix E Questionnaire
What you are presented is the entree part of a restaurant‟s menu. Please answer the
following questions based on the menu.
What entree you would like to order based on this menu? Select only one entree.
--------------------------------------------------------
Based on the menu presented, Please circle the number below that best represents how
you feel about this menu for each statement. Some of the questions may appear to be
similar, but they do address somewhat different issues. Please read each questions
carefully.
The food described on this menu would make dining in this restaurant
pleasant 1 2 3 4 5 6 7 unpleasant
healthy 1 2 3 4 5 6 7 unhealthy
great value 1 2 3 4 5 6 7 rip-off
Dining in a restaurant with this menu would help me maintain a good weight
strongly disagree 1 2 3 4 5 6 7 strongly agree
Dining in a restaurant with this menu would help me live longer
strongly disagree 1 2 3 4 5 6 7 strongly agree
Dining in a restaurant with this menu would help me against some kinds of diseases
strongly disagree 1 2 3 4 5 6 7 strongly agree
Dining in a restaurant with this menu would make me an environmental-friendly person
strongly disagree 1 2 3 4 5 6 7 strongly agree
Dining in a restaurant with this menu is consistent with my religious beliefs
strongly disagree 1 2 3 4 5 6 7 strongly agree
Dining in a restaurant with this menu is a direct violation of animal rights
strongly disagree 1 2 3 4 5 6 7 strongly agree
For me to have appropriate balance of vegetarian and non-vegetarian items in my every
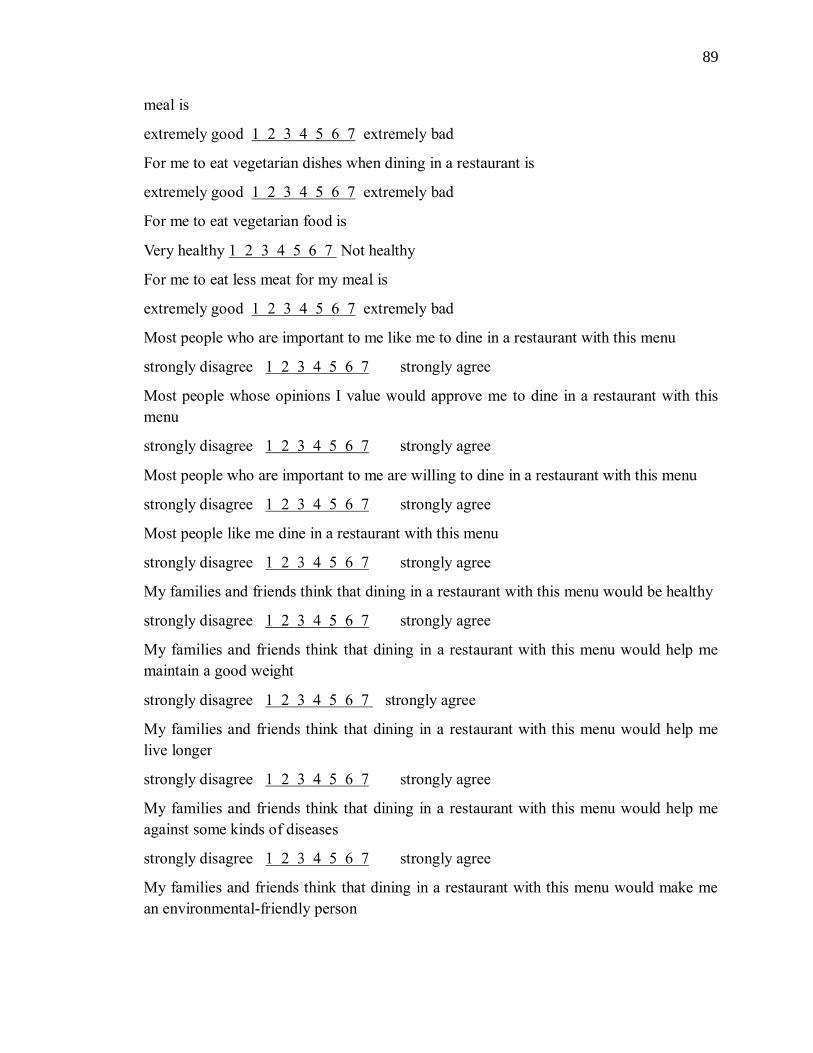
89
89
meal is
extremely good 1 2 3 4 5 6 7 extremely bad
For me to eat vegetarian dishes when dining in a restaurant is
extremely good 1 2 3 4 5 6 7 extremely bad
For me to eat vegetarian food is
Very healthy 1 2 3 4 5 6 7 Not healthy
For me to eat less meat for my meal is
extremely good 1 2 3 4 5 6 7 extremely bad
Most people who are important to me like me to dine in a restaurant with this menu
strongly disagree 1 2 3 4 5 6 7 strongly agree
Most people whose opinions I value would approve me to dine in a restaurant with this
menu
strongly disagree 1 2 3 4 5 6 7 strongly agree
Most people who are important to me are willing to dine in a restaurant with this menu
strongly disagree 1 2 3 4 5 6 7 strongly agree
Most people like me dine in a restaurant with this menu
strongly disagree 1 2 3 4 5 6 7 strongly agree
My families and friends think that dining in a restaurant with this menu would be healthy
strongly disagree 1 2 3 4 5 6 7 strongly agree
My families and friends think that dining in a restaurant with this menu would help me
maintain a good weight
strongly disagree 1 2 3 4 5 6 7 strongly agree
My families and friends think that dining in a restaurant with this menu would help me
live longer
strongly disagree 1 2 3 4 5 6 7 strongly agree
My families and friends think that dining in a restaurant with this menu would help me
against some kinds of diseases
strongly disagree 1 2 3 4 5 6 7 strongly agree
My families and friends think that dining in a restaurant with this menu would make me
an environmental-friendly person

90
90
strongly disagree 1 2 3 4 5 6 7 strongly agree
My families and friends think that dining in a restaurant with this menu is consistent with
their religious beliefs
strongly disagree 1 2 3 4 5 6 7 strongly agree
My families and friends think that dining in a restaurant with this menu is a direct
violation of animal rights
strongly disagree 1 2 3 4 5 6 7 strongly agree
Generally speaking, how much do you care opinions of your families and friends?
not at all 1 2 3 4 5 6 7 very much
Whether or not I dine in a restaurant with this menu is entirely up to me
strongly disagree 1 2 3 4 5 6 7 strongly agree
I am confident that if I wanted to I could dine in a restaurant with this menu
strongly disagree 1 2 3 4 5 6 7 strongly agree
How often do families and friends try to prevent you from dining in a restaurant?
very rarely 1 2 3 4 5 6 7 very frequently
How often are you able to afford to dine in a restaurant $12 and up per meal?
very rarely 1 2 3 4 5 6 7 very frequently
If my families and friends try to prevent me from dining in a restaurant, it would make it
more difficult for me to dine in a restaurant with this menu.
strongly disagree 1 2 3 4 5 6 7 strongly agree
If I have to spend more than $12 for a meal in a restaurant with this menu, it would make
it more difficult for me to dine there.
strongly disagree 1 2 3 4 5 6 7 strongly agree
How likely are you to dine in a restaurant with this menu?
Extremely likely 1 2 3 4 5 6 7 extremely unlikely
How often would you dine in a restaurant with this menu?
□ more than once a day □ daily □ 5-6 times a week □ 3-4 times a week
□ once or twice a week □ once a month □ more than once a month

91
91
How often do you dine out?
□ more than once a day □ daily □ 5-6 times a week □ 3-4 times a week
□ once or twice a week □ once a month □ more than once a month
How often do you dine out at a restaurant where your bill is $12 and up per meal?
□ more than once a day □ daily □ 5-6 times a week □ 3-4 times a week
□ once or twice a week □ once a month □ more than once a month
Are you a vegetarian?
□ No □ Yes
What‟s your age?
□ Under 18 □ 19-29 □ 30-39 □ 40-49 □ 50-59 □ 60 and older
What‟s your gender? □ Male □ Female
What is the highest level of education you have completed?
□ High School diploma or equivalent □ Doctor‟s degree or equivalent
□ Bachelor‟s degree □Other, please explain
__________
□ Master‟s degree
What is your annual income?
□ Below $10,000 □$50,000 to $69,999
□ $10,000 to $29,999 □ $70,000 to $99,999
□ $30,000 to $49,999 □ $100,000 or more
Thank you for you participation and contribution to the research!
Recommended


![Untitled-1 [] · on the bone - even when fully cooked, the meat next to the bone may appear pink. vegetarian - suitable for vegetarians dairy items - many menu items are finished](https://img.pdfslide.us/doc/110x75/5e1d31e9364a91494129cca8/untitled-1-on-the-bone-even-when-fully-cooked-the-meat-next-to-the-bone-may.jpg)