THE EVALUATION AND APPLICATIONS OF A
GLOW DISCHARGE MASS SPECTROMETER ION SOURCE
A Thesis submitted by DAVID MICHAEL CARTER
for the degree of Doctor of Philosophy in the University of London
School of Pharmacy
Department of Pharmaceutical Chemistry The School of Pharmacy
Brunswick Square London WC1N 1AX
1991
1

ProQuest Number: U050588
All rights reserved
INFORMATION TO ALL USERS The quality of this reproduction is dependent upon the quality of the copy submitted.
In the unlikely event that the author did not send a com p le te manuscript and there are missing pages, these will be noted. Also, if material had to be removed,
a note will indicate the deletion.
uestProQuest U050588
Published by ProQuest LLC(2017). Copyright of the Dissertation is held by the Author.
All rights reserved.This work is protected against unauthorized copying under Title 17, United States C ode
Microform Edition © ProQuest LLC.
ProQuest LLC.789 East Eisenhower Parkway
P.O. Box 1346 Ann Arbor, Ml 48106- 1346
ABSTRACT
Glow discharge ion sources have been used with mass spectrometers since 1970 for the qualitative and quantitative determination of impurities in a wide range
of host materials, both electrically conducting and insulators. The technique gives a full elemental analysis for metals, alloys and more recently for semiconductors. For instance in the latter field, sensitivity compares favourably with other techniques such as localised vibrational mode Fourier transform infra-red spectroscopy and with spark-source mass spect romet ry.
However, the use of glow discharge mass spectrometry for the analysis of chemical compounds is largely inchoate. A glow discharge ion source has been built which fulfils the initial concept of elemental analysis but which has two additional roles: the source will produce strongsoft ionisation mass spectra of selected organic and organomet al 1 ic compounds and can be used in both the positive and negative ion modes; using a hollow probe its third application is in liquid chromatography mass spect romet ry.
The triple electrode ion source, which can be thermoelectrically cooled, is mounted in a high resolution mass spectrometer with a data system.
2
CONTENTS
Page
Abstract 2
Contents 3
Illustrations 10
Acknowledgements 16
Dedication 17
CHAPTER 1 - INTRODUCTION 18
a Elemental analysis 18i Inductively coupled plasma mass
spectrometry 18ii Microwave induced plasma sources 20iii Secondary ion mass spectrometry 21iv Sputtered neutrals mass spectrometry 22
v Spark-source mass spectrometry 24vi Laser ionisation mass spectrometry 26vii Resonance ionisation mass spectrometry 27viii Accelerator mass spectrometry 28ix Atomic absorption spectroscopy 28x Infra-red spectroscopy 30
3

xi X-ray photoelectron spectroscopy 31
xii Auger electron spectroscopy 32xili Summary 33
b Mass spectrometrlc ionisation processes for
compound analysis 331 Theory of mass spectra: electron impact
ionisation 33ii Chemical ionisation 38iii Field ionisation and field desorption 41iv Fast atom bombardment 42
c Techniques for direct liquid introduction 43i Chemical ionisation 43ii Thermospray 45iii Atmospheric pressure ionisation 47
d The triple role of a glow dischargeionisation mass spectrometer 48
CHAPTER 2 - PRINCIPLES OF GLOW DISCHARGES 53
a Types of discharges: Townsend, coronaand glow 53
b Semantics: 'Glow discharge' or 'plasma'? 54c Gas phase collision processes 56
i Elastic and inelastic collisions 56ii Ionisation 58iii Excitation 60
iv Relaxation 61
4

v Recombination 62vi Electron attachment 66
vii Dissociation 66viii Ion-neutral collisions 67ix Metastable collisions and Penning
ionisation 68d Theory of plasma formation 70
i Particles, potential and density 70ii Debye shielding 74iii Plasma oscillations 77iv Radio frequency discharges 77v Alternating current glow discharges 78
CHAPTER 3 - THE ARCHITECTURE OF DIRECT CURRENTGLOW DISCHARGES 80
a Historical perspective 80b Production and maintenance of the discharge 82
c Secondary electron emission at the confinesof the ion source 83i By electron bombardment 83
ii By ion bombardment 85iii By neutral bombardment 87iv By photon bombardment 88
d The cathode glow and cathode dark space 89
e The negative glow 90f The Faraday dark space 91
5
sh
The positive column and anode region
Summary9296
CHAPTER 4 - DESIGN CONSIDERATIONS 101
i The triple electrode ion source 101ii Ion source control 103iii Sample probes 104i v Source cooling using the Peltier effect 106V Source cooling control 108vi Measurement of pressure within the GD
source 108vii Purification of the discharge gas 11 1vi i i Sensitivity enhancement of the GD ion
yield 1 13ix Dynamic range: Faraday cup and
electron multiplier 1 15X Liquid introduction into the GD ion
source 1 16xi Summary 1 18
6

CHAPTER 5 - EVALUATION OF THE GLOW DISCHARGEION SOURCE 120
a Physical parameters 120i Choice of electrodes 120ii Operating pressure range 12 1
iii Current/voltage relationship 122
iv Noble gases and sensitivity 123v The formation of germanium monoxide 125vi Discharge gas artifacts 126vii Effect of varying cathode to
anode distance 128viii Effect of varying ion beam exit slit 129ix The sputtering process
and atomic integrity of the system 130x The capillary probe 140xi Ultimate sensitivity 141xii Effect of tungsten filament 144
b Additional effects and aspects
of the ion source 146i Reactive sputtering 146ii Post-sputtering topography of the ion
source target 148iii Effects of source cooling 151
7
CHAPTER 6 - APPLICATIONS OF THE GLOW DISCHARGEION SOURCE 153
a Elemental analysis 153
i General applications to metalsand alloys 153
ii Boron as an impurity in galliumarsenide 156
b Mass spectra of organic compounds 164i Glycerol 165ii 1, 1, 3, 3-t et ramethyl-2-t hiourea 168iii L-Cystine 170iv Monensin 172v Quinidine 174
vi Iodooctadecane 176vii 15-crown-5 176viii Bis (pyridine-2-thionato)
hexacarbonyldirheniurn 178ix Ammonia as the discharge gas 180x Negative ions 183
c Capillary GDMS 186i Methanol 186
ii Menthone 188
iii A methanol/water mixture 190iv Methyl stearate 192v A methionine/proline mixture 194vi A comparison 195
8

CHAPTER 7 - CONCLUSIONS
Ref erences
*********

19
2021
22
2325272829313234
4042
4246474849
ILLUSTRATIONS
ICPMS sampling InterfacePeak from 23sUr at 10 pg ml-1 insolution using an ICPMS
SIMS processSNMS ioniserSNMS depth profile of chromium oxide on st eelCEC 21-110 B spark-source MS LIMS mass spectrometer RIMS systemAtomic absorption spectrometer XPS process AES processGoldstein's ' Kanalstrahlen* of 1886Mass spectra of methane at differentpressuresFD/FI ion sourceFAB ion sourceTSP LCMS systemMechanism of TSP processs3Ni API sourceGD ion source layout
*
10
54
55
565960
6162636969
7273
75
7879
Overall characteristics of a gaseous
dlschargeArchitecture of and distribution of potential in a glow discharge Kinetics of head-on collision between electron and stationary molecule
Ionisation cross-sections of noble gases
Excitation processOptical emission from a discharge of CF*. and 02Recombinat ion Kinetics of recombination Penning effect parameters El and Penning ionisationParameter values for neutrals, electronsand ions in a GD plasmaThe Langmuir probe experimentVariation of potential around aperturbation in a plasmaPressure regimes for DC and RF glow
di schargesAC GD system
*
11

Fig 3. 1 Glow discharge in Ne 81Fig 3.2 A DC glow discharge in practise 82Fig 3. 3 Voltage distribution in a DC
GD process 83Fig 3. 4 Secondary electron emission
coefficients for Ni, BaO and caesiated
Ag by electron bombardment 84Fig 3. 5 Distribution of kinetic energy among
secondary electrons from a metal 85Fig 3.6 Secondary electron emission coefficients
for W and Mo by ion bombardment 86Fig 3.7 Secondary electron emission coefficients
v energy for Ar ion and neutral atom bombardment of Mo 87
Fig 3. 8 Photoemission 88Fig 3.9 Anode fall of potential in a gaseous
discharge 93Fig 3. 10 Inelastic collision processes 98Fig 3. 11 Plasma theory pressures/systems 99Fig 3. 12 Glow discharge photographs from 1878 100
#
Fig 4. 1 GD source in detail 102Fig 4.2 GD ion source beam focusing controls 104Fig 4. 3 Sample probes 105Fig 4. 4 Peltier heat pump 107
12

107
108
109
11 11 12
114116117117
122
124125128131135136137138
139144145149
Method of removing heat from
Peltier moduleClosed loop control of Peltier deviceIonisation and Pirani gauge locationsCalibration of ion chamber Pirani gauge
Rare gas purifierCathode filament arrangementDual ion collector assemblyCapillary introduction systemGD ion source gas/liquid flow regime
*
Discharge current/voltage relationship Sputtering yields for different gases Ge and GeO clusters Internal dimensions of ion source Interactions of ions with surfaces W and Sn isotope patterns using GD Examples of isobaric overlapping
Double focusing geometryResolving power <10% valley definition)
RIY values for a Pt/Rh alloy Au oligomer at 1379 Da Proposed ion enhancement assembly
Metal enhanced GD system*
15

154
158158159
162163167169171172173175176177177178179181182184
185187
189189
190
Factors affecting determination
of chromium in GaAs
GD mass spectrum of GaAs100 ppb of n B in GaAsFTIR spectrum of pure GaAsGDMS and FTIRS comparison
FTIR LVMs for B in GaAsMass spectra of glycerolGD mass spectrum of a thioureaGD mass spectrum of L-CystineMonensin dehydration productsGD & FAB mass spectra of monensinEl and GD mass spectra of quinidineGD mass spectrum of iodooctadecaneMain fragments from 15-crown-5GD mass spectrum of 15-crown-5Structure of a Re carbonylEl & GD mass spectra of a Re carbonylGD mass spectrum of a lactamGDMS of pyridine using ammoniaElectron attachment probabilities
Negative ion GDMS of phenolEl & GD mass spectra of methanolEl & GD mass spectra of menthoneGD menthone clusters at 4 & 8 kV
GD mass spectrum of 80/20methanol/water mixture
14

Fig 6. 26 Basic operating regimes for GD andcorona systems
Fig 6. 27 GD and Cl molecular ion clusters formethyl stearate
191
193
15

ACKNOWLEDGEMENTS
I acknowledge the encouragement to register for a higher degree received from Mike Baldwin, Professor of
Chemistry in the Department of Neurology at the University of San Francisco, California, USA.
I thank the following for their companionship and hard work in the mass spectrometry laboratory at the School
of Pharmacy, University of London; Mrs Sheren Abdulrahman, Mr Mark Harrison, Mr Steve Howell, Dr John Langley, Miss Tracey Madden and Mr Kevin Welham.In a similar vein, my thanks go to Mr John Hill and to Dr Margaret Mruzek of the University College London mass spectrometry service for their encouragement and technical collaboration.I thank also the following:Dr Gary Gledhill of the Department of Physics, Royal Holloway and Bedford New College, University of London,
Egham for the semiconductor samples, for the LVM FTIR traces and detailed discussions on their interpretation; and I acknowledge also the funding by the Physics Department of the glow discharge ion source and the rare gas purifier;Mr Dave McCarthy of the Department of Pharmacology at the School of Pharmacy for the electron micrographs.I am indebted to Dr Rod Mason of the Department of
Chemistry, University College of Swansea, for invaluable help with finalising this thesis.
16

This thesis is dedicated to
MY FAMILY
V DIANA ¥
Andrew and Louise
Sally and the people of Nepal
Nifty
and to the memory of
Mif ty
17
CHAPTER 1 - INTRODUCTION1a Elemental analysisThere is a wide range of analytical techniques which can
be loosely called 'atomic' or 'elemental'. These methods are used to determine the elemental and/or isotopic
composition of bulk materials, or of surfaces. They include a number of mass spectrometric techniques which range chronologically from secondary ion mass spectrometry, a method available in various forms since the early 1900's, through spark-source mass spectrometry which was very popular in the late I960's and early 1970's, to resonance ionisation mass spectrometry - an embryonic technique in the mid-1980's.Within this section, which is devoted to elemental analysis, these and other mass spectrometric techniques will be considered, plus other methods unrelated to mass spect romet ry.la i Inductively coupled plasma mass spectrometry
(ICPMS)The prime protagonists of inductively coupled mass spectrometry were undoubtedly Alan Gray and Alan Date in the United Kingdom. 1 A typical ICPMS has three main parts, namely the inductively coupled plasma (ICP), the
quadrupole mass spectrometer and their interface. A sampling interface is illustrated in figure 1. 1 on the
next page. The ICP is contained in a glass walled tube which is called a torch; a continuous flow of argon both supports the plasma and cools the glass tube. A radio frequency (RF) coil surrounds the tube and power at
18

about 25 MHz leads to the transference of energy to free
electrons in the plasma, which is mainly argon. The
samples which are introduced as a fine aerosol in a
second argon stream, desolvate, vapourise and are then i oni sed.
The ICPMS has an inherent problem in that a large decrease in pressure is necessary after ion formation to
enable the ions, which are at a temperature of about 7 x 10³ K to enter the analyser. The interface accomplishes this using a cone and skimmer developed from molecular beam technology, and the ions thus extracted from the plasma have a mean kinetic energy of about 10 electron volts <eV>, which suits the low energy characteristics of the sampling quadrupole.
Induction region of
ICPTorch and load coil Norm al
anayltical zone 4
Skimmer cone
Ion lens elements
Boundary loser of ICP gas
deflected outside samplinc orifice
lit. 1.1 An ICPMS sampling interface; after R S Houk
19

Figure 1.2 shows a peak from uranium at 10pg ml-1 in
solution (one part in 1011 by weight), which was
observed using an ICP mass spectrometer. The total time
spent accumulating the signal was six seconds. 2
Fig 1.2 ICPMS peak from uranium, accumulated counts plotted against mass number (Daltons)
la ii Microwave induced plasma <MIP) sources Microwave induced plasmas have been tried as an alternative excitation technique to ICP. In fact, the original coupling of a MIP source to a quadrupole mass spectrometer produced the interface design for today's ICPMS instruments. 3 A helium MIP has been used to study halogens** and a microwave induced nitrogen discharge at atmospheric pressure has also been assessed. * However, MIP appears to have remained an analytical curiosity of interest to plasma physicists rather than an ionisation
technique coupled to a detector, such as a mass spectrometer, to form a viable commercial instrument.
20

la iii Secondary ion mass spectrometry (SIMS)
When a solid sample is bombarded with a beam of primary
energetic ions or neutrals various particles are ejected from the sample surface, including sputtered secondary ions. The process is shown in figure 1.3.
Energetic primary ion beam
S econdary ion beam(1) atomic(2) molecular ions
) + ve or - ve ion
mass spectra
TTTTTTTTTTTJMetal, alloy, semiconductor, glass; or polymer, biomolecule on surface
Fig 1.3 The SIMS process
The technique was not developed seriously for analysis until the early 1930's. As it is exists today it is used especially for the characterisation of surfaces. There are two operational modes for SIMS, namely 'dynamic SIMS' which uses primary ion currents >1 A/cm and is employed in depth profiling and 'static SIMS', using currents in the nA/cm range for monolayer analysis.The published applications of SIMS are wide ranging and
include the depth profiling of phosphorus in silicon,®
21

the study of magnesium leaching in crysolite asbestos,7 fluorine concentrations in prehistoric teeth® and the quantification of sodium, potassium and calcium in the
lens of a rat' s eye. 3la iv Sputtered neutrals mass spectrometry (SNMS)The previous technique, SIMS, suffers from matrix effects; a similar method acknowledged to be at least as sensitive as SIMS is sputtered neutrals mass spectrometry. If the sputtered neutral particles which are emitted during particle bombardment are separated from the secondary ions and subsequently post-ionised, then relatively matrix-free signals are obtained. This effect may be due to the decoupling of the atomisation and ionisation processes, leading to the ability to optimise either process for maximum signal intensity. A schematic diagram of a SNMS ioniser is shown in figure
1.4. 10
To analyserT RGI suppression
Ionisation region
SIMS suppression
Sample
Fig 1.4 A SNMS ioniser
22
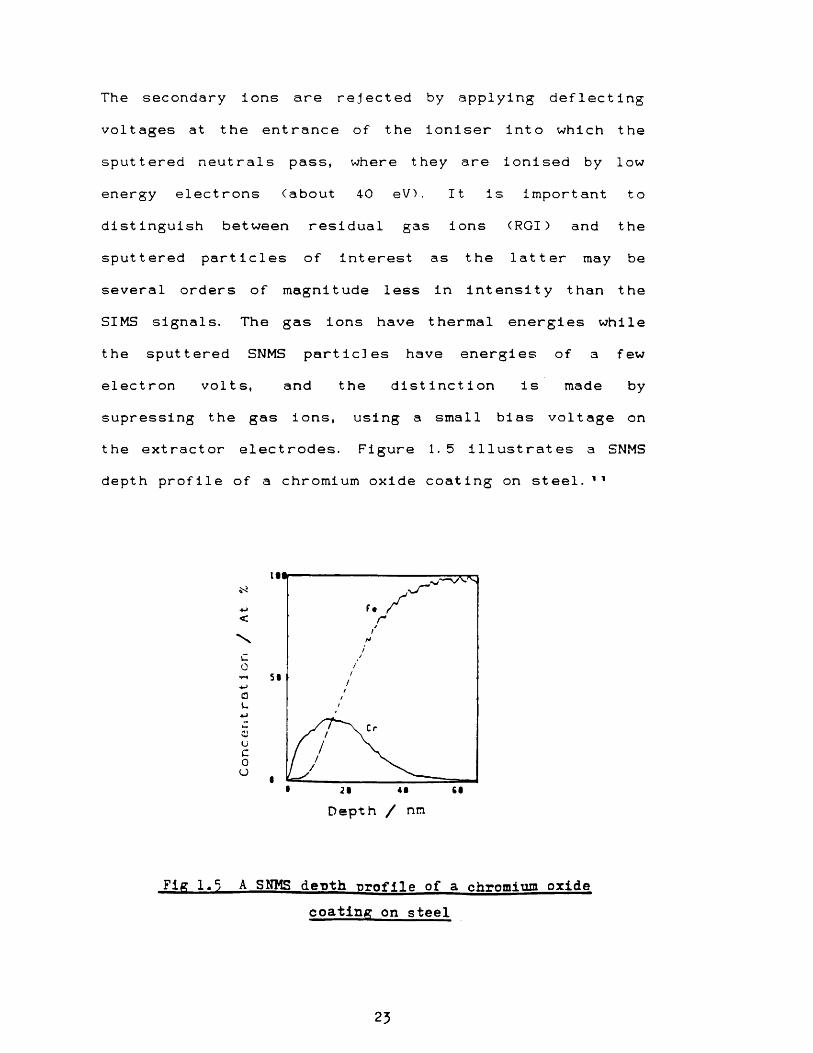
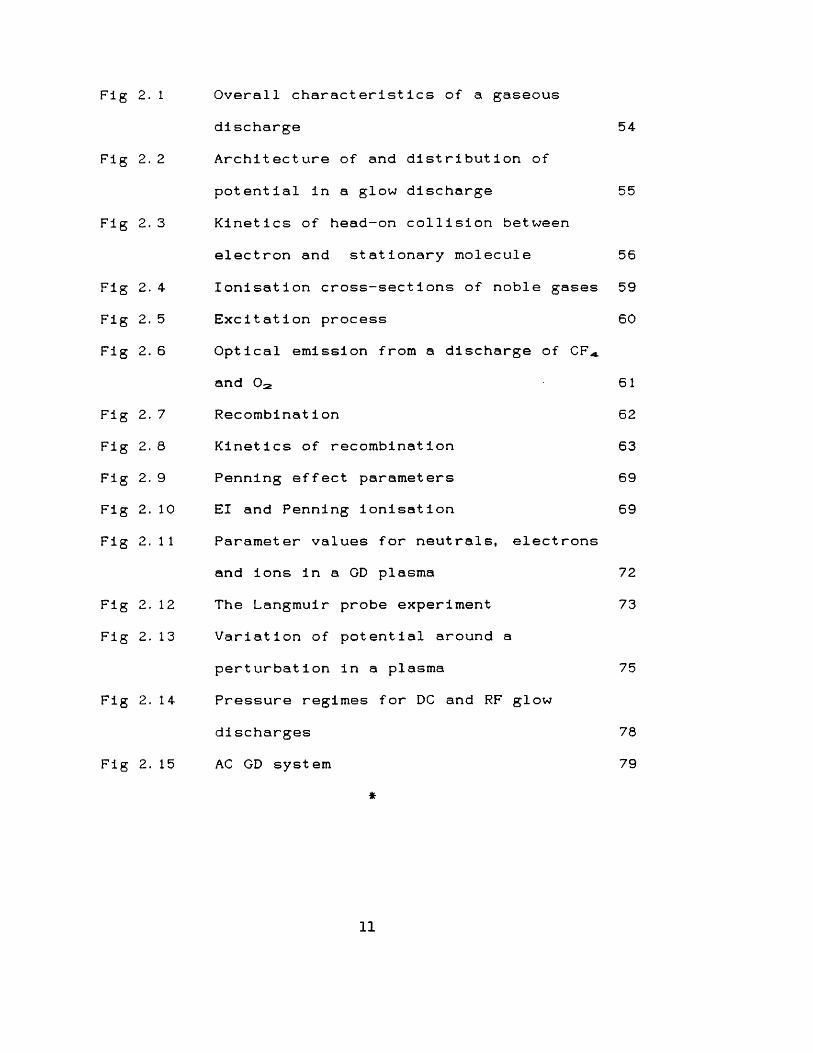
The secondary ions are rejected by applying deflecting
voltages at the entrance of the ioniser into which the sputtered neutrals pass, where they are ionised by low energy electrons Cabout 40 eV). It is important to distinguish between residual gas ions (RGI) and the
sputtered particles of interest as the latter may be several orders of magnitude less in intensity than the SIMS signals. The gas ions have thermal energies while the sputtered SNMS particles have energies of a few electron volts, and the distinction is made by supressing the gas ions, using a small bias voltage on the extractor electrodes. Figure 1.5 illustrates a SNMS depth profile of a chromium oxide coating on steel.11
+-><
u0a
uc021 41
Depth / nn
Fig 1.5 A SNMS depth •profile of a chromium oxidecoating on steel
23
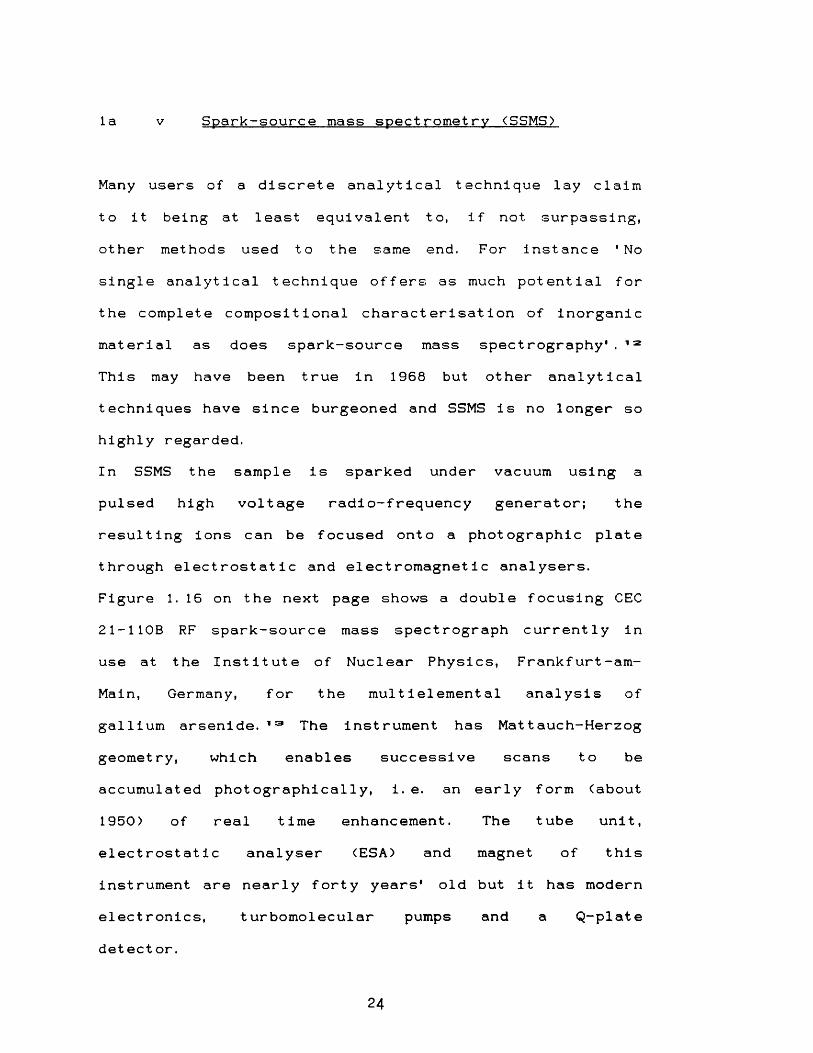
la v Spark-source mass spectrometry (SSMS)
Many users of a discrete analytical technique lay claim
to it being at least equivalent to, if not surpassing, other methods used to the same end. For instance 'Nosingle analytical technique offers as much potential forthe complete compositional characterisation of inorganic material as does spark-source mass spectrography' . 12 This may have been true in 1968 but other analytical techniques have since burgeoned and SSMS is no longer so highly regarded.In SSMS the sample is sparked under vacuum using a pulsed high voltage radio-frequency generator; the resulting ions can be focused onto a photographic plate through electrostatic and electromagnetic analysers. Figure 1. 16 on the next page shows a double focusing CEC 21-110B RF spark-source mass spectrograph currently in use at the Institute of Nuclear Physics, Frankfurt-am-Main, Germany, for the multielemental analysis ofgallium arsenide. 13 The instrument has Mattauch-Herzog geometry, which enables successive scans to be accumulated photographically, i.e. an early form (about 1950) of real time enhancement. The tube unit,electrostatic analyser (ESA) and magnet of thisinstrument are nearly forty years' old but it has modern electronics, turbomolecular pumps and a Q-plate
det ect or.
24

Q,-plate detector
Electricsector
MagneticsectorAngular stop
AcceleratorEnergy stop and
beam monitor electrodeRF spark r\\source
Object slit
Pig 1.6 A CEC 21-110B 8nark-source maaa spectrograph
PARAMETERSc w 1 sl 150 nm 9 n cmc w 2 3.5 mm rm 30 cm
re 64 cm 9m 90°
$ e 31°A0 UA £ 25 kV
S. 7 mm B < 1.2 T
d 24 cm m /A m A 2000
25
A recent development has been the coupling of a Nd: YAG
laser (wavelength = 1064 nm) to a spark-source massspectrometer, the laser replacing the spark-source in a
Jeol 01BM-2 mass spectometer of Mattauch-Herzog geometry. 1 The possible advantages of this method are that the line width on the photoplate is narrower and the resolution is improved, both due to the low energy of the ions.la vi Laser ionisation mass spectrometry (LIMS)This is a technique of the 1980's which abounds in acronyms i.e. laser ionisation mass spectrometry (LIMS), laser microprobe mass spectrometry (LMMS), laser microprobe mass analysis (LMMA and LAMMA) and laser ionisation mass analysis (LIMA). The technique is sensitive - down to about 10“2Og - for the multielement and isotopic analysis of solids. It is at best only semiquant it ative due to the difficulties in defining interactions between a laser and a solid. Quantitative measurements are based upon an empirical approach using relative sensistivity factors, which can be derived from atomisation energy and ionisation potentialconsiderations.1s A schematic of a transmission LIMS mass spectrometer is shown on the next page in figure 1.7. A Nd: YAG pulsed laser is used to ionise the sample surface and a time-of-f1ight mass analyser <T0F)
extracts the ions from the opposite side. The transmittance is critically dependent upon ion kinetic energy and this distribution is usually in the 5 to 30
26

eV range. This suits a TOF mass spectrometer, which in
this mode will give a resolution up to 800 M/AM.
Fig 1.7 A LIMS mass spectrometer
PULSE LASER
FREQUENCY CONVERTOR
ION LENS REFLECTOR
TOF-MASS SPECTROMETER !
SAMPLE PHOTO DIODE
NCIDENTILLUMINATION
ELECTRON MULTIPLIER
ENERGY METER
TRIGGER1 PREAMP
TRANSIENT
RECORDER
ANALOG OUTPUT
COMPUTER
la vii Resonance ionisation mass spectrometerv (RIMS)
RIMS results from the coupling of the lasei— based resonance ionisation spectroscopy technique to a mass spectrometer. One or more photons are absorbed by a gas- phase atom in a resonant process to bring it to an excited level; subsequent absorption of energy causes
the analyte element to ionise. The process tends to be classed as 'high technology' due to the use of multiarrays of lasers. The sequence of events is shown
in f igure 1. 8.
27

Mass specAtomLaser
Selected to match specific electronic transitions in one
element
Photons
Fig 1,8 A RIMS system
Ions from element Sector
Quad or TOF
RIMS has been used mainly to investigate rare elements
and radioisotopes and is ideal because the process eliminates the usual isobaric and ion scattering effects which are common to many of the atomic techniques. It has almost left the physicists' realm and should soon become commercially available. Other atomisation schemes for RIMS have been investigated recently, including a glow discharge system.la viii Accelerator mass spectrometry (AMS)This technique had its origins in nuclear and atomic physics research; now its applications are mainlygeological or anthropological and it is restricted toonly a few laboratories world-wide. 1 ~7' The method uses acyclotron as a combined ioniser and accelerator and it excells, for instance , in studies of 1 dating because AMS counts 1AC ions rather than monitoring the radioactive decay of It is not a good technique for
routine elemental analysis due to ion source memory and sample matrix effects when the ions are produced. 10 la ix Atomic absorption spectroscopy (AAS)AAS is the commercially cheapest available non-mass
spectrometric technique to be considered here. An AAS
28

instrument has several disadvantages; the detection
power for most elements is less than, say, for ICPMS and
the complex optical spectrum means that elements such as uranium have hundreds of spectral lines, thus rendering
difficult the characterisation of unknown samples.AAS has two more disadvantages in that only one element
at a time can be assessed and that isotopic information is not available. However, a graphite furnace AAS instrument does have similar powers of detection to ICPMS. Figure 1.9 shows a schematic of an AAS system; a small volume of the sample solution is vapourised elect rothermally in the burner, and the absorption of radiation characteristic of a given element by the vapour is measured using the monochromator.
Monotfronatnr
29

la x Infra-red spectroscopy (IRS)
Infra-red spectroscopy involves investigation of the twisting, bending, rotating, and vibrational motions of atoms in a molecule. Upon interaction of the molecule
with infra-red radiation, parts of the radiation are absorbed at specific wavelengths, and vibrations areproduced which are uniquely characteristic of the
functional groups that make up the molecule and of its overall structure. These characteristic vibrational (phonon) spectra are observed using either a grating or a Fourier transform infra-red spectrometer.Gallium arsenide, with which we are concerned in chapter 6 is one of many semiconductors which can be studied using FTIR. The level of purity and of doping can be determined providing the impurities are lighter than the masses of the host crystal atoms, if they are not then the characteristic absorption bands, which are called localised vibrational modes (LVMs), are obscured by lattice absorption. LVMs are observed for GaAs from
about 350 to 600 cm-1 • At lower wavenumbers in GaAsthere is a spectroscopic region of very strong latticeabsorption called the Restrahlen band, due to the
process in which all the Ga atoms move together and all the As atoms move together but in antiphase. This gives rise to an oscillating dipole moment and strong
absorption which precludes measurements in that region. To reduce the underlying lattice absorption the sample
is cooled to about 5 K. 131
30

1 a xi X-rav photoelectron spectroscopy (XPS)This technique is known also as electron spectroscopy for chemical analysis (ESCA). XPS is esentially for
surface analysis to a depth of about 3 nm, although it
is possible to measure the variation of sample composition with depth in the range 5 nm to 100 nm by using ion bombardment to remove successive atom layers from the surface. A schematic of the X-ray process is shown in figure 1. 10. The sample to be analysed isintroduced into a vacuum system and irradiated with X-rays from either a Mg or K-alpha source. These X-rays are sufficiently energetic to cause photoemission from the core electron energy levels of the atoms present. Elemental detection limits are typically 103 parts per million, although detection limits of 103 ppm may beobtained in favourable cases. Quantitative XPS analyses are normally accurate to within 10%. 30
Primary X-rays Electrons
Inner energy
levels
Fig 1.10 The XPS -process.
31

la xii Auger electron spectroscopy CAES)The previous technique, XPS, can be used for all elements from helium to uranium; AES will detect all elements from lithium to uranium.XPS and AES both depend upon the removal of an electron from an inner energy level after the excitation of the atom; the atom may return to its normal state by
transferring an electron from some outer level to the vacant inner level. If the energy of this transition appears as X-rays then we have the XPS process. If the energy of the transition is used to eject a second electron f rom the outer shell then the Auger emission process as shown in figure 1.11 has occurred. The energy of the electron is characteristic of the element.
Primary X-rays Secondary electron.
Auger electron
Inner energy levels
Energy transfer
Fig loll The AES process
The sample, which is in a vacuum chamber, is bombarded with an X-ray beam to induce secondary electron emission. The Auger electrons have energies determined by the energy levels in the parent atom and are characteristic of that atom. Auger electrons haveenergies typically in the range 0 to 2 x 10³ eV and the
32

distance they travel in a solid before losing energy is limited to about 1 to 2 nm. The technique is therefore
for surface analysis but, by bombarding a surface with either argon or xenon ions, successive atomic layers are sputtered off and depth profiling is possible, la xiii SummaryThe above covers some of the techniques available for elemental analysis; there are others, such as thermal ionisation mass spectrometry (for isotope ratio measurements), particle desorption mass spectrometry using Kr ions with a time of flight detector and several vapourisation techniques, including graphite furnace atomisation and electrothermal vapourisation.In chapter 6 comparisons will be made between the topic of this thesis, GDMS, and FTIRS.1b Mass spectrometric ionisation processes for
compound analysisi Theory of mass spectra and electron impact
ionisat ionThis second part of the introduction is devoted to ar6sum6 of the most important ionisation processes which are used in conventional mass spectrometers for the analysis of chemical compounds, be they either organicor organometallic. The term 'conventional mass spectrometers' refers to readily available commercial instruments of quadrupole or sector geometry.Figure 1. 12 shows the diagram of the glow discharge tubeand the heading of the title page in E Goldstein'spublication of 1886, in which he demonstrated that
33

positive rays could be formed in the gas phase. 21 By
1907 Thomson had built the first mass spectroscope, in
which the locus of ions after passing through parallel electric and magnetic fields was a parabola and, by
1920, Aston had built a mass spectrograph which was able to measure relative atomic masses of over fifty of the lighter elements. In 1953 the first double focusing mass
spectrometer capable of analysing organic compounds was built by Nier and Johnson, on which they introduced the electron ionisation source, which was a refined version of Dempster's much earlier ion source of 1921. This ionisation process remained the only widely used ionisation technique for routine analysis of organic compounds until the inception of chemical ionisation in the late I960's.
OW eine oooh nicht ontenachto Stnidangnforni in der Kithode indacirter Entl&dangtn.
"KAKAlSTRAHltN* (ION BEAK)
+ o
Fig 1.12 Goldstein’s 'Kanalstrahlen* of 1886
Before considering further the electron impact CEI) process, which is still the most widely used method of
ionisation in mass spectrometry, the theory of mass
34

spectra will be discussed briefly. There are two main theories, namely the quasi-equilibrium approach (QET)22 and the equally statistical theory (RRKM)23 due to Rice, Ramsperger, Kassel and Marcus. Statistical theories are necessary because we have a very imprecise knowledge of what happens when an impact electron passes in close proximity (on the molecular scale) to a particular molecule, due to the large number of electronic states which are implicated.Both the QET and the RRKM theories make several assumptions; firstly, the rate of ion dissociation is slow relative to the rate of distribution of energy in the internal degrees of freedom of the ion; they assume also that no energy is lost during this process and that when dissociation takes place all ions are in the ground electronic state, which infers that all the internal energy imparted to the ion during ionisation exists as vibrational energy in this ground state. An additional assumption is that each dissociation process may be described as motion along a reaction coordinate, separable from all other internal coordinates through a
critical activated complex (transition state) conf igurat ion.
The statistical problem can be considered in two parts. Firstly, the specific rate of decomposition for a given total internal energy must be calculated and then the profile of internal energies must be evaluated. A simple
rate equation based on an oversimplified model is shown on the next page. 23
35

where K is the rate constant for the process, V,=- is the frequency factor, s is the number of effective oscillators in the molecule, E is the internal energy of the ion undergoing fragmentation and E0 is the activation energy of the process.
The equation above ignores contributions from rotational degrees of freedom and this affects s and v. A more rigorous treatment considers internal rotational motion
and a true summation of the available states.
36

Any failure of the two statistical theories arises from
the lack of quantitative information concerning the
vibrational and rotational levels of the ion and the
configurations for large molecules.
During the past forty years physical chemists have attempted to bridge the gap between the theoretical treatment of mass spectra and their practical use in qualitative analysis.
When an electron collides with a gas-phase molecule then the ionising electron loses some of its kinetic energy to the molecule. Some of this energy is carried off by the secondary electron released on ionisation, and part is retained by the newly formed ion as internal energy. This form of energy transfer is due to an inelastic collision process and is termed electron impact ionisation. Subsequent reactions that occur at low pressure in the gas phase are unimolecular; they can be either sequential (a), or they may occur in parallel <b>
lack of knowledge of the activated complex
Ca) M - -i A"*" B - ,
( b ) M~ v
B~
57

In a glow discharge ion source the pressure due to the
discharge gas is several orders of magnitude higher than in an electron impact ion source. However, it will be
shown later that electron impact ionisation is of fundamental importance to the discharge which, after striking, is sustained by this ionisation process.
lb i i Chemical ionisation (Cl)
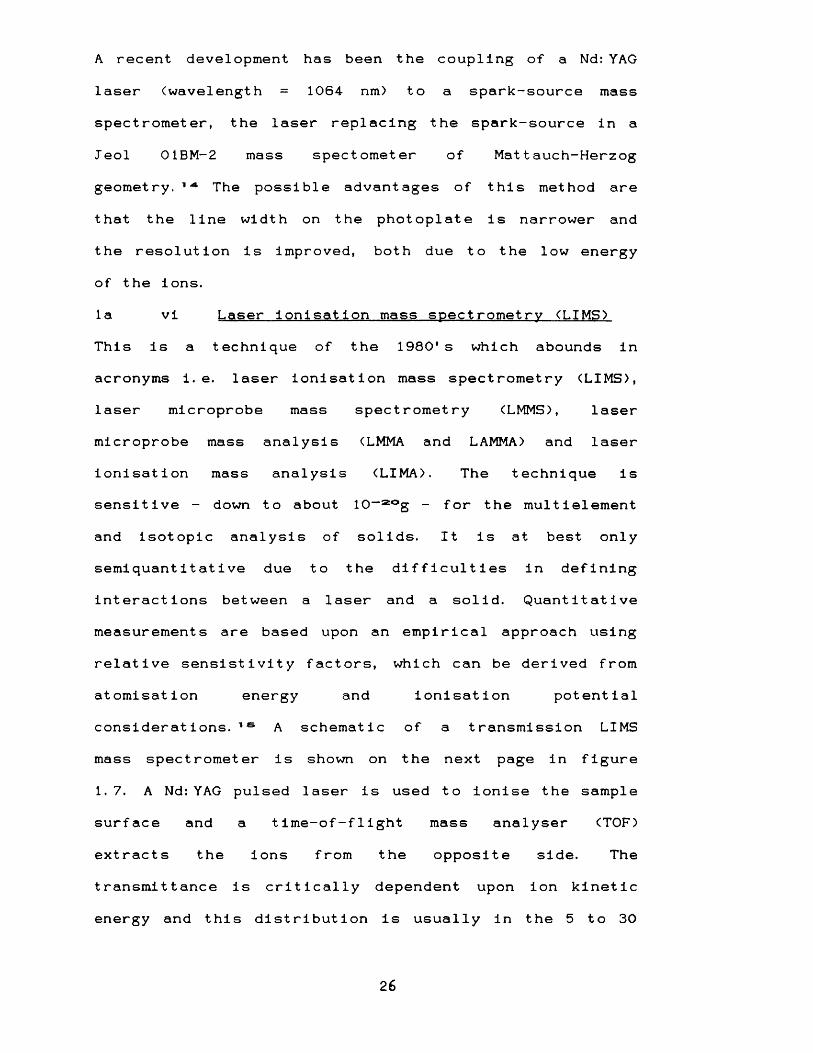
Electron (impact) ionisation depends upon two factors. Firstly, the sample must volatilise without thermal decomposition and secondly, the molecular ion must be sufficiently abundant for its molecular weight to bedetermined. With El it is difficult to control the amount of energy imparted to the molecule and, as isoften the case, for instance with branched-chain aliphatic compounds, the molecular ion may be very small or indeed be absent from the mass spectrum. The chemical ionisation process was developed in the late 1960's to aid the investigation of volatile, labile compounds.In Cl the compound under investigation is ionised byreaction with a large excess of reagent ions. These reagent ions are formed from the reactant gas by a combination of electron impact ionisation and ion- molecule collisions. The proportion of compound to reactant gas is usually of the order of 1 to 103 so that electron impact ionisation of the compound occurs only to a very limited extent. In its early days methane was used almost exclusively for chemical ionisation; the
38

electron Impact ionisation and ion-molecule reactions of methane can be summarised as follows CH* -» C CH^] ■"
[ C H J - + CHA -» [C2H6]+ + CH3
CCH3 ]- + CH* -> [C2Hs]^ + h 2
C CHg] "*■ + 2CH*. -» [ C3H7 ] - + 2H2
CCH2 ]^ + 2CHa -» CCaH*]- + 2Ha + H
C CHa ] - + CHA -» C Ca.HA] - + H2
C CH2] - + CPU -» [ C2H3 ] *- + H2 + H .At a source pressure of about 1 torr, the ions formedfrom methane consist mainly of C CHS3 "*■ ions <48%), with lesser amounts of [ C2He] ■" (40%) and [ C3Ple ] ■* (6%). Thiscan be seen in figure 1. 13, where the mass spectrum ofmethane is shown for normal source pressures and at themuch higher pressure of 1 torr.The reactant ions C C^Hs] and C CHe] react with the sample <BH> mainly by proton transfer or hydrideabstraction C CHS] "■ + BH -» [ BH2] ■** + CPU
C C2Hs1 - + BH -» C BH2] + + C2Ha
CC2Hs]^ + BH -» CB]- + C2HgTo a lesser extent, ion adduct formation can occur to
give CM + 29]'*’ and CM +■ 41]^ ions. Thus
39
BH + C C2Hs] - -* C BHC2Hs] -
BH + C C3Hs] -» CBHC3Hs]^
100% _
<T3
10 J torr1 torr
•H
DaDa
Fig 1.15 Mass spectrum of methane at different -pressures
The ions CM + I]** CCBHa 3" > or CM - I]"" <CB3^> are evenelectron species and more stable than the CM]* ion produced by electron impact. The greater stability is also due to the lower amounts of internal energy transferred on ionisation. The amount of energy transferred in a proton transfer reaction depends on the
difference in proton affinity of the sample and reagent gas molecules. There are other reagent gases which may be used in Cl, e. g. isobutane or ammonia, both of which give less energy transfer and therefore result in less
fragmentation. The technique also allows for the recording of negative ion spectra.
40
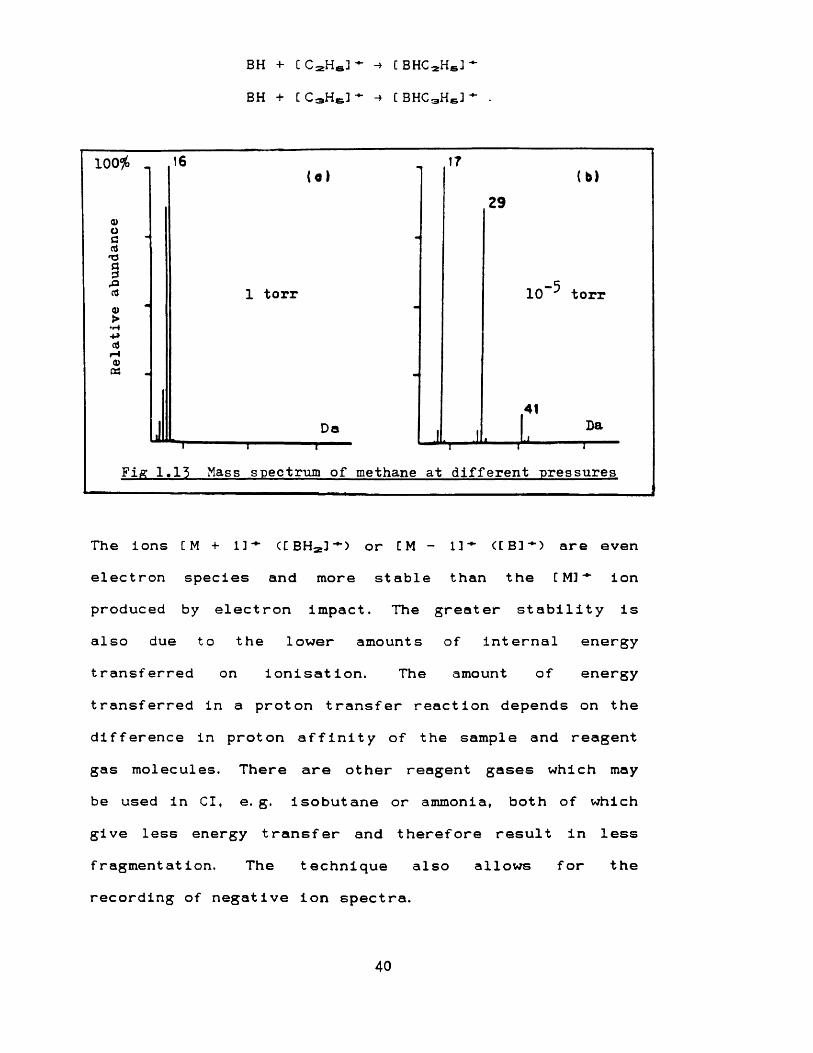
lb iii Field ionisation and field desorption(FI/FD)
Field ionisation and field desorption mass spectrometry originated from FI microscopy as founded by Erwin Muller in 1953: the first quantitative and comprehensiveinvestigation on FI mass spectrometry was published by Ingram and Gomer. 26A FI/FD filament is prepared by heating a tungsten wire in a low pressure atmosphere of an organic vapour such as benzonitrile whilst applying a high potential, which causes micro needles to be formed. Intense electric fields are produced on the tips of these needles in the ion source by applying a high voltage to this filament. FI is concerned with volatile samples, usually liquids at room temperature which are injected into the ion source, whilst with FD the sample is deposited from solution onto the filament (emitter) and then desorbed by passing a current through the wire. The technique can be tedious, and for many polar compounds has largely been superseded by the fast atom bombardment process,
although FD still has its proponents. 27*20A schematic of a FI/FD source is shown in figure 1. 14. The theory of FI is readily available, and'Principles of Field Ionisation and Field Desorption' by H D Beckey (1977) remains the definitive publication on the technique.
41
Fig 1.14 A FD/FI ion source
UJFocusplots
Analyser
ion source
c mr Probe carrying
cm\ ■Counterelectrode
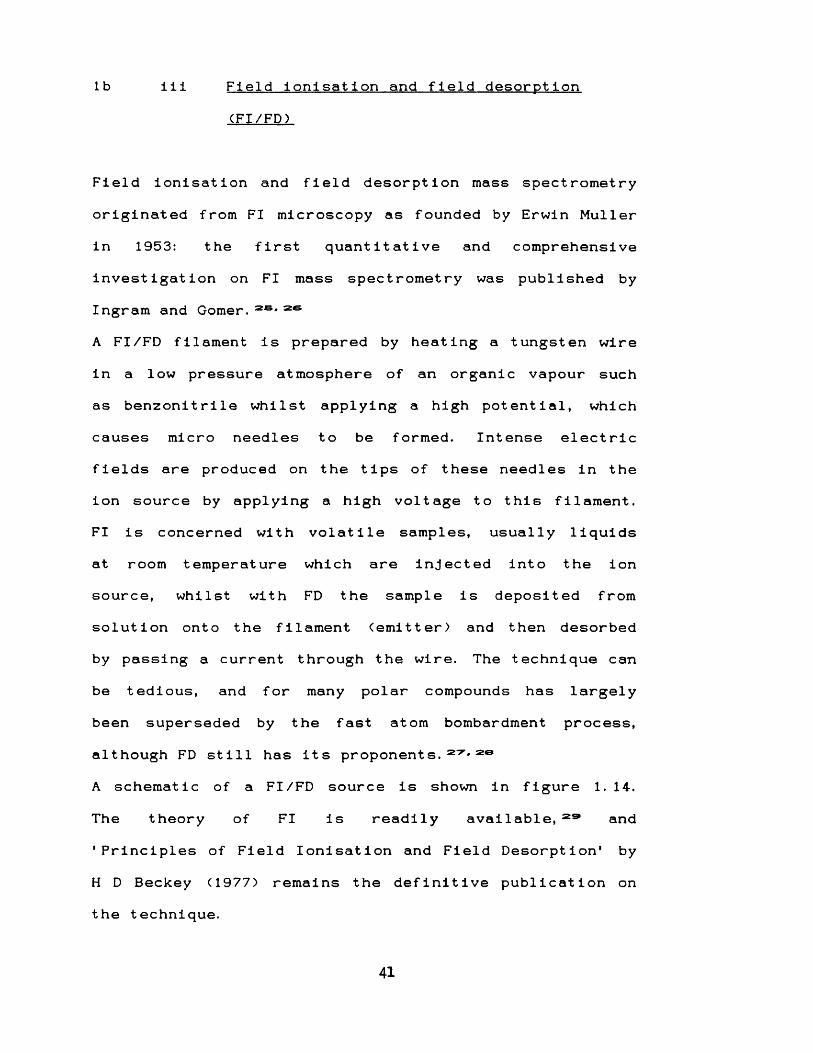
lb iv Fast atom bombardment (FAB)
This technique is the most recent of the four ionisation processes considered in this section and was developed and patented by Barber in the early 1980's, 30 but there are earlier references to the process. 31 The FAB ion source is simple - it has approximately the same number of parts as the GD and the FI/FD sources - and is shown in figure 1. 15.
Atomgun
Ar°Primary atom beam
Probt I tkv \ Analyser
Secondary ion beam
Sample on probe tip
Extraction and focusing
Fig 1«15 A FAB ion source
FAB is the preferred analytical technique for involatile molecules. It produces good quality spectra from a wide range of analytes but it is not a universal panacea, especially for compounds in the multi-kilodalton range
where it is being replaced by the electrospray
42

(ionspray) and matrix assisted laser desorption systems. In FAB the sample is dissolved in a small quantity of a relatively involatile liquid matrix which
is coating a metal surface on the end of a probe. There is now a wide range of matrices which allow protonation to occur; these are compound dependent, thioglycerol and 3-Nitrobenzyl alcohol <mNoba> being the most efficacious in many cases. Adding Nal to mNoba results in the formation of [ M+Na] as the pseudo-molecular ion as opposed to C M+H] ■" and has the effect of reducing fragmentation. The liquid surface is bombarded in the source with a beam of heavy atoms such as xenon or caesium (then sometimes described as liquid secondary ion mass spectrometery - LSIMS), and the analyte molecules are ionised to give, in general, protonated molecular ions. Negative ions may be formed by proton abst ract ion.1 c Techniques for direct liquid introduction
i Chemical ionisationThis third part of the introductory chapter is concerned with the introduction of liquids into ion sources. It
serves as a basis by which to compare the liquid chromatography capabilities of current techniques with those of the glow discharge source when used in its third role. This chapter does not, however, include details of the various transport systems/interfaces for LCMS, neither does it include an overview of gas chromatography mass spectrometry (GCMS) as these topics are considered to be too wide for inclusion and not
43

directly relevant.
The direct liquid introduction <DLI> of liquids into an
ion source was first investigated by Tal' rose who introduced a small amount of a liquid into an El ionsource using a thin capillary tube. Less than 0. 1% of
the LC eluent was accepted by the ion source because itwas operating in a high vacuum. 32
McLafferty took this approach a stage further and found that by using a Cl source, with the solvent as theionising reagent gas, a higher liquid flow rate could be maintained. The ion source accepted this flow ratebecause the normal gas pressure in a Cl source isseveral orders of magnitude higher than under Elcondit ions.The main problem when coupling a LC system to a Cl mass spectrometer is that the vacuum requirements preclude other than a small percentage of the total LC effluent entering the ion source. In the mid 1980's the sensitivity of the system was low with typical on column detection levels being 500 ng for a full scan and only 500 pg by single ion monitoring. 3‘5’’ Improvedcoupling and computer techniques have since increasedsensitivity by at least one order of magnitude. Microbore and capillary LC columns allow flow rates as
low as a few pl/min, enabling the entire column eluent to be introduced directly into the ion source for ionisation by methods such as continuous flow FAB and elect rospray.
44
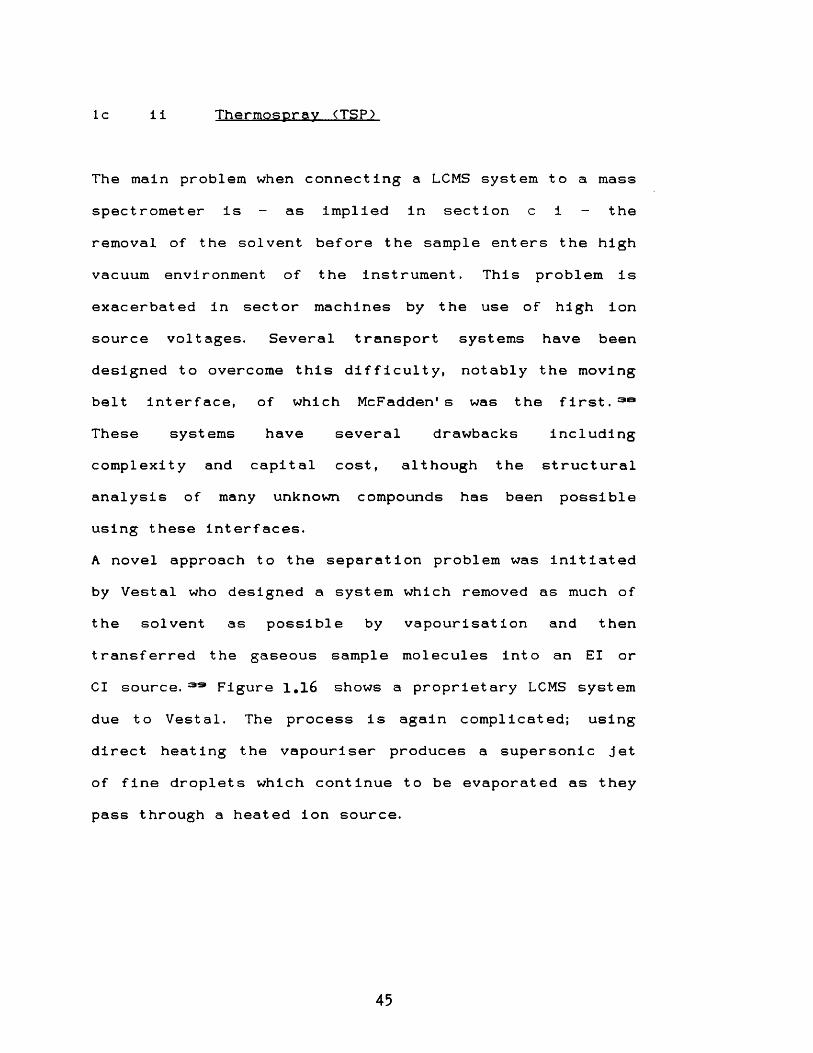
1 c i i Thermosprav (TSP)
The main problem when connecting a LCMS system to a mass spectrometer is - as implied in section c i - the removal of the solvent before the sample enters the high
vacuum environment of the instrument. This problem is exacerbated in sector machines by the use of high ion source voltages. Several transport systems have been designed to overcome this difficulty, notably the moving belt interface, of which McFadden's was the first.30 These systems have several drawbacks including complexity and capital cost, although the structural analysis of many unknown compounds has been possible using these interfaces.A novel approach to the separation problem was initiated by Vestal who designed a system which removed as much of the solvent as possible by vapourisation and then transferred the gaseous sample molecules into an El or Cl source. 30 Figure 1.16 shows a proprietary LCMS system due to Vestal. The process is again complicated; using direct heating the vapouriser produces a supersonic jet of fine droplets which continue to be evaporated as they pass through a heated ion source.
45

Fig 1.16 A T5P LCMS system: after Vestal
Sourcepumpout Baffle
Vapor t.c.
Electron, entrance
Quadrupole
DischargeelectrodeVaporizer
Liquid in
The ions formed in the source pass into the mass analyser through a sampling cone. A filament isnecessary, as an ionising device, when working with non- aqueous eluents or with those that contain a high percentage of an organic modifier. If the solvent system contains an inorganic buffer, such as ammonium acetate at a concentration of about 0. 1 Mol dm-3, the filament is not required and the mechanism of thermospray ionisation will occur. This process is shown
diagramat ically in figure 1*17 . TTi© methodology, which has been refined by many other workers, will not be discussed further here; it is sufficient to say that it is a another soft ionisation technique and one in which the efficiency of ion formation is largely independent of the molecular weight or volatility of the sample.
46

Fig 1.17 Mechanism of ion production in the thermospray
process
HEAT
■HdO
we w ^
VAPORIZER
TOMASS
SPECTROMETER
lc iii Atmospheric pressure ionisation (API)
A novel mass spectrometer has been designed which has an external ion source at atmospheric pressure and radioactive ss*Ni foil as its main source of ionisation. ■4°* A1 This API source is shown in figure 1.18 ,The sample is dissolved in an organic solvent and carried into the reaction chamber in a flowing gas stream. Both positive and negative quasimolecular ions are formed and pass through an aperture into the mass analyser. Nitrogen is used as the gas and the ionisation
processes occuring in the reaction chamber create N ^
by electron impact and N*'*' by ion molecule interaction. This version of the API technique has not
been developed commercially and consequently languishes
47

as a promising LC system on the sidelines of mass
spectrometry, whereas electrospray and ionspray are new API methods that are showing great promise for the
analysis of biopolymers.
Fig 1.18 A ^ N i API source
GASOPT mss SPcrrnacTov
HIGHvipom a* tube
NCKQ.-63 SQKC
29
1 d The triple role of a glow discharge ionisationmass spectrometer
Glow discharge mass spectrometry was first described by Coburn in 1970**3 and has since proved to be a very sensitive and specific technique for detecting atomic species in a wide range of substances.The technique compares favourably with the other atomic or elemental methods of analysis for bulk materials both in sensitivity and, when used in conjunction with a twin sector mass spectrometer, in atomic specificity and
48
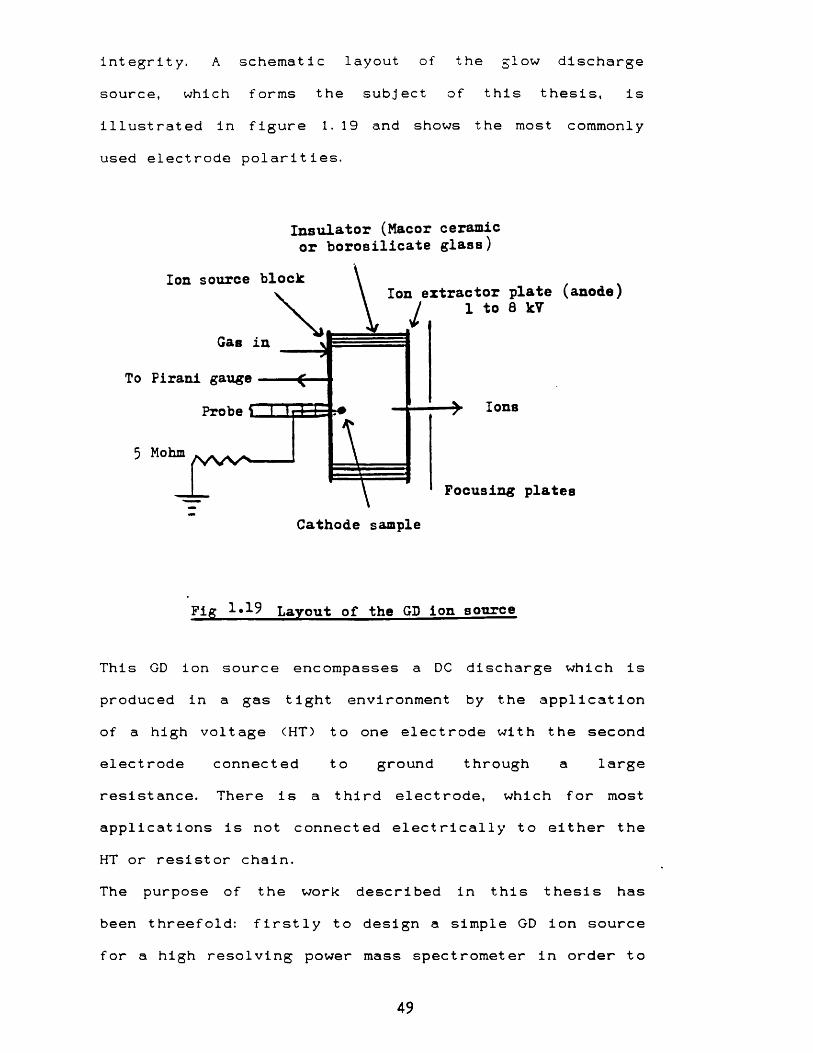
integrity. A schematic layout of the glow discharge
source, which forms the subject of this thesis, is illustrated in figure 1. 19 and shows the most commonly
used electrode polarities.
Insulator (Macor ceramic or borosilicate glass)
Ion source blockIon extractor plate (anode)
Gas in
To Pirani gauge
Probe \ I
5 Mohm
Focusing plates
Cathode sample
Fig 1*19 Layout of the GD ion source
This GD ion source encompasses a DC discharge which is produced in a gas tight environment by the application of a high voltage (HT) to one electrode with the second electrode connected to ground through a large resistance. There is a third electrode, which for most applications is not connected electrically to either the HT or resistor chain.The purpose of the work described in this thesis has
been threefold: firstly to design a simple GD ion sourcefor a high resolving power mass spectrometer in order to
49

investigate impurities in solid materials; secondly, to
use the ion source for organic and organometal1ics compounds, and finally to demonstrate its potential as a combined LC interface and ion source.
Glow discharges were first used as sources of ions over 100 years's ago, before the concept of positive ion analysis using the earliest mass spectrometers lead to the discovery of the existence of stable isotopes, AS'The GD process was superseded as a source of ions for organic chemical analysis by the electron impact source, first introduced for mass spectrometry by Dempster. However, this innovation was much later than the first published use of a discharge tube to ionise compounds, by Gehrcke and Reichenheim in 1906, who loaded sodium salts onto the anode, from where they 'evaporated and sputtered' into the discharge with subsequent ionisation. 49 Such early GD systems were characterised by large ion energy spreads of the order of 10s volts. Glow discharge experiments were continuous throughout the first half of this century but they were primarily for a better understanding of the processes occurring between the electrodes, and not as an analytical t echni que.A relatively late example C1962) of work adding to the
knowledge of these processes is Knewstubb and Tickner* s description of an apparatus for sampling ions from an argon DC glow discharge, where a moveable cathode permitted sampling of the various light and dark regions
of the discharge. Gas pressure was about 1 torr and a
50
sampling hole of 0.05 mm diameter allowed the gas from
the volume between the electrodes to diffuse into a
region of much lower pressure <10~s torr), where the
ions were accelerated before entering the flight tube of a double focusing mass spectrometer. 2AA revival occurred in GD mass spectrometry in the early 1970's when it was realised that the ions available in the discharge gas could be used to analyse metals, semiconductors and insulating materials.
There are now at least three proprietary instruments available with analysers, and GD ion sources can be bought to use in existing organic mass spectrometers. The principle is the same for obtaining the discharge, with the sample acting as the cathode and the anode (ion exit plates) at an accelerating voltage which determines the energy of the ions leaving the source. Differences occur between GD ion sources mainly in the method of providing the discharge voltage, and in detail such as types of source heating and cooling.The ion source, described in detail in chapter four, uses a resistor chain between the cathode and earth to complete the circuit from the anode and the discharge. This method was chosen because it was simple, and found to be stable. The VG Elemental Ltd VG 9000 instrument has a similar source design but tantalum is used instead of stainless steel to minimise artifacts from the source material, and a discharge supply negatively biases the cathode with respect to the anode plate. eo Mason and Milton similarly used a biased system to obtain the
51

discharge voltage. S1c15 A similar system exists in the
literature.There has been little direct interest before in GDMS for organic analysis, although a Townsend discharge tube has
been incorporated in a Cl source®2 and there is parallel contemporary work on glow discharge mass spectrometry of organic compounds by Mason's group at University College Swansea.There are few applications of GDMS and LC, one example is the nebulising system of Matsumoto. S3 His paper describes a glow discharge chemical ionisation source equipped with a pneumatic nebuliser for sample introduction. Chapman and Pratt have described a liquid sampling device for use with liquid chromatography. s<4 Harrison has considered that the use of GDMS for liquids is limited due to the low pressure discharge environment and is therefore not amenable to a large amount of solution. He and Ratcliff have analysed liquids using solution residues by applying the mixture to a coiled rhenium ribbon, evaporating the solvent, vaporising the element of interest, and exciting the resultant atoms with a glow discharge.ssNotwithstanding the resurgence of interest in GDMS in the past twenty years, it is considered that this treatise describes, for the first time, the triple role of a single glow discharge ionisation source in a mass spect romet er.
*******
52
CHAPTER 2 - PRINCIPLES OF GLOW DISCHARGES*2a Types of discharges; Townsend, corona and glowThe conduction of electricity through gases is a broad
and complex subject and is often called a discharge. Conduction below the breakdown point of gases was first studied by Townsend and the process then is called the Townsend discharge. Beyond the breakdown point, the process of conduction is called the self-maintained discharge or glow discharge, in which the currentthrough the discharge varies in a complicated manner with the potential difference between the electrodes.When at least one of the electrodes in a gaseous discharge is sharply curved or pointed, then theelectric field in the gas is far from uniform and it may then suffer only a partial breakdown, the current through it being limited by the potential difference and the electrode spacing. The discharge can sometimes be heard and in the dark a faint glow can be seen on thesurface of the more curved electrode, where the electric field is strongest. This type of discharge is called a corona. In the early 1970's, after the inception of chemical ionisation, an alternative mode of ionisation was devised, which used a corona discharge struck between an electrode and a wire screen in the ion chamber. 6S* 57 This process, the intention of which was
to overcome the short life of Cl tungsten and rheniumfilaments, is sometimes erroneously referred to as a glow discharge.*e For appropriate references see page 95
53

The overall characteristics of a gaseous discharge are
given in f igure 2. 1, which was taken from page 604 of Parker's classic book of the 1950' s ' Electronics' . The curve is only a crude indicator, in the sense that the
appropriate current/volt age relationship depends on pressure, and on the geometry and dimensions of the electrodes. The work in this thesis refers to the Glow region, which at the pressures used (about 1 torr) and type of discharge cell (see above), gives a discharge current in the region of 1 mA at about 880 V.
Amps
Space-charge governs potential
distribution
Glow10
10increase in space -chargi density
Breakdown-1010
5pace-charqei Townsend 1 d ischarge10
2kVlkV Volts
Fig 2.1 Overall characteristics of a gaseous discharge
2b Semantics: 'Glow discharge1 or 'plasma' ?
The terms 'glow discharge' and 'plasma' can be confused
and used synonymously, in the wrong context, as can 'corona discharge' and ' glow discharge' .
54

A plasma is a gas which is composed of an equal number
of positive and negative free charges, i.e. positive ions and electrons: it can also include un-ionisedmolecules or atoms.
A glow discharge is a luminous, sparkless discharge
which may be formed when electrons are passing through a gas.
Figure 2. 2 shows the architecture and distribution of potential in a normal glow discharge; the diagram is included here mainly for nomenclature.
Catfiode NeqaHve Faraday Positive Cathode dark qiow dark colum n
layer * * * * * ^
(a)App,earanceB E
space
X
VI
(c) Potential Distribution
X
The architecture and distribution of potential and
potential gradient in a normal srlow discharge
Fig. 2.,2
From the potential distribution above it can be seen that there are only small differences between the
55

electrical conditions in the negative glow, the Faraday
dark space and the positive column, which correspond to their differences in appearance. From A to B we
therefore have a plasma region containing three plasmas.
A plasma does not extend entirely from A to C because of the potential gradient between B and C. In practice the convention is to call the whole device a glow discharge (ion) source whereas convention could also dictate, with equal justification, that it be known as a plasma (ion) source.
The glow discharge is a complex collision-rich environment and it is appropriate here to distinguish between elastic and inelastic collisions and to consider the most significant collision processes involving elect rons.2c Gas phase collision processes
Collision processes can be divided into two main types, namely elastic and inelastic. Collisions involving electrons predominate in determining the behaviour of the glow discharge, so we begin by considering these. In a head-on collision between an electron and a stationary molecule in a perfectly elastic collision, as shown in figure 2.3, then from the conservation of momentum
i Elastic and inelastic collision processes
m M O
v v
Head-on collision between an electron
and a stationary molecule
mu -> mv + Mv*
56
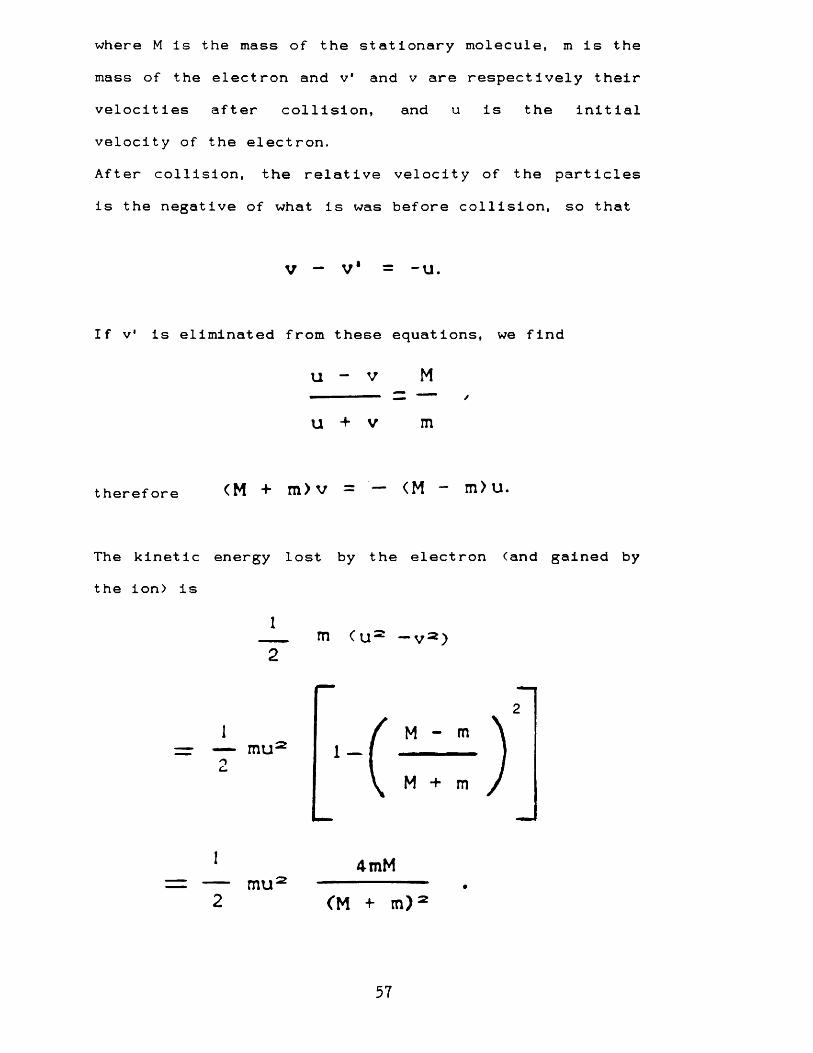
where M is the mass of the stationary molecule, m is the
mass of the electron and v* and v are respectively their velocities after collision, and u is the initial
velocity of the electron.After collision, the relative velocity of the particles
is the negative of what is was before collision, so that
V - V 1 = -u.
If v' is eliminated from these equations, we find
u - v M
u + v m
t heref ore CM + m )v = — <M - m ) u .
The kinetic energy lost by the electron (and gained by the ion) is
1 m ( u 2 —v 2 )2
nr — m u : 1 —M - m
m u4mM
<M + m ) 2
57

But
m & M
so that, to a good approximation
1 4mthe kinetic energy lost m u 2
2 M
Thus the greatest fraction of its original kinetic energy which an electron can lose in an elastic collision with a molecule is 4m/M; in a collision with a hydrogen atom it can lose only 4/1838, or about 1/500. These ratios are known as energy transfer ratios or f unct i ons.
If the collision between the electron and molecule is now considered to be inelastic, so that the molecule struck gains internal energy, then by a similar momenta conservation process, it can be shown that whereas the maximum elastic energy transfer from an electron to, say, a nitrogen molecule is only 0.01% then by inelastic means the transfer may rise to more than 99.99%.2c i i Ionisat ionThe most important inelastic collision undertaken by an electron is that which sustains the glow discharge by
electron impact ionisation, whereby the electron removes a secondary electron from an atom and produces a positive ion and two electrons. These ions will be accelerated in the electric field to produce further ionisation and the subsequent multiplications support the glow discharge.
58

For this process to occur there is a minimum energy requirement, which is equivalent to the energy needed to remove the most weakly bound electron from the atom. For
example this energy is 12.08 eV for xenon. This figure is known as the ionisation energy of this gas.
If we take the area of a hydrogen atom and use it as a unit of cross-section for ionisation then cross-
sections of the noble gases, including xenon, argon and neon which were used in this work, can be plotted and are shown in f igure 2. 4. so
o
NA(0
100,X#6.0'
4.0
1.0
aao-
aio0.000.04
0.01 4K 6K 10K 20K10 15 20 30 40 60 80100 200 300 600 IK 2K
Electron energy <eV)
Fig 2. 4 Ionisation cross-sections of the noble gases
( t t a02 = 8. 82 x lO-1^ cm2 )
Below the threshold energy it can be seen that the ionisation cross-section is zero; this point is known as
the appearance energy of the gas.
59
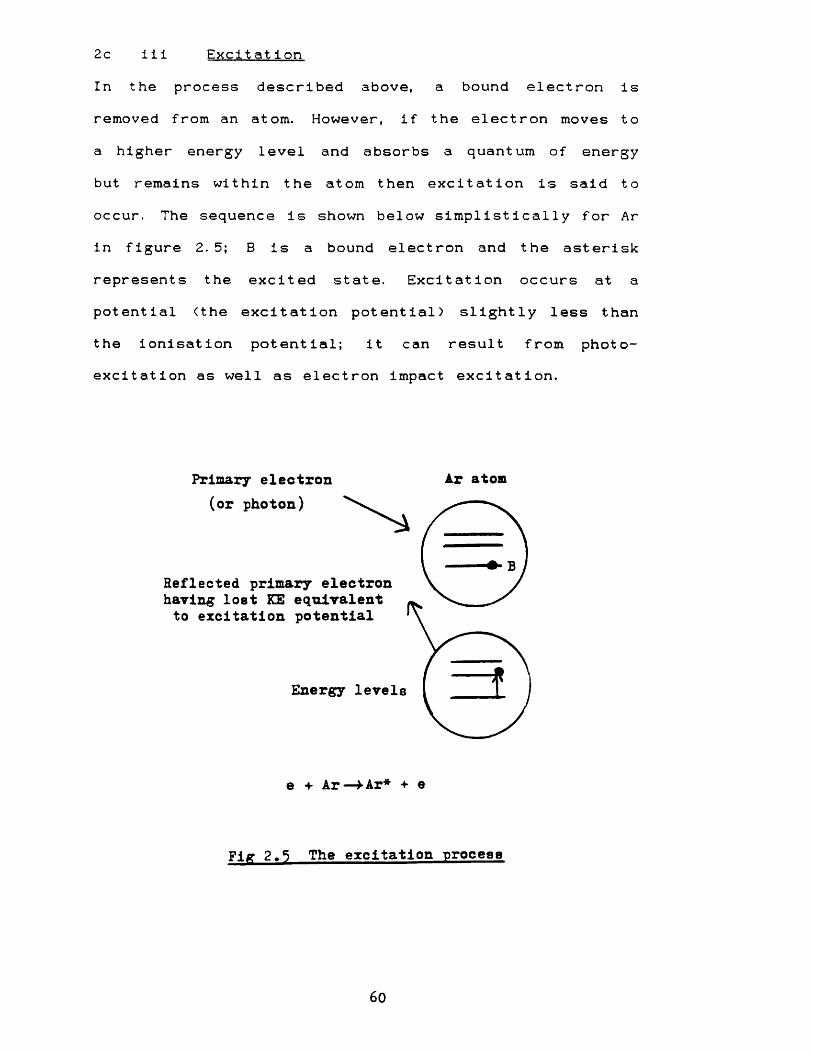
2c iii Excit at i onIn the process described above, a bound electron is removed from an atom. However, if the electron moves to
a higher energy level and absorbs a quantum of energy
but remains within the atom then excitation is said to
occur. The sequence is shown below simplistical1y for Ar in figure 2.5; B is a bound electron and the asterisk represents the excited state. Excitation occurs at a
potential (the excitation potential) slightly less than the ionisation potential; it can result from photoexcitation as well as electron impact excitation.
Primary electron (or photon)
Ar atom
Reflected primary electron having lost KE equivalent to excitation potential
Energy levels
e + Ar— »-Ar* + e
Fig 2,5 The excitation -process
60
2 c i v Relaxat1 on
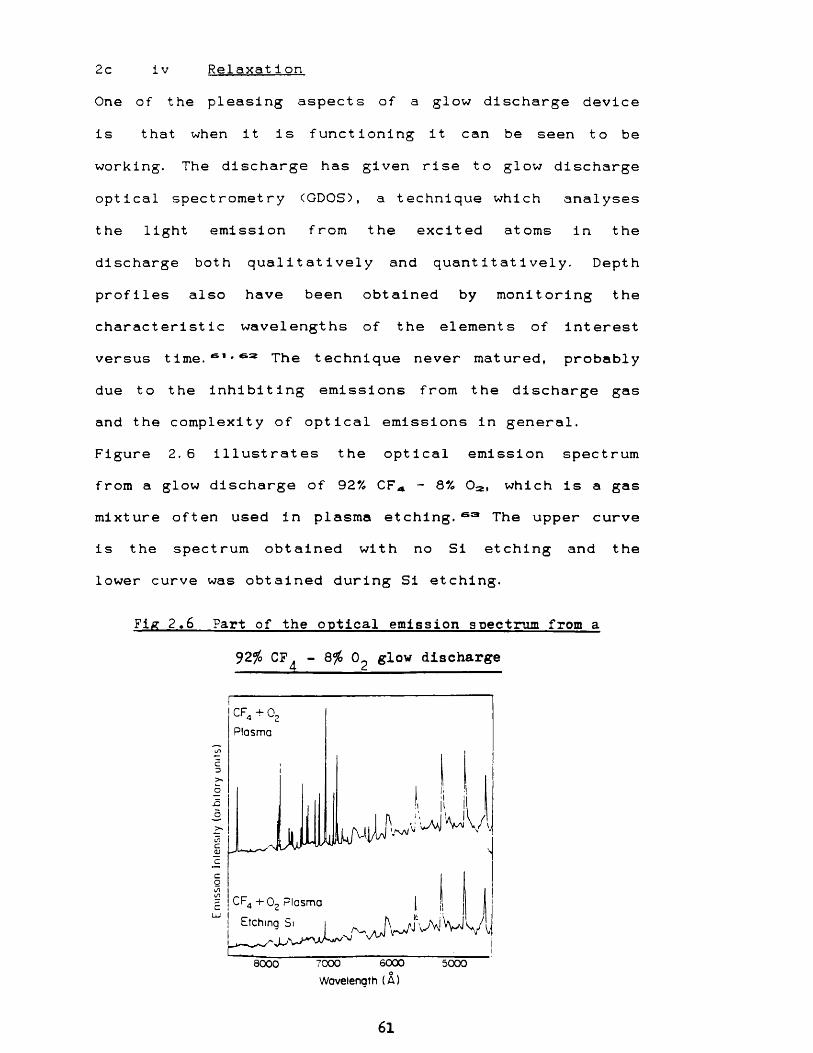
One of the pleasing aspects of a glow discharge device
is that when it is functioning it can be seen to be
working. The discharge has given rise to glow discharge
optical spectrometry (GDOS), a technique which analyses the light emission from the excited atoms in the discharge both qualitatively and quantitatively. Depth
profiles also have been obtained by monitoring the characteristic wavelengths of the elements of interest versus time.s1*sa The technique never matured, probably due to the inhibiting emissions from the discharge gas and the complexity of optical emissions in general.Figure 2.6 illustrates the optical emission spectrum from a glow discharge of 92% CFA - 8% 02l which is a gas mixture often used in plasma etching. 63 The upper curve is the spectrum obtained with no Si etching and the lower curve was obtained during Si etching.
Fig 2.6 Part of the optical emission spectrum from a
92% CF^ - 8% 0^ glow discharge
c f4 + o2Plasma
CF4 + o 2 Plasm a i! I
8000 7000 6000Wavelenath (A )
5000
61

The glow is due to the reverse of excitation, and is
called relaxation. The excited states of atoms and
molecules are generally unstable and an electron will soon return to its original ground state. There are
several transitions possible and their lifetimes may vary fron femtoseconds to seconds. The emission of a photon of energy, corresponding to the difference in
energy between the quantum levels, takes place. The visible glow is for wavelengths between about 4. 1 x 10² nm and 7. 2 x 10² nm, i. e. from violet to red in the spectrum of white light, which correspond respectively to electron transitions of 3.0 eV and 1.7 eV. Atomic emissions give rise to photons from the deep ultraviolet; molecular vibrations and rotational transitions are characteristic of the far infra-red.2 c v Recombinat i onRecombination is the reverse of ionisation and occurs when an electron coalesces with a positive ion to form a neutral atom. This process is shown simplistical1y in figure 2.7.
electron
neutral atomPositive ion
Fig 2.7 Recombination
62
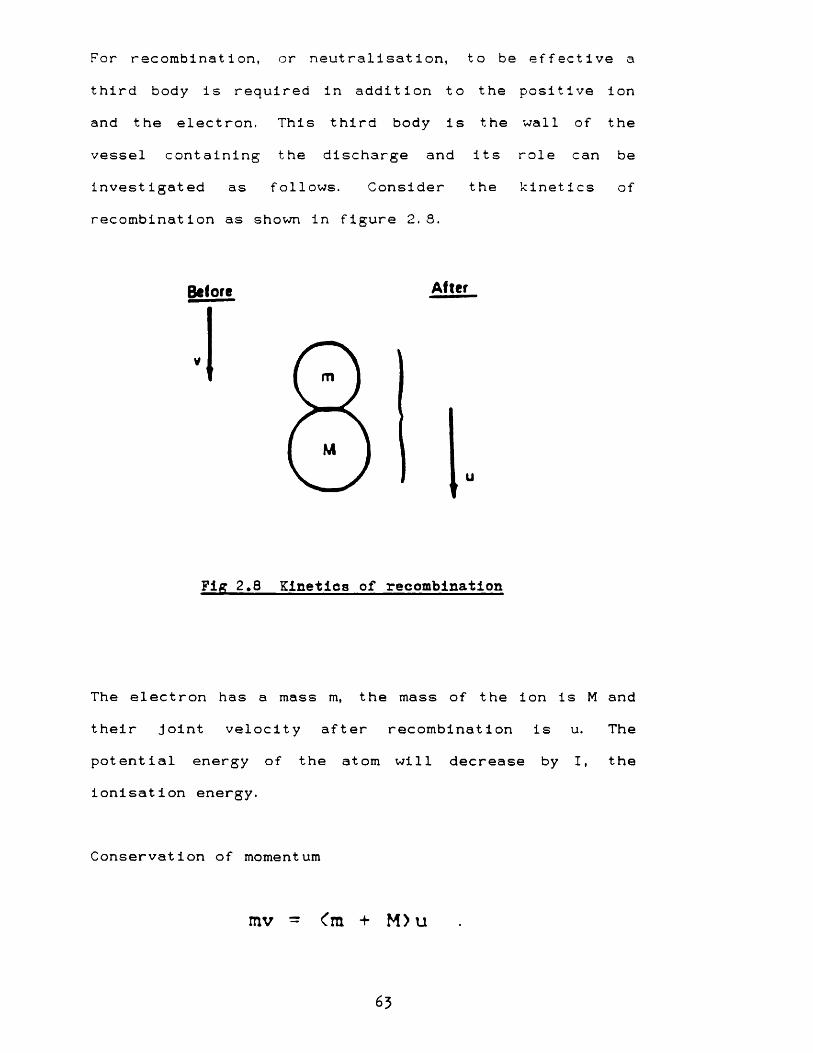
For recombination, or neutralisation, to be effective a
third body is required in addition to the positive ion
and the electron. This third body is the wall of the
vessel containing the discharge and its role can beinvestigated as follows. Consider the kinetics of
recombination as shown in figure 2.S.
After
Fig 2.8 Kinetics of recombination
The electron has a mass m, the mass of the ion is M and their joint velocity after recombination is u. The potential energy of the atom will decrease by I, the ionisation energy.
Conservation of momentum
mv = (m + M ) u
Before
m
63

Conservation of energy
_L mv2 = — Cm + M)u= - I2 2
Theref ore
m m + Mm
We have
1 — (m + M) u 2 - I 2
u — —21m
However, this gives an imaginary solution for u which means that two-body recombination is impossible.
Experimentally, if the concentration of positive ions is n.*. and that of electron is n_, then the chance of an electron capture is proportional to n^.n_.Therefore dn_/dt = dn^./dt = - Rn+n_, where R is called
the coefficient of recombination.In many ionisation phenomena n_ is nearly equal to n . < = n), and n . - n_ is small compared with n.
64

Theref ore
dn/dt = - Rn = .
Integration gives
l/n,. — l/n0 = Rt
and this enables R to be obtained from measurements ofthe decay of electron density.That recombination does take place is also self-evident from the fact that the glow discharge reaches anequilibrium, in a closed space, and does not continuallyincrease.
*
65

2 c vi Electron attachmentThe four inelastic processes just described are sufficient to understand the glow discharge phenomenon, but there are other collision processes; four further mechanisms will be detailed, especially as these also apply to mass spectrometry as a whole and not only to the particular case of a gaseous discharge. The Penning discharge is very important to the glow discharge process.Electron attachment is the process whereby an electron can collide with an atom thus joining it to form a negative ion. Noble gases do not have this propensity as their outer electron shells are filled. Normally halogens (which are important in plasma etching) are used to form negative ions. In negative ion mass spectrometry a noble gas can, however, be of use as a buffer when it acts as a means of producing ions with a range of low translational energies. Some electrons will
have the right energy to attach to sample molecules which contain electronegative elements, and this attachment is often accompanied by fragmentation; such spectra are not true Cl spectra.2c vii Pi ssoc iati onIf a molecule breaks apart then the process is called dissociation, but an electron can only dissociate a molecule if it is polyatomic.
66

The products obtained dissociatively are usually more reactive than the parent molecule and this enhancement is used in the technique of plasma ashing.Dissociation may occur with or without ionisation
e + CFa -» e + CF3 + F (Dissociation);
e+ CFa -> 2e + CFa"- + F (Dissociative ionisation).
2c viii Ion-neutral collisions
There are two types of charge transfers that can take place when ions and neutrals collide.(1) The process of symmetrical resonant charge transfer is of greater significance for atomic ions moving in parent atoms or for molecular ions moving in parent molecular gases, e. g.
( 1 ) A + A - -» A ' - + A,
than it is in (2) the assymetric charge transfer, e.g.
(2) B- + C -» B + C-,
which is a charge exchange between unlike systems. One interesting facet of the glow discharge process is that when a noble gas, such as argon, loses an electron by being ionised it adopts the electron shell configuration
67
of chlorine and is equally reactive.
2c ix Metastable collisions and Penning ionisation An atom usually remains in an excited state for less
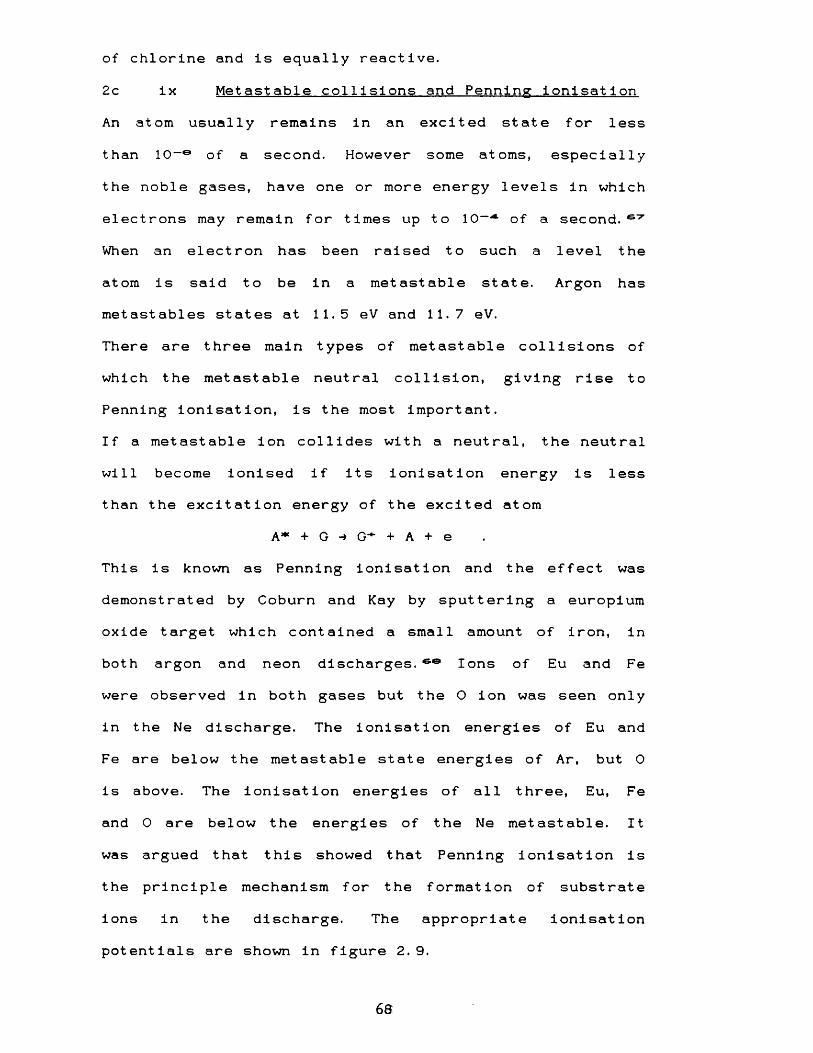
than 10_o of a second. However some atoms, especially the noble gases, have one or more energy levels in which electrons may remain for times up to lO-** of a second. 67 When an electron has been raised to such a level the atom is said to be in a metastable state. Argon has metastables states at 11.5 eV and 11.7 eV.There are three main types of metastable collisions of which the metastable neutral collision, giving rise to Penning ionisation, is the most important.If a metastable ion collides with a neutral, the neutral will become ionised if its ionisation energy is less than the excitation energy of the excited atom
A* + G - » G ^ + A + e This is known as Penning ionisation and the effect was demonstrated by Coburn and Kay by sputtering a europium oxide target which contained a small amount of iron, in both argon and neon discharges. Ions of Eu and Fe were observed in both gases but the 0 ion was seen only in the Ne discharge. The ionisation energies of Eu and Fe are below the metastable state energies of Ar, but 0 is above. The ionisation energies of all three, Eu, Fe and 0 are below the energies of the Ne metastable. It
was argued that this showed that Penning ionisation is the principle mechanism for the formation of substrate ions in the discharge. The appropriate ionisation potentials are shown in figure 2.9.
68

Fig 2.9 Metastable and ionisation energies leading to the Perming effect in Cobnrn and Kav*g experiment
Substrate ions observed Ionisation
energy (eV)Discharge observed in
Eu 5.7 Ar & NeFe 7.8 Ar & Ne0 15.6 HeAr metastables are at 11*5 and 11*7 eV He " " ” 16,6 and 16.7 eV
More recently, Hess and Harrison have shown by using a tunable laser to depopulate metastable atom populations, that Penning ionisation is of equal importance to electron impact ionisation in the glow discharge process. 631 These two processes, known as 'second kind' and 'first kind' respectively, are compared
simplistically in figure 2. 10.
Electron ionisation:KE
transfer
Penning ionisation:PE
transfer Formed if PE > ionisation potential of M
Fig 2.10 Electron ionisation and Penning ionisation
69

Metastable-metastable ionisation can also occur, say in
argon. If two metastable atoms, each of energy 11. 55 eV, have sufficient energy then their collision could result in the ionisation threshold <15.76 eV) of one of the pair being exceeded
Ar* + Ar* -* Ar + Ar-*" + e.
Emission spectroscopy techniques have been used to conclude that this process is not a major ionisation mechanism in the discharge. 'z<>A further metastable collision process is possible, i.e. the ionisation of a metastable by electron impact
e + Ar* -» Ar* + e + e.By considering the ionisation potentials of a ground state and of a molecule it can be shown that this process does occur.2d Theory of plasma formation
i Types of particles, potentials and densityThe first part of this chapter provided a basic introduction to the theory of the fundamental processes of ionisation. We shall now consider a few aspects of the theory of plasma formation. The next chapter will deal with the structure of the glow discharge and its associated plasmas.
Before considering plasma theory it should be remembered that electrical discharges, which should be either
Townsend, glow or corona may occur over a very wide range of gas pressures. This thesis is concerned with discharges occurring at about 1 torr.
70
For completeness the two other pressure regimes are mentioned here briefly. At pressures from about 102 to 103 torr, spark theory takes over giving rise to the
streamer theory and to the Kanal theory.On both streamer and Kanal theories additional electrons are considered to be generated between the electrode gap by photo-ionisation. These new electrons are assumed to
initiate electron avalanches, enabling the electrode gap to be conductively bridged. These theories are outside the scope of this thesis; two books by Llewellyn-Jones offer extensive treatment. 71 - 72
Breakdown in gases can occur also under a third regime which is classed as 'extreme'. This class covers breakdowns at <i) very high pressures, 73 Cii) very short gap distance’7’** and (iii) very low gas pressures, i.e. vacuum breakdown.7’® Each has its own theory; it is sufficient to say that Ci), for instance, is important in high pressure gas insulation of cables in electric power transmission. Similarly, the high voltage electrodes of van de Graaf generators'7® and of X-ray tubes for deep ray therapy have been insulated in this way.Returning to the pressure range of the glow discharge source; the concept of a plasma has been introduced as a partially ionised gas consisting of equal numbers of positive and negative charges. However, the gas will consist mostly of neutrals as the degree of ionisation in the plasmas considered here is very low, typically only
71

10-*1. It can be shown that the mean velocity of a
particle in the plasma is given by
8kTrtm
where k is Boltzmann's constant, T is the absolute temperature and m is the mass of the particle. ‘7”r This equation yields the following values for the particles in a glow discharge plasma (figure 2. 11. ). 're
0o o
o -
o
o -o o
o o - Oo -
o
oO Neutral Atoms O ” Negative Electrons + O O + Positive Ions Q + +■ O
O ' o
Neutrals
Ions
Electrons
m-6.6 10'J3g T = 20° C = 293K = 1 /40eV c ■ 4.0 104 cm/sec
rrij ■ 6.6 10'23gTj = 500K = 0 04eV
c j * 5.2 104 cm/sec
m -9 .1 10‘ 28g
Te =» 23 200K = 2eVc *9.5 107 cm/sec e
i m
Fig 2,11 Typical parameter values for a glow discharge
plasma; after Chapman
72
Whenever there is a concentration gradient of particles,
the random motion of the particles results in a net flow
down the gradient. This is the phenomenon of diffusion. If the electrons diffuse more rapidly then a positive
space charge can be left due to positive ions. However, the collective behaviour of the electrons and ions causes
them to move with the same diffusion coefficient and this is known as ambipolar diffusion. This phenomenon leads to a bigger diffusion rate of particles in the plasma than would normally be expected.
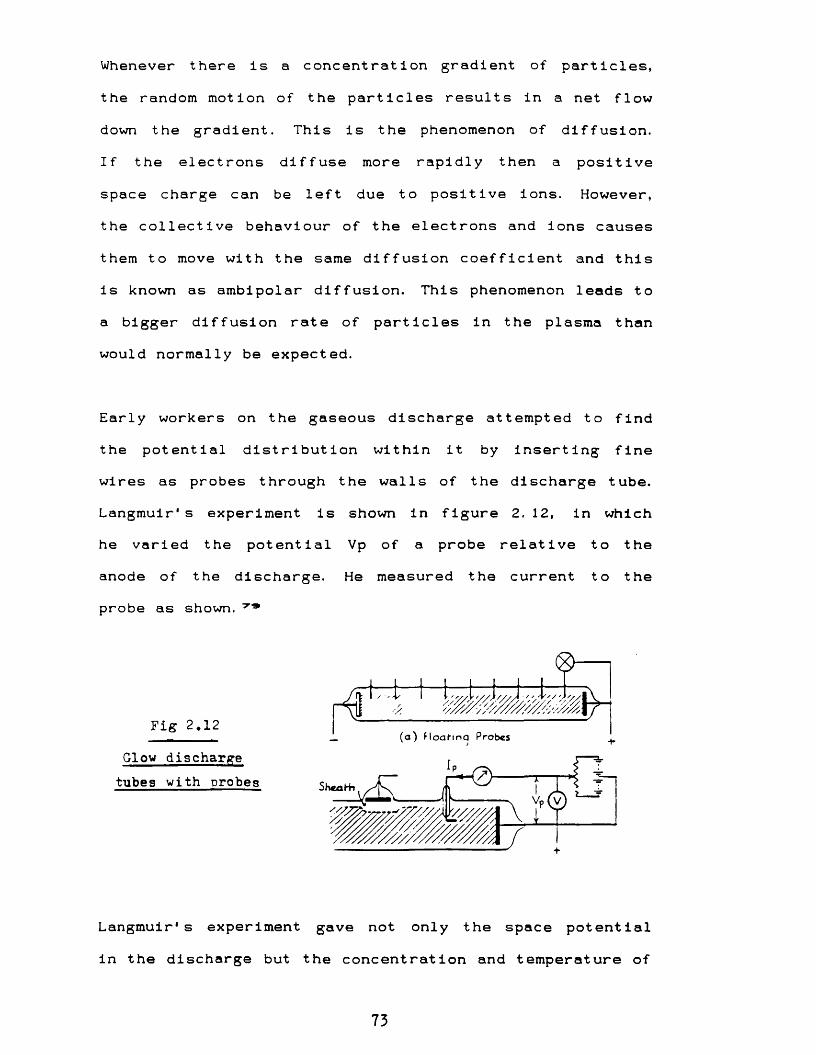
Early workers on the gaseous discharge attempted to find the potential distribution within it by inserting fine wires as probes through the walls of the discharge tube. Langmuir's experiment is shown in figure 2, 12, in which he varied the potential Vp of a probe relative to the anode of the discharge. He measured the current to the probe as shown. ~7"9
Langmuir's experiment gave not only the space potential
in the discharge but the concentration and temperature of
Fig 2.12( a ) H o a f in q Probes
Glow discharge tubes with probes Shea Hi
73

the electrons and the density of their random current.
His work also showed that, provided the probe is used in
a part of the discharge where the concentrations of ions and electrons are high, the probe does not seriously alter the potential distribution. However, the experiment also showed that the potential of a floating probe is not
that of the surrounding plasma. Such a probe introduces a 'perturbation' into the discharge and it is only around this intrusion into the system that electric fields exist. Due to the process known as Debye shielding, the discharge is virtually free of electric fields, i.e. itis equipotential (and therefore may be termed a plasma).2d ii Debve shieldingThe conclusion in the previous sentence probably is notsurprising because, if the numbers of ions and electrons in the plasma are equal and very large, then their netCoulomb interaction will sum to zero. Instantaneously, however, this may not be so, viz: if we consider a onedimensional view of the potential around a perturbation, as shown in figure 2. 13, the potential at a point x = 0 is AV0 , measured relative to the plasma. If V0 is less than Vp then a net positive space charge will form in front of the charged surface, as only energetic electrons can enter. The ion density in this region, known as a sheath, will be n A. This is the same density as in the undisturbed plasma, as the ions have too large a mass to react instantaneously to the space charge.
74

*W(x)
Fig 2,15 Variation of potential around, a
perturbation
If the electron density varies as ne <x) and P0 is the permittivity of free space then Poisson's equation becomes
d:
d:
:2V e / \— — — I n i — ne <x> IP„ \ /
Substituting the Boltzmann relation
ne (x> eAV(x) “ exp — ------- -
n«=. kT.
into Poisson's equation, we have
d a V
dx
en1 — exp —
(x )k T e
75

It can be shown that
d2V e2n AV(x)dx2 k T e P 0
If this equation is solved, then to a further approximat ion
This quantity has a dimension of length and is known as
the Debye length. The fact that V<x> has a spatial dependence tells us that the plasma reacts to oppose that
change. The treatment above is due largely to Mitchner
and Kruger, eo and can be summed up by saying that the
AV<x> = AV0exp — liil X 0
where
1k T e P0
76
unperturbed plasma is equipotential except for small fluctuating voltages which are attenuated over distances
of the order of the Debye length. The plasma attenuates voltage perturbations by forming a sheath and the screening phenomenon is known as Debye shielding.
2d iii Plasma oscillations
On a macroscopic scale the electrons and ions in any part
of the plasma are in equilibrium but if the plasma is disturbed in any way then restoring forces will act to redress the imbalance. These restoring forces depend upon displacement and will give rise to oscillations. Both the electrons and ions can oscillate, although those of the more massive ions are relatively slow. It can be shown that low frequency electron plasma oscillations at frequencies between zero and a few megahertz appear as striations in the positive columns of DC glow discharge tubes. When the ion frequency is low enough, these striations can be observed with the naked eye as slow moving or even stationary regions of higher optical emission intensity.
2d iv Radio frequency dischargesOne of the factors that has tended to limit the application of glow discharges for elemental analysis has been the requirement that the sample be conductive in nature. However, it is possible to mix many materials with a conducting powder matrix, but this is not possible for all non-conducting materials and the matrix method
77
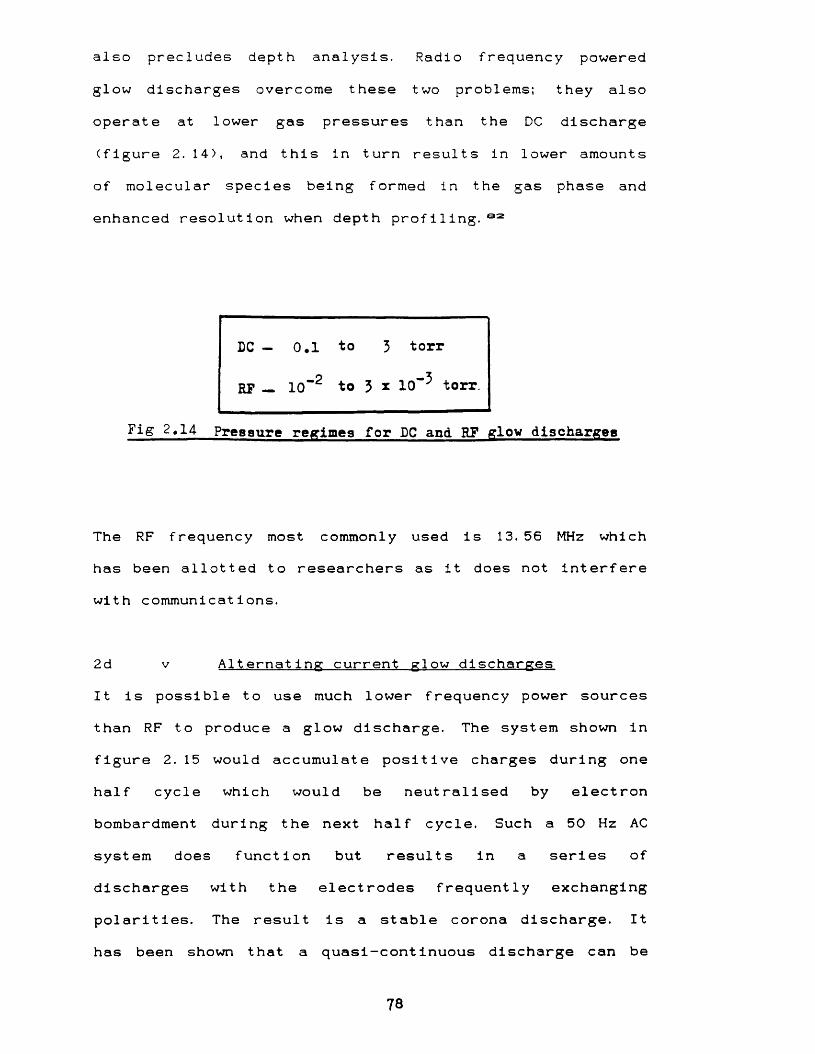
also precludes depth analysis. Radio frequency powered
glow discharges overcome these two problems; they also operate at lower gas pressures than the DC discharge
(figure 2. 14), and this in turn results in lower amounts of molecular species being formed in the gas phase and
enhanced resolution when depth profiling.02
DC - 0.1 to 3 torr
RF — 10"2 to 3 x 10~3 torr.
Fig 2,14 Pressure regimes for DC and RF glow dischargee
The RF frequency most commonly used is 13.56 MHz which has been allotted to researchers as it does not interfere with communications.
2d v Alternating current glow dischargesIt is possible to use much lower frequency power sources than RF to produce a glow discharge. The system shown in figure 2.15 would accumulate positive charges during one half cycle which would be neutralised by electron bombardment during the next half cycle. Such a 50 Hz AC
system does function but results in a series of discharges with the electrodes frequently exchanging polarities. The result is a stable corona discharge. It
has been shown that a quasi-cont inuous discharge can be
78

maintained for frequencies above about 100 kHz.
In 1955 Wehner proposed that higher RF frequencies be
used for sputtering purposes; 03 in 1962 Anderson and colleagues implemented this proposal.
Fig 2.15 An AC GD system
High frequency discharges, as described briefly in the previous section, were investigated many years before the successful application of the RF glow discharge at 13.56 MHz. At the Massachusetts Institute of Technology in the USA a method was used based on the change of resonant frequency of a microwave cavity. An early but excellent account of the principles of electrical breakdown in high
frequency fields is available.6**5In general, AC/RF discharges, for which the theories are very similar, will not be considered further in this t hesi s.
79

CHAPTER 3 - THE ARCHITECTURE OF DIRECT CURRENT GLOWDISCHARGES
a Historical perspective
There are many branches of physics in which classical experiments were conducted but from which the researcher
did not necessarily envisage an end product, certainly not a commercial application. The conduction of electricity through gases is a prime example and is a field which now ranges from a study of the most spectacular example of long-gap electrical breakdown - the lightning discharge - to the use of a glow discharge to determine impurities in semiconductors at the level of parts per billion.
Glow discharges were first recorded photographically in 1878 by De la Rue and Muller, who observed carbon dioxide under a potential of 3,3 kV and at a pressure of about 1 torr, 07 The largest electrode spacing used was 1.25 m and the regions of the discharge were clearly distinguished. Over 100 years later our glow discharge only differs in one respect, in that the electrodes are much closer t oget her.
This chapter examines the different regions, including the plasmas, of the discharge process. Following De la Rue and Muller' s early recording of the plasmas, many
80

workers have shown the extended series of slowing and
dark spaces in DC discharges; these include Nasser00, Cobinees and von Engel. 30 Figure 3. 1 is from Nasser* s
textbook (1971) and shows the glow discharge in neon in a
0. 5 m long tube at a pressure of 1 torr. The luminous
regions have been shaded.
DarkSoactt
lb)
lei
id)
(el
(f)
AnodeGlowPositive
Column
Aston f araday AnooeCathode(CroofceHittorf I
Luminousintensity
Soace-ChargeDensity
Fig 5>1 The neon glow discharge in a tube
0»5 m long at a -pressure of 1 torr; after Nasser
8 1

3b Production and maintenance of the dischargeThe glow discharge is made by applying a potential
between two electrodes in a gas. Referring to figure 3.1, when the anode and cathode are moved closer together, the
positive column shrinks, whereas the cathode dark space
and the negative glow are unaffected. Eventually the positive column and the Faraday dark space disappear. We then have the situation in our practical glow discharge source, where the separation between the electrodes is only a few times the cathode dark space thickness. This situation is illustrated in figure 3.2.
Anod*
The voltage distribution between the electrodes is shown in figure 3.3. In this example the cathode potential is 2
kV and Vp is the plasma potential.91
82

Cathode Anode
Fig 5.5 Voltage distribution in a DC GD process
-2000 2000 ♦ V
The maintenance of the discharge is complicated and is a difficult process to categorise. To examine and explain a
practical glow discharge in detail it is necessary to divide it into its four main regions, namely the cathode region, the actual glow, the Faraday dark space and the anode region. Before doing this, it is also a requirement that we look at the effects of the physical boundaries of the GD source regarding their contribution to secondary electron emission, which can involve up to four processes.
3c Secondary electron emission at the confines ofthe ion source
i By electron bombardment When electrons strike a surface they may knock electrons out of it which are called secondary electrons; the secondary emission coefficient of the surface is given by
number of secondary electrons ejected par secondn --------------- -------------------------------------------
number of primary electrons striking per second
33
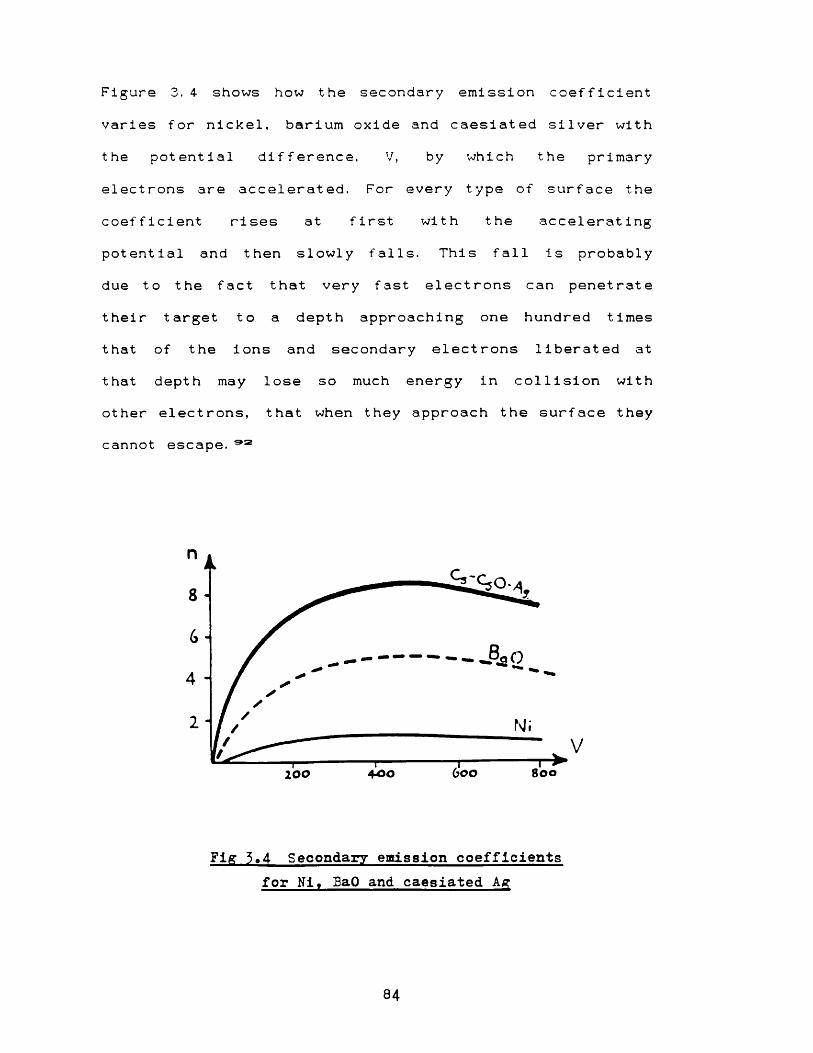
Figure 3. 4 shows how the secondary emission coefficient
varies for nickel, barium oxide and caesiated silver with the potential difference. V, by which the primary
electrons are accelerated. For every type of surface the
coefficient rises at first with the accelerating potential and then slowly falls. This fall is probably due to the fact that very fast electrons can penetrate their target to a depth approaching one hundred times that of the ions and secondary electrons liberated at that depth may lose so much energy in collision with other electrons, that when they approach the surface they cannot escape. 5,3
n
8
4
2
6oo 8 o o4 0 0200
Fig 5*4 Secondary emission coefficients for Ni« BaO and caesiated Ag
84

The distribution of kinetic energies among the secondary
electrons from a metal is shown in figure 3. 5. The values
vary with the target metal, but are little affected by V, except when it is small. The minor peak may not be attributable to secondary electrons, but to the direct reflection of primaries. 133
LilE3c
_aaa:
Secondaries
ow ReflectedPrimaries
u.o
IOOso0 25
V
Fig 5*5 The distribntion of kinetic energy among secondary electrons from a metal
This secondary electron emission takes place at the anode and walls of the GD source, but there is no electron bombardment at the cathode.
3c i i Bv ion bombardmentSecondary electrons may also be liberated by positive ion bombardment. The process is much less effective than electron bombardment and depends not only upon the type of metal but also upon the condition of the surface. A
lot of work was carried out between 1955 and 1965 on the
85

relationship between secondary electron emission and ion
bombardment in various environments, by Haegstrum, Knoll, Cobine, Carlston, Higatsberger and others. The secondary
electron coefficients for the ion bombardment by noble gases on atomically clean tungsten and molybdenum are
shown in figure 3. 6.
0.28n
T 0.24
He0.20
TungstenMolybdenum
0.16
0.12
0.08Kr
0.04Xe
400 600 800 1000Ion kinetic energy (eV)
200
Fig 5>6 Seoondary electron emission coefficients for ion bombardment of W and Mo in various environments
8 6

iii By neutral bombardment
The four processes discussed here for secondary electron emission are important in glow discharges because any of
of them can supply electrons to the discharge and then replenish the ion source after electron loss processes
have occured. As the positive column is more positive than the potential of any surface in the discharge, then
the region (sheath) around the cathode will accelerate electrons from the surface into the glow; this gives to
the discharge both electrons and energy.Less is known about the contribution of neutral bombardment to electron enhancement than about the other three. Figure 3.7 illustrates the secondary electron emission coefficient as a function of energy for argon ion (I) and neutral atom (N) bombardment of molybdenum. 98 The figure suggests that electron emission due to neutrals may not be of great importance in glow discharge
processes.
0.15 -
0.05
500 1 000 1500 2000
Energy (eV)
Fig 5*7 Secondary electron emission coefficients for Ar ion and. neutral bombardment of Mo
87

3c iv By photon bombardmentThe process whereby electrons are ejected from a surface by photon bombardment is known as photoemission. For a
pure metal the yield depends upon its work function and this photoelectric yield is small (10~A to 10“3 electrons
per phot on) in the visible to near ultra-violetfrequencies. The reason for this is that the photon is
efficiently reflected, except at very short wavelengths. The effect of photoemission in glow discharges is not understood and is very lightly documented, although some workers consider that photoelectric yields may be as high as those from ion bombardment.3®In figure 3.8, v is the photon frequency and v0 that of a photon with just sufficient energy to liberate an electron from the surface of a metal. The energy hv0 is equal to the work done in taking a free electron out of the metal and this is the work function of the metalmentioned above. The maximum kinetic energy in arbitrary units is shown as a function of v.
5
O — r4*4J 8 ia x lcr* s“>)o (Hirethold)
ia x io14 s-1
Fig 5.8 KE as a function of frequency for photons incident on a metal
88

3d The cathode glow and cathode dark space
The four main sections of a glow discharge are not of
great interest to an engineer, whether he be using it for
ion plating or plasma ashing etc. , but they are of great interest to the physicist. The remainder of this chapter briefly describes the four regions. This description leads into design considerations for the glow discharge ion source in chapter 4, and its subsequent evaluation in chapter 5.The cathode glow, even from a discharge with widely spaced electrodes, is difficult to see with the naked eye. Red predominates and the lines, which can be observed with an optical spectrometer, correspond to electronic transitions between the upper levels of the molecule which are closer together than the lower levels. The wavelength is inversely proportional to the energy difference and the closer levels give longer (redder) 1 ines.The cathode glow is probably caused by ions recombining with electrons. However, the electrons soon speed up under the influence of the electric field and it can be shown by considering the conservation of momenta between an electron and a molecule that the faster electrons do not recombine, and a dark space soon ensues. It is sometimes possible to see a very narrow dark space (the Aston dark space97) between the cathode glow and the cathode itself; no satisfactory explanation of it has ever been offered.
89

The cathode is an important part of the DC discharge ion source because it is usually the target, either in its own right when investigating alloys etc., or (in this thesis) when coated with an organic compound, and as an
electrode surrounding a silica capillary tube containing a mobile liquid phase. The cathode is also the source of secondary electrons and these electrons have an important role in maintaining the discharge and controlling the emission from the target of the material under invest igat i on.3e The negative glowThe linear decrease in field strength in the cathode dark space is sometimes called Aston's law. 90 If we move on to the adjacent region, the negative glow, it is possible to measure potential gradients using a pair of probes as neither probe takes up the potential of the plasma around it. (In the cathode dark space this cannot be done because the probes do not reflect the true conditions in the plasma). It has already been stated that as electrons pass through the cathode dark space they do not recombine so readily. Between collisions they are accelerated towards the anode and when the electrons enter the negative glow they are moving in a very weak electric
field, which accelerates them little between these collisions. Their motion is therefore random and they make more collisions with molecules, i.e. their rate of collision per unit volume increases. The kinetic energy of the electrons is rapidly transferred to gas molecules as an increase in temperature; this is the process of
90

relaxation (section 2c iv) and the resulting glow is that
seen when the ion source is viewed through thetransparent port on the source chamber of the mass spect rometer.
3f The Faradav dark spaceWhen the electrons are passing through the negative glow,
the retarding field reduces their drift velocity and electrons are diffusing out to the walls of the ion source. The importance of this third body was discussed in chapter 2 section c v. Recombination takes place and in the Faraday dark space the number of ions per unit volume falls below that of electrons, and the net space charge becomes negative.The Faraday dark space does emit a faint light due to the recombination process. It is pertinent to distinguish between the cathode dark space and the Faraday dark space in that they are 'dark' for different reasons. The intensity of the recombination spectrum (as determined
using an optical spectrometer) emitted from each space is proportional to the rate at which ions and electrons are combining per unit volume. In the cathode dark space the concentration of ions is high, but they and the electrons are moving swiftly, and their chances of recombination are small. On the other hand, in the Faraday dark space, the low speeds of the ions and electrons favour recombination, but the number of ions per unit volume is much less than in the cathode dark space.
91

3g The positive column and anode region
When the concentration of ions and electrons have become
equal, the space charge density falls to zero and the positive column starts (see figure 3. 1). In section 3d it was noted that as the anode and cathode are brought together, the positive column shrinks and both the column and the faraday dark space disappear.
The positive column of a gaseous discharge is luminous only when its cross-section is limited by a fairly narrow tube. In a large bulb such as a commercial neon lamp, the positive column is too diffuse to be seen. In our glow discharge source we see only the negative glow through the transparent chamber of the source; however, it would be interesting to distinguish and examine in detail all of its different regions using an optical spectrometer.
In the positive column the electrons and ions are not, on the whole, accelerated by the electric field; they
move through it with drift velocities whose average values depend on their mobilities. Between two collisions with molecules, an ion or an electron in the positive column is accelerated; but on the average the energy which it gains from the field is lost, or converted into random kinetic energy, in the second collision.
92

Figure 3. 9 shows that the positive column is virtually
field-free (it may therefore be called a plasma) and it
can be seen that the plasma does not take a potential
intermediate between those of the electrodes. Furthermore it can be seen that the plasma is the most positive body in the discharge; electric fields in the system are restricted to she at hs at each of the electrodes and the
sheath fields are such as to repel electrons trying to reach either electrode.
Near the anode of a gaseous discharge, the potential distribution curve may rise more steeply than through the positive column, or it may fall, as shown in figure 3.9.
V -PosiHve anode fall Y (small anode)
Negahve anode, Fall (large a n o d e )
Fig 3-9 Anode fall of potential in a gaseous discharge
93

The change in the potential distribution takes place over a distance of a millimetre or so and this drop is much
less than the cathode fall of potential, being rarely greater than 20 volts, 99 Because it is small and
concentrated into a narrow space, this anode fall of potential is difficult to study; it was investigated by Loeb in 1939 who considered that there is more uncertainty about the conditions near the anode than in any other part of the discharge. 100 It does seem that the sign of the anode potential fall depends on the area of the anode compared with the cross-section of the positive column. In practice, the anode does not play a very active part in the processes of the discharge - it merely acts as a current collecting probe.The above is a simplified view of the regions in the discharge process.
Most of the literature on the theory of glow discharges stems from the 1920' s and 1930's, i.e. from 'classical' experiments by physicists using widely spaced electrodes. Much later work is usually devoted to RF excited discharges, which have considerably wider applications than the DC discharges. For completeness at this point, a bibliography of the major classical works relating to
this chapter is added on the next page, rather than in the reference section.
94

Bi bli ographv
'Gaseous Electrical Conductors', Wheatcroft, Oxford, 1938.'Gaseous Conductors', Cobine, McGraw Hill, 1941.
'Theory of Gaseous Conduction and Electronics', Maxfield and Benedict, McGraw Hill, 1941.'The Conduction of Electricity through Gases', Emel£us, Methuen, 1936.'Electrical Phenomena in Gases', Darrow, Bailli&re, Tindall and Cox, 1932.' Fundamental Processes of Electrical Discharge in Gases', Loeb, Chapman and Hall, 1939.'The Conduction of Electricity through Gases' (2 volumes), J J Thompson and G P Thompson, Cambridge, 1933.'Electrical Discharges in Gases', Compton and Langmuir, Rev Mod Phys, 1930, 3, 123, and 1931, 3, 191.' The Mechanism of Electrical Discharges at Low Pressures' , Penning and Druyvesteyn, Rev Mod Phys, 1940,12, 140.Wheatcroft's book is biased towards the engineering
applications of the gaseous discharge; Cobine, and Maxfield and Benedict deal with both fundamental processes and applications in detail; Darrow's book is mainly interested in the physics of the discharge. Loeb gives both full and critical accounts of the theoretical and experimental work on the discharge processes. The Thompsons do likewise but this book is not easy to digest due to its layout.Compton and Langmuir's review is more detailed and
95
explanatory than Penning and Druyvesteyn's, but the latter does give full references up to 1940.
3h Summary
We have seen that the glow discharge is a phenomenon of the breakdown of the conduction of electricity through gases. The early work, before the Second World War, was undertaken by physicists and electrical engineers to explain the complicated structure of the light and dark spaces between the two electrodes. Even today there are some anomalies and minor regions in the discharge which cannot be satisfactorily explained.It was soon realised that beyond the breakdown point a gaseous discharge is a current-controlled device. This means that gas discharge tubes are of little use as amplifiers of smoothly varying signals but they are almost ideal rectifiers and relays. Early gas filled rectifying valves almost always used mercury vapour; the potential drop is only about 15V and is nearly independent of current, whereas a high vacuum rectifier passing the same current sets up a much greater potential difference. From about the 1950's onwards the classical concepts of the glow discharge were either refined, or largely ignored in the quest for further commercial applications. The latter now include sputter etching, thin film deposition and, of course, elemental analysis. The applications have widened considerably but the basic principles remain the same and a summary of these from
96

the preceding two chapters is now necessary before the design, evaluation and new applications of the GD ion source in this thesis are considered.There are three main types of discharge in a gas;
Townsend, glow and corona. The Townsend discharge takes place below the breakdown point of the gas and is easy to
categorise. Beyond this point, the complicated selfmaintained glow discharge occurs; the corona discharge is a special case of the glow discharge and arises when partial breakdown of the gas occurs, usually due to one of the electrodes having sharply angular geometry.A glow discharge may be called a plasma when it is equipotential.There are four gas phase collision processes involving electrons and molecules: electron impact ionisation whichsustains the glow discharge; excitation which is the least important of the four as it does not involve release of a quantum of energy; relaxation which provides the visible glow, and recombination (neutralisation) which with the confines of the ion source equilibrises the glow discharge. The processes are shown in figure3. 10.Penning ionisation has been shown recently to be as important as electron impact ionisation in the glow discharge process; it is a metastable neutral collision in which the neutral becomes ionised if its ionisation energy is less than the excitation energy of the excited at om.
97
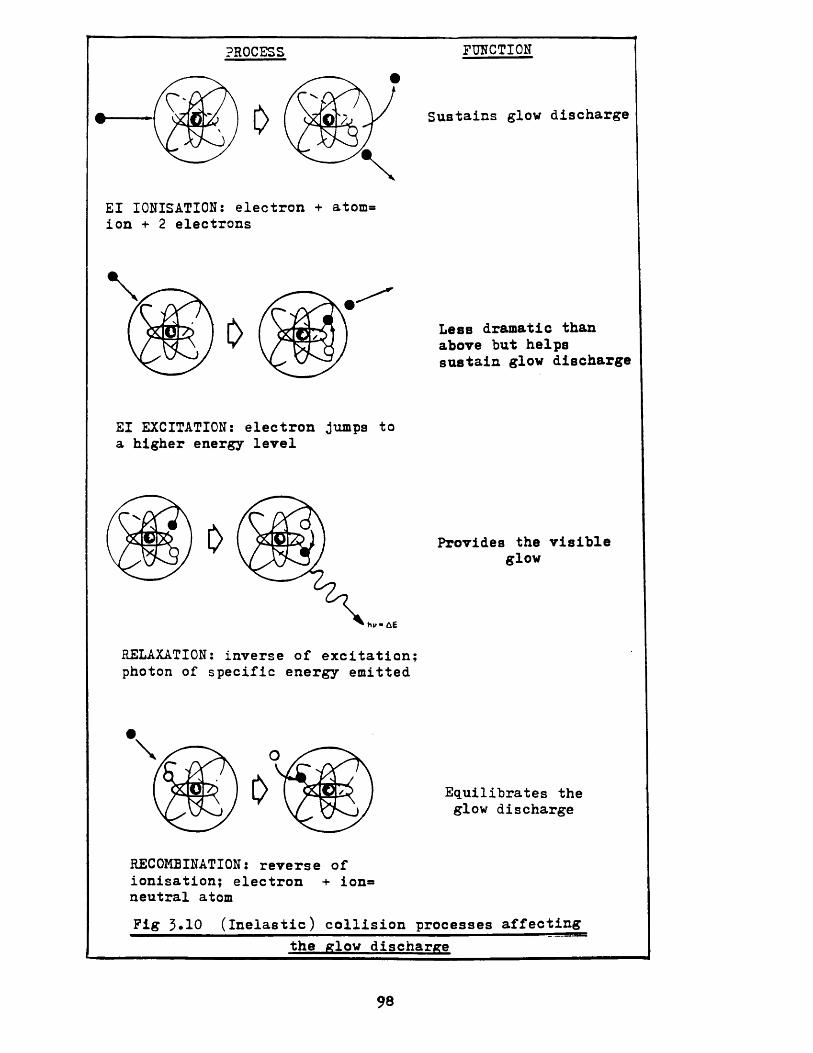
PROCESS FUNCTION
o Sustains glow discharge
El IONISATION: electron + atom= ion + 2 electrons
o Less dramatic than above but helps sustain glow discharge
El EXCITATION: electron jumps to a higher energy level
o Provides the visible glow
hi> ■ A E
RELAXATION: inverse of excitation; photon of specific energy emitted
o Equilibrates the glow discharge
RECOMBINATION: reverse of ionisation; electron + ion=* neutral atomFig 5*10 (inelastic) collision processes affecting
the glow discharge
98

There are three main differing plasma theories which
apply to a wide range of pressures and systems: these aresummarised in figure 3. 11.
In this work we consider a discharge occurring in a device at a pressure of about one torr.
Theory Pressure/system
Low gas pressure:
S park:
Extreme:
~ 10-5 to 102 torr
^ 102 to 105 torr
(a) high pressure (> 10^ torr)(b) very short gap distance(c) low pressure (vacuum breakdown)
Fig 3-11 Plasma system theories
*
Experiments due to researchers such as Langmuir showed that the main plasma in a glow discharge, i. e. all main regions except for the cathode (Crookes or Hittorf) dark space, were virtually equipotential.
Alternating current glow discharges, especially radio frequency systems are very important in practice but
cannot be considered here in detail.
99

The first half of this thesis concludes on a historical
note by illustrating, in figure 3. 12, De la Rue and
Muller's photographs of glow discharges taken in lS78.Q7r
C O . jt a b o u t I m m . H e,, potential HilTcrence auout 3 3 3 0 volts :
I.Iectrode-snacine incnesi . 7 ;j 19 23 j| 37 43C u r r e n t u n A i . . 9 1 o a U G « I 8 i '
C . H , ; spacine 22 3 Indies, a. 7 3 m A ; i, 0 4 m l.J. C , X , , spacins 23 incites. a. .2 7 m A ; A. 3 8 m A .4 . C O , r Ur ; s p acing 23 5 Incites, j . 18 4 m A ; 2 4 m A .
The thesis so far serves as an introduction to the
practical work resulting f rom attaching a glow discharge
ion source to a VG ZAB 2F double focusing mass
spectrometer. This research is described in the next
three chapters.
-**•****■ ■****
100

CHAPTER 4 - DESIGN CONSIDERATIONS4 i The triple electrode Ion sourceThe glow discharge ion source, shown In figure 4. 1, has
three electrodes and a Macor ceramic chamber, or a borosilicate glass chamber through which the discharge can be viewed via a transparent port on the external
source housing.A potential of up to 8kV is applied to the ion exit plate (anode) and the cathode is connected to earth through fifty 100 kohm, 24 watt, 5% resistors. With 8kV on the anode the discharge current is about 1. 4 mA and the voltage dropped across the discharge is 880.The ion exit slit is 8 mm long and 0. 4 mm wide and the source is rendered nominally gas-tight when the cathode, which is on the end of a probe, is mated with a conical recess in the third electrode (generally referred to as the source block). This electrode carries the entry portfor the discharge gas and the much wider connection tothe Pirani gauge head. The source focusing plates are 2.8 mm from the anode and 1.2 cm from the primary slit of the mass spectrometer.The source is operated at a pressure of 1 to 2 torr withthe mass spectrometer ion source housing at 8 x 10“storr.The ion source ceramics, including the cylindrical Macor
chamber, can be cleaned by mild shot-blasting using 80/120 carborundum grit; the stainless steel parts are best fettled using P400A silicon carbide paper, followed by electropolishing. A more sophisticated, but tedious,
101

m e t h o d of c l e a n i n g t h e f i n e e x i t s l i t i n t h e a n o d e i s t o
r e v e r s e t h e a n o d e a n d c a t h o d e l e a d s s o t h a t m e t a l l i c
d e p o s i t o n t h e a n o d e i s s l o w l y s p u t t e r e d o n t o a
d i s c a r d a b l e s t e e l c a p a c t i n g a s t h e c a t h o d e .
EARTHED VARIABLE SOURCE SLIT
FOCUSING PLATES
IONS j
II II
MACOR OR GLASSINSULATOR
r/COUPLESOURCEBLOCK
ION EXTRACTION PLATE (ANODE)
GLOW DISCHARGESAMPLE(CATHODE)
PELTIER DEVICE
TO PIRANI GAUGE
SAMPLETO
RESISTORS & EARTH
RESISTANCE HEATERPURIFIED RARE GAS
VIA CAPILLARY
PROBE GUIDE
RETRACTABLE PROBE
Fig A.l The glow discharge ion source
102

The pressure within the ion source is measured using a
calibrated Pirani gauge which is connected directly to, but isolated electrically from, the source high tension
(HT). The focusing plates direct the ion beam through the earthed primary slit on the main body of a double focusing mass spectrometer. The source can be heated to
about 400 °C using a tantalum resistance heater; alternatively, a Peltier heat pump heats it to 110 °C, orcools the device to about -40 °C. The temperature ismeasured with a chromel/alumel thermocouple strapped to the source block. The resistance heater is 0.25 mm diameter annealed tantalum wire CGoodfellow metals Ltd), wound through 6-core silica tube (Degussa Ltd) located in the source block.The ion source is located on a standard VG Analytical pedestal and flange for siting in the source housing of the mass spectrometer.4 ii Ion source controlThe anode voltage is nominally at 8 kV but can be varied from 0 to 8 kV, and output polarity can be reversed for negative ion work. The power supply has an internal resistor chain which also serves as the focus control resistors. If the combined current drawn by this chainand by the discharge and the source ballast resistors exceeds about 3.5 mA then the HT voltage trips out.Figure 4.2 shows the connections from the electroniccontrol units to the ion source.A ten turn potentiometer <R1) controls the potential difference between the two focusing plates (figure 4. 1)
103

which are nominally at the same potential as the ion
source, but which can differ in potential by a maximum of
about 5% of the HT, to allow for the ion beam to be
directed away from the ion source and accurately through the variable primary slit.
Fig 4.2 Beam focusing controls for GD ion source
Focusing plates3.5 niA max0 to - 10 kV
Anode1 Mohm R2 Cathode
5Ox 100 Kohm
HI500 Kohm 500 Kohm
8x 750 Kohm
A further control (R2> adjusts the focusing of the ion
beam by varying the mean potential of the focusing plates compared with the HT; this difference can extend to about 25% of the HT.
4 i i i Sample probes
The GD ion source accepts two probes to allow samples to enter the high vacuum environment of the mass
spectrometer via a vacuum lock. One probe is solid and the other hollow to take a silica capillary tube, usually
104
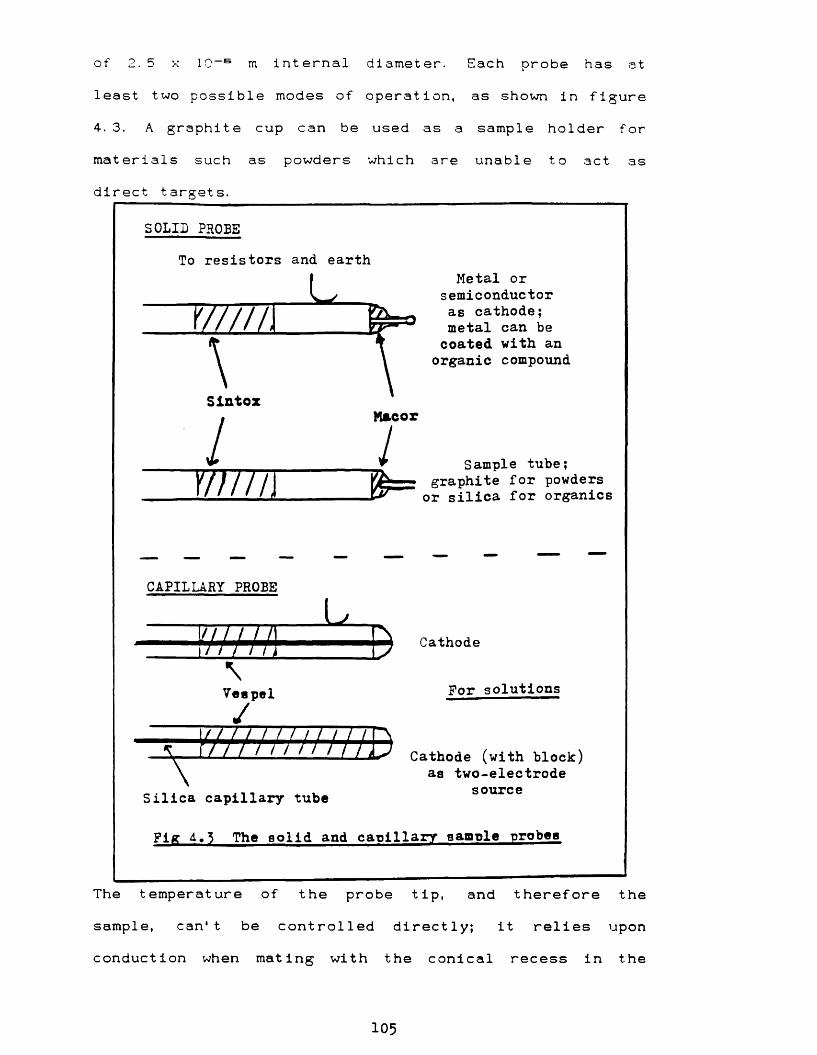
of 2. 5 x 10-s m internal
least two possible modes of
4. 3. A graphite cup can be
materials such as powders
direct targets.
diameter. Each probe has at
operation, as shown in figure used as a sample holder for
which are unable to act as
SOLID PROBETo resistors and earth
SintozMacor
77777]
Metal or semiconductor as cathode; metal can be coated with an organic compound
Sample tube; fly- graphite for powders QS or silica for organics
CAPILLARY PROBE
VJJ7T1i" / ‘ h\
Veepel /
L l
$
\y / r / / / , / ,/ I I / / / / / m
Cathode
For solutions
Cathode (with block) as two-electrode
sourceSilica capillary tube
Fig 4,3 The solid and capillary sample probee
The temperature of the probe tip, and therefore the sample, can't be controlled directly; it relies upon conduction when mating with the conical recess in the
105

source block.4 iv Source cooling using the Peltier effect
The tantalum resistance heater heats the GD source to about 400 *C in 30 minutes and it can be controlledbetween ambient and this temperature using a zero to 13 volt DC supply which, with its thermocouple, is isolated
at 10 kV with respect to ground. Alternatively, thesource will reach about 120 °C in this time from the heat generated by the discharge when using 8 kV; lower values of HT gave a cooler source.To control the temperature of the ion source more easilyand to cool the sample/probe tip region, a thermoelectric module was strapped to the source block. The module can also be used for heating <by reversing the leads) but in this mode the device has a limit of 110 ®C. The Peltierheat pump <RS Components Ltd; made by Melcor Inc) has 31bismuth telluride P-N junctions with a pumping capacity of 18.8 watts and a lower temperature operating limit of -150 °C.Figure 4.4 shows the module schematically when acting as
a heat pump. When connected to a DC supply, heat is absorbed on one side of the device from the ion source, which it will cool. The heat is rejected on the other
side of the module and must be removed; this heatincludes the pumped heat and the heat due to theelectrical power dissipated within the device. Figure 4.5 shows how this was done using a modified water cooled sample probe via the direct insertion lock of the mass spectrometer housing. The copper probe tip was in direct
106

thermal contact with the module via a conical recess inthe final heat conduction pad.
Heat from ion source
COLO
Fig 4.4 The Peltier device as a heat -pump
Fig 4.5 Method for cooling GD ion source using a Peltier device and a water-cooled probe
Cu P Cu
Retractable probe
IB
Cu cone in recessInlet water at 5 Cin Cu plate
IB - ion source blockCu « copper heat transfer plateI - ceramic insulatorP = bismuth telluride heat pumpTo
Power unit
107

4 v Source cooling control
The DC requirements of a Peltier device are not
stringent; figure 4.6 illustrates the closed loop control of the current from the Peltier device, with the
thermocouple (T) as sensor for the standard source temperature electronics in the mass spectrometer console.
Voltage"-Amplifier,
Power ^ Amplifier,
Therm alFeedback V t
ControlPotentiom eter
ThermoelectricModuleBridge
Fig 4»6 Closed loop control of Peltier device
4 vi Measurement of pressure within the GD source
The pressure in the source housing of the mass spectrometer is measured, in the standard way, using an ionisation gauge. The pressure of the discharge gas in the GD source is recorded, as stated earlier, with a Pirani gauge head.The gases used with this ion source were argon, neon,
xenon, nitrogen and ammonia.
108

Figure 4.7 shows. si mpl i st 1 c al 1 y, the locations of the
ionisation and Pirani gauges.
Source housing
Gas in
To Pirani gauge (range 10 to 10 torr) GD ion source
Pirani gauge (range 10“3 to 10 torr)
I -9 -2 \(range 10 to 10 torr)Ionisation gauge
To pumpsButterfly valve
Fig 4.7 Ionisation and Pirani gauge locations
The Pirani gauge is of the thermal conductivity type, the
operation of which is based on the principle that the rate of heat transferred through a gas is related to the number of gas molecules which collide with surfaces between which a temperature difference exists. The Pirani head consists of a heated wire with high temperature coefficient of resistance suspended along the axis of a
surrounding tube at ambient temperature, so that as the gas pressure increases, the temperature, and therefore the resistance of the filament decreases. Ambient temperature compensating filaments are provided and the whole forms a Wheatstone bridge.A Pirani gauge head should be mounted as close as
possible to the point at which the pressure is to be measured, using a short branch tube with a diameter no
less than the gauge head size. Long or narrow connections
109
can cause considerable error. 101 The reason for this is
that the heated wire of the Pirani head requires a constant replenishment of molecules in order to represent
pressure correctly; the pressure/current characteristics of the unit are not maintained in a restrictedenvi ronment.
The remote Pirani gauge connected to the ion source was
calibrated against a second Pirani head which was mounted on a spare flange on the source housing. Before calibrating, both heads and gauges were interchanged to check that their characteristics were identical.The readings were obtained by isolating the source housing using the butterfly valve after evacuation,admitting each gas in turn, and reading both gauges for a range of pressures over about three orders of magnitude. Measurements were not made for ammonia. The part of the calibration applicable to the operating pressure of the ion source is shown in figure 4.8.Gases entered the source chamber via a purifier, ametering valve and a borosilicate glass capillary 2.0 cm long and 0. 15 mm internal diameter, to preclude arcing down the entry port and to stabilise the flow from thepuri f i er.
With the source pressure at 8 x 10“s torr the analyser was at 6 x 10"° torr. The pumping speed of the source diffusion pump is 700 1 s~1 and the analyser region hasthree diffusion pumps, two of 300 1 s— 1 and one of 700 1 s— 1.
110

Fig 4-.8 Calibration of ion chamber (remote) Pirani gauge using source housing Pirani gauge
Xe Ar He
2.0
1.8 +>
•HO
1.2
1.1 Remote Pirani torr1.0
0.060.04 0.08 0.70.1 0.50.3
4 vii Purification of the discharge gasBelow about mass 50 Da, residual atmospheric molecules and water vapour etc. could impede the detection and quantification of elements either by direct masking, or indirectly from isotope effects or artifacts. Argides from argon as the discharge gas fall into the last category and were a nuisance, although their presence was
interesting. Prolonged pumping reduced the interference
111

to a certain extent.
Impurities were reduced in the discharge gas by treatment
before it entered the mass spectrometer. A Sircal rare
gas purifier was installed between the noble gas
cylinders and the spectrometer; its functions are shown diagramat ically in figure 4.9.
Tigetter CuO
Molecularsieve
To
mas 8TOO C
Removes : 0^ & IT
Process: Chem reaction/ sublimation
H and hydrocarbons
COChemicalreaction
co2h2o
Physicaladsorption
speo
Fig 4.9 Rare gas purifier (Sircal Ltd)
The purification system consists of a furnace in which a titanium getter tube at . 700 *C removes oxygen and nitrogen by chemical reaction, and copper oxide at 450
degrees removes hydrogen, hydrocarbons and carbon monoxide, again by chemical reaction. External to the furnace a molecular sieve drier operating at near ambient temperature clears moisture and carbon dioxide by
physical adsorption.
112

The purifier was used only when undertaking elemental analysis and has been developed to reduce the impurities
Ctypically about 20 vpm) in commercial grade rare gases down to very low levels. The two main impurities in 99.998% argon are oxygen and nitrogen at 2 vpm and 10 vpm
respectively. After a night's pumping with argon flowing it was determined, using the chart recorder, that (32Da) and (28 Da) from the argon had been reduced to animmeasurable level compared with the level of the two gases remaining in the residual air.
4 viii Sensitivity enhancement of the GD ion yieldTwo methods were considered for enhancing the sputtered yield from the target; the first of which was to involve the adhesion of two sintered 3 x 10—3 T magnets along the axis of the source block, as in a standard El ion source. This was found to be impracticable because of the design of the source, as magnets would be ineffectual due to the electron trajectory being parallel to the ion exit slit. The second enhancement method used a tungsten filament as
a floating electrode and is discussed further in chapter5 section a xii. Here we are concerned with the injection of more electrons into the discharge by using the hot
filament as a source of electrons. From figure 4. 10 it can be seen that the filament acted as the cathode, with the anode performing its usual function. This
113

arrangement, with the source block floating, is known as
a triode sputtering system, an extensive analysis of which is available. 102 It was also added to this GD
system in an attempt to give a quasi-degree of control to the discharge, as the filament current can be varied from
the mass spectrometer console. A coil of 1. 8 x 10“ m diameter tungsten wire on the end of the probe was used
as the filament. (Tungsten impinges upon the elemental
mass scale at 182, 183, 184 and 186 and pronounced peaksof the correct ratios were noted using this feature of the GD source).The filament is a source of thermionically emitted electrons and the anode will withdraw the electrons from the space charge around the filament, which is known as a hot filament cathode. A glow discharge is generated when a gas at a suitable pressure is introduced to the source. The difference qualitatively between this system and the cold cathode arrangement is that electron emission from the cathode is mainly by thermionic emission rather than by ion impact. It should be possible to generate discharges of several milliamps with low interelectrode
voltages of just a few tens of volts.xWWWWNI||— Cathode
Tungstenfilament
Ions
(max 50 mA)
Anode
Fig 4*10 Cathode filament arrangement
114

4 ix Dynamic range; Faraday cup and electronmultlpl1er
The mass spectrometer uses a 17 stage Venetian blind type off-axis multiplier stack which receives the ion beam after deflection. Throughout this work the gain of the
multiplier remained at about 10s; the dynamic range, i.e. range of intensity, available via this detector was about5 x 10s .
An axial Faraday detector was fitted to the instrument in order to measure directly the ion current of strong signals. This device extended the dynamic range of the system to about 10'7’. The Faraday detector was fitted with a suppressor electrode and two 3 x 10—2 T magnets <not shown) to reduce the effects of secondary electrons formed when the ions strike metal surfaces at near earth potential. The device was brought into operation by reducing the deflection voltage for the multiplier; both detection systems use the same amplifier system. The ion collection assemblies are shown individually in figure4. 11.
115

I
Siqnol out
Electron muitiolierDC offset voltoqe
Faraday cup
Virtualground
Guard electrode
Secondary electron suppressor electrode-9 0 V
| i Defining slit
Fig 4.11 Dual ion collector system ( V9how8 axis of mass spectrometer)
4 x Liquid Introduction into the GD ion sourceLiquids can be pumped into the GD ion source to replace the discharge gas, once the gas has established the
current flow from cathode to anode. This means that not only can the liquid be ionised and mass measured but that it acts, when in the gas phase, as its own conducting medium. In order to be conducting the liquid must be non-
aqueous. The ion source when running in this mode is shown in figure 4. 12.
116

In the capillary mode the source erfectivelly has just
two electrodes, in that the electrically conducting probe tip becomes as one with the source block to form the c at hode.
Cathode^ Ions
AnodeSolution
No gas in
Fig 4*12 Capillary probe and source configuration
Eluent leakage from source >
Ions2 torrSolution 0.2 pl/min
Source housingConsumption of eluent
by discharge torr10
To pumps
Fig 4*15 Canillarv/source eaulibrium conditions
for a stable discharge
117

Figure 4.13 shows the flow of liquid into the ion source and its consumption, including leakage from the source,
i.e. the equilibrium conditions for a stable discharge. Amicropump for injection was not available.The optimum flow rate for a solvent such as methanol was about 0.2 j j.1 per minute. The change-over point from argon
to methanol was smooth, the protonated molecular ion of methanol predominating after the gas had ceased to feed the discharge. The effect of the change-over of discharge media on the mass spectra of methanol is discussed in chapter 6 section c i.4 xi SummaryA three electrode glow discharge ion source has been designed to fit the source housing of a double focusingVG ZAB 2F mass spectrometer which operates, at 8 kV accelerating voltage, up to a mass of 1250 Daltons. Higher masses, such as oligomer target ions, were investigated using a potential of 7 kV. The twin sector geometry of the instrument permitted mass measurement of isobaric ions to four decimal places. The ion source was heated either resistively to about 400 °C or thermoelectrical1y to 110 degrees; cooling to about -40 degrees also was possible. The pressure within the ion chamber was measured directly using a calibrated Pirani gauge.
Two sample probes were available; a solid probe for
elemental and organic/organometallic analysis and a capillary probe for liquid phase introduction.
118
A purification system removed unwanted atmospheric and
water vapour molecules from the discharge gas before it entered the ion chamber; this approach was essential for elemental analysis below about 50 Da. Several electrode
combinations were possible, including a heated filament electrode, at a floating potential, in an experiment to attempt to enhance the ion yield from the source.The next chapter fully evaluates the above system and the final chapter describes applications of the glow discharge source to elemental and compound analysis, and in the liquid/gas phase mode.
**********
119

CHAPTER 5 - EVALUATION OF THE ION SOURCE
The glow discharge source was built by Ash Instruments of
Macclesfield from drawings by D Carter; this company also machined the Macor ceramic electrode spacer. The alternative glass spacer was cut and ground by Mr Mike Williams of the University College London Chemistry
Department glassblowing section.5a Physical parameters
i Choice of electrodes The combination of electrodes depended upon the mode in which the source was to be used and various configurations were possible; for elemental analysis the sputtering process was paramount (sputtering is dealt with fully in section a ix of this chapter) and the cathode was the target; for chemical analysis the compound was either deposited from solution onto this target or a non-conducting quartz sample holder used; similarly, for liquid introduction the conductingsurround of the hollow probe generally acted as a targetthus making a two electrode source, or as a floating electrode with the source block as the cathode.The type, i.e. composition, of the target electrode in the first mode obviously varied as the metal or alloy under investigation was changed. For mode two, thecomposition of this target electrode (when used) wasunimportant, provided that its elemental peaks and those from its isotopes and impurities did not interfere with the peaks from the chemical compound under investigation.
120

In practice gold was ideal as a 'dormant' target as it is mono-isotopic <197 Da), and the stated main impurities of 99.9985% gold (Johnson Matthey Chemicals Ltd) - palladium, silver and titanium - were usually insignificant. With many compounds the sputtered gold was not visible and often the discharge gas peaks also were of low relative abundance. If the source block was used as an active electrode, then iron and chromium peaks were
occasionally significant in weak spectra from compounds.5a ii Operating pressure rangeThe main factor affecting the ion source/mass spectrometer working relationship was the pressure of the discharge gas.Almen and Bruce have shown that the heaviest gases will give the highest yield from the target.103 Unfortunately radon <Z = 86) is the heaviest but radioactive, xenon
(54) follows with argon (18) and neon (10). Argon was used predominantly for this work and proved more than adequate due to the high overall sensitivity of the system. The argon was of 99.998% purity (BOC), whereas the anhydrous ammonia used in the organic work was 99. 6% (K and K Greeff Ltd).The ion source produces a stable discharge, with 8kV on the anode, for the three inert gases and nitrogen between about 1.2 and 2. 1 torr. The lower pressure limit at this voltage is set by the glow discharge which is sustained
by electrons producing ions by collisions in the gas. As the gas density decreases, the number of ionising
collisions also decreases and the glow discharge is no
121

longer maintained. Below about 1.2 torr the current
became very small for a bias voltage of approximately 880
vol t s.The practical high pressure limit at this voltage wasabout 2. 1 torr, because the discharge became unstable at
higher values.
5a iii Discharge current/anode voltage relationship
Figure 5. 1 shows the relationship between the discharge current and the applied anode voltage using argon at apressure of 1. 75 torr, for a gold cathode to anodedistance of 0. 75 cm. The voltage across the discharge with 8kV on the anode was 840 volts. The actual biasvoltage, of course depends upon the discharge current, which in turn, depends upon the pressure.
1.5 mA
Dischargecurrent
k V0 2 64 8
Anode potential
Fig 5»1 Typical discharge current/anode voltage relationship for ion source system
122

Therefore the sensitivity of the ion source could be varied by using different anode voltages. With an anode voltage of 2. 5kV the source was operating at a sensitivity only one order of magnitude less than when
using an anode voltage of 6 kV; this facility was useful, for instance, when only a small amount of organic
compound was available and a greater degree of control over the sputtering/ionisation process was required.The current through the discharge could have been varied by changing the resistor chain but this was kept constant at 5 Mohm.
5a iv Noble gases and sensitivityIn section a ii of this chapter it was stated that the heaviest gases produce the highest (sputtered) yield from the target.A batch of twenty gold targets was made by melting wire in a bunsen flame and fifteen similar in size and weight (about 0. 1 g) were selected; the targets were weighed to the nearest milligram. Five were used in one of the inert gases (argon, neon and xenon) at 1.8 torr for thirty minutes with 8kV on the anode, and the discharge current maintained at 1. 40 mA for each cathode by varying the HT slightly. Between each experiment the ion chamber was cleaned and the electrode spacer replaced. The targets were reweighed to determine the amount of gold lost for each discharge.Figure 5. 2 shows the mean loss of weight (sputtering
123

yield) of each batch of five and it can be seen that the
loss, between 9% and 15%, did not depend upon the mass of
the discharge gas. Other workers have, however, shown
this to be the case and they have shown also that the
yield depends upon the energy of the incident ion. 1 °‘* However, most experimenters have used much higher ion
energies, e.g. greater than 20 keV and they have shown that the models for the target yields are complex and contradictory between low and high energy levels, with a break-point at about 10 keV. The factor of sputtering integrity is considered to be of much greater importance in this work and is defined and discussed later in this chapt er.
Dischargegas
Mean by 5
weight lost targets (%)
20Ne 14.3
40Ar 9.4
129Xe 14.9
Fig 5.2 Comparison of sputtering yields for different gases
124

5a v The formation of germanium monoxideThe observance of five peaks at 86, 88, 89, 90 and 92 Dawhen using a germanium target and argon lead to the
conclusion that germanium monoxide CGeO) was being formed
within the ion source. (Ge02 , which was not observed, is a well characterised compound and exists in two cryst al 1 ographi c forms. los) However, GeO is only very
sparsely documented; there are five methods of producing the monoxide10® but it is considered that none of these
was involved in the GD source.The GeO was present in about twenty parts per million with respect to the host germanium. The relative abundances of the ions in the germanium oxide cluster and the host germanium and argon discharge gas are shown in figure 5. 3. The ion 3®Ar2 at 72 Da was masked by the 72Ge ion. This data was obtained from a single scan.
ION : Ge Ar, GeO
8570 9075 80
Da
Magnification 1 1.4 2 x 10⁵
Fig 5*5 Relative abundances of GeO and Ge in an argon discharge
125

Oxides of metals and other target materials are
frequently observed in discharges, e.g. AgO-", S1 NdO**-,LaO"*" and GdO"*\ 10-7
A few of the possible modes of formation of GeO in thedischarge are
Ge + 0 -» GeO -» GeO"-
Ge + O'*" -» GeO-
Ge'*’ + 0 -» GeO-"
Ge + 03 -> GeO"*" + 0
5a vi Discharge gas artifactsIt has been stated previously (chapter 2 c viii) that argon is an unreactive gas due to its closed outer shell configuration but that it can be ionised, in the GDsource, to acquire the electron shell configuration of chlorine. This is the reason for the appearance of ions such as ArH^, which is the ionic equivalent of HC1.When the GD argon mass spectrum of gold was run atincreasing orders of amplification the following main argon ions were observed; Ar*", 36Ar+ , ArH^, 3SA A r 2-**,A r3+, ArA*, Ars^ and Ars+. The ion 36Ar‘40Ar'" also was prominent.
126

The primary ionisation process in the glow discharge is
the electron impact mechanism
e~ + M -» M"*" + 2e—
which produces the major species Ar"*\ The minor isotope of argon (0.3%), 3SAr^t is always clearly visible. The ion Ar3^ is almost certainly formed mainly by the react ion100
Ar* + Ar -» Ar2+ + e—
The doubly charged argon ion, Ar2-*' is most likely derivedfrom a high energy electron impact reaction.ArH"' at 41 Da could be formed by the reactions
Ar-* + H2 -» ArH- + H and Ar + H2* -♦ ArH-*- + H
The most likely reaction is
Ar* + H20 -> ArH- + OH . 1 os*
This is consistent with the observation of a high abundance of ArH"*" in the presence of water.
The species Ar3"~ and ArA+ are the trimer and tetramer respectively of argon.
127

5a vii Effect of varying cathode to anode distance
The internal dimensions of the GD source chamber are shown in figure 5. 4. The cathode to anode distance, d,
was varied using gold targets of the same pin diameterbut of longer stem, in order to determine how the source
performed when d was varied. The optimum value of d for elemental work was 0. 3 to 0. 4 cm and the discharge wasextinguished when the cathode was about 0.2 cm from theanode. The discharge became unstable if the cathodebecame less than about 0. 1 cm in diameter.
1*2 cm
Fig 5*4 Dimensions (vertical cross-section) of GD ion source
Anode
(max - 0.8 cm)
1.0 cm
128

Two basic tenets of gaseous breakdowns are worth
including at this point.The fact that the breakdown voltage of a gas depends only
on the product of the pressure and the electrode spacing was discovered experimentally by Paschen, and is called Paschen's law. 1,0 This law applies provided the
electrodes are large compared with their distance apart.A further assertion is due to Townsend in his principle of similitude which states that, in geometrically similar electrode systems, the potential difference required to maintain a given discharge current is the same, if the product of the gas pressure and any given dimension is t he same. 1 1 15a viii Effect of varying the ion beam exit slitThe function of the slit on the anode plate was two-fold; firstly to allow the ion beam to leave the source and to proceed into the mass spectrometer's dual focusing system and secondly, to be sufficiently small to enable the source to operate at a pressure orders of magnitude higher than the remainder of the instrument. The slit width and height were varied by spot welding thin stainless steel sheet onto the anode. Changes in slit height did not appreciably affect the stability or sensitivity of the ion beam, but at a width of about 0.2 mm the source became unstable due to the decrease in pressure in the GD source chamber.
129

5a ix The sputtering process and atomicintegrity of the system
Sputtering has been mentioned earlier and is now
discussed fully, as it is a fundamental process in the operation of the GD source without which phenomenon elemental analysis would be impossible.It is well known that the walls of a discharge tube become darkened after prolonged use, and in the case of glass, the effect eventually can make the tubes opaque. At the same time, a reduction in the size of the cathode can be observed and measured gravimetrical1y. This phenomenon is known as sputtering and was first described by Grove in 1852. 113 As to the origin of the word, it apparently appeared in the English language as early as 1598 and is adapted from the imitative words 'sputteren' in Dutch and ' sputterje' in West Frisian. 113 As well as the unwanted effect in the discharge tube, sputtering has many practical purposes, but only its involvement with the GD source will be described here. Figure 5.5 illustrates the machinations resulting from an ion impinging on a surface. (The sputtering phenomenon is not limited to metals as the effect is also found with quartz, glass and mica, for instance). One or more of the following phenomena may occur.
The ion may be reflected, possibly with neutralisation; this is the basis of ion scattering spectroscopy, which leads to an understanding of ion-surface interactions.
The ion may lead to the surface ejecting an electron,
130

i. e. secondary electron emission as discussed in chapter
3.The third effect may be that of ion implantation - used
for selectively doping semiconductors.
Under the umbrella of 'radiation damage', the ion impact may lead to some structural rearrangement in the target
material, ranging from the filling of atomic vacancies to actual changes in the stoichiometry of an alloy.
Incidention Reflected Ions
& Neutrals
Surface
SecondaryElectrons
S tru c tjra l * Changes Possible
Bombarding Ions May be Im planted
SputteredAtoms
Collision May Term inate or Result In The Ejection Sequence: W ithin The Target Of A Target A tom
(Sputtering)
Fig 5»5 Possible interactions of ionswith surfaces
131
The final process involves the ion instigating a series
of collisions between atoms of the target, which can lead to the ejection of one of these atoms. The above is one interpretation of the sputtering phenomenon.
The rate of sputtering can be determined gravimetrically but the precise mechanism appears never to have been completely described. Kingdom and Langmuir considered
that the incident positive ion collides elastically with atoms beneath the surface of the target, some of which are ejected. 1 1 ■* Von Hippel was the first to find that the nature of the spectra emitted by the ejected particles was consistent with their being atoms of the target. 11s
He considered the mechanism to be a thermal process in which sputtering is evaporation of the target from local regions of high temperature produced by the impact of the high energy ions. The vapour diffuses back through the gas and back to the target, or towards other nearby objects on which the vapour condenses. If, however, this process occurs, it follows that thermionic emission of electrons also should occur from the hot spots, but measurements of the total electron emission are not consistent with such a high emission. Later developments of this and other views have been made by Townes, 11S Ecker and Emeleus,11^ and Takatsu and Toda.11s
The problem is compounded by three processes: <a> the
sputtering target may become a mixture of the original
152

target and the bombarding element embedded in it, Cb) the
target may ' sel f-dist i 11' and <c), both sputtered and distilled target material may contain occluded discharge gas and this material may differ considerably from the
host target.
In 1969 Sigmund published a paper on the theory of the
sputtering yield of amorphous and polycrystalline t arget s. 1 1 9
Sigmund assumed that a target sputters by energetic ions or recoil atoms which result from cascades of atomic collisions and he distinguished between two main stages of the collision cascade. First, the spatial extent of the cascade is determined by the slowing down of the primary ions and all recoiling atoms that are of comparable energies. The second stage is the creation and slowing down of low-energy recoils that constitute the major part of all atoms set in motion.
This separation of the cascade into two stages results in two characteristic depths which are important for the qualitative understanding of the sputtering process.
First, the sputtering events that eventually lead to sputtering take place within a certain layer near the surface, the thickness of which depends on ion mass and energy and on ion-target geometry. Second, the majority of sputtered particles originate from a very thin surface layer, because small energies predominate.
133

The sputtering yield formulae derived were in good
agreement with experimental results from a wide range of modes, including transmission sputtering of thin foilsand the sputtering of specimens irradiated in the core of
a reactor.
Sigmund's treatment is probably the most completeavailable in that it considers the sputtering phenomenon as a single entity, whereas the earlier discussion in this section tends to consider separately processes such as reflection and implantation.
In the glow discharge, however, for a matrix containing a mixture of elements, the elements do not appear to be sputtered preferentially. This has been explained byCoburn. 60 If one element sputters preferentially, the substrate will become depleted, and more of the otherswill then be sputtered; so after a time the discharge plasma reaches a steady state, in which the gas phasecomposition eventually is more or less the same as the substrate. It could be said that the glow dischargemaintains its 'atomic integrity'.This was verified by:
(a) checking the isotopic abundances of multi-isotopic elements such as tungsten and tin,
(b) measuring alloys of known composition and targets
which have known impurities.
134
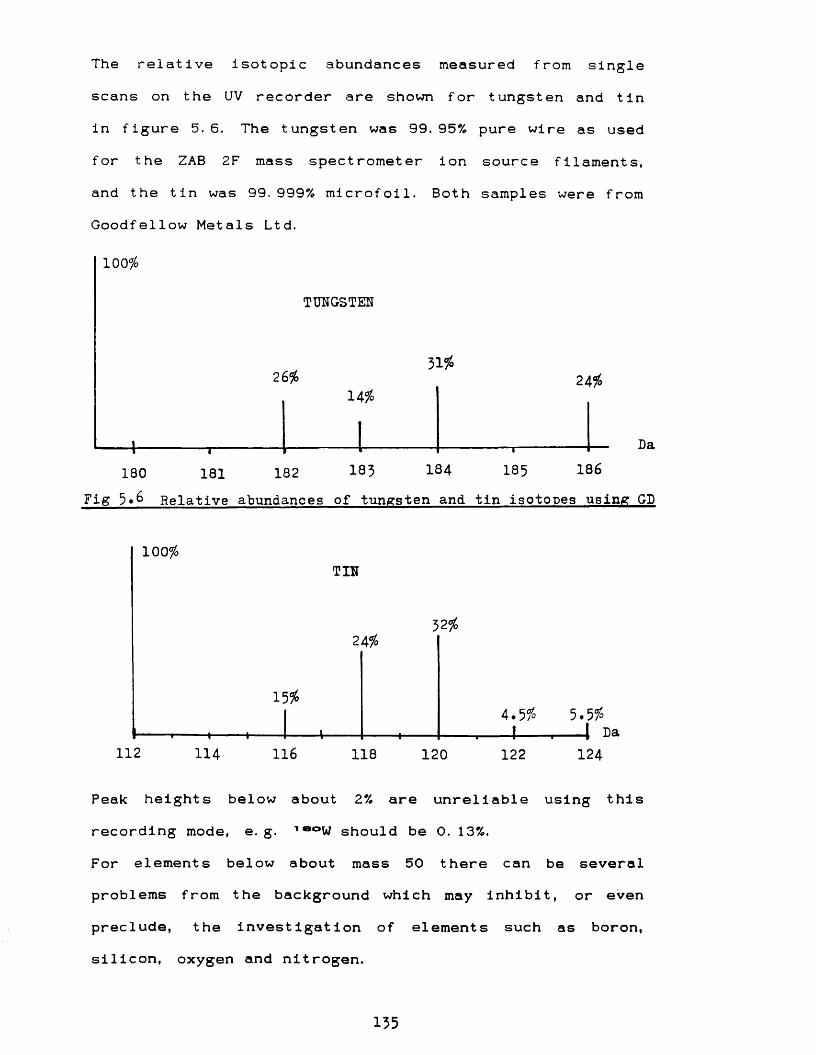
The relative Isotopic abundances measured from single
scans on the UV recorder are shown for tungsten and tin in figure 5. 6. The tungsten was 99. 95% pure wire as used
for the ZAB 2F mass spectrometer ion source filaments, and the tin was 99.999% microfoil. Both samples were from Goodfellow Metals Ltd.
100%
TUNGSTEN
31%26% 24#14%
----1--------.-------- ,________i________ ~ ' •180 181 182 183 184 185 186
Fig 5*6 Relative abundances of tungsten and tin isotopes using GD
100%T IN
112 116114 124118 120 122
Peak heights below about 2% are unreliable using this recording mode, e.g. 10OW should be 0. 13%.For elements below about mass 50 there can be several problems from the background which may inhibit, or even preclude, the investigation of elements such as boron, silicon, oxygen and nitrogen.
135
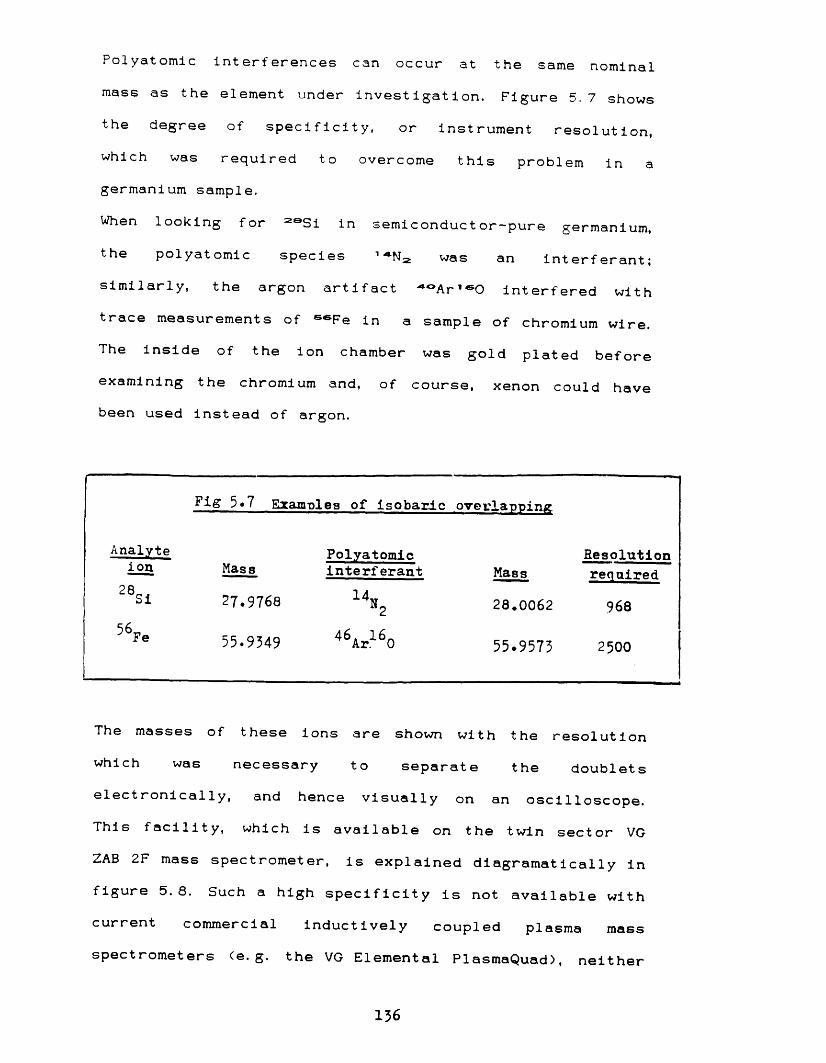
Polyatomic interferences can occur at the same nominal
mass as the element under investigation. Figure 5.7 shows
the degree of specificity, or instrument resolution, which was required to overcome this problem in a germanium sample.
When looking for 2sSi in semiconductor-pure germanium,
the polyatomic species 1 was an interferant; similarly, the argon artifact AOA r ,60 interfered with trace measurements of ssFe in a sample of chromium wire. The inside of the ion chamber was gold plated before examining the chromium and, of course, xenon could have been used instead of argon.
Fig 5.7 Examplea of isobaric overlapping
Analyteion Mass
Polyatomicinterferant Mass
Resolutionrequired
28S1 27.9768 14n2 28.0062 96856Fe 55.9349 46Arl60 55.9573 2500
The masses of these ions are shown with the resolution which was necessary to separate the doublets electronically, and hence visually on an oscilloscope. This facility, which is available on the twin sector VG
ZAB 2F mass spectrometer, is explained diagramatical1y in figure 5.8. Such a high specificity is not available with current commercial inductively coupled plasma mass
spectrometers (e.g. the VG Elemental PlasmaQuad), neither
136
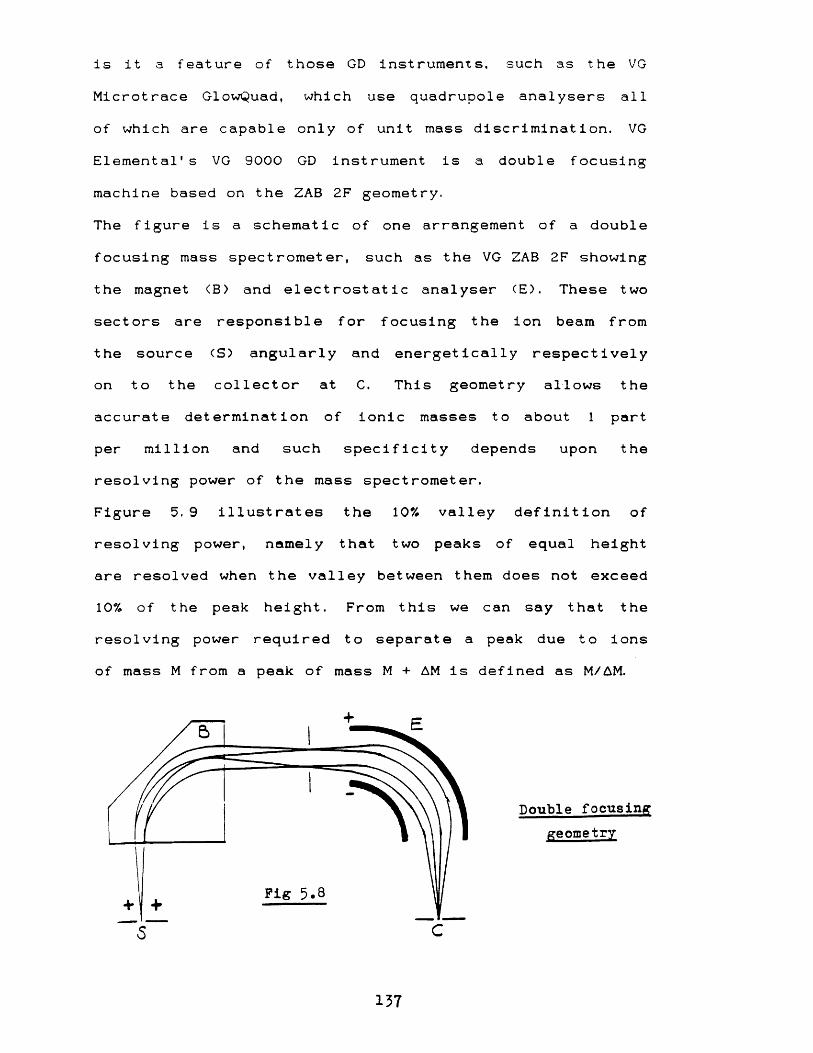
is it a feature of those GD instruments, such as the VG
Microtrace GlowQuad, which use quadrupole analysers all
of which are capable only of unit mass discrimination. VG Elemental' s VG 9000 GD instrument is a double focusing
machine based on the ZAB 2F geometry.The figure is a schematic of one arrangement of a double focusing mass spectrometer, such as the VG ZAB 2F showing
the magnet (B> and electrostatic analyser (E). These two sectors are responsible for focusing the ion beam from the source (S) angularly and energetically respectively on to the collector at C. This geometry allows the accurate determination of ionic masses to about 1 part per million and such specificity depends upon the resolving power of the mass spectrometer.Figure 5.9 illustrates the 10% valley definition of resolving power, namely that two peaks of equal height are resolved when the valley between them does not exceed 10% of the peak height. From this we can say that the resolving power required to separate a peak due to ions of mass M from a peak of mass M + AM is defined as M/AM.
Double focusin, geometry
137

100%
10%
M
Fig 5»9 Resolving power (10% valley definition)
The factor of greatest importance when quantifying results from the GD source is that of relative ion yield (RIY). This factor, for each element, is obtained fromthe ion beam ratio (IBR), which is calculated as follows and reflects the ability of the sputtering system (and mass spectrometer) to relate to the composition of the target material.
< v Z ~ ) <%**R>i b r = -----------------------
( * * R - > ( X ^ Z )
where vZ■** and ^R"- are the peak intensities of the isotope of the target analyte Z occuring at y Da and the isotope of the reference species occuring at x Da. The terms %VZ
and %**R represent the isotopic abundances of thesespecies. Figure 5. 10 shows the IBR and RIY values for a thermocouple alloy of composition 90% platinum and 10% rhodium, which was run on the GD source with platinum
1 3 8
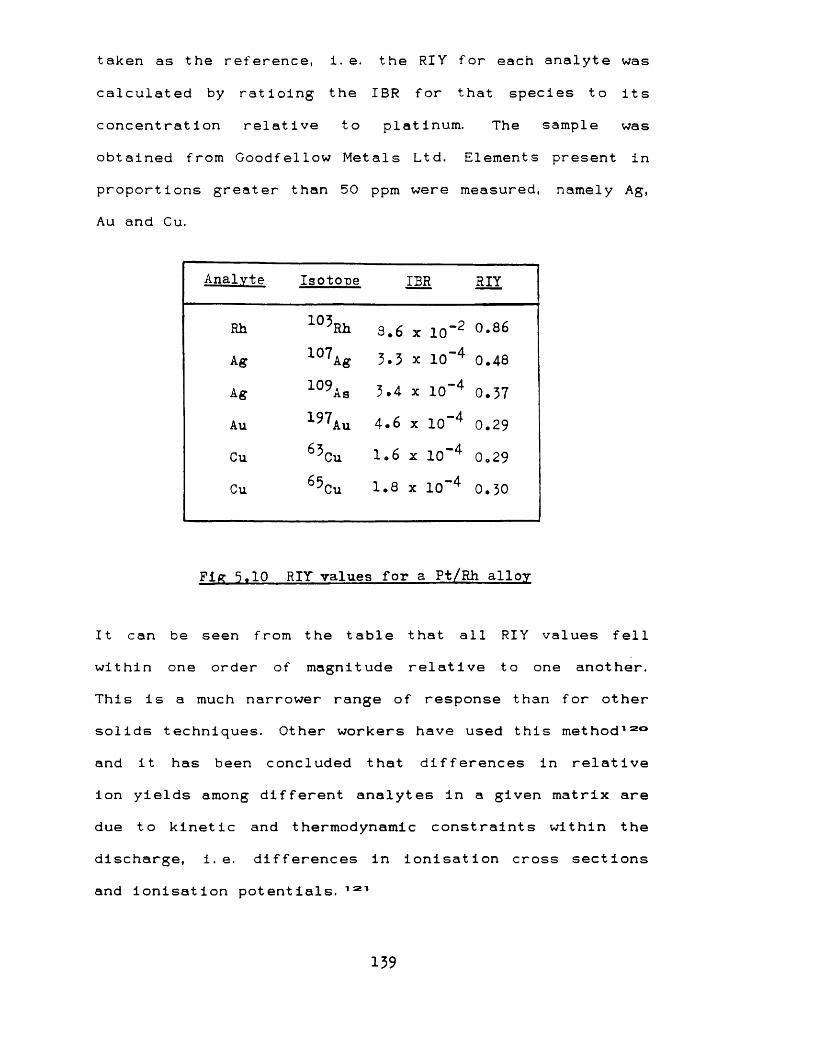
taken as the reference, i. e. the RIY for each analyte was
calculated by ratioing the IBR for that species to its concentration relative to platinum. The sample was
obtained from Goodfellow Metals Ltd. Elements present in
proportions greater than 50 ppm were measured, namely Ag, Au and Cu.
Analvte Isotone IBR RIY
Rh 1 0 ? R h 3.6 x 10”2 0.86
Aff 107a* 3.3 x 10“4 0.48
Ag 109As 3.4 x 10⁻⁴ 0.37
Au 197A u 4.6 x 10~4 0.29
Cu 6’cu 1.6 x 10"4 0.29Cu 65Cu 1.8 x 10~4 0.30
Fig 5.10 RIY values for a Pt/Rh allov
It can be seen f rom the table that all RIY values fell within one order of magnitude relative to one another. This is a much narrower range of response than for other solids techniques. Other workers have used this method130 and it has been concluded that differences in relative ion yields among different analytes in a given matrix are due to kinetic and thermodynamic constraints within the discharge, i.e. differences in ionisation cross sections
and ionisation potentials. 131
139

These results exemplify one of the great advantages of
GDMS, namely that the technique suffers from minimal
matrix effects. Nevertheless for quantitativemeasurements, calibration is still required.
*
5a x The capillary probeOf the three applications of the GD source investigated in this thesis, that using the capillary probe for 1iquid/gas-phase analysis is probably the most potentially useful. This section investigates the relationship between the capillary probe and flow rates into the GD source.The ion source operated in the discharge gas mode from about 1. 2 to 2. 1 torr and it was found that the capillary probe functioned within a similar pressure range when introducing liquids into the source.
Flexible silica capillary tubing of five different internal diameters was tried, i.e. 1 x 10~s, 2. 5 x 10~s,5 x 10“s, 7. 5 x 10-s and x 10~A m. Of these, 2. 5 x 10“s m proved most satisfactory; the larger diameters lead to pulsing when the discharge was unable to consume all the eluent, possibly with the formation of a droplet at the tip of the silica tubing. The 1 x 10“s m diameter gave an
unnecessary decrease in sensitivity, with occasional
140

blocking which was probably due to freezing of the eluent on the tip, even when the source was heated.
A micropump was not available and the technique relied upon liquid flow under the influence of atmospheric
pressure. The system was optimised simply by selecting the most compatible bore diameter, so that the source would consume the solvent and remain stable. This value was about 0. 2 j j,1 min~1 for 2. 5 x 10~s m tubing, 0. 8 m long <the inlet probe is 0.55 m long). This flow rate was not critical and could be varied from about 0.04 to0.32 jj.1 min-1. Argon or ammonia was used to initiate the discharge, with the liquid in many cases then taking over, at which point the gas flow was discontinued and the discharge was maintained by the liquid. The changes in mass spectra obtained around the transition region are discussed in chapter 6 c.
5a xi Ultimate sensitivityThis section looks at the sensitivity which was obtained from the two methods available for permanently recording single ions or complete mass spectra, namely the ultraviolet light recorder for single scans of the magnet and signal averaging available using the data system.
141

The humble UV light recorder remains the most
satisfactory means of obtaining a permanent record of a mass spectrum as the method does not suffer from the potentially adverse effects of the data system which
often can arise from either errors in setting up the system page before acquiring data, or from the over—manipulation of stored data.
The Johnson Matthey Chemicals Ltd 99. 9985% gold wire,i. e. it has a maximum stated elemental impurity level of fifteen parts per million, was examined for impurities before using as a target in the GD source. Three main impurities were observed, namely palladium <3 ppm),silver (3) and titanium <6>. Palladium and silver were not difficult to quantify because although some isotopes overlap they do not have common integral masses.The signal to noise ratio was such that if these elements had been present in the matrix two orders of magnitude lower then they would have been easily detected. However, it must be said that palladium and silver reside in favourable regions of the nuclide table - free from matrix, discharge gas, ion source and residual ion elemental and artifact interference.Johnson Matthey use optical emission arc spectrography - a three metre Ebert grating spectrograph - to detect the main impurities.
142

The use of a data system has two distinct advantages,i. e. a large amount of data (including normalised
spectra) can be stored for easy access and the detection limit can be improved by summing individual signals, thus averaging out unwanted noise. The signal can then be improved cosmetically by smoothing.
The VG 11-250 data system uses this continual summing method, which smooths the data using the moving average principle employing symmetrical triangle factors, to give a single output scan. This method, plus the unweighted factor and Savitzky-Golay factor methods of signal averaging were the subject of an early review. 122
When the noise was entirely statistical then a rapid enhancement of the signal was available. Occasionally other factors intervened to the detriment of the final signal: examples of these are; periodic rather thanrandom noise which was picked up from the console electronics, and drift on the mass scale due to the target nearing the end of its life causing the HT to be dragged down. A change of only a few volts rendered the summing virtually meaningless.
143

Figure 5. 1 1 is the result of thirty scans at 1379 Da
using an anode voltage of 7 kV. The unsmoothed peak is A u 7 i which is the lowest mass gold oligomer that proved
to be undetectable using the chart recorder.
GDI! il Bgfcl 1SHHMB ItM W B 2B-2F E0M l-19v M 1101 teti-SP
FT* I*li!
1378 1379 1380Da
Fig 3.11 Au? at 1379 Da
5a xii Effect of the tungsten filament
In chapter 4 section viii it was explained how a hot filament source of electrons could be used to try to
increase the number of electrons in the ion chamber.Using the arrangement shown in figure 5. 12, the ZAB FD/FI power unit was employed to control the temperature of the tungsten filament. The filament became incandescent with
144

about 30 mA showing on the FD control module. At thispoint the discharge current was 3. 2 mA and it was found
that the discharge could be maintained at about two orders of magnitude lower gas pressure than normal, i. e.
10-z torr, due to the thermionic emission of electrons from the filament.Samples were deposited from solution onto the filamentwhich was then heated slowly but spectra were very short
lived, less than five seconds, that is of shorterduration than the majority of FD spectra, which in
practice is itself considered to be a difficultionisation mode. This technique may be of greater use if a silica capillary be inserted as shown, for the introduction of solutions.A further experiment was tried using the filament cathode. If the current through the filament was increased, while the argon discharge was maintained, then it was possible with the cathode-anode gap at about 0. 4
cm to turn off the argon and to maintain the tungsten discharge between the two electrodes. The system soon
became unstable and the filament burnt out but this arrangement could be used, if stabilised, to examine gaseous emissions from metal discharges.
\ \W W ^Anode
Cathode
Fig 5*12 Prospective ion/sample enhancement assembly
initiatedischarge
145

This variation, which leads to a combination of
evaporation and sputtering, is the basis of ion plating. The technique was introduced by Mattox in the mid-60's, and reviewed by him in 1973.123
5b Additional effects and aspects of the ion source
i Reactive sputtering
In addition to the physical sputtering of a conducting target in an inert gas environment it is possible also to sputter the target and to combine its material chemically with a reactive gas or a component from that gas. This process is known as reactive sputtering and is in contrast to the elemental analysis procedure in which chemical reactions are unwanted and detrimental to both qualitative and quantitative analyis.
Reactive sputtering can be used to promote total chemical conversion of the target material. Oxygen and nitrogen are frequently used in reactive sputtering. In the discharge, molecular ions will be formed, and
dissociation will lead to atomic ions and atomic neutrals in ground and excited states. A good example of reactive sputtering is the fabrication of quartz films by sputtering a very pure elemental silicon target in a 50%Ar: 50%02 mixture. 123
There are several review articles on reactive sputtering and a good bibliography by Vossen and Cuomo. 123 The uses of reactive sputtering are numerous and include depth
146

profiling, 1 plasma ashing (plasma stripping)112:7 and
sputter cleaning. 1 Notwithstanding these applications, the theory is relatively sparse and there are a number of interesting effects of reactive sputtering which are
awaiting evaluation.
Using the GD source with a gold target and nitrogen as the discharge gas, various compounds in the gas phase were observed including AuN, AuN2 and higher homologues, all as intense ions. Attempts to observe silicon nitride using a polycrystalline silicon target were unsuccessful. It was intended that the molecular nitrogen be converted into active nitrogen, which should react with the silicon, and that the atomic nitrogen would be created in the dissociation process (chapter 2c vii),
e + N2 -» N + N + e
However, it is known that commercially produced non- stoichiometric silicon nitride contains a large percentage of hydrogen, in this case the reaction is reported to be
2SiHA + N2 -> 2SiNH + 3H2 . 1
147

5b ii Post-sputtering topography of the ion
source target
There have been a number of observations of the surfaces of metals and semiconductors, usually regarding the performance of commercial sputtering devices with regard to the cleaning of a substrate before depositing other metals or alloys. 13°* 13'» Such observations were usually made using oxygen as the discharge gas, the oxygen allowing for effective oxidation of organic impurities on the target surface by atomic oxygen forming dissociatively in the discharge. This is the plasma ashing process already mentioned.
In this investigation a gold target was sputtered with 8 kV on the anode for 30 minutes using non-reactive argon, and its surface features then observed and recorded using a Jeol JSM-35 scanning electron microscope <SEM>. Figures 5. 13 a, b, c and d are scanning electron micrographs of
the bulk polycrystal gold.
148
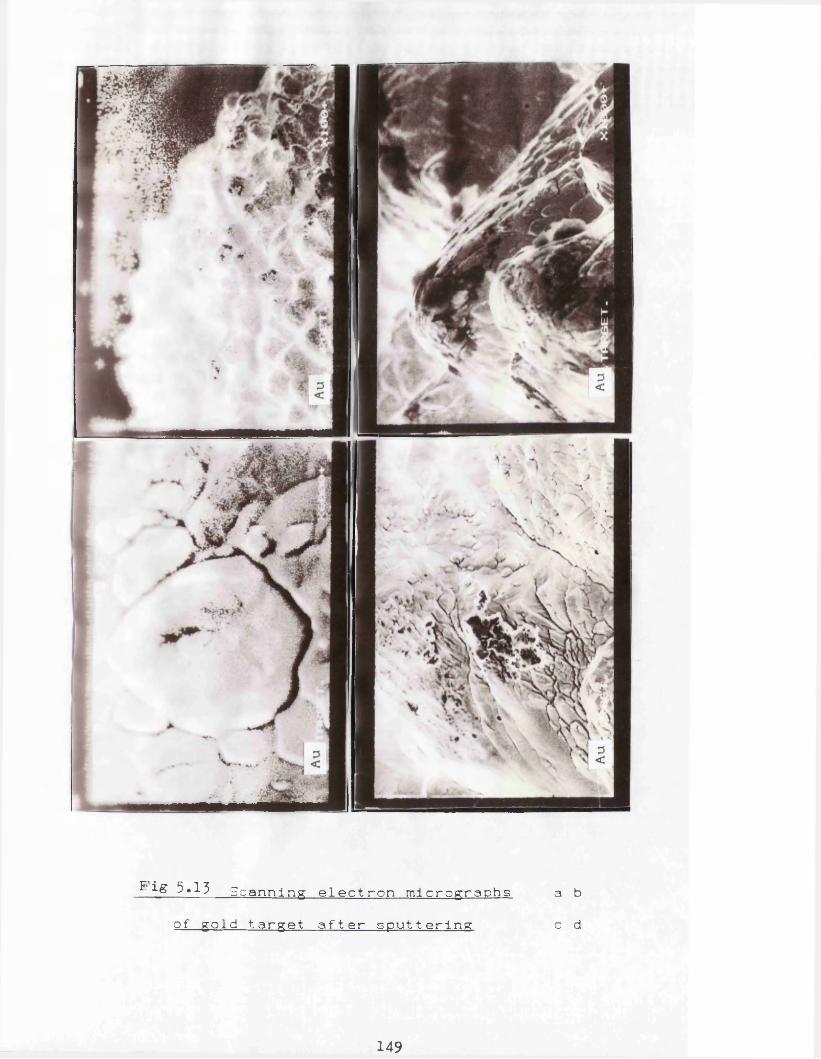
^ig 3*15 Scanning electron micrographs a b
of gold target after sputtering c d
149

Figure 5. 13 a is a low magnification <x 100) thermal
video print of the gold surface showing nodules, with valleys where the gold has been sputtered away. The protuberances are about 10— m wide at half height. The recorded image was due to secondary electrons and it is possible that the black regions are therefore
electrically non-conducting impurities.Figure 5. 13 b shows two adjacent nodules or cones at a magnification of 103 with scaling, or facets, clearly visible.The facets can be seen in more detail in figure 5. 13 c, at a magnification of 6 x 10³ . The large facet in thecentre of the picture is tending towards a cone, steps being visible around its periphery as it was eroded preferentially from its apex. This facet would have eventually assumed the size of its smaller neighbours.The earliest observation of these cones and facets was by Guent herschulze and Tollmien in 1942133, and it hasbeen suggested that the rounding of the cones is probablydue to the non-normal incidence of sputtering particlesfrom the in-situ discharge. 133The final figure, at a magnification of 103, shows one of
the more pronounced dark patches. No artifacts, other than iron and chromium from the stainless steel block, were visible in the mass spectrum and the origin of these dark regions is unclear. However, Chapman states that a high density of closely packed cones produces so much light scattering that the surface resembles black matt
150

velvet, a condition which can be confused with gross contamination. 13:3
Clearly, these investigations using a SEM could be
applied also to the anode and to the discharge chamber walls (sputter deposition) and the topography there compared with the conical etching of the target.
5 b iii Source cooling effects
Several well-established mass spectrometric ionisation processes were discussed in chapter 1 b where it was seen that these differ widely both in methodology and in the amount of energy which they impart to the molecule under investigation. These techniques (El, Cl and FAB) have evolved in order to overcome both the lability of many low melting point organic compounds and the low vapour pressure of a large number of polar organic and organometal1ic substances.
The second function of this thesis was to compare mass spectra obtained for organic compounds with those from some of these other techniques and this is covered in chapter 6 b. Here we are concerned with any effects that the thermoelectric cooling might have on organic compounds when ionised in the GD source.
151

The main problem when the compound was deposited from
solution onto the gold target concerned the high surface temperature of. the gold - which absorbed a large part of the DC power input - compared to that of the bulk target.
To overcome this the majority of spectra were run at a low anode potential and this was found to be more
efficacious than cooling the source to 0 "C.
The Peltier heat pump was efficient in that an indicated source temperature of -20 degrees C could be attained in about 15 minutes, but it was essential that the cooled probe made good contact with the final heat pad of the pump. In short, the device cooled the source effectively but it was difficult to use to any great advantage.
A variation was to use the block and anode as electrodes and to mount the sample in a fused silica tube on the probe. This method gave much greater control over sample evaporat i on.
152

CHAPTER 6 ~ APPLICATIONS OF THE GLOW DISCHARGE SOURCE6a Elemental analysis
i General applications to metals and allovs
The applications of a GD source with a mass spectrometer for elemental analysis are well-known outside the field
of organic chemistry and proprietary machines are available, using as analysers either quadrupoles, a single focusing magnet system or with the latter followed by an energy focusing sector. This final geometry is known as reverse Nier— Johnson but the magnet may precede the electrostatic analyser, as in the VG range of 7070instruments and the AEI/Kratos MS 9 and MS 50.The double focusing arrangement is both highly sensitive and specific, provided that there are no interference peaks in the region of interest from the discharge gas and other artifacts, such as Fe, Cr and Ni from the stainless steel. (The VG 9000 instrument uses a tantalum discharge chamber to exclude interference from iron).Gold of 99. 9985% purity was reported on in chapter 5section a xi, in which Ag, Ti and Pd were measured and it was estimated that these elements could have been detected at least to 2 or 3 x 10—° parts of the host gold using a single scan recorded on UV chart paper.A graphite sample holder which was machined from Mining and Chemical Products Ltd RWO grade graphite rod was used as a sample tube to measure the level of chromium in aGaAs pellet. The pellet supplied was small and could notbe used directly as a target; the graphite cup acted as
the prime conducting material for the GaAs sample.
153

Figure 6. 1 illustrates the factors considered before the
experiment was undertaken, including the main impurity
levels given by MCP Ltd for their Ringsdorff grade RWO
graphite rod. It can be seen that these elements and low
impurity levels do not interfere with the four isotopes of chromium at masses 50, 52, 53 and 54. However, all
stainless steels have a large percentage of chromium,commonly ranging from 9% to 25%. (Neither the iron norany nickel and molybdenum present affect the observation of chromium). The GD ion source block was made from 316 grade stainless steel which has a chromium content of between 16.5 and 18%, depending on the melt, and the anode (plus the Pirani and gas tubes) are of 304 gradewhich has a similar level of chromium, with somemanganese for ductility and malleability. Figure 6. 1 shows the parameters considered in order to determine the level of Cr in a GaAs sample.
Stated impurities in graphite sample holdermass element s m11 B 0.0140 Ca 0.206 3 Cu 0.1056 Fe 0.2024 Mg 0.0528 Si 0.2048 Ti 0.0151 v 0.01Stainless steel; Fe + • • • •
grade 316 504Ni 8 - 14% 8 - 11%Cr 16 - 18% 17 - 20%Mo 2 - 3% 0
Mn C\J
Isotopes of chromium
5°Cr 4.4%52Cr 84.0 Fig 6.1
” cr 9.254Cr 2.4
T KA

The problem of the chromium content of the stainless
steel was overcome by coating the source block and anode with gold by sputtering a gold target for about 30 minutes and then running the GaAs sample in the graphite
hoi der,The Cr in the GaAs was measured as 7. 8 x 101S atoms cc- ’. Low mass interference was not a problem with this sample but it is common in GD elemental work, and a recent paper indicated a way in which this might be overcome. 1 A pulsed glow discharge, rather than a constant DC voltage discharge was used. Differences in the signal forms allowed for the discrimination against selected types of ion signals by using narrow data collection gates placed over different parts of the pulse period. This spectral discrimination gave the ability to separate the ion contribution of the background discharge gases from that of the sputtered species. This was made possible because the gas and sputtered species behaved differently over the pulse period. The pulsed GD source was used with a quadrupole detector but could also considerably enhance the performance of sector mass spectrometers at low masses.The idea arose from the fact that pulsed hollow cathode
lamps show increases in emission intensity of several orders of magnitude with no increase in line width. 1 Time-resolved emission profile work using these lamps showed that similar advantages might be possible with elemental ion intensities.
155

6 a i i Boron as an impurity in gallium arsenideThe initial raison d'etre for this ion source was to compare the GD technique with FTIRS using GaAs. The disadvantage of IRS is that it is limited to atoms which are lighter than the host atoms of the crystal and whose localised vibrational modes (LVMs) occur in a spectral region where the crystal is transparent, whereas GDMS can
give a full elemental analysis. However, IRS can giveconsiderable information about the distribution amongst the various lattice configurations of the impurities, about which GDMS can say nothing.Crystals of GaAs are grown by the Czochralski method in which a suitably oriented seed single crystal (e.g. <111>) is dipped into a molten reserve in a siliconcrucible. This reserve is formed by RF induced eddycurrents in a graphite jacket around the crucible. Therevolving parent single crystal is raised and a much larger daughter single crytal ensues as progressive freezing occurs at the solid-liquid interface. Molten boron trioxide (B203 ) is employed as an encapsulant to prevent decomposition of the GaAs.1Dopants may be incorporated deliberately before'pulling', but impurities may also be added inadvertently during the growth of the crystal; the Czochralski method causes a significant amount of C and 0 impurity. The
process takes place under argon at a pressure slightlygreater than 760 torr, but residual oxygen has oneadvantage in that it acts as a getter for metallic trace impuri t ies.
156

In order to compare the GD and FTIR techniques for GaAs, boron was taken as an example of an impurity; thiselement lies in a difficult region for FTIR but for GD presents no artifact problems. The relative sensitivity
factors for Ga and As were not required because the objective was to measure the ultimate sensitivity using a
sample doped at a known boron level of 100 ppm. The FTIR data was obtained from Royal Holloway College.
Figure 6.3 exhibits ,0B and n B at 100 ppb in GaAs. These signals were obtained by computer averaging following prolonged purging by the gas purifier, with the GD source, probe and sample already located. The GD source was maintained at 50 degrees C during this period. This lengthy treatment was necessary in order to outgas the system, especially the source, as arcing can readily occur with semi conduct ors due to their low conductivities. (The conductivities of a good conductor, such as Ag, and GaAs are respectively 10s and 10~^ to 103 S cm-1, the latter depending upon the level of impurity or doping). From figure 6.3 it can be seen that a boron level lower than 10 ppb could have been observed.
The GD mass spectrum of GaAs in the stoichiometric region
is shown in figure 6. 2 and the FTIR spectrum of pure GaAs can be seen in figure 6. 4.
157
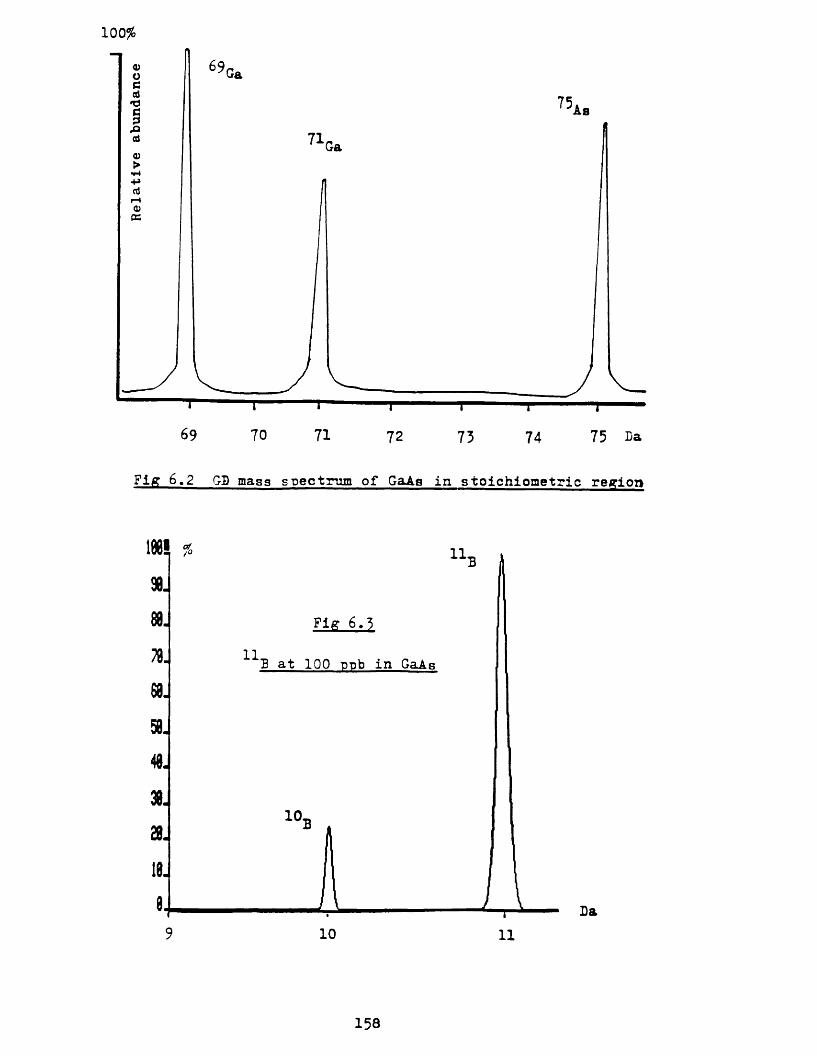
Relative abundance
100%
Ga
'As
Ga
T T T
69 70 71 72 73 74 75 2a
Fig 6.2 GD mass spectrum of GaAs in stoichiometric region
11
B at 100 ppb in GaAs
10.
9 10 11
158

Restrahlen region
20
10
-1W&vemimbers cm
400 600500300Fig 6,4 FTIR spectrum of cure GaAs
The figure above was obtained after spectral subtraction and illustrates the unit of line strength,
Measurements of the relative parts by weight of elements using a GD mass spectrum are simply made by comparing the summation of the abundances of the nuclides of each spec i es.
However, such measurements are more difficult using FTIRS. Line strengths of LVMs are quoted in terms of oeA (peak height) and A (the peak width at half peak height), so that ocA x a = 1. This product is the unit of line
strength in cm-2.
159

For B on the Ga site, o c A = 1 corresponds to approximately 5 x 101S atoms cc_1, There are 2. 2 x 10²² Ga atoms cc — 1in GaAs, so ocA = 1 corresponds to either 2 ppm or 1 ppm
of ’’B in GaAs, depending on how one quotes for a diatomic crystal.
By referring to figure 6.4 it can be seen that it is difficult to see a sample of line strength unity without spectral subtraction. As well as the necessity for this procedure, there are four basic problems of i nt erpret at i on.
The first is that boron has two isotopes (11B / 1°B « 4/1)and the element can exist in up to 10 differentconfigurations in GaAs. The lines are labelled BQ-l, B <1:,...... B c10>- Of these, only Ba», B C1> and B <25 = B^m arestrong lines (see figure 6.6).
However, the second problem arises because in actual samples, Bq ^ is more likely to be the site for B. <BQ-l implies B situated on a Ga site). The two lines for are, 1 1 BaQ-l at 517 cm-1 and 1 °BaQ. at 540 cm-1.
The third problem is that both the above lines lie in a region of intense two-phonon absorption (see below), so extremely careful background subtraction is required.
160
The final difficulty is that there are two-phonon peaks just to the side of each of these line positions and the
inexperienced observer can easily mistake these peaks for B.
The processes we are considering in infra-red absorption are the removal of photons from the incoming beam and the creation of lattice excitations (phonons) or excitation of the vibrations of the impurities.
In GaAs there are no frequencies of lattice vibrations above about 295 cm-1 so one-phonon absorption is around and below 300 cm-1. However, the allowed frequencies ofthe modes of vibration of the GaAs lattice have two possible energy values, corresponding to two distinct phonons. If two phonons are involved then it is possible to match both momentum and energy of these by various combinations so that one obtains a signal at 2 x 295 = 590 cm-1. This means that 12C(0km, for example, at 583 lies within the two-phonon region, consequently a LVM at 583 cm-1 can decay into two phonons. Whereas 11BA- at 601 can only decay via a three-phonon process which gives a much narrower line.
161

(The 11B lines occur at 371, 641 and 763 cm-1.
The 1 °B .. .. .. 387, 669 and 796 cm-1'The 10B^_ .. .. .. 602 cm-1.
The 1 1 B^« " " " 628 cm"1). 13:7
A comparison summary of the GD and FTIRS techniques is given in figure 6. 5.
GDMS FTIRSSensitivity (using data system) low ppb low ppb
Mass range all elements generally elements lighter than host material
Locationinformation
impossible site concentration feasible
Speed of analysis less than 1 hour
up to 12 hours
Ease ofinterpretation
generally easy usually complex
Main drawback tedious for some low mass elements
complexinterpretation
Figure 6,5 Comparison of the GDMS and FTIRS techniques
162

10.
-1Wavenumbers cm
550500
Fig 6»6 A heavily B doped GaAs eample
The FTIR spectrum above shows n BaQ. at 517 cm-1 and 10BaQlBl at 540 cm-1. The line strengths are approximately 15 and 7 respectively.
163

6b Mass spectra of organic compounds
A data system was not initially available for the 2F mass spectrometer and spectra were recorded using UV chart paper. At the start of the project this was not a disadvantage because many of the features of interest, for example minor isotope peaks, argides and transient gas phase products such as GeO could be examined in detail. The advent of a data system dedicated to the instrument enabled spectra of organic compounds to be stored more conveniently, but at the same time this method of retrieval and storage generally ignores these very minor components due to the methods of thresholding. Spectra stored using the data system are annotated accordingly; those for which the UV recorder was used, or clusters observed on the oscilloscope, are normalised from the chart paper or from the stored trace on the screen.
The heart of the data system is a Digital Equipment Corporation PDP 11-73 minicomputer with 0.5 Mbyte of memory. A digital scanner controls the mass spectrometer, the main parameters being the scan speed and range and the anode HT, and a continuously sampling analogue to digital converter produces digital data. The magnet of
the ZAB 2F is virtually unlaminated and five second per decade scans were normally used, e.g. from 500 to 50
Dal t ons.
164

The dual collector assembly is not controlled by the
computer but the recording threshold of their derived signals may be varied, either manually by changing the zero of the main spectrometer amplifier, or by using the acquisition interface software. Both systems may intentionally, or otherwise, exclude weak peaks in a spectrum. The dynamic range of the whole system approaches 10'7’.
The mass scale of the data system was calibrated routinely to 9 5 0 Da using the following peaks; Ar-** ( 4 0
Da), Ar2+ ( 8 0 ) , Au- ( 1 9 7 ) , AuAr- ( 2 3 7 ) , A u ^ ( 3 9 4 ) , Au3^ ( 5 9 1 ) , Au 4.‘*‘ ( 7 8 8 ) and Aug* ( 9 8 5 ) , by sputtering gold inan argon discharge.
For clarity, peaks due to the target and to the discharge gas, where observed in spectra in this section, have been subtracted from some of the figures shown.
6b i Glycerol (mol wt 92)Glycerol is an aliphatic triol. This compound was chosen
in order to compare its mass spectrum in the GD mode with those obtained on the ZAB 2F in El, and in the softer ionisation modes, Cl and FAB. (Glycerol plays an important part in the FAB technique as a matrix for many compounds; it is relatively involatile, has good
165

solubility and surfactant properties and is miscible with
many solvents).
The spectra of glycerol in the four modes is shown in
figure 6. 7; the GD spectrum, which lasted for about 20 seconds, was obtained by placing 0.5 )jl 1 of glycerol on a
gold target.
El gave a very small (0.04%) molecular ion, with the ion I C2Hb02] - at 61 formed by cx-cleavage and loss of CH20H as the base peak.
The ammonia Cl spectrum consists almost entirely of the ammoniated molecular ion at 110 Da. The intense ion atm/z 110 is an example of an electrophilic addition reaction to give the CM + NK*J ■*" ion. In this case NH^"" from ammonia has not acted as a proton donor to give MH-" at m/z 93.
FAB produced the protonated Cor quasi) molecular ion at m/z 93 (100%), plus oligomers (not shown). The majorfragment peak at m/z 75 is formed by the loss of water. GD also gives a protonated Cor quasi) molecular ion, [ M+H] ■*■, which is important as it suggests that the mode might be a promising soft ionisation technique. Identical spectra were obtained with the sample either on a gold target or in a sample tube, and the question arises as tohow the molecular ion is formed.
166

100%
GlycerolEl
44
50Da
100% 110[m+nh]
ClMW
Da50 100
100%
50 100
FAB
Da
100%[m+h]
50 100
GD
Da
167

The mechanism of the formation of this type of ion in FAB has been the subject of considerable debate and
insight. 1 1 1 One possibility using FAB is that the ions are desorbed after being preformed on the target.
However, it is possible that in the GD source the ion is formed in the gas phase after being sputtered off by the gas neutrals moving towards the target, and a selfprotonation reaction then occurs to give the protonatedmolecular ion
M-- + M -* MH- + [ M - H] •
This can occur either by transfer of H"' from M-**- to M orby transfer of an H atom from M to M**- . It is notpossible to distinguish between these two reactions in the present system, and there is the possibility of at least three ionisation processes occuring in the ion source, namely El, Cl and Penning. When it occurs in an El source with a suitable probe this apparent simultaneous evaporation and ionisation without pyrolosis of the sample is known as desorption chemical ionisation (DCI). Some charge transfer may also take place because there is an ion at m/z 92.6b ii 1. 1. 3. 3-tetramethvl-2-thiourea (mol wt 132)Following glycerol, a range of compounds was selected to
be run in the GD mode. The GD spectrum of this thiourea, which is shown in figure 6.8 exhibits significant fragmentation and an interesting molecular ion region cluster in that the M-" and C M+H]+ ions are both dominant,
168

again indicating mixed ionisation mechanisms.Both the fragment at m/z 88 and the base peak at 76 are
observed in the El spectrum, the former peak
corresponding to the loss of NCCH3 )2.a}a to Aod r\
K CM£ ^ cnpH CMrt S30 CMto rH££ 2 os■= S LTVO rv
C/1 CO >-> Of C/1 ccV* wCO u
S C UlN U U
a o c o
CO C3a9 Ua ; i d u c ru tt• r\ s
— * a o"» v ofe ac *<71 Q . “0 9 C D — _
fV>33O\i
§| C0 = o
53 -- SO
to-ru
\/ \K> K\
33 33O O
U1 09 uo uo CB uo UO m OD cn
Fig 6.8 GD mass spectrum of 1,1«5.^-tetramethyl-2-thiourea
169

6b iii L-Cvstine (mol wt 240)
Underivatised amino acids have always proved difficult
using the other ionisation modes, although some of the less polar examples are amenable to El. For charged samples a Russian group developed a method of ion extraction from aqueous solution at atmospheric pressure which gave a spectrum of arginine.
Both FAB and El runs were attempted using the ZAB 2F. Cystine is difficult to run by FAB, although the addition of an acid such as t rif luoroacet ic to MNOBA as a matrix encouraged the appearance of a small [ M+H]* ion of less than 5% abundance compared with m/z 74.
The amino acid did not run using El and, with arginine, it was the only free protein amino acid not to perform using this technique.
Cystine Clmg) was placed as an emulsion in methanol on a gold target and attempts made to sputter off the compound at temperatures from zero to about 250 degrees C. No ions were observed. The addition of 0.5 )jl1 of glycerol, with the target at 80 degrees, produced the spectrumillustrated in figure 6.9.
The protonated molecular ion is apparent at m/z 241 and
about 10% abundance, and it is assumed that glycerol
170

carried cystine into the gas phase where it was
successfully ionised, albeit to form an ion of relatively
low abundance. It is not clear why glycerol gave m/z 92 rather than m/z 93 in this instance. The peak at m/z 185 is the protonated dimer of glycerol.
The Cl spectrum of cystine was run using methane as the reactant gas to give the ion C M+H] at m/z 241 as the
base peak and this mode was superior to GD in this respect.
Fig 6.9 GD mass spectrum of L-Cvstine
racism xl Bgd*t 1182*9 89 80 ZflBBpA** I=I8v Hasftl TIM>7732888i RV L-CYSTINE GO RRGDN/GOLD/GLYCEEOL ST 8 8 DOT
1ML«J39 \ as Jwj'si'9 J 55 J 53 J 53 J :3J <5 j <8J 15 J■a]icSj :3 J:s j
68
56
48
74
( G ly c )
32
71
36
62
116
182
98
138
jLLl
Rent ISP PT* 8®
Sys: SYSTDDErCaL:ABGQLa
CH— wn,
COOH cooh
C6H12N 2°4S 2
185
(G ly c )
168148
i J154ib.
Hadji176 ,
. i iIIIJ
133
11111
C y i t l n e
MW = 240
GD
iS il1
[m+h] +
827 241
11 l58 188 158 288 258
171

6b iv Monensln (mol wt 670)
The El mass spectra of tetrahydro - and dihydrofurans and some related compounds have been reported. 1 However,
the neutral ionophore monensln, which is a polycyclic ether, does not show a molecular ion in the El mode but
exhibits the loss of two water molecules. The loss of these and the formation of other dehydration products are shown in figure 6. 10.
M+ m/z 670 (absent)
-2H20▼
m/z 634 (12$)
m/z 616 (26%)
m/z 599 (62%) m/z 598 (55%)
Fig 6,10 The formation of dehydration -products from monensin
172
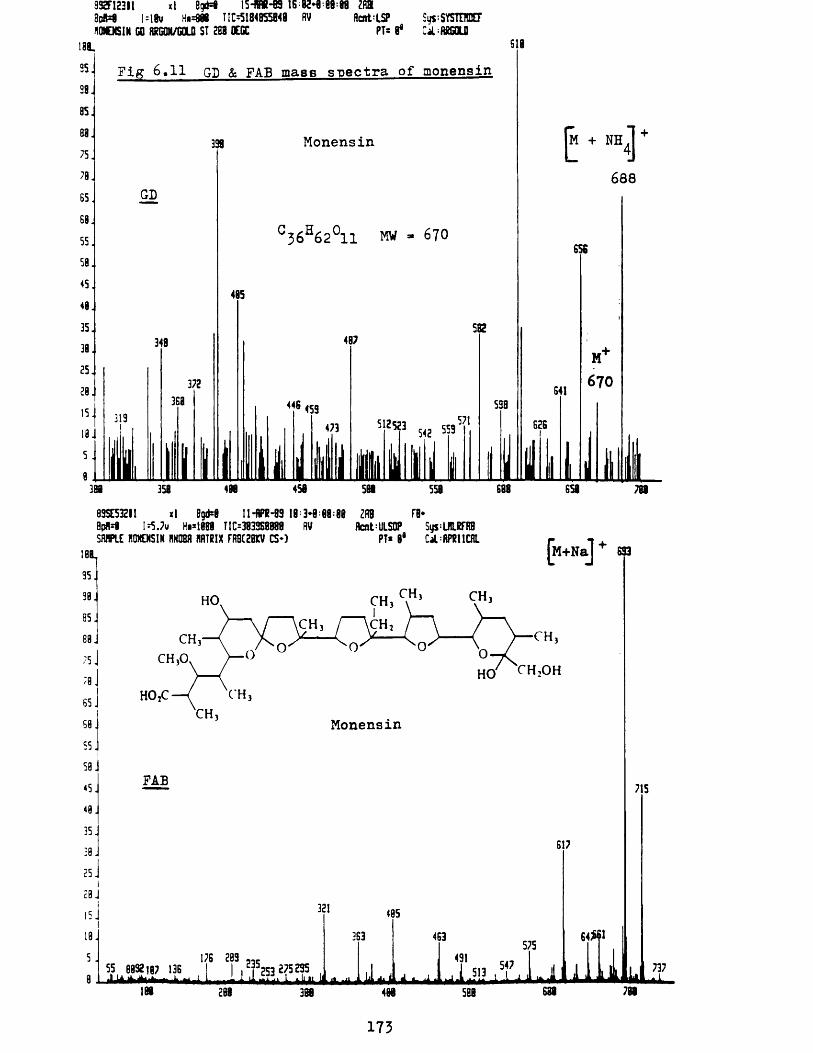
832F123II xl 8gd=8 15HW-89 IB 82*0=80=89 2RHBm I=18v n = m T 10 5184855840 RV Rent ISP Sus SYSTDDETnONENSIN CO RKtHM/GQLO SI 288 OEGC PT= 8® Ck ASGOLO
Fig 6.11 GD & FAB mass spectra of monensin
Monensin
36H62°11 MW » 670
SIB
582
SS8
p + ™ 4] +4J688
65S
641
626
M670
688 6S8 781
89SE532I1 xl 8g«tt ll-OT-89 18=3*8:88:88 ZRB FB*8p8=8 I=5.7v Ha-1888 TIC=3833E8888 RV AcntULSOP Sys:LflLRFRBSflBPLE HONENSIN nNOBfl RRTKIX FR8C20KV CSO PT> 0® CiCATCllCfiL
188,
95
90
85
80
7578
65605550454035
30252015105
[M+NaJ * 633
CH CHHO, CHCH ,CH CH
HO ^H:OHCHHO:C
'CH Monensin
FAB
617
32!
176 20355 8092107 136 I I , 2? 5 353 275 235
188 208 308
405
363 463575
491
-I .™ .sM ^ i508
64 1
U
715
k737
408 788
173
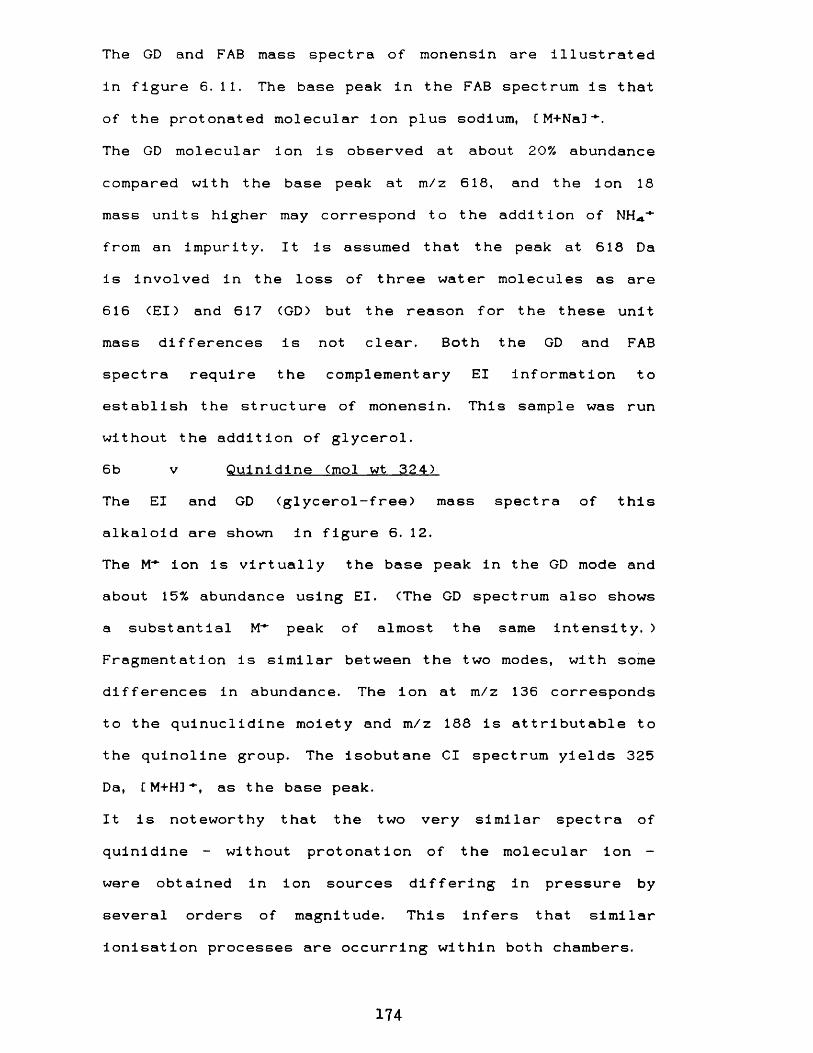
The GD and FAB mass spectra of monensin are illustrated
in figure 6. 11. The base peak in the FAB spectrum is that of the protonated molecular ion plus sodium, C M+Na] ■*■.
The GD molecular ion is observed at about 20% abundance compared with the base peak at m/z 618, and the ion 18 mass units higher may correspond to the addition of from an impurity. It is assumed that the peak at 618 Da is involved in the loss of three water molecules as are 616 (El) and 617 (GD) but the reason for the these unit mass differences is not clear. Both the GD and FAB spectra require the complementary El information to establish the structure of monensin. This sample was run without the addition of glycerol.6b v Quinidine (mol wt 324)The El and GD (glycerol-free) mass spectra of this alkaloid are shown in figure 6. 12.The M-* ion is virtually the base peak in the GD mode and about 15% abundance using El. (The GD spectrum also shows a substantial M-** peak of almost the same intensity. ) Fragmentation is similar between the two modes, with some differences in abundance. The ion at m/z 136 corresponds to the quinuclidine moiety and m/z 188 is attributable to the quinoline group. The isobutane Cl spectrum yields 325 Da, C M+H] as the base peak.It is noteworthy that the two very similar spectra of
quinidine - without protonation of the molecular ion - were obtained in ion sources differing in pressure by several orders of magnitude. This infers that similar ionisation processes are occurring within both chambers.
174
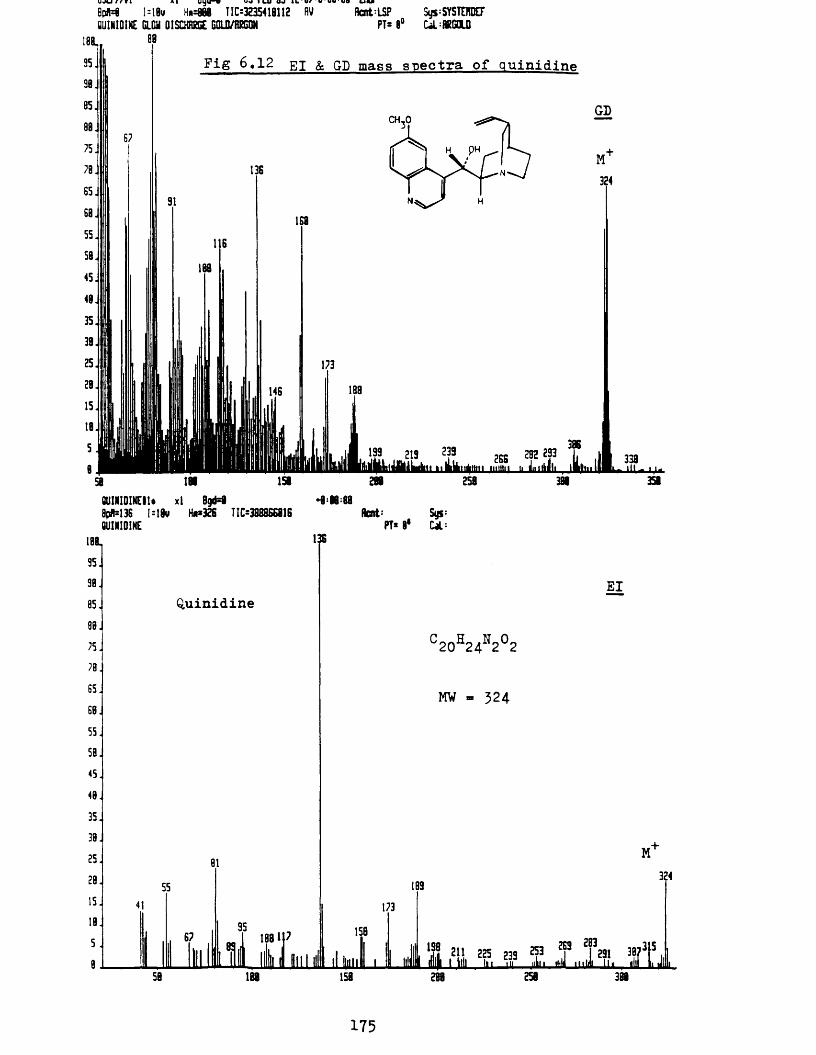
' o o u uo^ct/yvi m o y w o^-ruj-ag it wBpM I=18w Ha=880 TIC=3235418112 RV Rcnt’LSP Sys-SYSTCTDEFQUIHIOINE GLQii OISCHHSCC GOLO/RKCQN PT= 8° OaL RRGOLO
Fig 6,12 El & GD mass spectra of quinidine
GD
M+324
386 Bill. 2BS f? k ill 338IhttiAttm muiii I. j.-iiH l. I t i^ . ...
258 381 39
QUINIOINEIU xl Bgd= 8 *8:08488p8=136 I-18v H«*32S TIC=3888SS816 Rent-' Sys=QUINIDINE PT* 8* U ' -
108L 13835.
30.85.
80
75
78
65
60.
55 .
50 .
45
40 .
35.
30.
25
2 0 .15.
1 0 .
5
Quinidine
81
55
6735
M108 IP
El
C20H24N2°2
MW = 324
M
189 324
173150
1 1 g T, I..,h .288 258 38858 188 158
175

6b vi Iodooctadecane (mol wt 380)This haloalkane, used dry on the gold target, did not
yield a molecular ion. However, the following ions were
prominent; I (127), Au-" (197), M^-I (253), Au2+ (394) andAu-4- + By inference, the molecular ion may be
calculated either from the peak at 253 or from the ion at 450. The M^-I ion might possibly be formed by HI
elimination from a protonated molecular ion. The GDspectrum can be seen in figure 6. 13.
Fig 6.15 GD maaa spectrum of iodooctadecane
MW 380
Iodooctadecane197100%Au
450M -I127 Au+253
394Au,
Da400300100 200
6b vii 15-crown-5 (mol wt 220)
Crown ethers are used widely in various synthetic processes and have proved of use also as FAB matrices. When run by El, 15-crown-5 gives a very weak molecular ion, with most of the current being carried by the complementary ions at 89 and 133 Da. These fragmentations are shown in figure 6. 14.
176

The crown ether was run dry (no glycerol) to obtain the GD spectrum in figure 6. 15. The molecular ion at 220 Da
is the base peak and ions at m/z 89 and 133 are
prominent. Meaningful fragmentation must be gleaned from the El (or a Cl) spectrum.
M * . m lz 220Main losses
from 15-crown-5CH
m it 89 (100%)CH,
mil 133 (74?b)
100% 220GD
220MW
133Da
50 100 Fig 6.15 GD mass spectrum of 15-crown-5.
177

6b viii Bis (pvridine-2-thionato) hexacarbonvidirhenium (mol wt 760)
The structure of this recently characterised metal carbonyl cluster is shown in figure 6. 16. 1 ‘4-3
Both El and GD (dry run) mass spectra, shown in figure 6. 17 on the next page, are weak but illustrate the molecular ion cluster, and the progressive loss of carbon monoxide from this ion which is a common feature with all polynuclear metal carbonyls. However, the breakdown of these metal clusters is dependent on the metal and decreases rapidly in the order 1st row > 2nd row > 3rd row of the Periodic Table. Past experience with El, Cl and FAB on organomet al 1 i c compounds has shown that many
are very labile, and that infrared spectroscopy and 13C NMR data from C 13C0]-labelled molecules are essential to complement mass spectrometry. This GD result is encouraging but some incompletely characterised metallic
complexes which were run only yielded the metal. The inset shows a computer calculation of the expected isotope abundance of the molecular ion.This compound did not run in the Cl mode.
0 c ^ I I ^ c 0
Fig 6.16 The structure of Bis ( yivrldlne-2-thlonato 1
heiacarbonvldlrhenlum
c0
c0
178

332711111 xl Bgd=0 00-MR-89 15 31*0 68 00 ZflHHF El*Bpfl=0 I=10w H»=800 TIC=2711254B1B RV dent ISP Sys=SYSTEI!DEr«170 GO RKGON/GOLO 68 OEGC SOURCE 0T* °fl
233PT* 0 fl CaL=flR60L0
c0
N' \ teN° C , I ....s/71 ..CO
I'Re"' / "Res c o
C0
^16^14^2^6^2^e2 MW - 760
M
760713
533S7S
5405B7
621640
ll688 701
098022611 xl Bgd=8 00HSW-09 00:5*0=00=00 12-250BpIW I =7S2*v HmI130 TIC=27514000 W Rcnt tSP SMPIE HK170 250 OEGC CKH3 USED PT= 0°
El*Sys STEHDEFCjL=1CHL
100,95 .
90
35 J
00 75
70
55.
50 .
55 .
50
45.
40.
35.
30.
25 .
20. 15
1 0 .
5 .
El Fig 6,17 The El and GD mass spectra of Bis (pyridine-2-thionato) hexacarbonyldirhenium
83
67
h
100.
50.
0 : | , I 1 I ■SB 760 762 764 766 760 771
?=4*Lp K T U 9 M ESC=DTtvuu taunti "Pmt Wiardoopy tCUW.tftCtoriD
155220
I
187
100
296
256Jo. 324
200 300
565
381 420430 4|* 4ff 5j 2 S?3 j|
592
620 StB 676732
V.760
400 500 700
179

The results from the overall range of organic compounds
show that the GD technique Is a promising Ionisation mode but the indications are that it simply complements other modes. Structurally significant fragmentation is often
available from the GD spectra. When sample involatility is a problem then a matrix such as glycerol may be used to encourage the sample to sputter off the target. The compound does not necessarily need to be soluble in the matrix, as the latter may act simply as a mobile carrier prior to ionisation of the compound away from the target. There are several ionisation mechanisms in operation as is shown by the presence of both odd-electron molecular ions and even-electron protonated species. The technique usually leads to some fragmentation, but one disadvantage is that the spectra are short-lived - up to a maximum of about 45 seconds.
6b ix Ammonia as the discharge gas
The Cl mode and the use of the CHe^ reagent ion from the conjugate base, CH*., has already been discussed in chapter 1. This ion has a proton affinity CPA) of 536 kJ mole-1, whereas the N H ^ ion from NH3 has a PA of 847.
This means that proton transfer from NH^"' is restricted to compounds with a proton affinity greater than that of ammonia such as amines and amides. 1 However, ammonia is
frequently used in Cl for its ability to add N H ^ to compounds containing a wide range of functional groups.
180

It was anticipated that the use of ammonia as the
discharge gas in the GD source might give results
analagous to ammonia Cl. However, the compound 5-
valerolactam was run in the GD source using ammonia as the discharge gas and it gave an intense M-*" ion as base
peak (after NH3-- at 17 Da) at 99 Da, with no C M+NH*] ■*"
ion apparent. The ion using El has an abundance of
only 5%. The GD spectrum is shown in figure 6. 18.Fig 6.18 GD mass spectrum of 5 -valerolactam
using ammonia as the discharge gas
100#
CH,GD
5 — valerolactamDa
10070Pyridine was run under identical conditions using ammonia and gave an intense molecular ion at 79 Da. Again, noC M+NHA] "■ adduct was seen. However, ions at 51 (CAH3+) and52 (Ca H*.+) Da arising by losses of H2CN and HCN were ofabout the same intensity as m/z 79. This GD spectrum is shown with the main fragmentation pathways in figure
6. 19. A step-wise pathway for the formation of an M-l ion and the loss of HCN is postulated. There is some evidence
for this from metastable studies of the randomisation ofhydrogen and carbon atoms in the molecular ion ofpyridine and its deuterated analogues.
Clearly proton transfer is not taking place in GDMS with
181

either 5-valerolactam or pyridine, otherwise the [ M+H]+
ion would be prominent; neither is the C M+NHA] "■ adduct
apparent. It is suggested that charge transfer is occurring in that ions are formed which act as
reagent ions by charge transfer. The ion produced is thus
M"*- , the same radical cation given by electron impact ionisation. This relatively soft ionisation method using ammonia appears to offer no advantage over El, indeed the El and ammonia GD spectra of pyridine are similar. However, the use of ammonia with glycerol yielded a very small C M+H] "■ ion with the rather surprising odd-electron adduct C M+NH3] - (109 Da) as the largest peak after m/z17. This is identical to the Cl mass spectrum of glycerol except that the ammoniated peak at m/z 110 is thenobserved. It is possible that different parts of thedischarge in which either the El or Cl mode predominateare sampled preferentially by different compounds.
Fig 6.19 GD mass spectrum and fragmentation pathwaysof rvTidine using ammonia as the discharge gaa
GD
52 N100% 51 Pyridine r+M
79
78Da
40 60%-80
N52 (100%) m- 79 (85%) 78 (13%) 51 (87%)
18Z

6 b x Negative ionsNegative ions can occur in electrical discharges by the
interaction of electrons and molecules through a combination of three mechanisms, the overall process
being that of electron attachment.Radiative attachment is represented by
e + AB -» CAB” )5* -» AB“ + hv,
where AB represents a neutral molecule and an asterisk an excited state. The unexcited negative ion AB- iseventually formed when excess energy is removed by the photon (hv). In three-body attachment, stabilisation is effected by collision with a third body, such as the walls of the ion source, as discussed earlier in chapter 2 section c v,
e + AB -» CAB-)5* ; CAB")5* + AB -» AB~ + CAB)5*.
Dissociative attachment is represented by the reactions
e + AB -* CAB-)5* -> (A)5* + B“ and e + AB -» A-*- + B~ +e.
These energy relations give no indication of the probability of occurrence of the various processes. Atlow electron energies the effective cross-sections can be
measured direct, but at high energies the cross-sections have generally to be found from determinations of theappropriate collisional coefficients.
The atomic cross-section <j (u ) for a given attachment
183
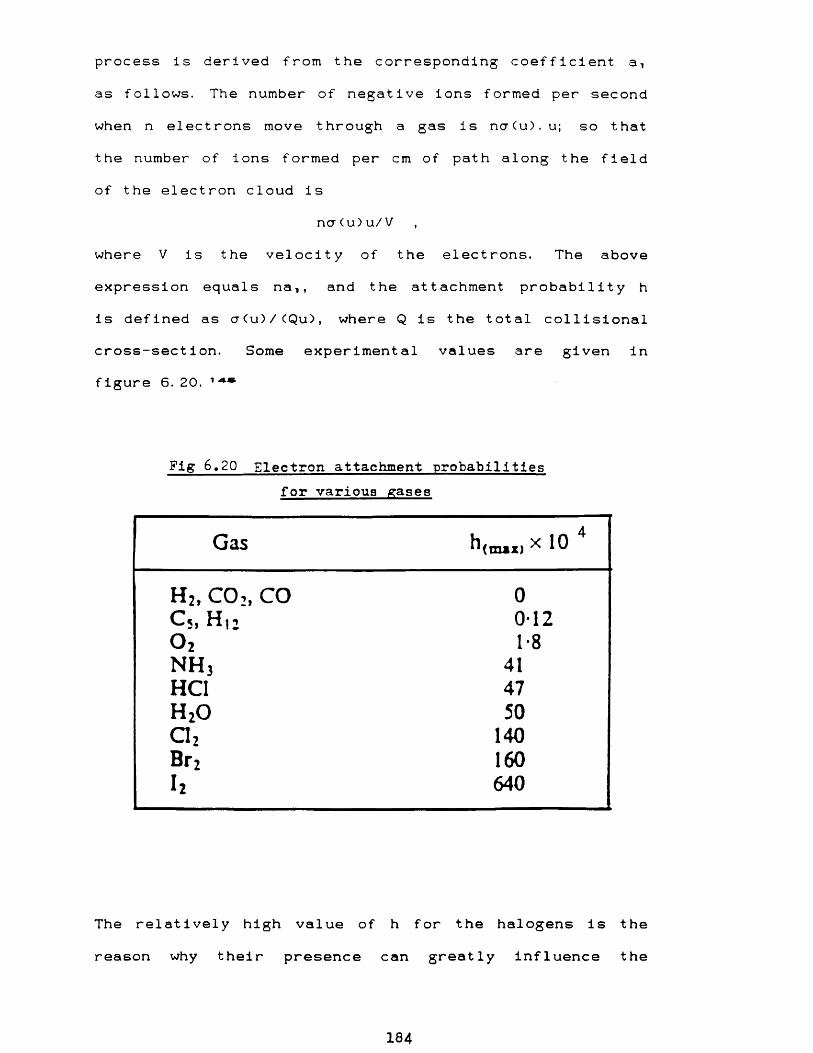
process is derived from the corresponding coefficient a-,
as follows. The number of negative ions formed per second
when n electrons move through a gas is na(u), u; so that
the number of ions formed per cm of path along the field of the electron cloud is
na(u)u/V ,
where V is the velocity of the electrons. The above
expression equals na,, and the attachment probability h
is defined as cr(u)/(Qu), where Q is the total collisional cross-section. Some experimental values are given in figure 6. 20. 1
Pig 6,20 Electron attachment probabilitiesfor various *ases
Gas fymax)* 10 4
H 2, C0-), CO 0C s H P 012o 2 1-8N H j 41HC1 47H 20 50Cl2 140Br2 160I 2 640
The relatively high value of h for the halogens is the
reason why their presence can greatly influence the
184

properties of a glow discharge by increasing the
concentration of negative ions.
To carry out GD ionisation in the negative mode a
negative HT potential was applied to the anode and the polarities of the magnet coils, ESA plates and detecting system were reversed. Phenol was introduced into the
source, with ammonia as the discharge gas. The negative ion mass spectrum can be seen in figure 6.21.
C6H16°Phenol GDOHMW
100%
Da
6040 10080
Fig 6,21 Negative ion GD mass spectrum of phenol
The figure shows an intense deprotonated molecular ion and, as with positive ion ammonia GDMS, there are no ammonia adduct ions. Proton abstraction is taking place to give the CM-1]- ion.
185

An artifact ion of virtually equal intensity at 127 Da
was also observed; this arose from iodine, which had been introduced into the GD source, in the form of
iodooctadecane, many samples earlier and without apparent recurrence in the positive ion mode. From figure 6. 22 it
can be seen that the electron attachment probability is high for iodine, resulting in this large m/z 127 peak in the negative ion mode from iodine latent in the sourcechamber.
6c Capillary GDMSThe system for examining liquids in the GD source using a silica tube of internal diameter 2. 5 x 10“s m has beendescribed in chapters 4 x and 5 a x. No micropump wasavailable and entry depended upon an equilibrium between several parameters, such as the viscosity of the liquid, the length of the capillary, the rate of consumption of the liquid in the discharge and the overall effect of the pumping system of the instrument. The flow rate for theliquids examined below varied from 0. 18 to 0. 34 pi min— 1
and depended upon the parameters above.
6 c i Met hanolThe GD spectrum of methanol in an argon discharge can be seen in figure 6.22. Intense ions were obtained at 31 and 32 Da; there is also a small peak at 15 due to the loss
of OH. This spectrum can be compared with the verysimilar El spectrum obtained for methanol on the ZAB 2F.
186

31100% E l
La
10 20
GD with argon31
100%
La
10
GL without gas Jm+hJ +
33100%
La
10 20
Fig 6.22 El and GL mass spectra of methanol
187

A slight increase in ingress of the methanol was possible
by lowering the argon flow by about 20%, this produced an
intense protonated molecular ion at 33 Da resulting from self-CI, as the liquid took over from argon as the discharge medium. The flow of argon to the source was then turned off. This effect, and the use of a matrix with organic compounds, was first reported by Baldwin and Carter. The spectrum is shown on the previous page andcompares with that obtained by Pullen for methanol using a corona discharge source. 1^The corona discharge shows a weak cluster ion at 65 Da due to [ <CH30H)2H3 which is not seen in the methanol self-sustained GD spectrum.
6 c i i MenthoneThe El and GD mass spectra of menthone (no discharge gas) are illustrated in figure 6.23.The GD spectrum gave an ion at 155 Da as the protonated molecular ion and base peak. Because there was instability while observing the molecular ion cluster at 8kV it was decided to progressively decrease the anode voltage; at about 4kV the molecular ion (154) became much more prominent, but reverted to its original abundance when the voltage was increased to its former value. This effect, which was not due to focusing, is shown in figure
6. 24.
188

100%
40
Menthone
69
60Jill Li
80
112
100 120
139
140
SI
M
3 97 154
i L ij----------- 1l__. Da160
100%
112
Da60 16080 120 14040 100
Fig 6.25 51 and GD mass spectra of menthoneThis transition occurs over a few hundred volts and
implies that the technique discriminates between
different ionisation modes as the potential varies across
the chamber. It is generally considered that ions
entering the mass spectrometer are formed in the negative
glow adjacent to the anode and it is possible that a mode
transition occurs in this region but the reason for this
is not clear.
Menthone154
4 kV
M (m+e ]+
GD
155
8 kV Fig 6>24 Molecular ion clusters for menthone at
4 kV and 8 kV

6c iii A methanol/water mixtureMethanol and water (80/20) as a potential reverse phase
medium for liquid chromatography was introduced into the source, again at constant pressure as there was no pump
available; the spectrum recorded on UV paper is shown in
figure 6.25. The protonated molecular ion of methanol is
visible as the base peak, with its dehydration fragment at m/z 15 also prominent. The hydrated clusters ofmethanol which were observed by Pullen were not observed,but weak water cluster ions were visible, C CH20)2H]^ at m/z 237 and C (H^COaH]"*' at m/z 55. Pullen's observations were made using a corona discharge which was created by applying a high voltage to a pair of wire electrodes witha quadrupole as a detector.
100% [m+hJ
GD
6010 20 30 40 50
Fig 6.25 GD mass spectrum of 80/20 methanol/vater mixture
The spectra obtained from the GD source depended upon the length of capillary protruding from the cathode cone on
the end of the probe; the ion at 33 Da optimised
190
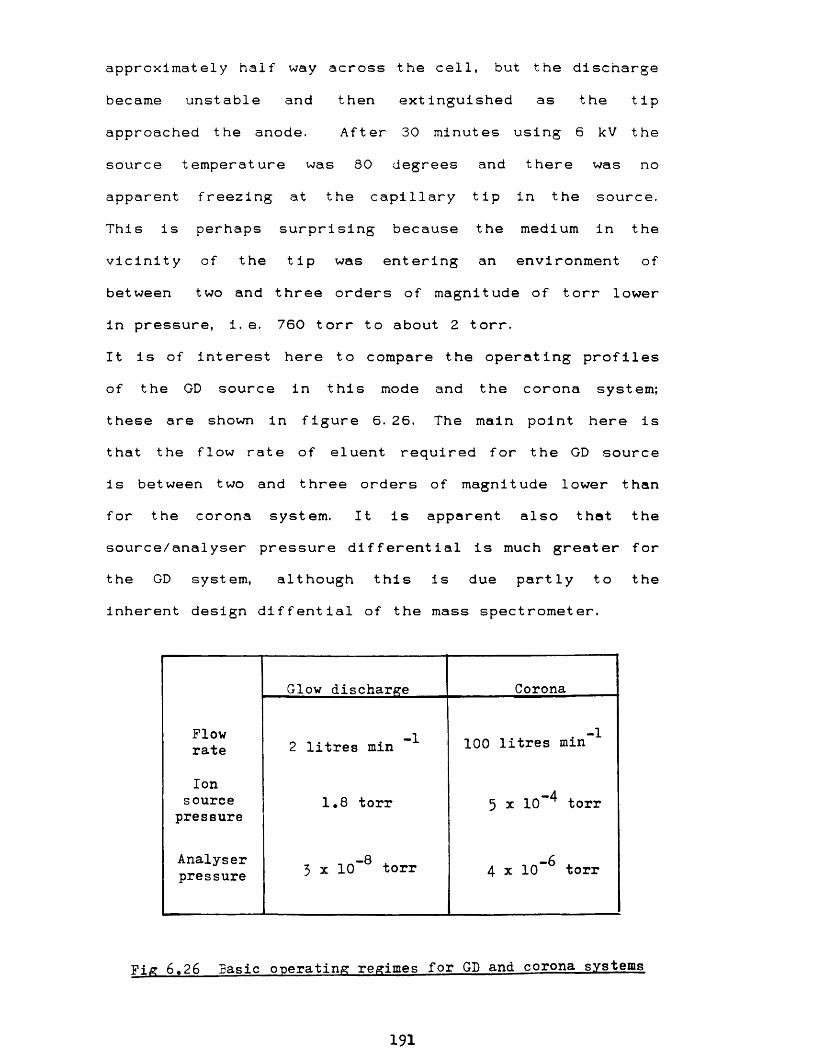
approximately half way across the cell, but the discharge
became unstable and then extinguished as the tip
approached the anode. After 30 minutes using 6 kV the source temperature was 80 degrees and there was no apparent freezing at the capillary tip in the source.
This is perhaps surprising because the medium in thevicinity of the tip was entering an environment of
between two and three orders of magnitude of torr lower in pressure, i. e. 760 torr to about 2 torr.It is of interest here to compare the operating profiles of the GD source in this mode and the corona system; these are shown in figure 6. 26. The main point here is that the flow rate of eluent required for the GD source is between two and three orders of magnitude lower than for the corona system. It is apparent also that thesource/analyser pressure differential is much greater for the GD system, although this is due partly to the inherent design diffential of the mass spectrometer.
Glow discharge Corona
Flowrate 2 litres min 100 litres min ^
Ionsourcepressure
1.8 torr -45 x 10 torr
Analyserpressure
-8 ^3 x 10 torr 4 x 10” torr
Fig 6,26 Basic operating regimes for GD and corona systems
191

6c iv Methvl stearateThe experiments described so far for liquids established
that a stable discharge could be obtained, without a discharge gas, giving rise to molecular or protonated
molecular ions, depending on the voltage on the anode, i. e. in this capillary mode the liquid acts as a source of molecular ions and of the species one mass unit higher
(self-CI). It is assumed that metastable-neutralcollisions (Penning ionisation) also have a role to play. In order to extend the application of this particular aspect of the GD source, a 0. 1 mol dm-3 solution of methyl stearate in chloroform was made, and this was allowed to enter the source. It was immediately apparentthat there was one main limitation inherent to thetechnique, and another applicable to the actual inlet system as described above when used to investigate dissolved components.The fundamental difficulty is that the ionising medium (solvent) inevitably utilises a large proportion of the electrons available for ionisation, resulting in solvent ions of magnitude about 103 greater than the ionisable species from the solute.The second problem was that freezing out of the solute occured at the probe tip. This was overcome for some samples by raising the temperature of the source to about 220 degrees and retracting the capillary tip to 1 mminside the stainless steel cathode cap.
192
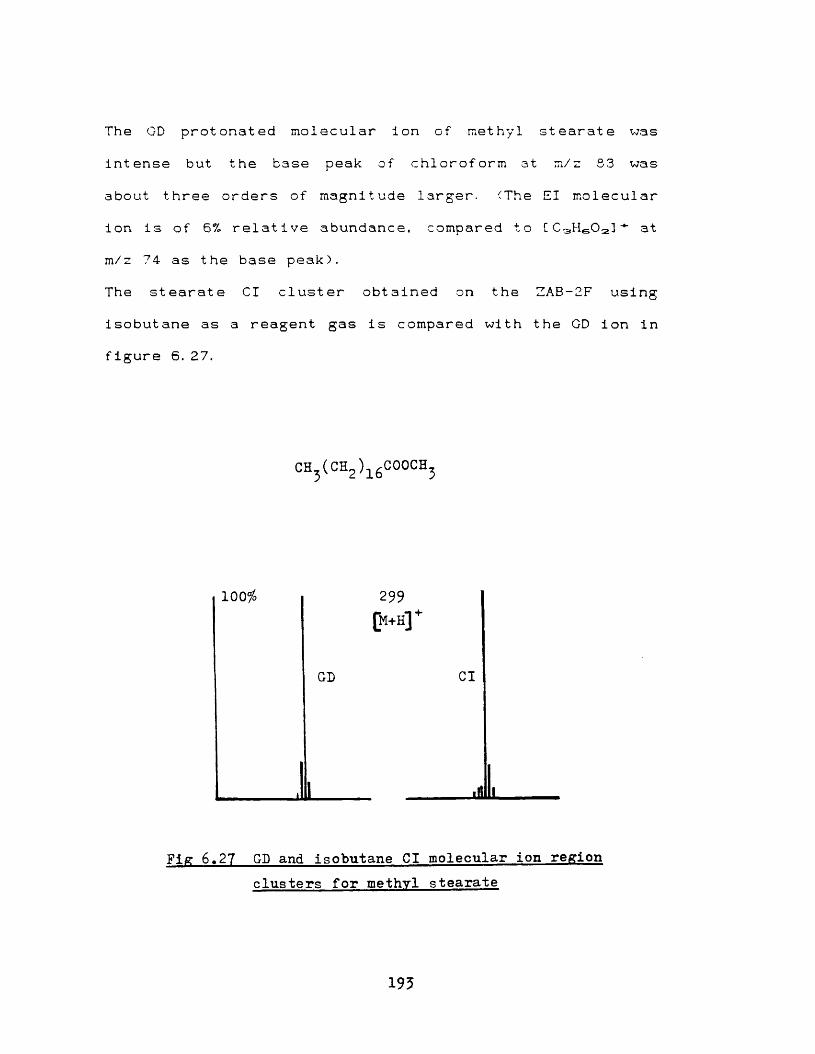
The GD protonated molecular Ion of methyl stearate was
Intense but the base peak of chloroform at m/z S3 was
about three orders of magnitude larger. (The El molecular ion is of 6% relative abundance, compared to [ C3He02] at m/z 74 as the base peak).The stearate Cl cluster obtained on the ZAB-2F using
isobutane as a reagent gas is compared with the GD ion in f igure 6. 27.
c h 5(c h 2)i 6c o o c h 3
100%
GD Cl
Fig 6.27 GD and isobutane Cl molecular ion region clusters for methyl stearate
195

6c v A met hionine/proline mixture
Met hionine Proline
These amino acids were dissolved in a solution of hydrochloric acid (0. 1M) in methanol and a mixture of equal parts drawn into the GD source. Ions at m/z 116 and 150 were visible, corresponding to the [ M+H] ions of proline and methionine respectively. The signals were weak and were observed on the oscilloscope of the mass spectrometer console as instability of the discharge precluded enhancement of the signals using the data system. Heating the source to 400*C did not overcome the instability and it was assumed that partial blocking of the long inlet line was occuring.No other peaks, such as those due to a loss of water or
of NH3, were observed.The simple experiments above show that the GD ion source would be able to accommodate the eluent from a microbore
LC column with the subsequent ionisation of certain compounds, but such a pumped system is a prerequesite for quantitative measurements.
194

6c vi A comparison
A comparison is drawn here, using the results from
organic analyses, between the GD source at the London School of Pharmacy and that due to Mason and Milton atthe University College of Swansea, 61
The main physical differences between the sources have been stated earlier, namely the method of cooling and of varying the discharge current.
The most notable variation between the two sources in practice is that of time delay between striking the discharge and observing a spectrum from a sample eitheron a metal cathode or sample tube.
The Swansea source exhibits an induction period which depends upon the melting point of the sample, with the overall time for desorption varying with the amount ofsample present. The conclusion drawn from this behaviour was that the principle mode of desorption was not
sputtering. This time delay was not observed with the London source under any conditions. The intensity of molecular and protonated molecular ions decayed from a maximum at the onset of the discharge. More intransigent, i.e. polar or high melting point, compounds did not introduce a delay time as discussed above but tended to
show no molecular ion cluster, unless a matrix was added.
195

It was inferred from this that the relatively volatile matrix carried the compound clear of the target prior to
ionisat ion.
196

CHAPTER 7 CONCLUSIONS
Glow discharge sources have been used in mass spectrometers for the past twenty years to measure elemental impurities in a wide range of materials, which
have generally been of a conducting nature. Perhaps it is
surprising that it is such a sensitive technique, because calculations have shown that the majority of the sample material is coated onto the walls of the ion source and that only about 1 atom in 107 emerges into the ion beam. 1Until recently there has been little interest in GD phenomena or instrumentation outside the realms of physics, geology and metallurgy. It is curious that the organic chemist has largely ignored the technique because the inception of the GD process as a supply of useful ions by J W Coburn in 1970 occurred four years after the development of a further soft ionisation mode, namely Cl, for ionising a sample of molecules by gas-phase ion/molecule reactions. 1 The work described in this thesis was undertaken to investigate the extension of the application of the glow discharge process into organic chemistry and yet, at the same time, to improve upon and to use the same ion source in its normal role for elemental analysis.There is no doubt that the GD source fulfilled its expected role in elemental analysis. However, it proved to be an essential requirement for low mass, low
abundance analysis that the ion source - indeed the whole
197

mass spectrometer - be dedicated to this one aspect. This
precludes its use for organic and LC applications and, indeed, any other ionisation mode. A further improvement to the specific instrument used in this study would be
the replacement of the polyphenyl ether diffusion pumps with turbomolecular units to further reduce gaseous
background.The GD system in its elemental mode was compared, primarily, with FTIRS. Both techniques, which differ totally in their methodology, will detect elemental impurities at the low ppb level under ideal conditions, such as a spectrally transparent sample for FTIR and very low ion source background for GD.In the organic mode, GD was investigated in parallel with the three widely-used ionisation processes, El, Cl and FAB. The two former modes require incandescent filaments and are well-documented; while FAB operates virtually at ambient temperature, as far as the sample is concerned, and its mechanistics are still only supposition. The GD phenomenon has been investigated extensively for about 120 years, but only recent work has shown that it includes at least three separate ionisation mechanisms, El, Cl and Penning.It is uncertain from the work in this thesis quite which mode is predominant for a given set of parameters. However, from the range of samples studied it is clear that El and Cl processes in the discharge produce molecular and quasimolecular ions respectively from organic compounds. The spectra are generally of short
198

duration due to the local heating of the cathode
electrode, but alternative sample holders and a cooled
source improve the ease with which a mass spectrum may be
obt ained.It is not suggested here that GD can supersede El, Cl and FAB, but that GD can be a complementary technique. From a physicists viewpoint, further work on the gas-phase mechanisms occuring in the discharge may yield a greater
insight into the discharge itself.The range of organic compounds which were investigated thus showed the following:(a) organics can be run using inert gases either with the compound deposited from solution onto a conducting cathode, or(b) as above but using a sample holder, and(c) involatiles can be projected into the gas phase using a volatile carrier such as glycerol.In the modes above, intense molecular ions are usually
formed, unless a matrix is employed in which case protonated molecular ions are exhibited. Furthermore, the variations of abundances in some [ M+H] clustersappear to be dependent upon the relative degrees of El, Penning and Cl ionisation. The hot cathode filament arrangement is worth further investigation, with the
addition of an inlet for liquid samples.The simple capillary inlet system used for solutions warrants further work as it has been shown that the glow discharge can be maintained by a liquid sample without a flow of gas. In the solution mode the ion source requires
199
a pumped method of sample entry. It also needs a dumping technique for the solvent so that solvent ions do not pass through the ion exit slit. This would require a more sophisticated two-stage GD source incorporating a de
solvation chamber, or a pulsed glow discharge such as that recently developed by Harrison which would
spectrally discriminate against both background and solvent ions.Notwithstanding the present limitations, the capillary work was promising in that even using a simple inlet system, the GD source required only a low sample flow rate and could be controlled to a certain extent. Equally important is the ability to use the source in a conventional organic mass spectrometer without recourse to expensive pumping systems.Further work is required, especially on the two innovative modes of GD, namely organic analysis and that of compound separation using flowing GD.This treatise has shown that a single glow discharge ion source may play three diverse roles in a conventional mass spectrometer.
© J } © J 3 © J } © 0 ©
200

1820
20
20
20
21
22
22
22
2223
24
REFERENCES
A L Gray, J Spectrochim Acta,
1985, 40B, 1525J Gordon, Phys Bull, 1988, 39, 2 77D J Douglas, J B French, Anal Chem,
1987, 11, 203
R D Satzger, F L Fricke, P G Brown,J A Caruso, J Spechtrochim Acta, 1987,42B, 705D A Wilson, G H Vickers, G M Hleftje,Anal Chem, 1987, 59, 1664G Stingeder, M Grasserbauer, U Traximayr,E Guerrero, Mikrokim Acta Suppl, 1985,11, 171I M Swenters, J K DeWaele, J A Verlinden,F Adams, Anal Chim Acta, 1985, 173, 377P Fischer, J Noren, A Lodding, H Odellus, 'Secondary Ion Mass Spectrometry', Proc of 5th Int Conf on Secondary Ion Mass Spectrom, Wiley, New York, 1987 M S Burns, D M File, J Microsc, 1986,144, 157D W Koppenaal, Anal Chem, 1988, 60,
1 13P Dagnall, Spectros World, 1989, 1, 23
R K Skogerboe, A T Kashuba, G H Morrison, Anal Chem, 1968, 40, 1096
201

13. B Wiedemann, A Markwitz, Institute of
Nuclear Physics, Goethe University,
Frankfurt-am-Main, private communication14. R W Bonham, Spedros, 1988, 3, 2715. G I Ramendik, B M Manzon, D A Tyurin,
N E Benyaev, A A Komieva, Anal Chem, 1987,
69, 6116. K R Hess, W W Harrison, Anal Chem, 1986,
58, 169617. A E Litherland, Nucl Instrum Methods
Phys Rev, 1984, B5, 10018. J C Rucklidge, A E Litherland, L R Killus,
Trace Mlcroploe Tech, 1987, 5, 2319. G Gledhill, R Newman, Bruker Spectrospin Ltd
FTIR application note no. 3020. Loughborough Consultants Ltd XPS/ESCA
brochure, 199121. E Goldstein, Sitzungberlcht der Koniglich
Preussischen Akademle der Wissenschaff,
1886, 38, 69122. H B Rosenstock, M B Wallenstein,
A L Wahrhaftig, H Eyring,Proc Nat Acad Sci, 1952, 38, 667
23. R A Marcus, J Phys & Colloid Chem,
1951, 55, 89424. P F Knewstubb, ' Mass Spectrometry and Ion
Molecule Reactions', Cambridge Univ Press 1969, 110
24
26
26
28
28
28
30
31
34
35
35
36
202

41
41
4141
42
42
44
44
44
44
44
44
45
M G Ingram, R Gomer, J Chem Phys,
1954, 22, 1279M G Ingram, R Gomer, Z Nat urf orschg,
1955, 109, 863T Higuchi, B D Musselman, Proc 38th ASMS
Conf on Mass Spectrom & Allied Topics,Tucson, USA, June 1990P Zhu, K Su, Org Mass Spectrom, 1990, 25 (5),
260F Kirchner, Nat urwlss, 1954, 41, 136M Barber, R S Bordoli, R D Sedgewick,A N Tyler, J Chem Soc Chem Comm, 1981, 325R S Lehrle, D Roff, Rev Scl Instrum,
V L Tal* rose, 0 S Privett, J Amer Oil Chem
Soc, 1985, 62, 786M A Baldwin, F W McLafferty,Org Mass Spectrom, 1973, 7, 1111P J Arpino, G Guiochon, Anal Chem,
1979, 51, 682aD Henion, G A Maylin, Biomed Mass
Spectrom, 1980, 7, 115R Tiebach, W Blass, M Kellert,J Chromatogr, 1985, 152, 121P J Arpino, G Guiochon, J Chromatogr,
1982, 251, 153W H McFadden, H L Schwartz,J Chromat ogr, 1976, 122, 389
203

39.
40.
41.
42.
43.
44.45.46.47.48.
49.
50.
51(1
51 <2
52.
M L Vestal, C R Blakely, M J McAdam,
J Chromat ogr, 1987, 158, 261 45D I Carroll, I Dzidic, R N Stillwell,
M G Horning, E C Horning, Anal Chem,
1973, 45, 936 47D I Carroll, I Dzidic, R N Stillwell,M G Horning, E C Horning, Anal Chem,
1974, 46, 706 47D I Carroll, I Dzidic, R N Stillwell,E C Horning, K D Haegele, Anal Chem,
1975, 47, 2369 42J W Coburn, Rev Sci Instrum, 1970, 41,
1219 48E Goldstein, Berl Ber, 1886, 39, 691 50W Wien, Ann Physlk, 1898, 65, 440 50J J Thomson, Phil Mag, 1905, 10, 584 50A J Dempster, Phys Rev, 1921, 18, 415 50A J Dempster, Proc Natl Acad Sci, 1921,7, 45 50E Gehrcke, Verhandl Deut Physik Ges, 1906,8, 559 50VG Elemental Ltd, Application ReportGD 703, 1990 51
>.R Mason, D Milton, Int J Mass Spectrom
Ion Proc, 1989, 91, 209 52>.W W Harrison, N Jakubowski, Int J Mass
Spectrom Ion Proc, 1986, 71, 183 52D F Hunt, Anal Chem, 1975, 47, 1730 52
204

53.
54.
55.
56.57.
58.
59.60.
61.
62.
63.
64.65.
66 .
67.68 .
K Matsumoto, K Yasuda, S Tsuge, Org Mass
Spectrom, 1985, 20, 243R Chapman, J Chromat ogr, 1987, 394, 231
P H Ratcliff, W W Harrison, Proc 38th Conf Mass Spectrom & Allied Topics, Tucson, USA
June 1990, 1441D F Hunt, Anal Chem, 1975, 4 7, 1730R C Scheibel, 0 P Tanner, K V Wood,Anal Chem, 1981, 53, 550
D Rapp, P Englandei— Golden,J Chem Phys, 1965, 43, 1464P T Smith, Phys Rev, 1930, 36, 1293B L Schram, F J de Heer, M J van der Wiel,
J Kistemaker, Physica, 1965, 31, 94J E Greene, J M Whelan, J Appl Phys, 1973,
44, 2509J E Greene, F Sequeda-Orsorio,J Vac Sci Technol, 1973, 10, 1144W R Harshbarger, R A Porter, T A Miller, Appl Spedros, 1977, 31 (3), 201J Sayers, Nature, 1947, 159, 117M A Biondi, S C Brown, Phys Rev, 1949,76, 1697R F Reichelderfer, J M Welty, J F Battey,J Electrochem Soc, 1977, 124, 1926S Zemansky, Phys Rev, 1929, 34, 213J W Coburn, E Kay,Appl Phys Letters, 1971, 18 (10), 435
5252
5253
53
5959
59
61
61
6165
65
6768
68
205

69. K R Hess, W W Harrison, Anal Chem, 1988
60, 69170. E W Eckstein, J W Coburn, E Kay, Int J Mass
Spectrom & Ion Phys, 1975, 17, 12971. F Llewellyn-Jones, 'Ionisation & Breakdown
in Gases' , Methuen & Co Ltd, 196672. F Llewellyn-Jones, 'Ionisation Avalanches &
Breakdown' , Methuen & Co Ltd, 196773. A H Howell, Trans Amer Inst Elec Engrs, 1939,
58, 19374. L H Germer, F E Haworth, Phys Rev, 1948,
73, 112275. F Llewel lyn-Jones, Vacuum, (London), 1954,
3, 11676. R J Van de Graaf, J G Trump, Rep Prog Phys
(London), 1946, 11, 177. J H Jeans, ' Dynamical Theory of Gases'
Books Demand UMI, London78. B Chapman, ' Glow Discharge Processes'
J Wiley & Sons, 1980, 5279. I Langmuir, H Mott-Smith, Gen Elec Rev,
1923, 26, 73180. M Mitchner, C H Kouger Jr, 'Partially
Ionised Gases' , Wiley, New York and London,1973
81. L Pekarek, V Krejci, Czech J Phys, 1961,B-ll, 729
69
70
71
71
71
71
71
74
72
72
73
76
77
206

82. J Pons-Corbeau, J P Cazet, J P Moreau,R Bernerou, J C Carbonier, Surf Int Anal,
1986, 9, 2183. G K Wehner, Adv in Elec & Electron Phys,
1955, vii, 25384. G S Anderson, W N Mayer, G K Wehner,
J Appl Phys, 1962, 33, 299185. S C Brown, A D Macdonald, Phys Rev,
1949, 76, 169286. F Llewellyn-Jones, Rep Prog Phys, 1953,
16, 21687. G De la Rue, M Muller, Phil Trans, 187888. E Nasser, 'Fundamentals of Gaseous
Ionisation and Plasma Electronics', Wiley, London, 1971
89. J D Cobine, 'Gaseous Conduction',Dover, New York, 1958
90. A von Engel, ' Ionised Gases' ,Oxford Univ Press, 1965
91. B Chapman, 'Glow Discharge Processes'
Wiley, New York, 1980, 8192. G Wooldridge, Phys Rev, 1939, 56, 56293. H J Sharman, Proc Camb Phil Soc, 1927,
23, 523 & 92794. H D Hagstrum, Phys Rev, 1956, 104, 67295. D B Medved, P Mahadevan, J K Layton,
Phys Rev, 1963, 129, 208696. A J T Holmes, J R Cozens,
J Phys D Appl Phys, 1974, 7, 1723
78
79
79
79
7980
81
81
81
8284
8586
87
88
207

97.
98.99.
100 .
1 0 1 .
1 0 2 .
103.
104.105.
106.
107.
108.
109.
1 10 .
1 1 1 .
1 1 2 .
F W Aston, Proc Roy Soc, 1907, A80, 45
F W Aston, Proc Roy Soc, 1911, A84, 526 G Nottingham, Jour Franklin Inst,
1928, 208, 191J Loeb, 'Fundamental Processes of Electrical Discharges in Gases' ,Chapman and Hall, 1939, 596Edwards High Vacuum Ltd Technical Data Sheet 07-D024-22-881, 1982, 5T Tisone, Solid State Tech, Dec 1975, 340 Almen, G Bruce, Nucl Instrum & Methods,
1961, 11, 257P Sigmund, Phys Rev, 1969, 184, 383G S Smith, P B Isaacs, Acta Cryst, 196417, 842P J Durrant, B Durrant, 'Introduction to Advanced Inorganic Chemistry* , Longmans,1962, 621L Fourie, F J C Martins, Int Mass Spectrom Conf, Bordeaux, France, Sept 1987 J E Parker, R S Lehrle, Int J Mass
Spectrom & Ion Phys, 1971, 7, 421P F Knewstubb, A W Tickner, J Chem Phys, 1962
36, 674F Paschen, Weid Ann, 1889, 37, 69J S Townsend, 'The Theory of Ionisation of Gases by Collision', Constable, 1910, 56
W R Grove, Phil Trans R Soc, 1852, 142, 87
89
90
94
94
1 10
114
121
124
125
125
126
127
127129
129130
208

113.
114.
1 15.
116. 117.
1 18.
119.
120 .
12 1.
122 .
123.124.
125.
126.
127.
'Shorter Oxford English Dictionary',Oxford University Press, 1959
K H Kingdom, I Langmuir, Phys Rev, 1923,
22, 148A von Hippel, Annl Phys, 1926, 81, 1043C H Townes, Phys Rev, 1944, 65, 319 G Ecker, K G Emeleus, Proc Phys Soc, 1954,B67, 546K Takatsu, T Toda,' Proc 5th Conference on Ionisation Phenomena in Gases, ' Amsterdam, 1961R Kelly, 'Proc Int Conference on Ion Beam Modification of Materials', Budapest, 1978 N E Sanderson, E Hall, P Charalambous, D Hall Mikrochim Acta, 1987, Jf, 275W S Taylor, J G Dulah, S p e d r o s Int,1989, 1 (6), 44A Savitzky, M E Golay, Anal Chem, 1964 36, 1627D M Mattox, J Vac Sci Tech, 1973, 10, 47J C Erskine, A Cserhati, J Vac Sci Tech
1978, 15, 1823J L Vossen, J J Cuomo, ' Thin Film Processes' , Ed J L Voissen & W Kern,Academic Press, London, 1978 J W Coburn, E Kay, ' CRC Critical Review
in Solid State Sciences', 1974, 4, 561
R F Reichelderfer, J M Welty, J F Battey,J Electrochem Soc, 1977, 124, 1926
130
132
132132
132
132
133
139
139
143146
146
146
147
147
209

128.
129.
130.
131.
132.
133.
134.
135.
136.
137.
138.
139.
140.
C C Chang, P Petroff, G Quintana,
S Sosniak, Surface Sciences, 1973, 38, 341
S M Sze, ' Semiconductor Devices: Physicsand Technology' , J Wiley, 1985, 3621 S T Tsong, D J Barber, J Maths Sci,
1973, 16, 185R S Robinson, J Vac Sci Tech, 1979,16, 185A Guentherschulze, W Tollmien,Z Physik, 1942, 119, 685B Chapman, ' Glow Discharge Processes',J Wiley, 1980, 250J A Klinger, P J Savickas, W W Harrison,J Am Soc Mass Spectrom, 1990, 1, 138J B Dawson, D J Ellis, J Spectrochim Acta,
1967, 23A, 565S M Sze, ' Semiconductor Devices: Physicsand Technology' , J Wiley, 159 J Maguire, R C Newman, I Grant, D Rumsby,R M Ware, J Phys D Appl Phys, 1985, 18, 2029R G Cooks, K L Busch, Int J Mass Spect rom
Ion Phys, 1983, 53, 111J A Sunner, R Kulatunga, P Kebarle,Anal Chem, 1986, 58, 1312
M P Lacey, T Keough, Rapid Commun in Mass
Spectrom, 1989, 3 no 2, 46M Alexandrov, L N Gall, N V Krasnov,Adv in Mass Spectrom, Ed J F J Todd,1985, B, 605
147
147
148
148
150
150
155
155
156
162
168
168
168
170
210

142. J W Chamberlin, A Agtarap, Orff Mass
Spectrom, 1970, 3, 271 172143. A J Deeming, M Karim, N I Powell,
Polyhedron, 1990, 9 no 4, 623 178144. T Keough, A J DeStefano, Orff Mass
Spectrom, 1981, 16, 527 180145. A J Hatch, H B Williams, ' Proc of
Gaseous Electronics Conference',New York, 1951, 85 184
146. M A Baldwin, D M Carter, Abstracts of 17thBritish Mass Spectrometry Society meeting, University of Nottingham, Sept 1989 188
147. F S Pullen, Doctorate thesis, Universityof London, 1987, 94 188
148. N Ketchell, Abstracts of 1st Int Conf onPlasma Source Mass Spectrometry, Universityof Durham, Sept 1988 197
149. M S B Munson, F H Field, J Am Chem Soc,
1966, 68, 2621 197
This thesis was compiled using an Amstrad pic PCW 8512 word processor and Locomotive Software Ltd Locoscript 2 sof t ware.The volumes were bound by the University College London binding service, Gower Street, London WC1E 6BT; my thanks to Rich.I thank also the ladies of room 16, Senate House, for their advice.
211
Recommended