THE EFFECTS OF REPLACING DISPERSED TRASH AND RECYCLING BINS
WITH INTEGRATED WASTE RECEPTACLES ON THE ACCURACY OF WASTE SORTING IN AN ACADEMIC BUILDING
Katherine J. Binder, M.A.
Western Michigan University, 2012
Numerous researchers and theorists have attempted to explain the existence of
the gap between the possession of environmental knowledge and awareness and the
display of pro-environmental behavior (Glasser, 2007; Kollmuss & Agyeman, 2002).
Behavior analysis is uniquely aligned to contribute to this discussion through its
emphasis on the role of controlling variables in behavior change. A growing number
of behavioral research studies address the challenges of group-contingencies in an
effort to solve real-world gaps (Lehman & Geller, 2004). This study was designed as
a continuation of the line of behavioral research designed to increase recycling rates
and also as an attempt to solve an issue presented in an academic building. During
baseline measures, 20-30% of the landfill waste was comprised of recyclable
material. Bins for plastic/glass/metal were not present in classrooms and classroom
landfill bins were being utilized for disposal of bottles and cans. The treatment
package included removal of all classroom bins, addition of centrally located,
integrated landfill and recycling bins, along with the development of new signage.
Results showed a decrease in the amount of recyclable material inaccurately sorted
into landfill receptacles. These findings vary from previous recommendations that
recycling bins be placed in all possible areas of waste generation.
THE EFFECTS OF REPLACING DISPERSED TRASH AND RECYCLING BINS WITH INTEGRATED WASTE RECEPTACLES ON THE ACCURACY
OF WASTE SORTING IN AN ACADEMIC BUILDING
by
Katherine J. Binder
A Thesis Submitted to the
Faculty of The Graduate College in partial fulfillment of the
requirements for the Degree of Master of Arts
Department of Psychology Advisor: Wayne Fuqua, Ph.D.
Western Michigan University Kalamazoo, Michigan
December 2012
Copyright by
Katherine J. Binder 2012
ii
ACKNOWLEDGMENTS
I credit the completion of this project fore mostly to the individual
contributions of my committee members. Dr. Wayne Fuqua’s guidance, patience, and
flexibility allowed me to fully explore this relatively uncharted research territory. His
belief in my abilities as a researcher continues to inspire and encourage me. Dr.
Harold Glasser pushed me in directions that were both challenging and rewarding.
This project is more complex, relevant, and applicable and I am a more effective
researcher, graduate student, and story-telling primate as a result of his steadfast
support and guidance. Dr. Richard Malott is to blame for my undying devotion to
behavior analysis and I will forever be in his debt. Thanks for shakin’ my world view
Uncle Dickie.
I owe a lifetime supply of coffee to my enthusiastic research assistants who
never balked at 7:45 am meeting times and never complained about the stinky task of
sorting through other people’s garbage. Caitlin Prior, Daniel Flack, Sean Hagerty,
Jacqueline Scholz, Emily Gadzinski, Julia Hillegonds, Amani Gaillard, and Katie
Switras all deserve a high-five the next time you see them.
My wonderful, patient, and committed friends earned extra special cool points
for their toleration and remediation of my behavior on “thesis days”. From Kevin’s
thesis day breakfasts to my housemates’ post-deadline celebrations, their support
ensured my physical and mental health throughout this process. Andrew English
Acknowledgments—Continued
iii
deserves special consideration for enduring my constant pestering and abuse of his
awesome statistical analyses skills. I wish I could list him as a co-author.
Above all, my parents, Pamella and Charles Binder, deserve credit for the
development of the scholastic abilities that made this research possible. They are
singularly responsible for the belief that I could even attempt to attain a graduate level
degree. Their unending support has made me who I am today and I hope that I can
“pay it forward” in some small way through my contributions in academia and
beyond.
Katherine J. Binder

iv
TABLE OF CONTENTS
ACKNOWLEDGMENTS ..................................................................................... ii
LIST OF TABLES ................................................................................................. vii
LIST OF FIGURES ............................................................................................... viii
INTRODUCTION ................................................................................................. 1
The Behavior Analysis Approach to Saving the Environment .......... 1
The Behavior Analysis Approach to Recycling ................................. 4
Research Overview ............................................................................. 11
METHODS ............................................................................................................ 12
Participants ......................................................................................... 12
Setting ................................................................................................. 13
Materials ............................................................................................. 14
Dependent Variables .......................................................................... 15
Weight of Waste ....................................................................... 15
Trash and Improperly Sorted Recycling Waste ........................ 16
Recycling Waste ....................................................................... 17
Waste Discarded in Classrooms ............................................... 18
Experimental Conditions .................................................................... 18
General Procedures ................................................................... 18
Baseline .................................................................................... 19
Independent Variables .............................................................. 19
Waste Receptacles ................................................ 19
Table of Contents—Continued
v v
Signage ................................................................. 20
Experimental Design ................................................................ 20
Interobserver Agreement .......................................................... 21
RESULTS .............................................................................................................. 21
Recyclable Material Inaccurately Placed in Landfill ......................... 22
Recyclable Material as a Percentage of Landfill Waste ........... 22
Weight of Recyclable Material Found in Landfill ................... 24
Weight of Accurately Sorted Recyclable Materials ........................... 26
Daily Weight of Waste ....................................................................... 28
Weight of Recycling and Landfill ............................................ 28
Total Weight ............................................................................. 30
Total Weight by Floor .............................................................. 30
Averages Analysis .............................................................................. 33
Classroom Litter ................................................................................. 35
Social Validity .................................................................................... 35
DISCUSSION ........................................................................................................ 37
Differences in Intervention Effectiveness .......................................... 39
Accounting for Increase in Predicted Weight .................................... 39
Classroom Litter ................................................................................. 41
Special Situations ............................................................................... 42
Weight as a Form of Data Collection ................................................. 43
Limitations .......................................................................................... 43
Table of Contents—Continued
vi vi
Behavioral Mechanisms ..................................................................... 46
Future Research .................................................................................. 48
Conclusion .......................................................................................... 51
REFERENCES ...................................................................................................... 53
APPENDICES
A. Floor Plans ................................................................................................... 57
B. Intervention Package Design ........................................................................ 64
C. WMU Recycling Guide ................................................................................ 70
D. Data Collection Protocol .............................................................................. 73
E. Weight Trend Line Analysis ........................................................................ 78
F. Answers to Open Ended Survey Questions .................................................. 80
G. Satisfaction Survey ...................................................................................... 82
H. HSIRB Approval Letter ............................................................................... 85
vii
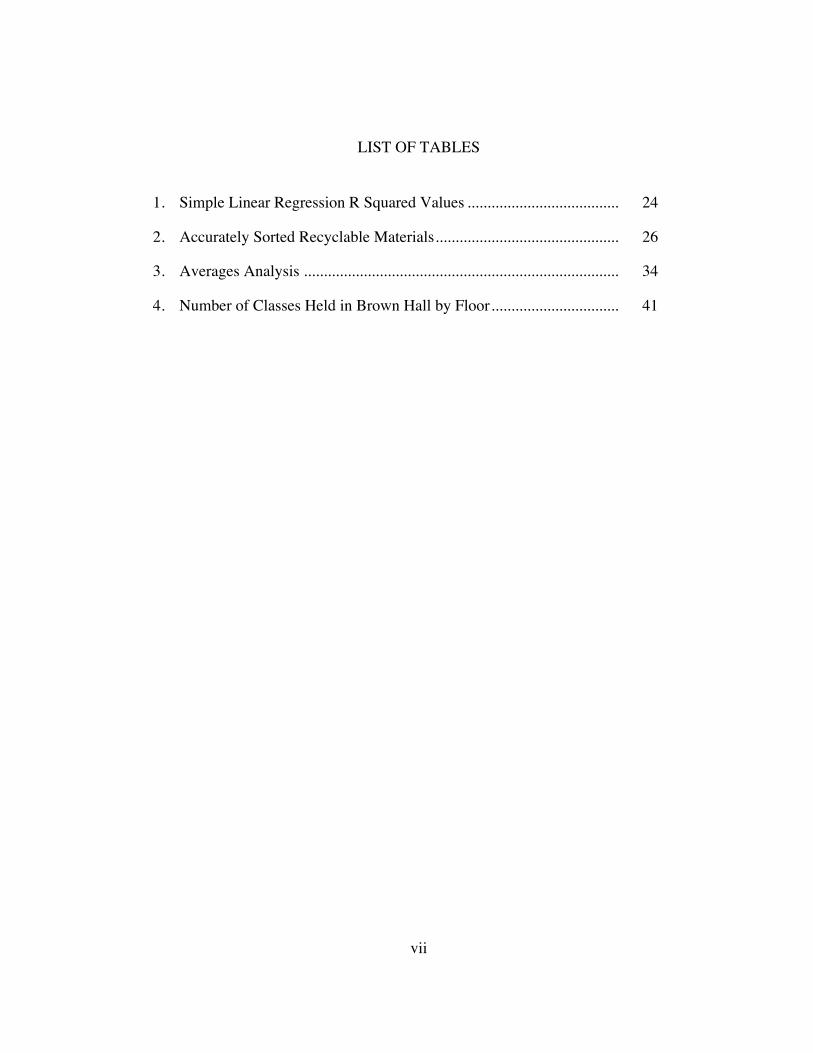
LIST OF TABLES
1. Simple Linear Regression R Squared Values ...................................... 24
2. Accurately Sorted Recyclable Materials .............................................. 26
3. Averages Analysis ............................................................................... 34
4. Number of Classes Held in Brown Hall by Floor ................................ 41
viii
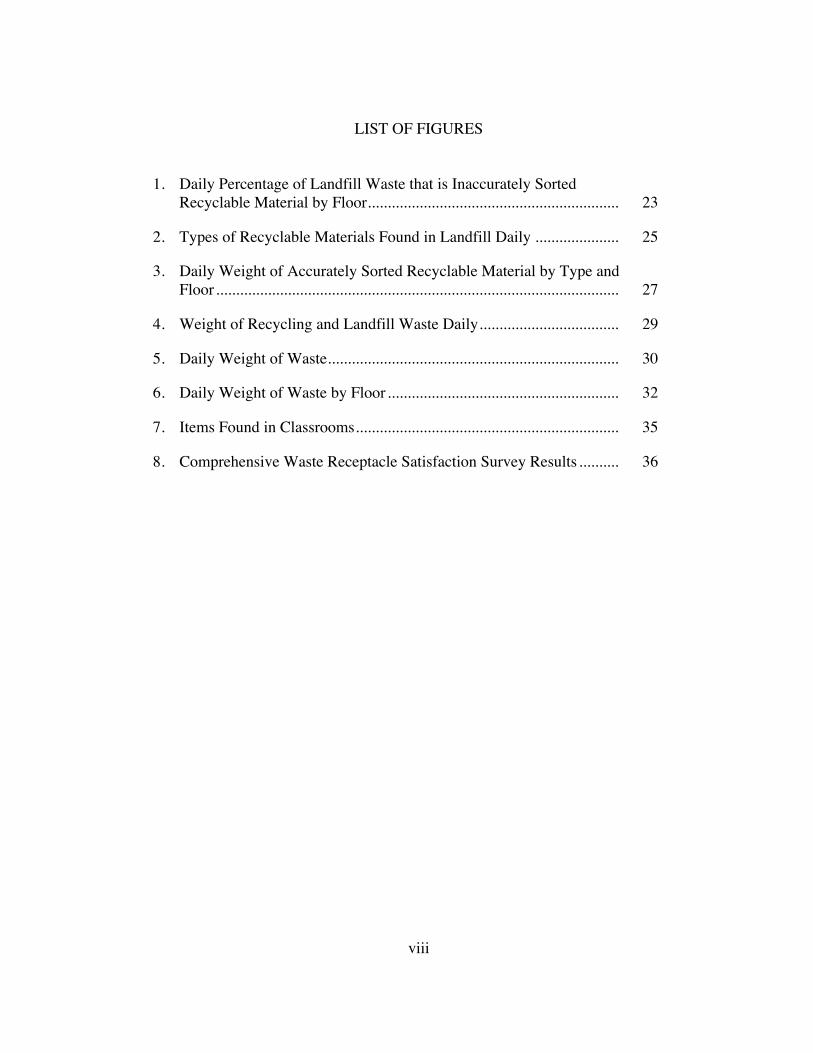
LIST OF FIGURES
1. Daily Percentage of Landfill Waste that is Inaccurately Sorted Recyclable Material by Floor ............................................................... 23
2. Types of Recyclable Materials Found in Landfill Daily ..................... 25
3. Daily Weight of Accurately Sorted Recyclable Material by Type and Floor ..................................................................................................... 27
4. Weight of Recycling and Landfill Waste Daily ................................... 29
5. Daily Weight of Waste ......................................................................... 30
6. Daily Weight of Waste by Floor .......................................................... 32
7. Items Found in Classrooms .................................................................. 35
8. Comprehensive Waste Receptacle Satisfaction Survey Results .......... 36
1
INTRODUCTION
“Our fate and future is and always has been intertwined with nature, despite the
widespread failure of most humans to act in a manner that reflects a deep understanding
of this relationship (Glasser, 2007).” This failure is referred to as the “gap” between the
possession of environmental knowledge and environmental awareness, and the display of
pro-environmental behavior (Kollmuss & Agyeman, 2002; Glasser, 2007). Exploration of
the gap is central to innumerable theoretical and experimental analyses attempting to
account for the persistent and seemingly senseless destruction of the environment
resulting from human behavior. Because of its emphasis on the contextual controlling
variables that contribute to the emergence of behavior, the field of behavior analysis is
uniquely aligned to contribute to this body of work. Although behavior analysis has
historically focused on single-subject interventions, a strong line of environmentally
focused group-design research has emerged.
The Behavior Analysis Approach to Saving the Environment
Behavior analysts began confronting the challenges of group contingencies in the
context of environmentally relevant behaviors as early as the 1980s. Geller, Winett, and
Everett (1982) described the emergence of applied behavior analysis research focusing on
a range of environmental issues including litter and waste reduction, energy conservation,
transportation, and water conservation.
A decade later, Dwyer, Leeming, Cobern, Porter and Jackson (1993) documented
the frequency of the publication of articles that took intervention approaches to
2 environmentally relevant behaviors from 1970 to 1990 and offered a review of articles
published after 1980. Their analysis depicted a steady increase in articles published after
1970, peaking at 14 in 1977 and steadily declining to two or less per year by 1990. They
attributed this decline in research interest to lack of support and challenges faced in
creating the necessary changes within large systems and institutions including public
policies and deeply ingrained cultural practices.
The new millennium brought a renewed interest in environmental research among
psychologists. In the May, 2000 issue of American Psychologist, a series of
commentaries called for the continued involvement of psychologists. Stuart Oskamp’s “A
Sustainable Future for Humanity? How can Psychology Help?” provided a detailed
overview of the impacts of human behavior on the environment and made a powerful
case for psychologists to join environmentalists in the “…war against the common enemy
of an uninhabitable Earth…(2000).”
The Fall 2010 issue of The Behavior Analyst contained commentary in the form
of a special section titled “The Human Response to Climate Change: Ideas From
Behavior Analysis”. Multiple intervention-based research studies were presented along
with opinion pieces suggesting future directions for behavioral environmental research. It
was later criticized for failing to address the issue of consumerism as a main target of
change (Grant, 2011).
In an update of the Dwyer, et al (1993) review, Lehman and Geller (2004) noted a
decline in the number of articles evaluating behavioral interventions and an increase in
research attempting to correlate traits such as attitudes, affluence, income, and
demographics of individuals to pro-environmental behavior. They reported that these
3 articles outnumbered the intervention-based articles by seven to one. Trait-based analysis
of pro-environmental behavior has indeed enjoyed a long and prolific history, dating back
to the 1970s and continuing today (Maloney, Ward, & Baucht, 1975; Lounsbury &
Tornatzky, 1977; Catton & Dunlap, 1978; Dunlap & Mertig, 1983; Jones & Dunlap,
1992; Leiserowitz, Kates, & Parris, 2005; Leiserowitz, 2006). Although this form of
research may prove beneficial in the development of incentive programs and other
intervention-based research, Lehman and Geller point out that trait-focused research has
no direct potential to result in interventions that incite behavior change.
In an attempt to reorient the focus of environmental research toward a more
behavior analytic approach, Lehman and Geller (2004) outlined six main areas where
human behavior impacts the environment and reviewed research that has made attempts
to create behavioral change in these areas. The areas include: 1) air pollution, 2) climate
change, 3) water pollution and depletion, 4) solid waste, 5) soil erosion and
contamination, and 6) loss of green space and species diversity.
The various interventions and settings discussed included litter control in theaters,
increasing the rate and efficiency of recycling, decreasing energy used in buildings,
altering transportation-related behavior, and altering consumers’ purchasing behavior.
Lehman and Geller (2004) divided intervention strategies into two categories, antecedent
strategies and consequence strategies. The antecedent interventions included information
and education, prompting, modeling, commitment, and environmental design. The
consequence based strategies included rewards and feedback. Geller and Lehman also
addressed the issues of choosing behavioral targets, maintaining pro-environmental
4 behavior, the differences between curtailment and efficiency behaviors, response
maintenance, permanent interventions, and the challenge of dissemination.
Lehman and Geller (2004) also pointed out that behavior analysts have focused
their research on only three main targets, 1) increasing recycling-related behavior, 2)
decreasing residential energy use, and 3) reducing environmental litter. They opined that
these targets provide convenient research topics because they provide easy to measure
outcomes. This is especially true of recycling research studies, where the product of the
target behavior is tangible and can be weighed or counted. Lehman and Geller (2004)
challenged behavior analysts to test interventions that have the potential to make a greater
impact. Increasing recycling is a worthy target, but more attention should be paid to the
consumption and reuse aspects of consumerism versus the disposal of items at the end of
the waste stream.
The Behavior Analysis Approach to Recycling
Given this powerful argument, one might wonder why yet another behavioral
analytic recycling research project is necessary when there are obviously much larger
issues at hand. The issue is that the book is not closed on research related to recycling
behavior. The current recycling and material recovery rates in the United States leave
significant room for improvement. In 2010, only 8.2% of plastics generated were
recovered for recycling followed by 27.1% of glass, 35.1% of metals, and 62.5% of paper
(United States Environmental Protection Agency [U.S. EPA], 2010). Additionally, every
5 community, event, residence, and building is different and presents its own unique
situational challenges, most of which are unaccounted for by the current research.
Until a comprehensive guide providing solutions tailored to as many conceivable
settings as possible is complete and recovery rates for all recyclable material reach 100%,
our work is not done. Given the relative ease with which this form of research can be
conducted, it is surprising that such attempts have not yet been made. The current
research project is designed as a strategic continuation of the line of research outlined
below and is one of many campus projects that, when combined, have the potential to
create a guide for effective and ideal recycling programs for various institutional settings.
Porter, Leeming, and Dwyer (1995), published the only known review of
behavioral research designed exclusively to increase recycling. They discussed 31
research studies, 21 of which used antecedent interventions, 10 that used consequence-
based interventions, and one that used both. The antecedent interventions included
written and oral prompts, commitment strategies, environmental alterations, goal setting,
and both prompts and environmental alteration. Of these, goal setting was deemed to be
the most promising technique for increasing recycling. Consequence based interventions
included feedback, rewards, and penalty for failure to recycle. Of these, reward-based
consequences proved to be the most effective interventions.
It can be difficult to compare recycling research across settings for many reasons.
Curbside recycling programs capitalize on a captive audience because participants do not
generally vary from day to day. Because of this, public posting, feedback, commitment,
goal-setting and individualized consequence-based contingencies are made more feasible.
For the purposes of this recycling study, a more narrow review of literature is necessary.
6 The following review outlines the relevant research studies that have been performed in
settings similar to a college campus or academic building. Some of the research was
included in the Porter, et al (1995) review and some was published afterward.
In 1980, Geller, Brasted, and Mann studied the effects of aesthetically pleasing
bird shaped trash receptacles when compared to typical unobtrusive trashcans on litter
rates in an indoor mall setting. Two of the typical trashcans were replaced with bird
shaped receptacles. They found that litter rates decreased substantially in the areas
surrounding the bird receptacles and that much more litter was placed in the bird
receptacles compared to the typical trash cans, concluding that aesthetic bins are more
effective.
Jacobs, Bailey, and Crews (1984) studied participation in curbside recycling
programs when residents were presented with varying collection programs. The
programs included various forms of media prompts and coinciding the trash and
recycling collection days. The most effective intervention noted was the distribution of
specialized containers to help residents easily sort recyclables, along with frequent
prompting. Even though the curbside setting of this research study differs greatly from a
college campus setting, the findings have interesting applications. Beyond providing
prompts and educational materials, presenting residents with specialized containers had
the most substantial and longest lasting effects on participation in the recycling program.
This suggests that creating an easy system for sorting recycling from trash may lead to
increased recycling rates in an academic setting.
Austin, Hatfield, Grindle, and Bailey (1993) explored the effects of the proximity
of signage along with the proximity of recycling receptacles to waste receptacles on the
7 percentage of items recycled in two separate academic departments. During baseline, in
Department A, a waste bin and a recycling bin were positioned next to each other. In
Department B, the waste and recycling bins were 4 m apart. All receptacles had small
stickers affixed to them describing proper items for each. In a proximal prompt condition
in Department A, large signs detailing what items were appropriate for each receptacle
were positioned above the receptacles. In Department B, a prompt condition was initiated
where signs were also posted above the receptacles, but the signs and receptacles
remained 4 m apart. After several sessions, the receptacles and signs in Department B
were moved next to each other to replicate the proximal prompt condition in Department
A. In Department A, an increase from 51% in baseline to 84% during the proximal
prompt condition was found. Department B showed also showed a rate of 51% during
baseline increasing to 60% during the prompt condition and 66% during the proximal
prompt condition. These findings suggest that positioning waste and recycling receptacles
in close proximity and positioning signage directly above receptacles results in an
increased rate of recycling.
Werner, Rhodes, and Partain (1998) studied effects of signage on the amount and
cleanliness of polystyrene containers recycled in a school cafeteria setting. The cafeteria
in this study had switched from washable dishware to polystyrene dishware and made
many failed attempts at encouraging all students to recycle the new polystyrene
containers. Problems included lack of recycled items placed into bins, as well as
contamination of the bins by placement of food items, cans, and other non-polystyrene
items. The original signage consisted of printed 8.5 x 11 inch signs placed about three
feet above recycling bins. The signs bore messages simply encouraging students to
8 recycle. By taking into account the participants’ expectations about their physical
environment and events, the authors created new signs that were noticeable, clearly
written, and memorable. The new signs focused on three concepts: recycle, polystyrene,
and how. Large signs were placed at eye level above each bin and were readable from
across the room. Samples of used polystyrene items that had been sufficiently cleaned
(food items scraped off) were attached to the signs demonstrating what could be placed in
the bins and how clean they should be. As a final prompt, the words “STOP. DO NOT
CONTAMINATE” were placed around the rims of the recycling bins. The authors note
that their intervention was not designed to convince people to recycle, only to give
instructions on how to recycle. The dependent variable established in this study was the
estimated amount of recycling in bins. After a four day baseline period, each of the four
bins was approximately one quarter full of polystyrene. This small amount of polystyrene
was contaminated and not recyclable. During the intervention, however, 3.5 bins were
full after every day. The polystyrene was scraped and uncontaminated, all of it was
recyclable.
Duffy and Verges (2009) examined the effects of the presence of specialized
waste receptacle lids on recycling compliance in public settings. They compared the
number and accuracy of items deposited in waste stations with lidless bins to the items
deposited in bins with specialized lids that reflected the shape of items meant to be
deposited. The trash lid consisted of a traditional flap lid, the aluminum, glass, and plastic
lid had a circular hole in it for bottles and cans, and the paper lid had 2-inch wide slits.
Each station included three bins: trash, paper recycling, and aluminum/glass/plastic
recycling. All were located in a 5-story academic building. They found that the presence
9 of the lids increased recycling compliance, measured by the number of items recycled
rather than thrown in the trash bin, by 34%. Additionally, in the lidless condition, a
majority of the recycling bins contained trash items that contaminated the recycling
stream. The lid present condition only had one bin containing a trash item, meaning that
accuracy of items recycled was increased by 95%.
Brothers, Krantz, and McClannahan (1994), studied the effects of the placement
of recycling receptacles on the amount of paper recycled in an office setting. Using an
AB design, they first collected data on the percentage of paper recycled with the presence
of a central recycling bin. During treatment, they provided desktop recycling bins. During
the baseline condition, 28% of paper was recycled compared to 85% – 94% during
treatment. Follow up assessments 1, 2, 3, and 7 months later showed a maintained rate of
84% - 98% paper recycled.
Ludwig, Gray, and Rowell (1998) also studied the effects of the receptacle
location on the number of recycling items placed in the receptacles. They used a multiple
baseline ABA design in two different academic buildings. During baseline conditions,
receptacles were placed in a central location of the building. During the intervention, a
receptacle was placed in each classroom. The researchers collected cans from both the
recycling receptacles and all trash bins in the building. The dependent variable was
calculated by dividing the number of cans in a recycling or trash bin divided by the total
number of cans collected that day. In Building A, 40% of cans were placed in recycling
receptacles during baseline, 63% during intervention, and 40% during withdrawal. In
Building B, 35% of cans were placed in recycling receptacles during baseline, 65% of
cans during treatment, and 29% of cans during withdrawal.
10 O’Conner, Lerman, Fritz, and Hodde (2010) pointed out that the success of
Ludwig et al. (1998) could have been due to the increase in recycling receptacles from
the baseline to treatment condition rather than simply the placement of the recycling
receptacles. In order to test this theory, they performed a replication with an added
condition. Before recycling receptacles were placed in classrooms, they were first placed
outside of each classroom in the hallway. The increased number of receptacles had no
effect on the rate of recycling and the findings of Ludwig et al. (1998) were replicated –
classroom placement is indeed the critical factor.
This research suggests a framework for the creation of effective recycling
programs that consists of at least 5 components. First, aesthetically pleasing, specialized
containers that make sorting simple resulted in a statistically significant improvement in
recycling rates over baseline measures (Geller, Brasted, & Mann, 1980). Second, adding
lids to all receptacles with openings that reflect the predicted shapes of intended waste
streams resulted in a 30-54% improvement (Duffy & Verges, 2009). Third, the addition
of signage that is simple, directional and avoids the use of general pro-recycling
statements increased recycling rates significantly (Werner, Rhodes, & Partain, 1998).
Fourth, placing both signage and all receptacles in close proximity resulted in a 47-71%
improvement (Austin, Hatfield, Grindle, & Bailey, 1993). Lastly, placement of recycling
receptacles in all areas of consumption increased recycling rates by 20-40% (Brothers,
Krantz, & McClannahan, 1994; Ludwig, Gray, & Rowell, 1998; O’Conner, Lerman,
Fritz, & Hodde, 2010). This research project seeks to measure the effect of these
elements when combined and implemented as a treatment package.
11 Research Overview
Prior research has isolated individual variables that affect waste sorting behavior
and increase recycling rates. The goal of the research reported here is to construct a
multicomponent recycling program by incorporating elements from previous research in
an effort to further evaluate and expand the results of this line of research.
Implementation of the recycling program will also explore an ongoing issue at Western
Michigan University. During the Spring 2011 waste audits in Brown Hall, up to 30% of
landfill waste was found to be recyclable material that had been inaccurately sorted. The
intervention presented here attempts to address the issue by using two strategies
suggested by the literature along with one untested strategy.
The first component is new, aesthetically pleasing, and integrated waste
receptacles designed with three shaped openings as dictated by the findings of Duffy and
Verges (2009). The receptacles accept all types of waste sorted into the three waste
streams that WMU accepts (landfill, paper/cardboard recycling and plastic/glass/metal
recycling). This design also allows the three different types of receptacles to be in very
close proximity, as suggested by the findings of Austin, Hatfield, Grindle, and Bailey
(1993) and greatly simplifies the sorting process, as suggested by the findings of Jacobs,
Bailey, and Crews (1984).
The second component is the addition of new signage. The signage was created to
clearly outline what can be placed in each opening, demonstrating both what and how to
recycle, instead of only providing general pro-recycling messages as prescribed by the
findings of Werner, Rhodes, and Partain (1998). Additionally, the signs are mounted on
12 the bins directly above each opening as suggested by the findings of Austin, Hatfield,
Grindle, and Bailey (1993).
The last component concerns the placement of the integrated waste receptacles. In
contrast to the findings of Gray, et al (1998), Brothers, et al (1994), and Fritz, et al
(2010), the integrated waste receptacles were placed in a central location on each floor of
the building. However, in addition, all extraneous trash and recycling bins were removed
from classrooms and public areas. The integrated receptacles were literally the only
option for waste disposal. To the author’s knowledge, no research has studied the affects
of centralized receptacles in the absence of any other options, making this research novel,
while at the same time addressing monetary and maintenance issues. Large receptacles
are costly and in order for this study to represent a recycling program that may actually
be implemented campus-wide and adopted by other institutions in the present economic
climate, it must be cost-effective. Furthermore, reducing the number of recycling and
trash bins that require emptying both reduces the time needed to maintain them and adds
to the practical utility of the program along with the aesthetic environment of campus.
13 METHODS
Participants
Participants included all faculty, staff, students, and community members who
utilized Western Michigan University’s Brown Hall during the Fall 2011 and Spring
2012 semesters. Data were collected as the weight of waste, a product of behavior, with
no identifying information.
Setting
The study took place in Brown Hall on Western Michigan University’s main
campus. The building consists of 4 floors, all containing a combination of classrooms,
labs, and lounges. The building contains two office areas with full time staff. Each floor
of Brown Hall contains one hallway with classrooms and offices on either side. Floors 1
and 2 have entrances in the central area of the hallway. In place of entrances, Floors 3
and 4 have large stairwells in the central area of each hallway. All floors have smaller
stairwells on either end of the hallways. Floors 1 and 2 have a large lecture hall in the
central area that blocks visibility from one end of the floor to the other. Floors 3 and 4 are
completely straight and any objects placed in the hallways are highly visible from any
spot in the hallway. Floor 2 is unique in that it contains a student lounge with vending
machines along with the School of Communication’s library, which includes the building
coordinator’s office and an additional student study area.
The baseline recycling program in Brown Hall included multiple groups of trash
and recycling receptacles in each hallway and common area with no signage. These
14 receptacles consisted of large grey plastic trashcans with vertical push lids, short round
blue plastic bins with white lids that have circular holes for bottle and can recycling, and
tall, rectangular yellow plastic bins with blue lids that have a slot for paper recycling.
Groups of these bins were located in three places on each floor, near the central
entrance/stairwell areas and the stairwells at the ends of each hallway. One group of bins
was also located in the 2nd floor common area. Each classroom and office area also had a
small metal, open top trashcan. Most classrooms and offices had, in addition, a small,
rectangular yellow plastic open-top paper recycling bin.
During the intervention phase, the current recycling bins and trash receptacles
were removed on two of the floors in Brown Hall. One or two multifunction
recycling/trash bin was placed near the central entrance/stairwell areas of each of these
floors. In computer labs, small yellow paper recycling bins were placed under each
printer and all other bins removed. Students are not permitted to have food and beverages
in the labs so the only waste produced is paper from printers. Waste receptacles remained
in all bathrooms. Reference Appendix A for detailed floor plans along with baseline and
intervention locations of recycling bins and trash receptacles.
This research study was designed to test the intervention in classroom settings
only. As a result, it was determined that it was not acceptable to expect office occupants
to utilize a central bin. The two full-time staff offices experienced no change.
15 Materials
Materials included new, integrated recycling/trash receptacles along with detailed
signage. See below for descriptions of both and reference Appendix B for images. Other
materials included rubber dish gloves, wooden dowels, and a first aid kit that was onsite
during trash sorting. Also, laminated tags were created for labeling waste bags by floor.
A digital shipping scale was used for weight measurements. The scale has a stainless
steel platform and a hand held digital display. Its maximum weight is 330lbs.
Dependent Variables
The primary dependent variable recorded was the weight of the contents retrieved
from both the old style trash and recycling receptacles, and the new integrated
recycling/trash receptacles. The weight measurements were used to calculate a
percentage of trash that is recyclable material that has been improperly sorted.
In order to collect these data, student recycling staff and research assistants sorted
and weighed all waste. Data collection was supervised by the researcher and other staff
members. Custodial staff collected trash from throughout the building and student staff
collected recycling. For the first 15 data collection periods, only the first shift landfill
waste was collected. Both shifts were represented for most of the remainder of the study.
In order to ensure consistent data collection, prior to each data collection sorting
session with new data collectors, supervising staff members presented a review of items
that data collectors will be likely to find while sorting and whether or not they are
16 recyclable. The WMU guide for recyclable items was used during this review and can be
found in Appendix C.
Weight of Waste
All landfill and recycling waste collected from the building during the study was
weighed and used to calculate the dependent variable percentage measures. In order to
determine the weight of waste bags, data collectors weighed each individual bag of waste
according the protocol in Appendix D.
Waste was measured and recorded in two main categories. Trash and improperly
sorted recycling waste included all the waste that had been placed in trash receptacles.
Recycling waste includes all waste that has been placed in recycling receptacles.
Additionally, all bags of waste were weighed separately by floor. To ensure that the trash
and recycling waste from each floor remained separate, custodial staff were given small
laminated signs for labeling waste bags.
Trash and Improperly Sorted Recycling Waste
Custodial staff typically collect trash each weekday morning and afternoon and
deposit it in the dumpster outside Brown Hall. During the study, custodians labeled all
trash bags and left them on the Brown Hall loading dock to be sorted and weighed. Each
weekday, data collectors processed trash that was brought to the dock the previous
17 afternoon and that morning. After data collection, data collectors placed trash in the
appropriate dumpster.
During data collection sessions, all landfill waste was first sorted to remove all
recycling items that were incorrectly placed in landfill receptacles. These incorrectly
placed recycling items were weighed separately. The resulting two measures are the
weight of landfill waste, and the weight of recycling waste (paper/cardboard and
plastic/glass/metal) that was incorrectly placed in landfill receptacles. From these two
weight measures, an accuracy measure of landfill receptacles was calculated for each
floor. The accuracy of items placed in the trash receptacle is calculated as a percentage by
comparing the overall weight of landfill to the weight of the inaccurately placed
recycling.
No bathroom waste was sorted during the study for health and safety reasons.
Bathroom waste is primarily composed of paper towel and hygiene products, neither of
which are recyclable. Bathroom waste was weighed and added to the correctly sorted
landfill waste total for each floor.
All research assistants and data collection volunteers were made familiar with the
Data Collection Protocol in Appendix D. The protocol outlines how to safely sort and
handle waste bags and what to do in case of an accident.
Recycling Waste
Student recycling staff members typically empty the paper and plastic/glass/metal
recycling bins in Brown Hall twice each week and place the recycling waste in the
18 appropriate dumpsters outside of the loading dock. During the study, data collectors
emptied and weighed the contents of all recycling bins from each floor every morning.
Data were collected as the weight of paper/cardboard and weight of plastic/glass/metal
recycling.
The accuracy of items placed in recycling bins was not an issue in Brown Hall,
and had not been on campus overall, so recycling was not sorted daily for accuracy.
Waste Discarded in Classrooms
It was deemed likely that in the absence of in-classroom waste receptacles,
students would discard waste on the floor. This is a legitimate cause for concern due to
the potential for additional workload for custodial staff. In order to measure the
occurrence of waste on classroom floors and ensure that custodial staff did not experience
an additional workload, a supplementary measure was taken. Once each week during the
study, custodial staff left a labeled bag of floor waste from all classrooms. Data collectors
counted the number of waste items, recyclable or not, and recorded it. Baseline measures
were compared to treatment measures. A protocol was developed in the event that the
amount of waste found during treatment significantly exceeded the amount of waste
found during baseline. If that situation had occurred, an old style trash can,
plastic/glass/metal bin, and paper/cardboard bin would have been placed at either end of
all treatment floors and data collection would have continued.
19 Experimental Conditions
General Procedures
All four floors in Brown Hall first experienced a four-month baseline condition.
Nothing changed except for the implementation of data collection practices. Thereafter,
Floors 1 and 2 experienced the treatment package with new integrated waste and
recycling bins and new signage in a multiple baseline pattern. Floors 3 and 4 remained in
the baseline condition throughout the study to serve as control measures.
Baseline
The baseline condition represented the current campus waste collection program,
including multiple centralized but separate landfill, paper, and bottle/can receptacles
along with small classroom trash bins and paper recycling bins.
Independent Variables
The independent variables made up the treatment package, including the new
waste receptacles and new signage along with removal of the old receptacles.
Waste Receptacles
The new multifunction waste receptacles were made from stainless steel with
openings on the top horizontal section and frames for signage on a vertical backing
behind the openings. The two right side openings are a slot and round shaped for
20 paper/cardboard recycling and glass/plastic/metal recycling. The left side opening is a
large rectangle for landfill. Each opening is centered on a removable tray for future
changeability of the openings. The vertical back portion of the receptacles has three open
faced frames for signage and an open top for easy replacement of signs. Reference
Appendix B for images of the receptacle.
Signage
The new signage consisted of three signs mounted on the receptacles directly
above each of the three openings. The signs are designed with consideration of the
findings of Werner, Rhodes, and Partain (1998). Each sign contains a label for the
opening it is located above (plastic/glass/metal, paper/cardboard, landfill) along with a
list of what can be sorted into the opening. Each of the three signs is a bright color that
corresponds with the color scheme of the old style recycling bins. Yellow for
paper/cardboard, blue-green for plastic/metal/glass, and red for landfill. Matching flyers
were posted in classrooms and hallways where trashcans were removed directing users to
the new multifunction receptacle. Reference Appendix B for images of the signage.
Experimental Design
The study was a concurrent multiple baseline with a control component. All floors
began in a baseline condition. After a full semester of the baseline condition, the
treatment package was implemented on Floor 1. After nine data collection sessions, the
treatment package was then implemented on Floor 2, and after seven additional data
21 collection sessions, a second bin was placed on Floor 2. Floors 3 and 4 remained in the
baseline condition for the entirety of the study to serve as an additional control
component.
Interobserver Agreement
Interobserver agreement was performed during at least one data collection session
per week. One bag of trash was sorted by one data collector out of sight of the other data
collectors. The data collector then weighed the recycling and landfill and mixed it back
into the same bag. A different data collector then re-sorted the bag and weighed the
sorted recycling and landfill again. Each bag of waste typically took five minutes to sort,
meaning that the entire process normally took less than fifteen minutes. IOA was
calculated as a percentage difference between the two independently collected weights of
recycling and landfill for one floor for an entire day. A protocol was developed that
called for additional training sessions if IOA is calculated at less than 80%. This situation
never occurred and IOA was calculated to be 90% agreement over 19% of sessions.
Reference Appendix D for the full interobserver agreement protocol.
22 RESULTS
51 days of data collection are represented by the results. Data are discussed first
in terms of the percentage and weight of recyclable materials that were found in landfill
receptacles daily. This measure will then be broken into its categories of paper/cardboard
and plastic/glass/metal. Accurately sorted recyclable materials will then be presented,
followed by the daily weights of all waste streams separately and combined. The average
daily weight of waste will also be presented for each category of waste and the
differences between baseline and intervention phases will be highlighted. The results
conclude with classroom litter data, and social validity survey results.
Recyclable Material Inaccurately Placed in Landfill
Recyclable Material as a Percentage of Landfill Waste
A decrease in the percentage of recycling inaccurately placed in landfill following
the implementation of the treatment package was found on Floors 1 and 2 with a further
decrease following the addition of a second comprehensive bin on Floor 2 (see Figure 1).
During the baseline phase, the percentage showed an upward trend on all floors except
Floor 3, which trended slightly downward. During intervention phases, all data show a
significant downward trend. The level of variability also showed marked change during
intervention phases. R-squared values for trend lines during baseline varied between .014
and .187 while intervention values ranged as high as .588 and .651. The highest
correlation was found on Floor 2 after the first bin was installed (see Table 1)
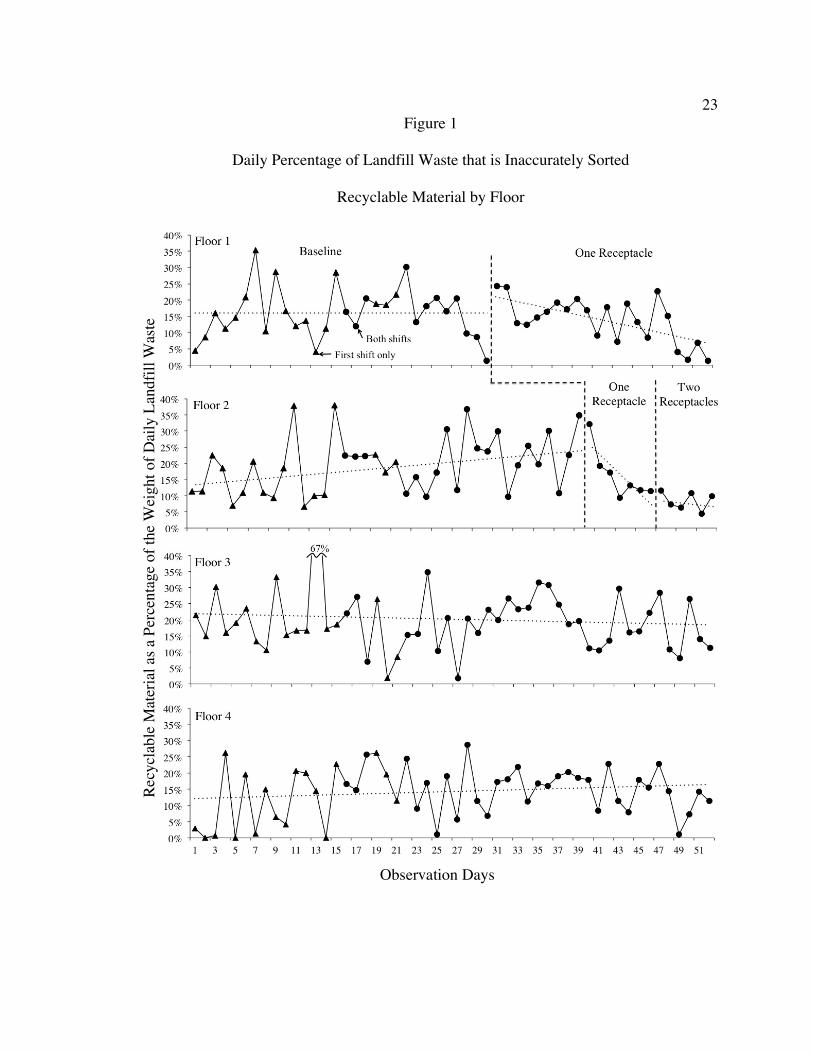
23 Figure 1
Daily Percentage of Landfill Waste that is Inaccurately Sorted
Recyclable Material by Floor
Observation Days
Recy
clab
le M
ater
ial a
s a P
erce
ntag
e of
the
Wei
ght o
f Dai
ly L
andf
ill W
aste

24 Table 1
Simple Linear Regression R Squared Values
Weight of Recyclable Material Found in Landfill
The weight of recycling inaccurately placed in landfill was broken into its
components, paper/cardboard and plastic/glass/metal. The levels of both categories are
similar over the first 15-20 data points on each floor and increasingly separate from each
other during baseline. More plastic/glass/metal was found than paper/cardboard during
the baseline phase on all floors. Following the implementation of the treatment package
on Floors 1 and 2, the level of plastic/glass/metal decreases significantly and becomes
less variable (see Figure 2).
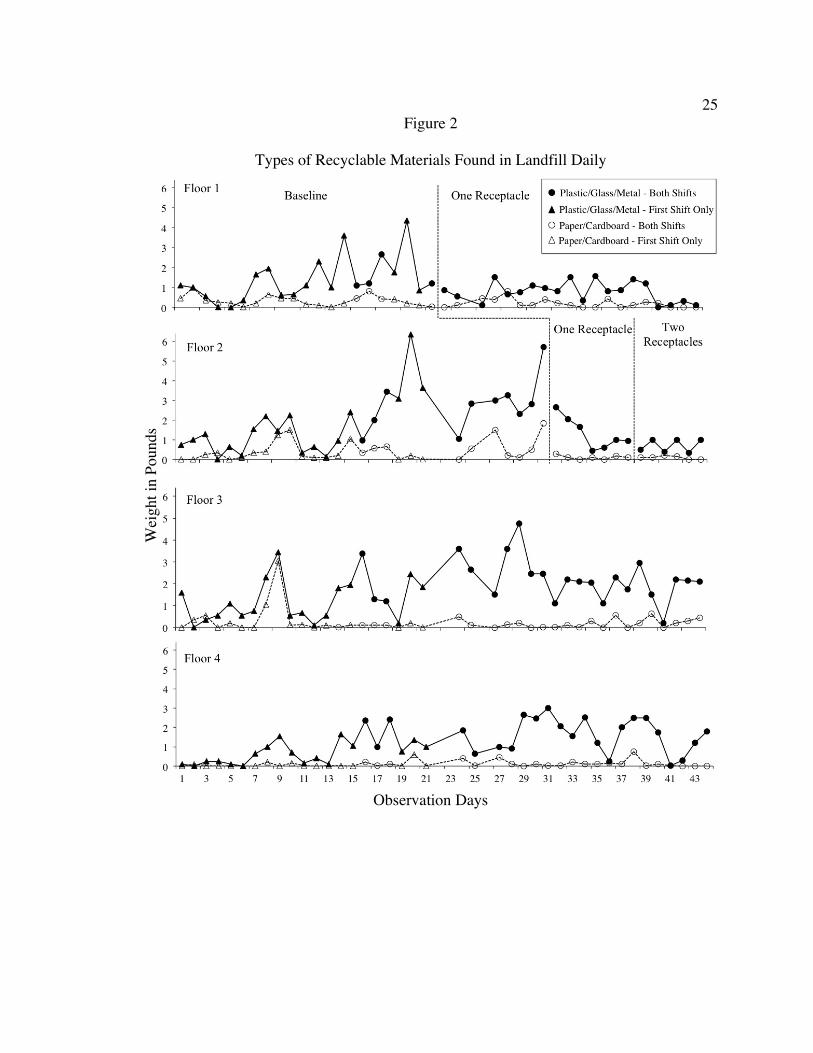
25 Figure 2
Types of Recyclable Materials Found in Landfill Daily
Wei
ght i
n Po
unds
Observation Days

26 Weight of Accurately Sorted Recyclable Materials
The weight of recycling placed in recycling receptacles was broken into the
weight of its separate categories, paper/cardboard and plastic/glass/metal (see Figure 3).
Paper/cardboard accounted for more of the accurately sorted recycling than
plastic/glass/metal. Paper/cardboard was also found to be more variable with an overall
standard deviation of 2.18 compared to .84 for plastic/glass/metal (see Table 2). Also,
plastic/glass/metal showed notable increases following the implementation of the
intervention package on Floors 1 and 2 that were greater than the increases found on
Floors 3 and 4.
Table 2
Accurately Sorted Recyclable Materials
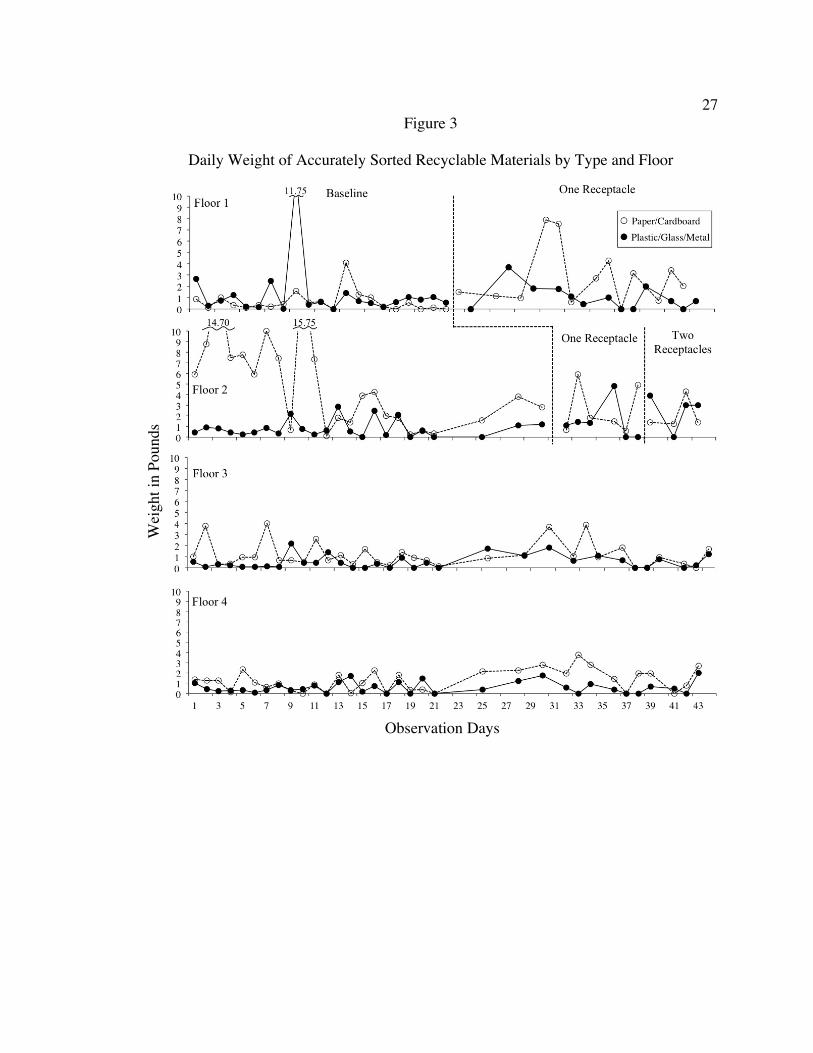
27 Figure 3
Daily Weight of Accurately Sorted Recyclable Materials by Type and Floor
Observation Days
Wei
ght i
n Po
unds
28 Daily Weight of Waste
Weight of Recycling and Landfill
The daily weight of recycling and landfill are considered separately in Figure 4.
On each floor, the weight of both recycling and landfill waste follow similar paths over
the first 15-20 data points and separate over the course of the baseline phase with more
landfill waste collected than recycling. Landfill levels remained higher than recycling on
Floors 3 and 4 for the remainder of the data collection period. Upon implementation of
the intervention package on Floors 1 and 2, landfill levels decreased significantly and
recycling levels increased somewhat. Reductions can be seen in the variability of both
waste categories during intervention phases.
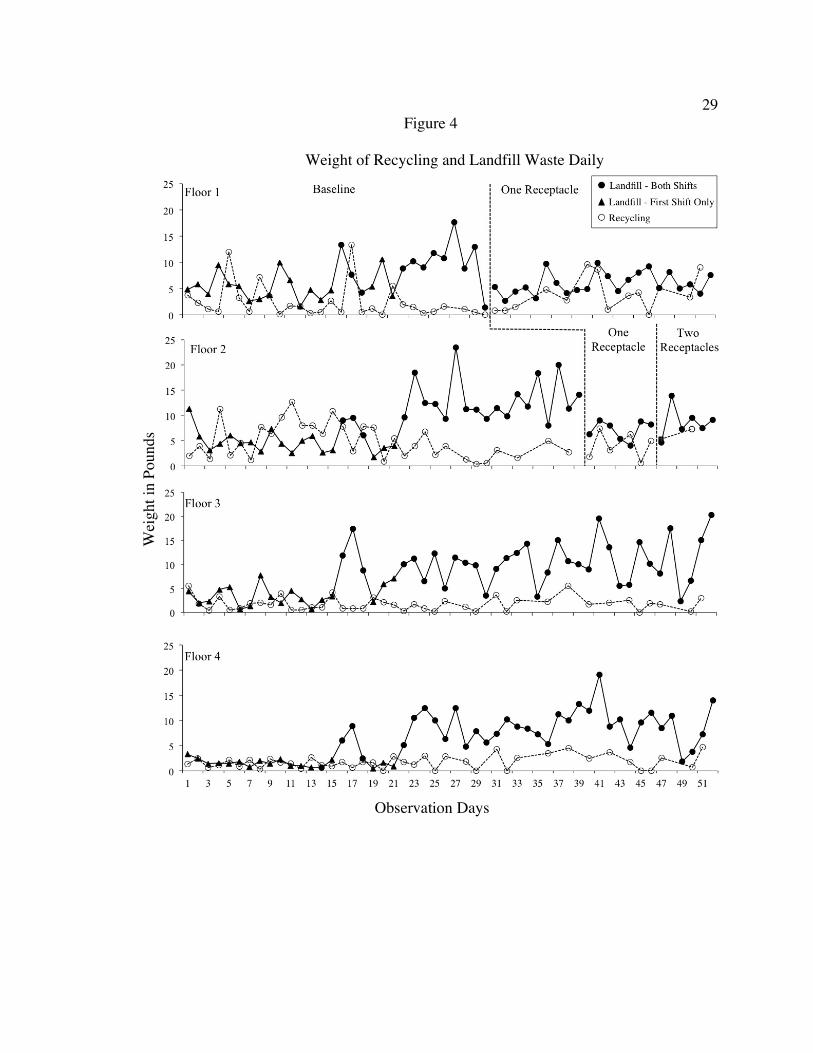
29 Figure 4
Weight of Recycling and Landfill Waste Daily
Observation Days
Wei
ght i
n Po
unds
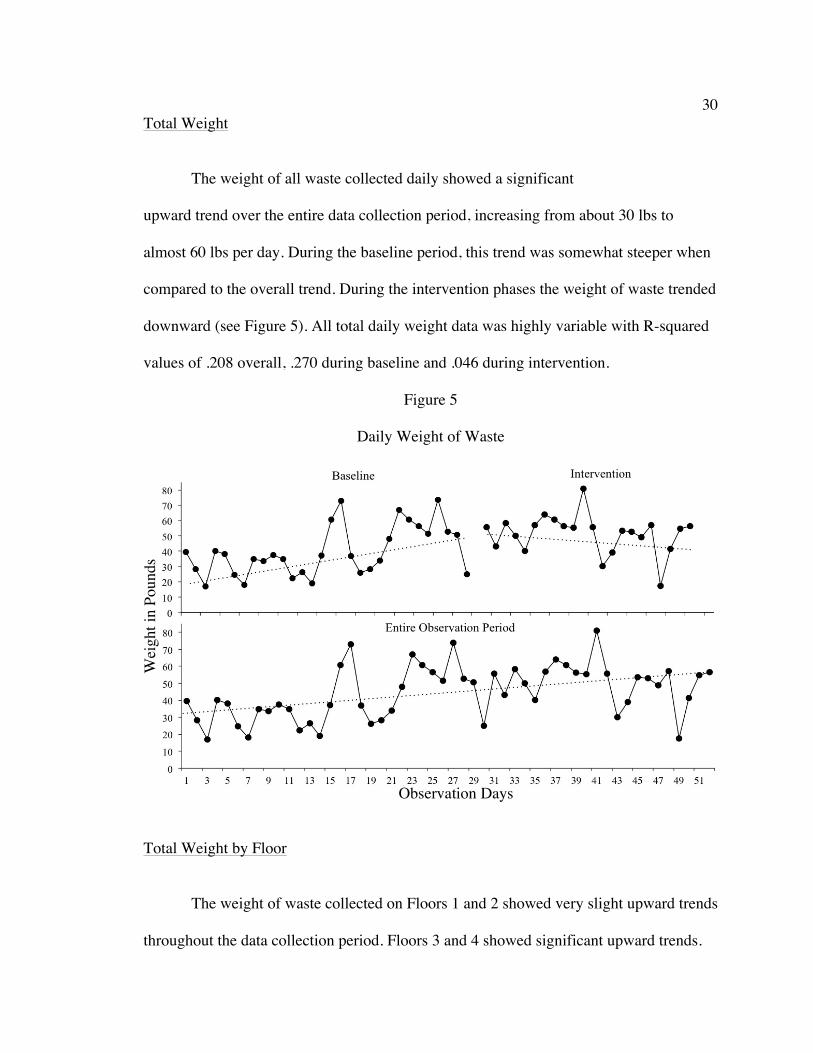
30 Total Weight
The weight of all waste collected daily showed a significant
upward trend over the entire data collection period, increasing from about 30 lbs to
almost 60 lbs per day. During the baseline period, this trend was somewhat steeper when
compared to the overall trend. During the intervention phases the weight of waste trended
downward (see Figure 5). All total daily weight data was highly variable with R-squared
values of .208 overall, .270 during baseline and .046 during intervention.
Figure 5
Daily Weight of Waste
Total Weight by Floor
The weight of waste collected on Floors 1 and 2 showed very slight upward trends
throughout the data collection period. Floors 3 and 4 showed significant upward trends.
Wei
ght i
n Po
unds
Observation Days
31 When divided into phases at the point of the first intervention, Floor 1 showed a slightly
steeper upward trend when compared to the trend of the total data collection period on
that floor and repeated that trend during the intervention phase. Floor 2 showed a
significant upward trend during baseline, followed by depressed levels and downward
trends during intervention phases (see Figure 6).
Based on the trend lines for the total weight of waste (reference Figure 5),
expected changes in weight for each floor were weighted and calculated for baseline and
intervention phases. Over the entire data collection period, Floors 3 and 4 experienced
disproportionate increases in weight that were almost double what could be expected.
During the intervention phase, Floors 1 and 2 experienced levels of weight that
were 1.5 – 3 times lower than what was predicted by the intervention phase total weight
trend line. Additionally, the average of the daily weight of waste collected on Floors 1
and 2 was similar during baseline and intervention while the average weight increased by
47% on Floor 3 and doubled on Floor 4. See Appendix E and Table 3 for charts of
expected and actual changes in weight based on trend lines along with the average weight
for each floor during each phase.
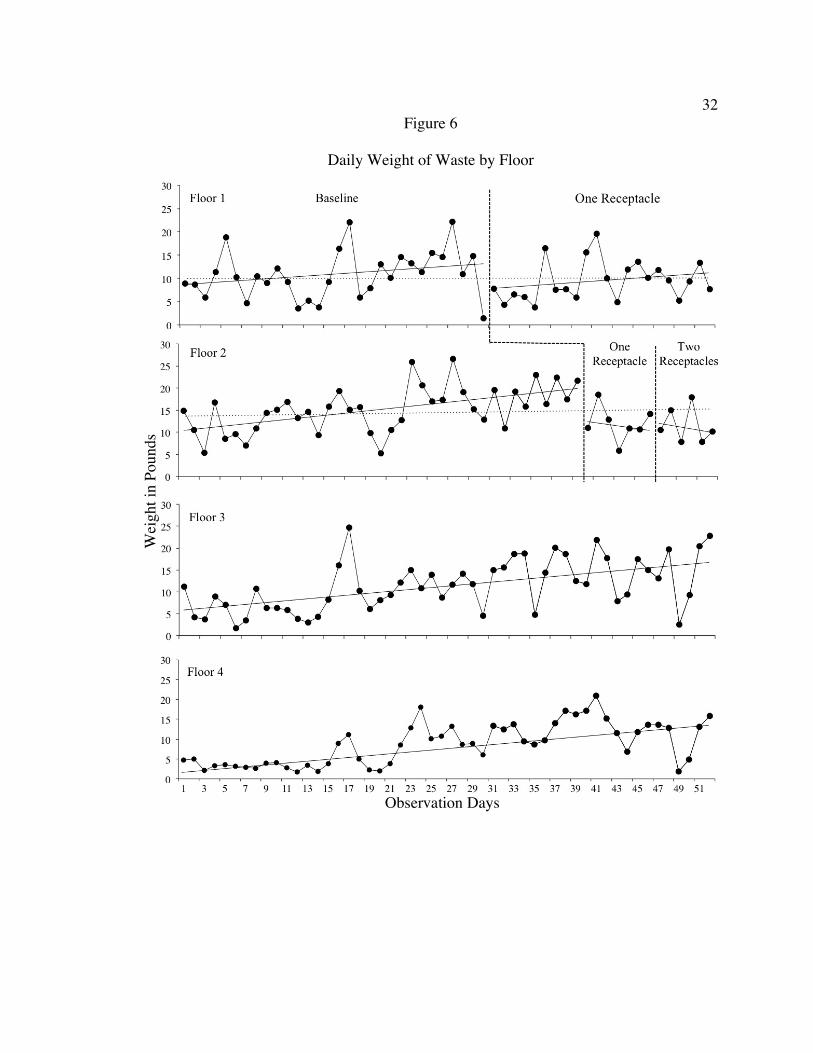
32 Figure 6
Daily Weight of Waste by Floor
Observation Days
Wei
ght i
n Po
unds
33 Averages Analysis
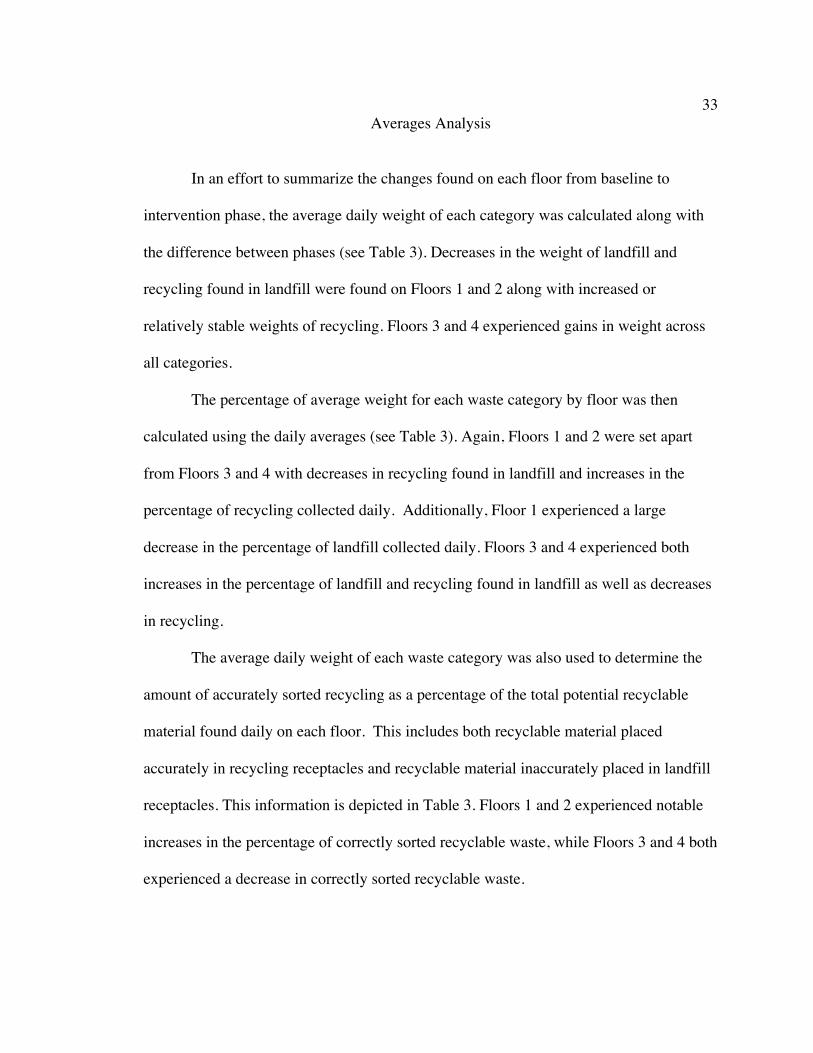
In an effort to summarize the changes found on each floor from baseline to
intervention phase, the average daily weight of each category was calculated along with
the difference between phases (see Table 3). Decreases in the weight of landfill and
recycling found in landfill were found on Floors 1 and 2 along with increased or
relatively stable weights of recycling. Floors 3 and 4 experienced gains in weight across
all categories.
The percentage of average weight for each waste category by floor was then
calculated using the daily averages (see Table 3). Again, Floors 1 and 2 were set apart
from Floors 3 and 4 with decreases in recycling found in landfill and increases in the
percentage of recycling collected daily. Additionally, Floor 1 experienced a large
decrease in the percentage of landfill collected daily. Floors 3 and 4 experienced both
increases in the percentage of landfill and recycling found in landfill as well as decreases
in recycling.
The average daily weight of each waste category was also used to determine the
amount of accurately sorted recycling as a percentage of the total potential recyclable
material found daily on each floor. This includes both recyclable material placed
accurately in recycling receptacles and recyclable material inaccurately placed in landfill
receptacles. This information is depicted in Table 3. Floors 1 and 2 experienced notable
increases in the percentage of correctly sorted recyclable waste, while Floors 3 and 4 both
experienced a decrease in correctly sorted recyclable waste.
34 Table 3
Averages Analysis
35 Classroom Litter
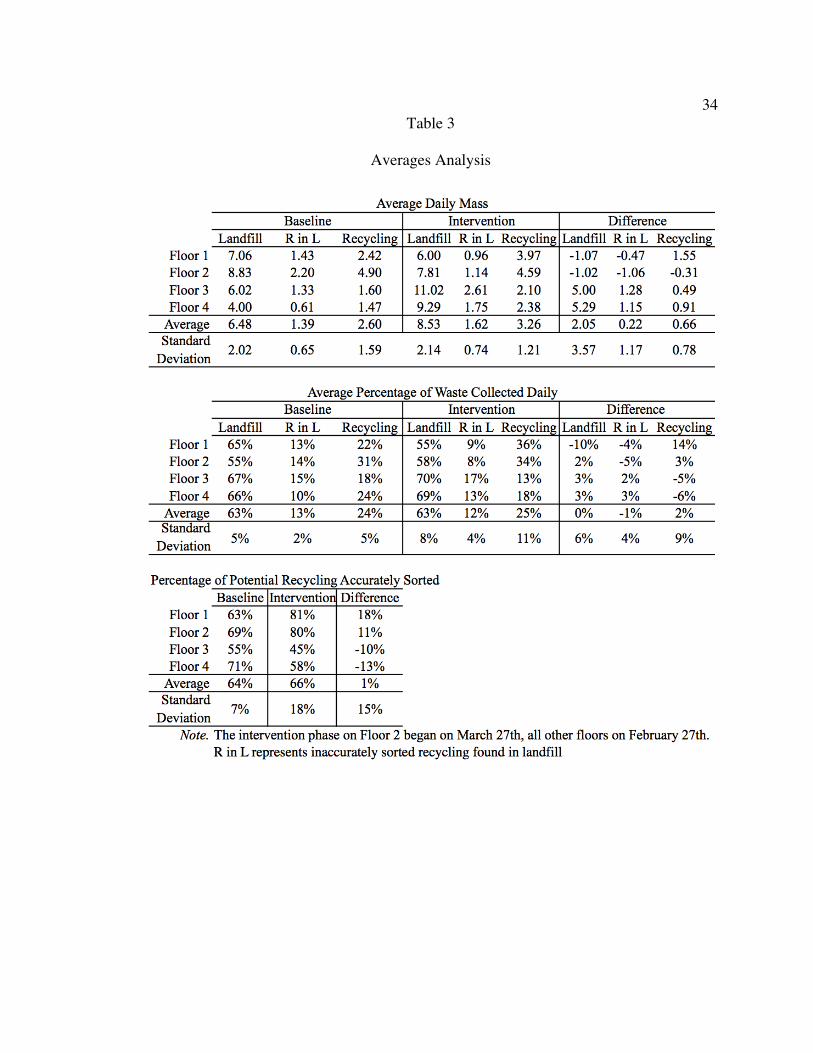
The amount of waste left in classrooms increased substantially from baseline to
intervention phases, with a baseline mean of 2.6 items and intervention mean of 6.4. An
increase in variability was also documented with a standard deviation of 2 during
baseline and 4.6 during intervention. Reference Figure 7.
Figure 7
Items Found in Classrooms
Social Validity
Social validity was measured with a satisfaction survey. The survey was made
available to participants on paper and through the Survey Monkey website. Paper surveys
were located in the Communications Library on Floor 2 of Brown Hall. Reference
Appendix G for the survey that was distributed.
Of the 45 surveys collected, 15 were paper surveys and 30 were submitted
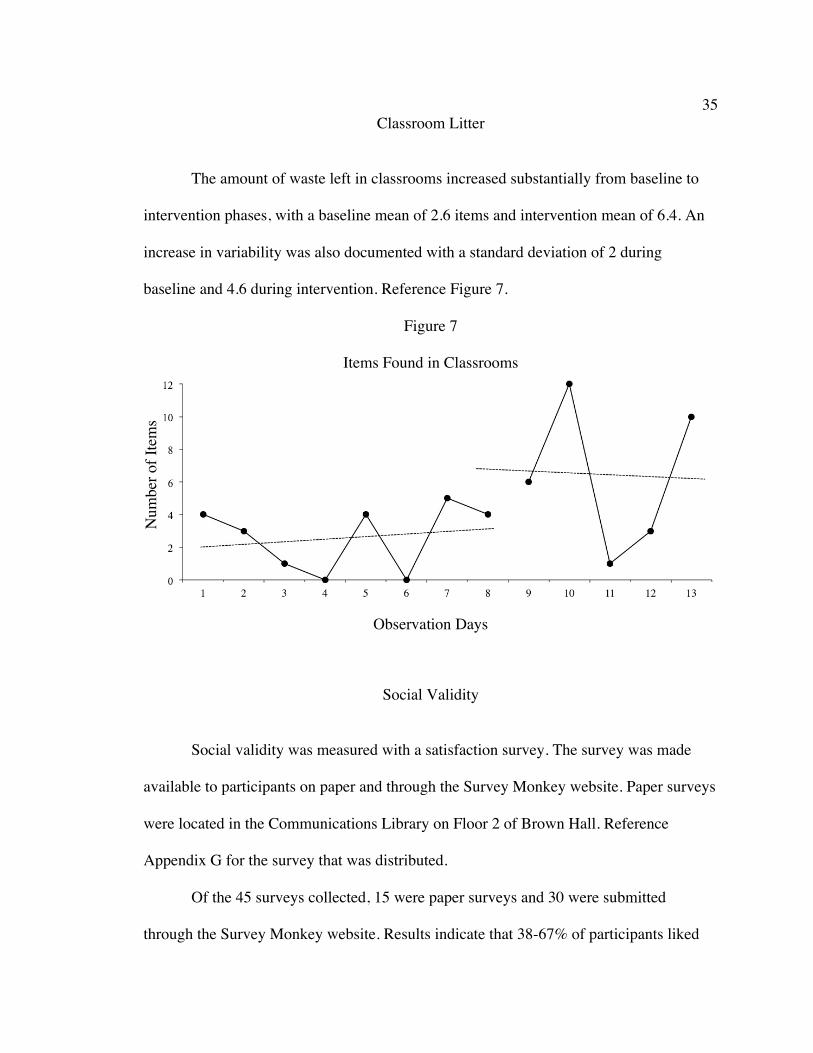
through the Survey Monkey website. Results indicate that 38-67% of participants liked
Observation Days
Num
ber o
f Ite
ms
36 the new comprehensive receptacles and believed that their presence made it easier for
them to dispose of recycling and landfill while accurately sorting recyclables. The
question regarding the likelihood of leaving waste behind in classrooms resulted in the
greatest level of mixed response. 26% of the respondents marked that they agree or
strongly agree with the statement, “Because of the new waste receptacles, I am more
likely to leave litter in classrooms or other work areas.” 62% disagreed or strongly
disagreed with this statement (see Figure 8). Reference Appendix F for full
documentation of responses to the open-ended survey questions.
Figure 8
Comprehensive Waste Receptacle Satisfaction Survey Results
Perc
enta
ge o
f Sur
vey
Res
pons
es
Survey Questions
37 DISCUSSION
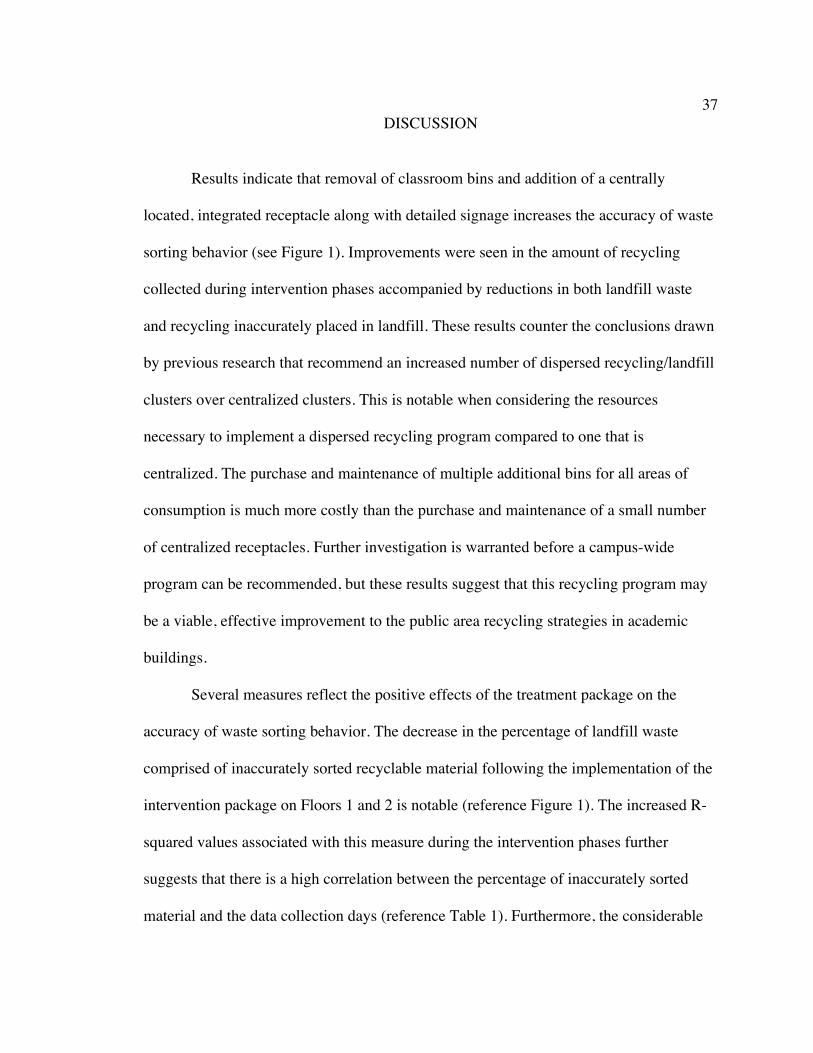
Results indicate that removal of classroom bins and addition of a centrally
located, integrated receptacle along with detailed signage increases the accuracy of waste
sorting behavior (see Figure 1). Improvements were seen in the amount of recycling
collected during intervention phases accompanied by reductions in both landfill waste
and recycling inaccurately placed in landfill. These results counter the conclusions drawn
by previous research that recommend an increased number of dispersed recycling/landfill
clusters over centralized clusters. This is notable when considering the resources
necessary to implement a dispersed recycling program compared to one that is
centralized. The purchase and maintenance of multiple additional bins for all areas of
consumption is much more costly than the purchase and maintenance of a small number
of centralized receptacles. Further investigation is warranted before a campus-wide
program can be recommended, but these results suggest that this recycling program may
be a viable, effective improvement to the public area recycling strategies in academic
buildings.
Several measures reflect the positive effects of the treatment package on the
accuracy of waste sorting behavior. The decrease in the percentage of landfill waste
comprised of inaccurately sorted recyclable material following the implementation of the
intervention package on Floors 1 and 2 is notable (reference Figure 1). The increased R-
squared values associated with this measure during the intervention phases further
suggests that there is a high correlation between the percentage of inaccurately sorted
material and the data collection days (reference Table 1). Furthermore, the considerable
38 increase in the percentage of potential recycling that was accurately placed in recycling
receptacles on Floors 1 and 2 accompanied by a decrease in this percentage on Floors 3
and 4 (reference Table 3) indicates that the treatment package was the key factor in
collecting accurately sorted waste and increasing recycling rates.
During baseline, plastic/glass/metal accounted for more of the recyclable material
found in landfill than paper/cardboard. This is most likely a result of the current campus
waste collection system that calls for landfill and paper/cardboard receptacles in every
classroom, but no plastic/glass/metal receptacle. Because many students consume
beverages during class, the proximity of a landfill receptacle in these areas of
consumption resulted in significant amount of plastic/glass/metal inaccurately sorted into
the classroom landfill receptacles. During the intervention phases on Floors 1 and 2, the
amount of plastic/glass/metal found in landfill waste decreased significantly (reference
Figure 2) and the amount of plastic/glass/metal correctly placed in recycling receptacles
increased (reference Figure 3). It can be assumed that this is a result of the removal of
classroom landfill receptacles on Floors 1 and 2 and addition of the integrated
receptacles. The baseline response cost of accurately disposing of plastic/glass/metal
waste generated in classrooms was relatively high because of the requirement to carry
empty bottles and cans past a landfill receptacle and out to hallway receptacles. During
intervention phases, occupants on Floors 1 and 2 were forced to use the comprehensive
receptacles when disposing all waste. The reduction in the response cost associated with
accurate waste sorting when all waste stream disposal options are presented in close
proximity contributed to this increase in accurately sorted material.
39 Differences in Intervention Effectiveness
There are noticeable differences in the effectiveness of the treatment package on
Floor 1 when compared to Floor 2. The percentage of inaccurately placed recyclable
material found in landfill is higher on Floor 1 (reference Figure 1). It can be hypothesized
that differences after placement of one bin on Floors 1 and 2 are attributable to the
characteristics of each floor. Floor 1 is designed so that building users cannot see from
one end of the hallway to the other. A large lecture hall sits in the middle of the hallway
and obstructs the view. On Floor 2, the first bin was placed in a central location that was
visible from both ends of the hallway. It is possible that the increased visibility resulted in
more usage on Floor 2 compared to Floor 1.
Additionally, on Floor 1, the bathrooms are located near a number of relatively
high traffic classrooms. Many building occupants utilized the bathroom trash receptacles
for all waste including recycling, most likely as a result of the proximity to waste
generation areas. This issue may have also contributed to the higher percentages of
inaccurately sorted recyclable material on Floor 1 compared to Floor 2. This may have
also been an issue on Floor 2 before the introduction of the second bin. It may also
account for the additional decrease in the percentage of inaccurately sorted recyclable
material following the placement of the second bin.
Accounting for Increase in Predicted Weight
The disproportionate increase in weight on Floors 3 and 4 coupled with the
decrease in weight on Floors 1 and 2 during the intervention phases is somewhat
40 concerning. It cannot be accounted for with an increase in the number of classes held on
those floors during the intervention phase (see Table 4). Another possible explanation
could include differences in class assignments. If professors assigned more in-class
homework or printing assignments during class time, especially in the upstairs rooms
with printers, it is possible that students would dispose of paper waste within the building
and an increase in weight would result. However, this theory is disproven by an analysis
of Figure 3. There was no notable increase in paper recycling on those floors during the
intervention phase. Additionally, Figure 4 indicates that the increasing category of waste
on those floors was landfill and not recycling. Of the landfill waste on Floors 3 and 4,
plastic/glass/metal showed increases over paper/cardboard (see Figure 6). It can be
surmised, then, that as a result of the restricted number of receptacles on Floors 1 and 2
during the intervention phases, building occupants may have carried their waste to the
other floors for disposal. Many students who use Brown Hall major in communications or
foreign languages and have multiple classes in the building, there is some likelihood that
students might carry waste with them as they travel between classes and floors within the
building. It is also possible that, resulting from the reduction in number of bins, more
building occupants on Floors 1 and 2 packed waste away instead of travelling to the
centrally located bin and took it with them as they left the building. In this scenario, it
would be assumed that all floors would have increased equally had the intervention not
been implemented.
41 Table 4
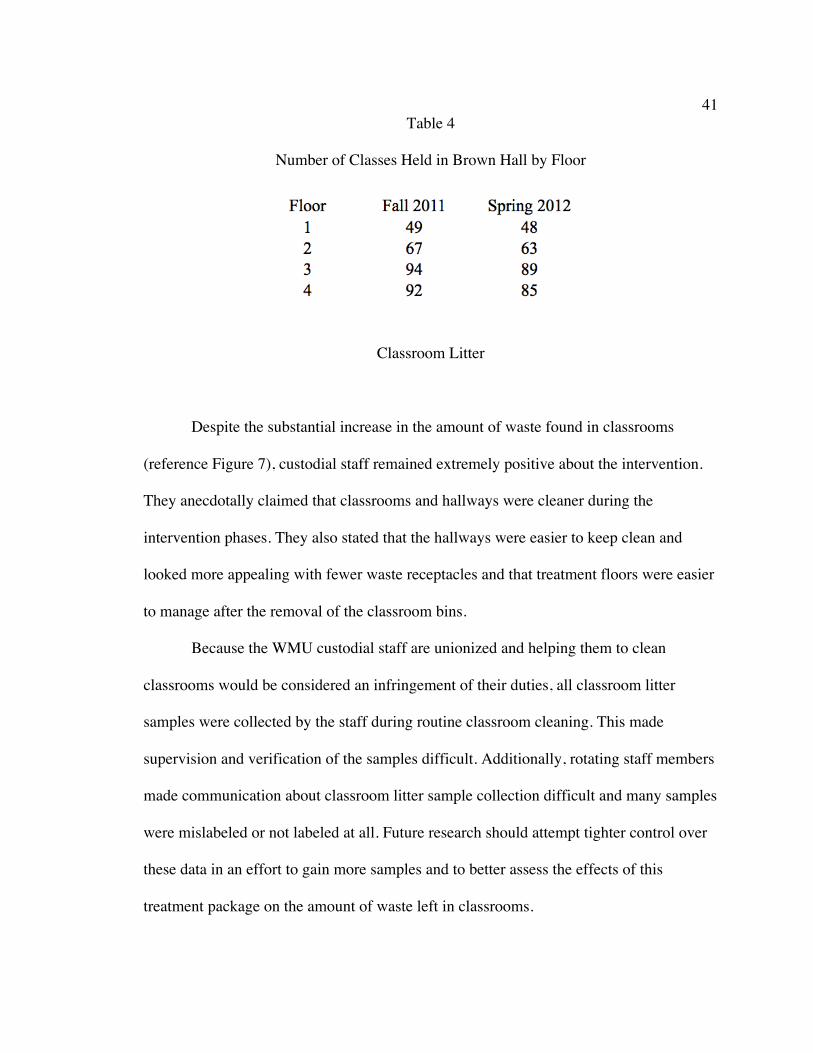
Number of Classes Held in Brown Hall by Floor
Classroom Litter
Despite the substantial increase in the amount of waste found in classrooms
(reference Figure 7), custodial staff remained extremely positive about the intervention.
They anecdotally claimed that classrooms and hallways were cleaner during the
intervention phases. They also stated that the hallways were easier to keep clean and
looked more appealing with fewer waste receptacles and that treatment floors were easier
to manage after the removal of the classroom bins.
Because the WMU custodial staff are unionized and helping them to clean
classrooms would be considered an infringement of their duties, all classroom litter
samples were collected by the staff during routine classroom cleaning. This made
supervision and verification of the samples difficult. Additionally, rotating staff members
made communication about classroom litter sample collection difficult and many samples
were mislabeled or not labeled at all. Future research should attempt tighter control over
these data in an effort to gain more samples and to better assess the effects of this
treatment package on the amount of waste left in classrooms.
42 Special Situations
Brown Hall contains one computer lab that is open for all students to use during
business hours. The lab is secluded and contains no windows and lab supervision is
minimal. Despite a strict no food or drink rule in all computer labs, this lab initially saw a
number of food and drink related waste items. Because the treatment package called for
the elimination lab area trash bins, this waste landed in the lab paper-recycling receptacle.
This was only an issue for the first week of intervention, but it should be noted for future
application of this treatment package.
Unexpected waste volumes were also experienced during the last two weeks of
the semester. Despite a campus wide policy stating that food is not allowed in
classrooms, many professors host end-of-semester parties. These parties resulted in an
overflow of waste. Some survey participants voiced frustration with this issue. The new
bins are not large enough to accept plastic cups, plates, and pizza boxes from multiple
parties and the landfill and recycling began to overflow onto the top of the bins and the
floor surrounding the bins. The overflow problems most likely affected the accuracy of
waste sorting during that time. In the future, custodial staff will place mobile recycling
and waste bins inside classrooms that are hosting food parties. This should alleviate the
issue by providing a space just for party waste, but the issue should continue to be
monitored.
43 Weight as a Form of Data Collection
Weight of waste was chosen as the dependent variable for a number of reasons,
however the utilization of this measure is not free from considerations. Relying on the
weight of disposed waste or recyclable products is an indirect measure, really a response
product, of the behaviors that actually resulted in the placement of waste or recyclable
materials into a disposal bin. This type of response product measure is appealing because
of its simplicity and objectivity as a measure of waste sorting behavior. However, it does
not provide direct information about the form of the behavior that produces the waste nor
does it provide information about the authorship of the response product (e.g., who and
how many people engaged in behaviors that produced the waste material in a disposal
bin). Counting the number of items discarded, while potentially a more sensitive
measure, would become quite tedious and would be nearly impossible when small items
such as shredded paper are presented during data collection. Direct observation of waste
disposal is potentially the most accurate and sensitive data collection method, however
direct observation is time intensive and potentially reactive. Additional measures such as
demographic information, foot traffic patterns, and time spent near the bins and signage
immediately prior to disposal could be considered along with data about the items being
disposed of.
Limitations
The current findings suggest that the treatment package is effective in decreasing
the amount of recycling that is inaccurately sorted as landfill while also increasing the
amount of recycling collected. However, these results are not without limitations. The
44 current sample size was relatively small, making it difficult to draw definite conclusions.
The intervention phases were short and took place during the Spring 2012 semester only.
Building occupants experienced baseline for a portion of the semester and then various
levels of the intervention. Continuing data collection into a new semester would have
allowed for the assessment of the long-term effects of the intervention package. All trend
lines showed increasing improvement throughout the intervention phases and it is
impossible to determine how far this trend would have continued. Continuing data
collection into a new semester could potentially assess the effect of the intervention
package on a new group of building occupants who may not have become accustomed to
the baseline system in Brown Hall before experiencing the intervention.
Additionally, the low volume of waste measured daily creates difficulty when
drawing conclusions from the data. Because of its size and function, Brown Hall does not
generate a substantial amount of daily waste. As a result, on floors or days with relatively
low levels of waste, one or two mis-sorted items can result in an exacerbated percentage
of inaccurately sorted material by weight. This issue is also apparent when considering
the trend line analysis. Some floors were predicted to change over time by such small
increments that it is impossible to determine whether or not the predictions and actual
outcomes are significant without the analysis of a larger data set.
The lack of second shift data during the initial data collection period presents a
data analysis issue. All data points lacking this additional information look somewhat
different from the data points that include both shifts. Analysis of the weight of recycling
and landfill collected daily along with the breakdown of recyclable material found in
landfill were the measures greatest impacted by this lack of information (reference
45 Figures 2 and 4). In the case of the weight of landfill and recyclable material, a
substantial increase in the amount of landfill waste collected daily can be seen following
the inclusion of second shift data. Similarly, the amount of plastic/glass/metal found in
landfill shows higher levels after addition of second shift data. Further investigation is
warranted, as this could indicate interesting differences in the composition of first and
second shift waste collected in Brown Hall.
The use of the top two floors of Brown Hall as comparison to the intervention
floors also presents drawbacks. Floors 1 and 2 present a number of important differences
from Floors 3 and 4. Exits from the building are located on Floors 1 and 2 only.
Additionally, Floors 1 and 2 house a variety of specialized spaces including computer and
communication labs along with large lecture halls, student lounges and staff offices.
Floors 3 and 4 contain classrooms almost exclusively. It is possible that the differences in
the physical characteristics of each floor account for some of the changes noted in the
results.
The narrow scope of the application of this intervention presents limitations to the
generalizability of the results. It can be assumed that the positive effects of the package
might transfer only to other similar academic settings with similar student-based
populations. Application of the intervention package to other building types in different
cultures or regions may result in altered effects. The general age of building occupants
may also alter the effectiveness of the intervention.
The presence of the “Looking for the Trash?” posters presents another possible
limitation to this investigation. Prompting building occupants to look in the hallway for
the integrated receptacles may have constituted a confounding variable to the analysis of
46 the utilization of the receptacles. Because the intervention took place in the middle of a
semester, it was recommended by multiple university officials that the alterations to the
waste collection system be announced in some way. The immediate and prolonged
effects of the intervention may be altered in the absence of these directional posters and
should be considered in the future.
Behavioral Mechanisms
It can be assumed that social contingencies are responsible for supporting the
general behavior of waste receptacle utilization. The vast majority of waste generated in
the public areas of a university is placed in receptacles and not discarded on the ground as
litter. That said, having a waste item in possession could be considered aversive. Trash
has a negative social connotation and its transportation can present cleanliness issues
(such as with used gum, an apple core, or a dirty wrapper). The disposal of the item may
result in reinforcement through the removal of an aversive condition. These conditions
lead to the use of the existing classroom receptacles ahead of hallway clusters because
they are the most accessible to building occupants consuming food and beverages and
creating paper waste inside classrooms. Issues arise when the type of waste created does
not correspond with the available waste receptacles. At WMU, and most likely in other
similar settings, this occurs regularly because classrooms do not contain
plastic/glass/metal receptacles. When this category of waste is generated inside a
classroom, it is most likely disposed of in the landfill bin located in that classroom
because of its proximity and the lack of a corresponding receptacle. The response cost for
47 appropriately sorting plastic/glass/metal waste from within a classroom is relatively high
because it involves prolonging the possession of waste by passing a classroom landfill
receptacle and taking it to a hallway cluster. When classroom bins are removed and
hallway receptacles represent all waste streams, the response cost for disposing of any
type of waste from within a classroom relatively increases, but the response cost for
accurately sorting decreases substantially. Because all categories of waste are represented
any point waste is discarded, accurate sorting requires no additional effort above simple
disposal.
Additionally, there may be further social influences involved with the correct
disposal of recyclables. Although, these contingencies may not be as strong in some
social communities as in others, as it seems less common for social mediation in the case
of correct recycling behavior over general waste bin usage. Nonetheless, positive and
negative classifications of behavior probably result and may be utilized along with the
covert verbal behavior associated with waste sorting. Recycling behavior may be
established as “good” or “pro-environmental” and landfill as “bad” or “environmentally
irresponsible.” Because of its descriptive landfill vs. recycling labeling system, covert
classification behavior may be stronger in the presence of the signage developed for this
study, meaning that the positive and negative stimuli associated with both may be more
effective in controlling behavior.
48 Future Research
The improvement in sorting behavior on intervention floors speaks to the
effectiveness of the intervention package. However, further research is necessary to fully
explore the effects of the intervention and address the limitations of the research and
analysis presented herein.
Future research should also aim to establish guidelines for the number of bins
necessary to achieve positive effects. Integrated receptacles are costly and in order make
campus-wide recommendations, it is necessary to establish a minimum requirement per
floor, square foot, or based on the number of entrances or exits. This would help to
dictate the most cost-effective strategy for collecting waste streams that are sorted to the
highest possible level of accuracy. It is not currently clear whether or not additional bins
would result in additional positive effects. If this is found to be the case, the placement of
additional integrated receptacles may be warranted.
A detailed cost-benefit analysis is also missing from this investigation. The
integrated receptacles cost $1,500 each. This price is comparable to other mass
manufactured receptacles with multiple openings. However, it is not clear whether or not
the increase in recycling rates warrants the initial costs, especially since WMU pays to
have its recycling removed from campus. An increase in recycling rates may not translate
to any waste handling savings for the university. However, benefits of the integrated
receptacle may be measured in other ways. A reduction of the number of bins in an
academic building most likely translates to labor savings for custodial staff, as entering
every room in an academic building to empty bins is quite time consuming. This time

49 savings needs to be quantified in future research. Additionally, an increasing number of
university rating systems put emphasis on recycling and waste reduction including the
American College & University Presidents’ Climate Commitment, the College
Sustainability Report Card, and the Princeton Review’s Guide to Green Colleges. Good
performance in these reviews can result in important publicity, increased enrollment, and
grant money.
Impacts to the area surrounding the intervention site should also be explored. If
the increased weight of waste on Floors 3 and 4 is found to be attributable to the
restricted number of receptacles on Floors 1 and 2, it can be surmised that if an entire
building transitioned to this system of waste collection, an increase may be found in the
amount of waste in the area surrounding the building. Essentially, the intervention may
shift waste disposal behavior from inside the building to either outdoor receptacles or
adjacent buildings. If appropriate waste receptacles are not present in either of these
locations, an increase in mis-sorted materials may be found in these areas. Similarly, if
over time the integrated receptacles become familiar enough to the campus population, it
is feasible that individuals may seek them out when waste disposal is necessary. In this
case, a reduction in the amount of waste in the areas surrounding the intervention site
may be witnessed along with a possible increase in the accuracy of waste sorting as a
result of the effects of the integrated receptacle.
The current intervention did not attempt to alter the waste disposal system in
staffed offices. Previous research has addressed this area through the addition of desk-
side paper recycling bins (Brothers, Krantz, & McClannahan, 1994); however, no
attempts have been made to test integrated receptacles that include landfill waste or other
50 recyclable materials in office settings. Future research in this setting should integrate the
office waste collection strategy with the strategy used in the building at large.
Future research should also test alternative intervention methods. The intervention
package presented here constitutes multiple antecedent alterations. Prompts were used
inside classrooms and as part of the updated signage. Environmental alteration was also
utilized in the design of the new bins. Other interventions could alternatively test
consequence-based interventions. These could include feedback on the accuracy of waste
sorting behavior and the delivery of consequences based on appropriate behavior. No
known research has attempted to evaluate consequence-based interventions in the context
of public settings. Such analysis may contribute greatly to the effectiveness of
interventions intended to increase the accuracy of waste sorting.
A theoretical consideration of the establishing operations associated with the
accuracy of waste sorting should also be made. Many universities credit the success of
their recycling and waste minimization programs to a campus-wide “culture of
sustainability” (Noack, 2012). However, the elements that create this culture remain to be
explored, as does a viable method for measuring and assessing the components of such a
culture. It is conceivable that the presence of strategic physical structures related to the
sustainability efforts of a university or organization may alter the value of reinforcing
effects associated with engaging in pro-environmental behavior along with the punishing
effects of anti-environmental behavior performed within that context. Physical structures
could highlight and validate a university or organization’s value of the behaviors
associated with that structure. In the case of a recycling program, this could mean that the
presence of unified, aesthetically pleasing receptacles may increase the reinforcing
51 effects arising from correct utilization of the receptacles. Research in this area could help
to dictate future directions for sustainability efforts that when implemented strategically
could increase the rates of pro-environmental behaviors across settings as a result of the
development of a culture of sustainability and subsequent alteration of the relevant
establishing operations.
Conclusion
Recycling and waste reduction efforts are responsible for the recovery of almost
65 million tons of waste per year that were destined for landfill in the United States.
Recycling rates per capita have increased from 10% in 1980 to 34% in 2010 (U.S. EPA,
2010). However, improvements are still to be made. In 2010, 54% of the solid waste
created in United States was discarded in landfills (U.S. EPA, 2010). With increased
emphasis on these efforts, it is likely that recycling research studies will become more
frequent, especially within university settings. The history and development of this line of
research needs to be considered and utilized in the development a research agenda.
Previous research has suggested that placement of receptacles in all possible areas
of waste generation has the greatest impact on waste sorting behavior and results in
increased rates of recycling. However, implementation of this system can prove difficult
for many universities and organizations because it requires additional material resources
along with increased management and maintenance resources. The current findings
revealed that this might not be necessary. Introducing centrally located, integrated
receptacles with detailed signage while also removing extraneous bins may create similar

52 effects. With this system, fewer additional resources are necessary and the management
and maintenance of the system is substantially decreased, making it a viable alternative
and providing a straight-forward tool for universities to utilize as a means for making
progress toward their sustainability goals.
53 REFERENCES
Anderson, N. B., (2000). American Psychologist, 55(5).
Austin, J., Hatfield, D. B., Grindle, A. C., & Bailey, J. S. (1993). Increasing recycling in
office environments: The effects of specific, informative cues. Journal of Applied
Behavior Analysis, 26, 247-253.
Brothers, K. J., Krantz, P. J., & McClannahan, L. E. (1994). Office paper recycling: A
function of container proximity. Journal of Applied Behavior Analysis, 27, 153-
160.
Catton, W. J., & Dunlap, R. (1978). Environmental sociology: A new paradigm. The
American Sociologist, 13, 41-49.
Duffy, S. & Verges, M. (2009). It matters a hole lot: Perceptual affordances of waste
containers influence recycling compliance. Environment & Behavior, 41, 741-
749. doi: 10.1177/0013916508323737
Dunlap, R. E., & Mertig, A. G. (1983). Human values and pro-environmental behavior.
In W. D. Conn (Ed.), Energy and Material Resources: Attitudes, Values, and
Public Policy (pp. 145-168). Boulder, CO: Westview Press.
Dwyer, W. O., Leeming, F. C., Cobern, M. K., Porter, B. E., Jackson, J. M. (1993).
Critical review of behavioral interventions to preserve the environment: Research
since 1980. Environment & Behavior, 25(5), 275-321. doi:
10.117/0013916592355001
Geller, E. S., Brasted, W., & Mann, M. (1980). Waste receptacle designs as interventions
for litter control. Journal of Applied Behavior Analysis, 6, 145-160.
54 Geller, E. S., Winett, R. A., Everett, P. B. (1982). Preserving the environment: New
strategies for behavior change. New York, NY: Pergamon Press.
Glasser, H. (2007). Minding the gap: The role of social learning in linking our stated
desire for a more sustainable world to our everyday actions and policies. In A.E.
J. Wals (Eds.), Social Learning: Toward a More Sustainable World (35-61).
Wageningen Academic Publishers: Wageningen, The Netherlands.
Grant, L. K. (2011). Can we consumer our way out of climate change? A call for
analysis. The Behavior Analyst, 34(2), 245-266.
Heward, W. L. & Chance, P. (Guest Eds.). (2010). Special section: The human response
to climate change: Ideas from behavior analysis. The Behavior Analyst, 33, 145-
206.
Jacobs, H. E., Bailey, J. S., & Crews, J. I. (1984). Development and analysis of a
community-based resource recovery program. Journal of Applied Behavior
Analysis, 17, 127-145.
Jones, R. E., & Dunlap, R. E. (1992). The social bases of environmental concern: Have
they changed over time? Rural Sociology, 57, 28-47.
Judge, R. & Becker, A. (1993). Motivating recycling: A marginal cost analysis.
Contemporary Economic Policy, 11(3), 58-68.
Kollmuss, A., & Agyeman, J. (2002). Mind the gap: Why do people act
environmentally and what are the barriers to pro-environmental
behavior? Environmental Education Research, 8(3), 239-260.
Lehman, P. K., Geller, E. S. (2004). Behavior analysis and environmental protection:
Accomplishments and potential for more. Behavior and Social Issues, 13, 12-32.
55 Leiserowitz, A. A. (2006). Sustainability values, attitudes, and behaviors: A review of
multinational and global trends. Annual Review of Environment and Resources,
31, 413-444.
Leiserowitz, A., Kates, R. W., & Parris, T. M. (2005). Do global attitudes and behaviors
support sustainable development? Environment, 24(9), 22-38.
Lounsbury, J. W., & Tornatzky, L. G. (1977). A scale for assessing attitudes toward
environmental quality. Journal of Social Psychology, 101, 299-305.
Ludwig, T. D., Gray, T. W., & Rowell, A. (1998). Increasing recycling in academic
buildings: A systematic replication. Journal of Applied Behavior Analysis, 31,
683-686.
Maloney, M. P., Ward, M. P., & Braucht, N. G. (1975). A revised scale for the
measurement of ecological attitudes and knowledge. American Psychologist, 30,
787-790.
Noack, C. (2012). Assessment of best practices on solid waste management at
universities receiving a grade “A” from SEI green report card 2011. Paper
presentation at the 2012 Ball State University Greening of the Campus IX:
Building Pedagogy, Muncie, IN.
O’Conner, R. T., Lerman, D. C., Fritz, J. N., & Hodde, H, B. (2010). Effects of number
and location on plastic recycling at a university. Journal of Applied Behavior
Analysis, 43, 711-715.
Oskamp, S. (2000). A sustainable future for humanity? How can psychology help?
American Psychologist, 55(5), 496-508. doi: 10.1037/0003-066X.55.5.496
56
Porter, B. E., Leeming, F. C., Dwyer, W. O. (1995). Solid waste recovery: A review of
behavioral programs to increase recycling. Environment & Behavior, 27(2), 122-
152. doi: 10.1177/0013916595272002
United States Environmental Protection Agency (2010). Municipal solid waste
generation, recycling and disposal in the United States: Facts and figures for
2010. Retrieved from
http://www.epa.gov/osw/nonhaz/municipal/pubs/msw_2010_rev_factsheet.pdf
Werner, C. M., Rhodes, M. U., & Partain, K. K. (1998). Designing effective instructional
signs with schema theory: Case studies of polystyrene recycling. Environment
and Behavior, 30, 709-735. doi: 10.1177/001391659803000506

57
Appendix A
Brown Hall Floor Plans
58
FLOOR 1 Baseline
= Landfill Receptacle
= Paper Recycling Receptacle = Plastic/Metal/Glass Recycling Receptacle = Comprehensive Receptacle
59
FLOOR 1 Intervention = Landfill
Receptacle
= Paper Recycling Receptacle = Plastic/Metal/Glass Recycling Receptacle = Comprehensive Receptacle

60 Intervention
Floor
Second Receptacle
FLOOR 2 Baseline = Landfill Receptacle
= Paper Recycling Receptacle = Plastic/Metal/Glass Recycling Receptacle = Comprehensive Receptacle
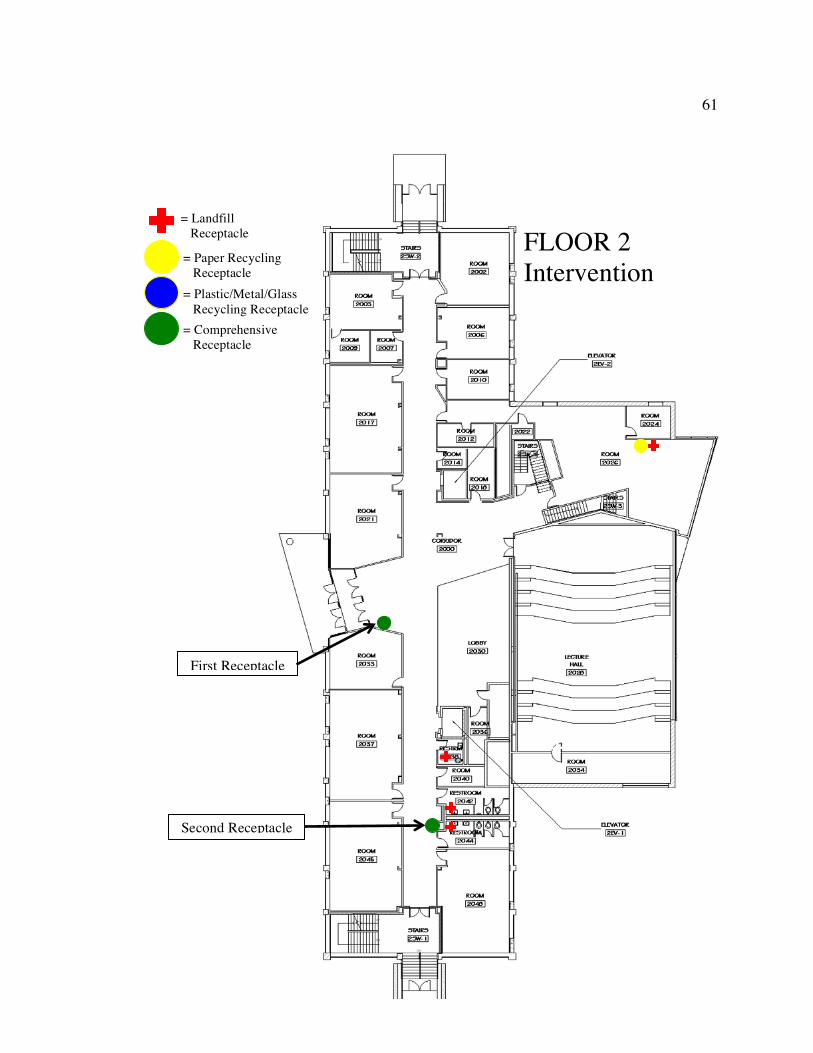
61
FLOOR 3 Baseline and Intervention FLOOR 2
Intervention
= Landfill Receptacle
= Paper Recycling Receptacle = Plastic/Metal/Glass Recycling Receptacle = Comprehensive Receptacle
First Receptacle
Second Receptacle
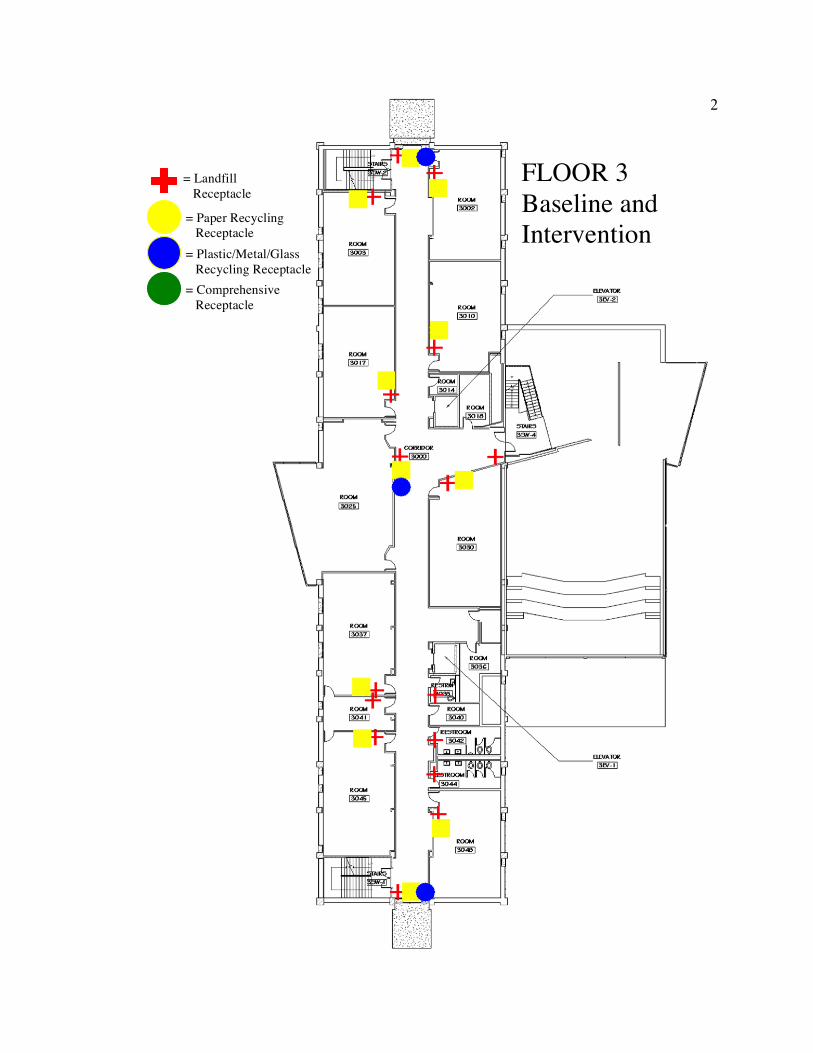
62
= Landfill Receptacle
= Paper Recycling Receptacle = Plastic/Metal/Glass Recycling Receptacle = Comprehensive Receptacle
FLOOR 3 Baseline and Intervention
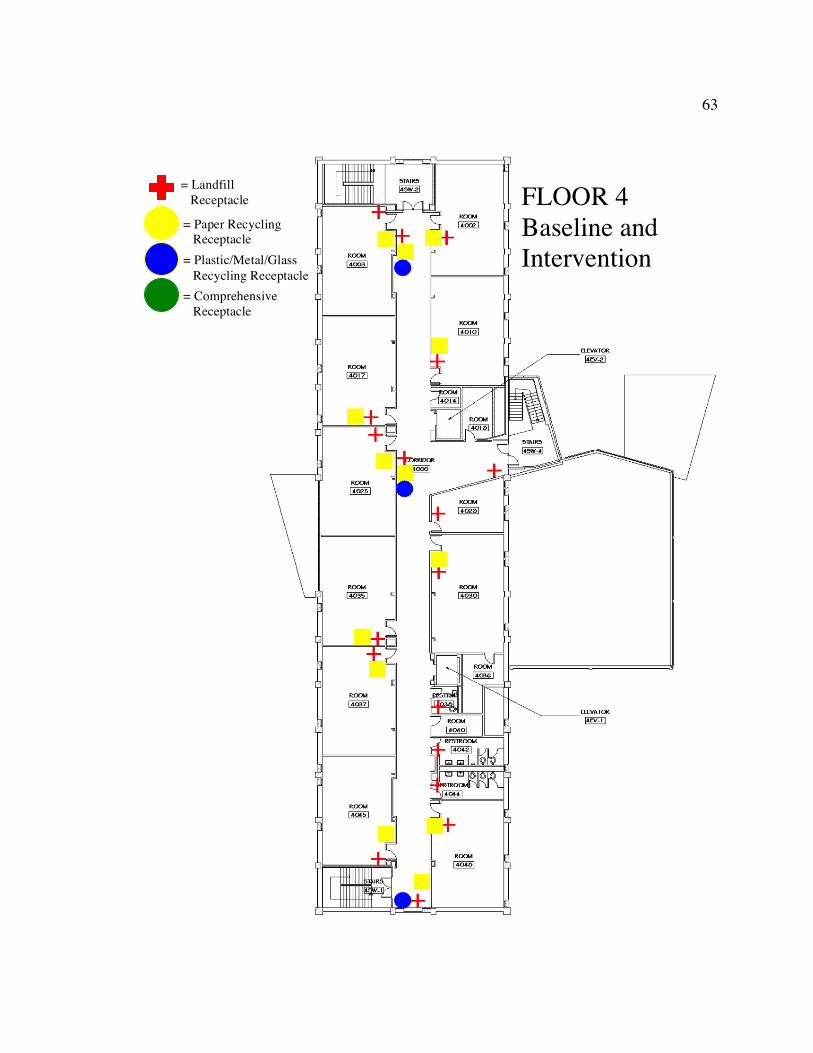
63
FLOOR 4 Baseline and Intervention
= Landfill Receptacle
= Paper Recycling Receptacle = Plastic/Metal/Glass Recycling Receptacle = Comprehensive Receptacle

64
Appendix B
Intervention Package Design
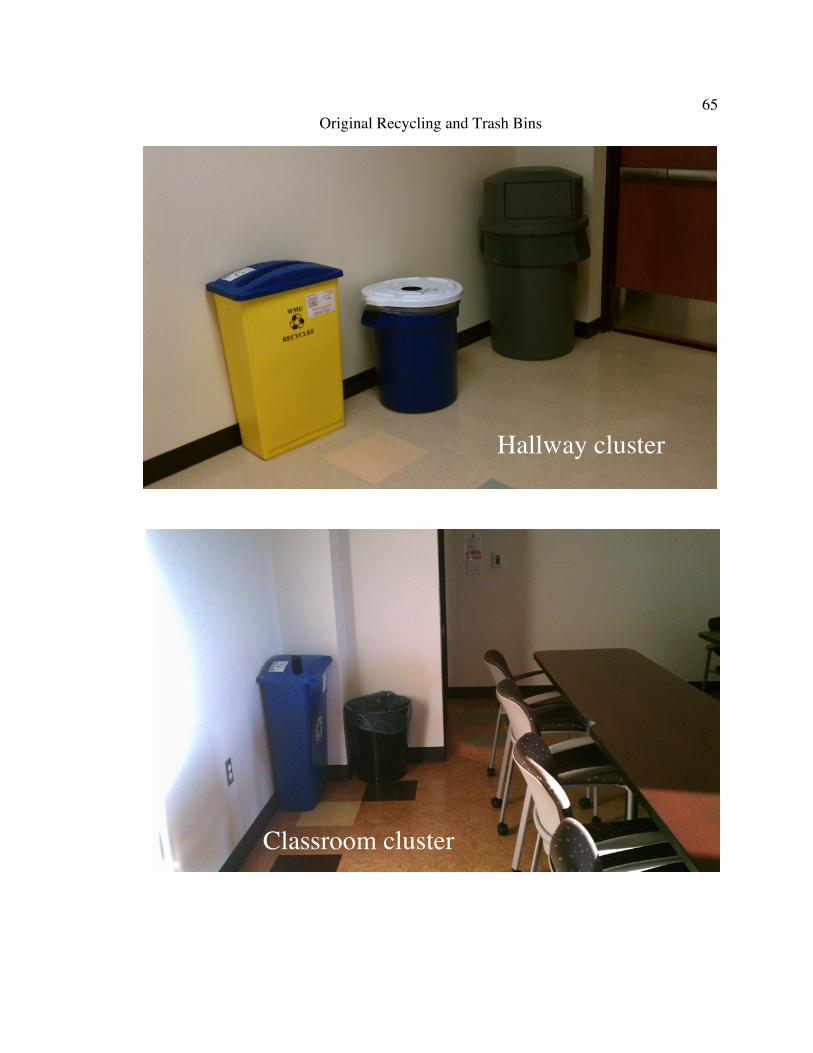
65 Original Recycling and Trash Bins
Hallway cluster
Classroom cluster
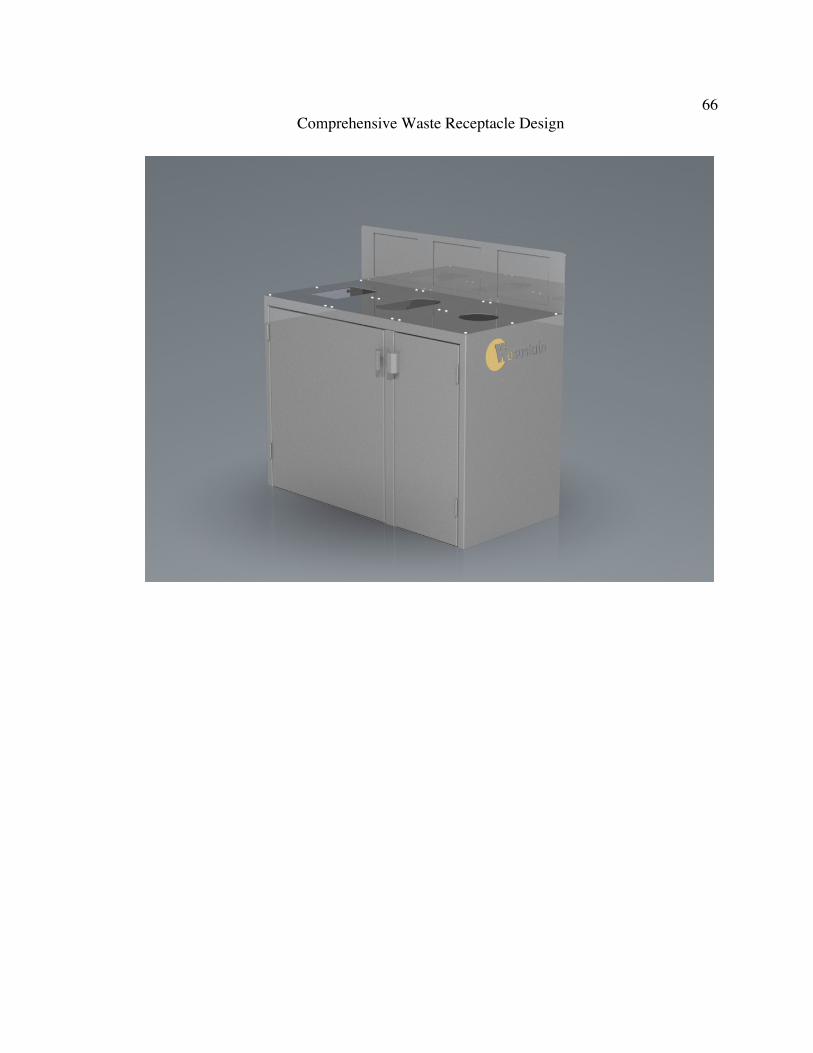
66 Comprehensive Waste Receptacle Design
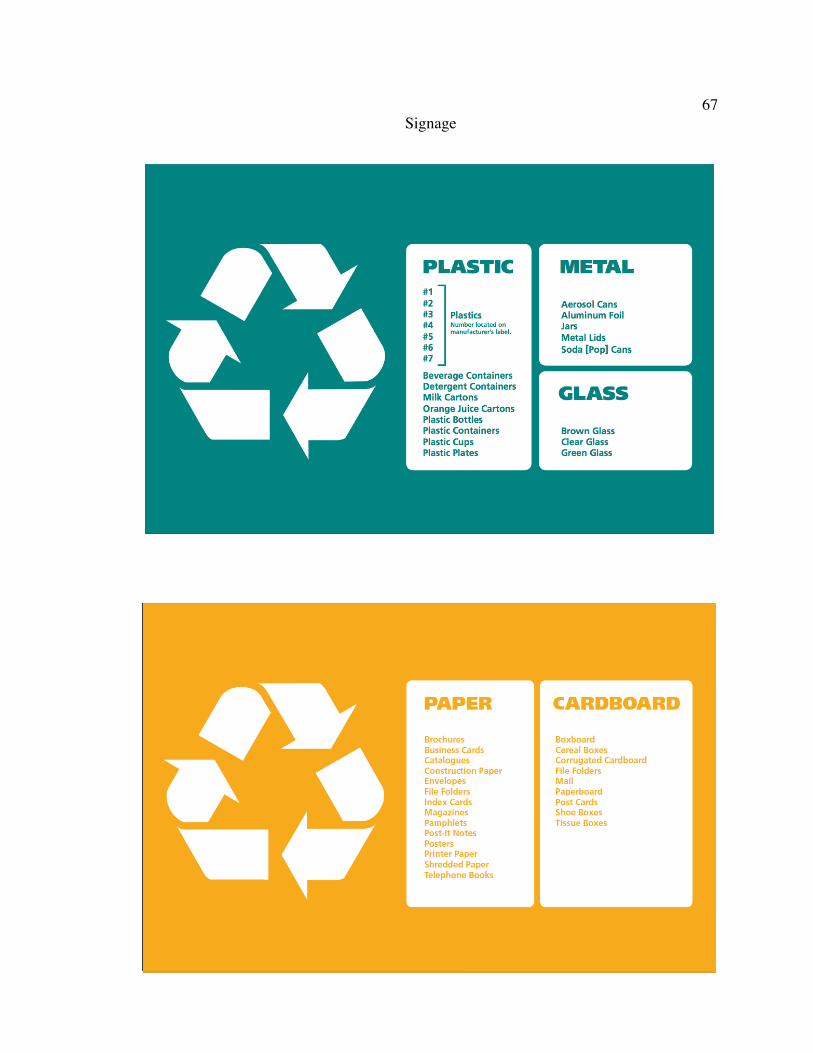
67 Signage
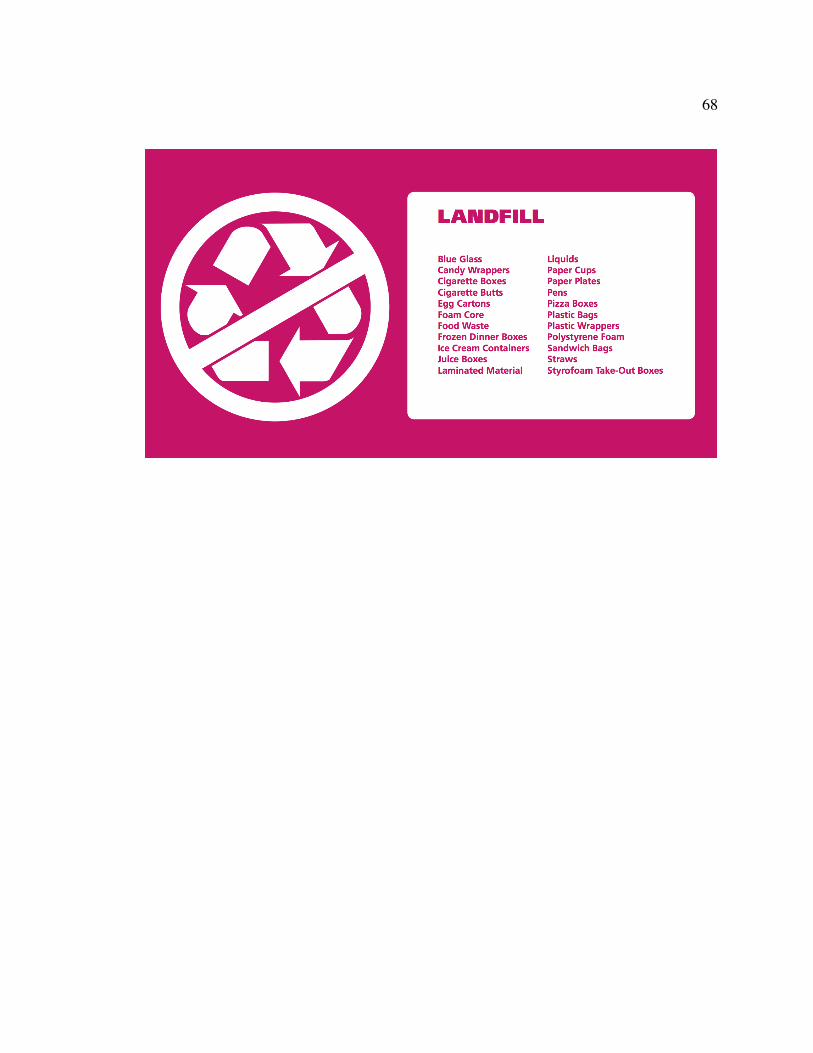
68
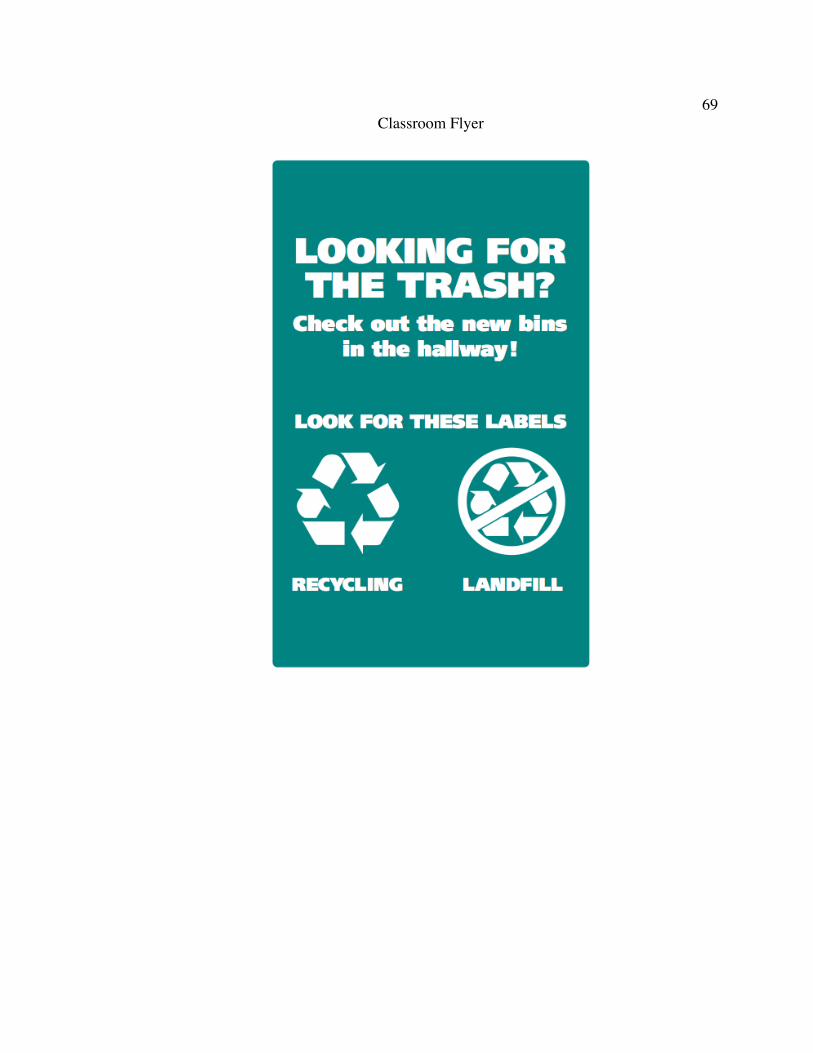
69 Classroom Flyer

70
Appendix C
WMU Recycling Guide
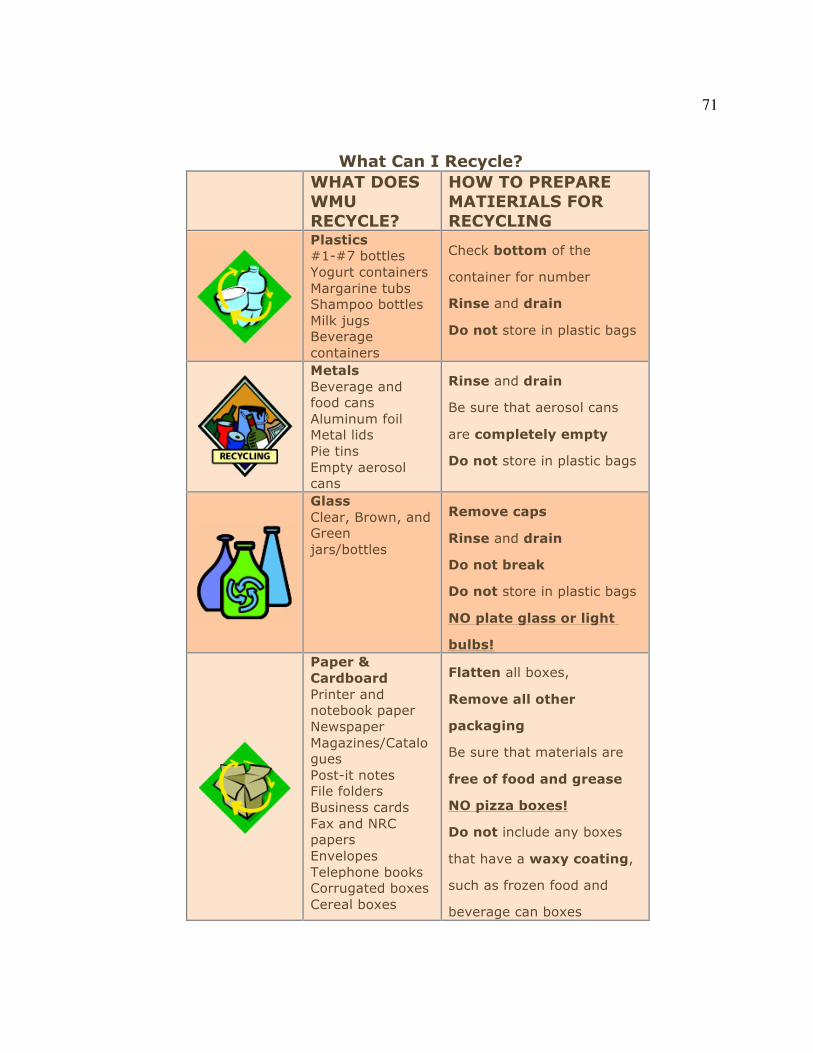
71
What Can I Recycle?
WHAT DOES WMU RECYCLE?
HOW TO PREPARE MATIERIALS FOR RECYCLING
Plastics #1-#7 bottles Yogurt containers Margarine tubs Shampoo bottles Milk jugs Beverage containers
Check bottom of the
container for number
Rinse and drain
Do not store in plastic bags
Metals Beverage and food cans Aluminum foil Metal lids Pie tins Empty aerosol cans
Rinse and drain
Be sure that aerosol cans
are completely empty
Do not store in plastic bags
Glass Clear, Brown, and Green jars/bottles
Remove caps
Rinse and drain
Do not break
Do not store in plastic bags
NO plate glass or light
bulbs!
Paper & Cardboard Printer and notebook paper Newspaper Magazines/Catalogues Post-it notes File folders Business cards Fax and NRC papers Envelopes Telephone books Corrugated boxes Cereal boxes
Flatten all boxes,
Remove all other
packaging
Be sure that materials are
free of food and grease
NO pizza boxes!
Do not include any boxes
that have a waxy coating,
such as frozen food and
beverage can boxes
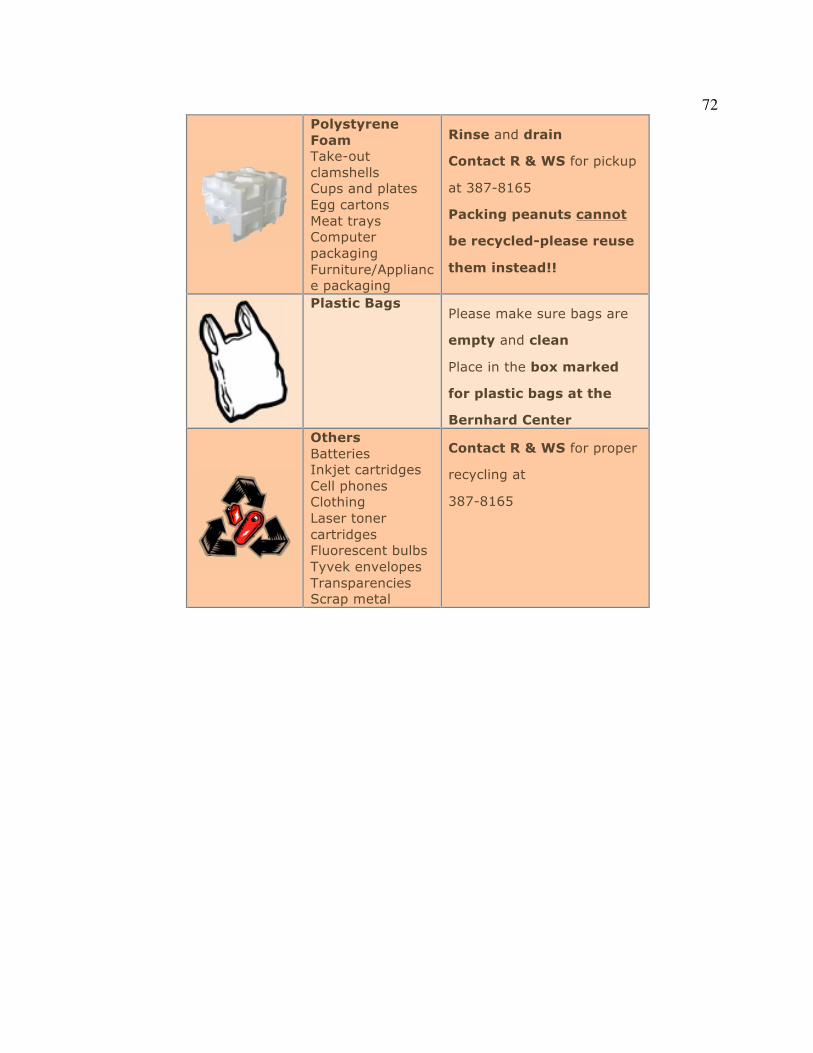
72
Polystyrene Foam Take-out clamshells Cups and plates Egg cartons Meat trays Computer packaging Furniture/Appliance packaging
Rinse and drain
Contact R & WS for pickup
at 387-8165
Packing peanuts cannot
be recycled-please reuse
them instead!!
Plastic Bags Please make sure bags are
empty and clean
Place in the box marked
for plastic bags at the
Bernhard Center
Others Batteries Inkjet cartridges Cell phones Clothing Laser toner cartridges Fluorescent bulbs Tyvek envelopes Transparencies Scrap metal
Contact R & WS for proper
recycling at
387-8165
73
Appendix D
Data Collection Protocol
74 General Procedures Every weekday morning: Data collectors will first collect and weigh recycling from throughout the building. They will then process the trash waste from the previous day. The trash will be left on the loading dock by custodial staff. Data collectors will process it by sorting misplaced recycling out of the trash. The sorted recycling and trash will then be weighed separately and placed into appropriate dumpsters. Once per week: Data collectors will sample a classroom or lecture hall specified by the researcher. They will collect and weigh any waste left in the room following the Classroom Sample Protocol. Once per week: Data collectors will perform the Interobserver Agreement Protocol. Before handling waste
-‐ Bandage all cuts and scrapes on hands and arms, even on areas that will be covered by gloves
After handling waste -‐ Wipe down leather gloves with disinfectant wipes -‐ Wash hands thoroughly
Dress code While participating in any aspect of data collection, data collectors must, AT ALL TIMES, follow the dress code:
-‐ Leather gloves, provided by the researcher -‐ Closed-‐toed shoes -‐ Long pants -‐ Long sleeves
Daily Protocol Handling waste bags
-‐ Never load a bag or bin to the point where it is too heavy for you to carry -‐ If it is necessary to lift a bag of waste out of a bin or brute barrel, tip the
barrel on its side and draw out the bag slowly to avoid creating a vacuum, making the bag extremely hard to lift and risking injury.
-‐ While carrying waste bags, hold them away from your body and do not let them rub against your legs. This may require you to only carry one bag at a time in order to have enough strength to hold it away from your body.
Recycling Collection
-‐ Take recycling cart from loading dock and collect recycling from each floor -‐ Place paper recycling into one bin on the cart and plastic/glass/aluminum in
the other -‐ Empty paper bins by overturning the classroom or hallway bin into the
collection bin. Empty the Aluminum/Plastic/Glass bins by removing the lid
75 and remove items individually. If the bin’s bag is over half full, remove the entire bag and place into collection bin.
-‐ Bring all recycling to the loading dock on the cart. If there is too much to fit on the cart, make two trips. Do not carry it.
-‐ Weigh and record the recycling following the Weighing protocol below. -‐ Be aware of dangerous items (listed below) and if one is found, stop
collection immediately and notify the data collection supervisor.
Trash Sorting -‐ Spread out the plastic sheet on the loading dock floor -‐ Each data collector will sort one bag of trash at a time on the plastic sheet. If
there are smaller bags inside the large bag, take one out at a time and sort them next to the large bag.
-‐ Before sorting, open the bag up as widely as possible by pulling outward on the upper edges. Cut a 10-‐12-‐inch slit down the side of the large bags in order to open them wider. Cut a 5-‐inch slit into smaller bags if necessary.
-‐ Pull out visible recycling items and place them into separate plastic bags (one for paper/cardboard, one for aluminum/plastic/glass). Leave trash in the original bag.
-‐ Move trash inside the bag to uncover recycling items only by using a push stick and never your hand.
-‐ Remember to only touch items that are fully visible. -‐ Do not allow fingers or hands to reach around a recyclable item where a
syringe or sharp object might be concealed. -‐ Be aware of dangerous items (listed below) and if one is found, stop
collection immediately and notify the data collection supervisor. -‐ Trash bags and sorted recycling bags must be weighed and recorded
separately after sorting is complete and liquids emptied, reference the Emptying Liquids and Weighing/Disposing protocol below.
Emptying Liquids -‐ Some recyclable containers that are found in the trash will have liquids in
them (soda cans, coffee cups, Gatorade bottles, etc). Use the first large container found as the liquid reservoir and empty all other liquids into it.
-‐ Empty liquids slowly and from a close proximity so they do not splash. -‐ Once data collection is complete for that day, empty the reservoir container
into a toilet in the 1st floor restroom. Pour slowly to avoid splashing. If splashes do occur, wipe up with a disinfectant wipe.
Dangerous Items -‐ If potentially dangerous items are discovered, do not touch it and
immediately stop sorting that waste bag. Report the item to the researcher or data collection supervisor. They will take the proper action for handling and disposal.
76 -‐ If you come in contact with a potentially harmful powdery or liquid
substance, go immediately to the nearest restroom and wash thoroughly with soap and water. Notify the data collection supervisor after substance has been washed off.
-‐ If you become cut, scraped, or require other medical attention, notify the data collection supervisor immediately. A first aid kit will be located on the loading dock.
-‐ Dangerous items can include: o Broken glass o Needles
§ Plastic liquid laundry containers and pop cans may sometimes be used for diabetic needle disposal
o Empty containers for toxic, flammable, or otherwise harmful materials including cleaning agents, aerosol cans, etc.
o Bandages, Kleenex, or other item containing blood or other bodily fluid
o Toner cartridges or any powdery substance that could possibly be inhaled. If cartridge is intact, set it aside and continue sorting the bag. It will be processed as recycling.
o Bottles that appear to be expanding, under pressure, or contain anything unusual
Weighing -‐ All items need to be weighed after collection/sorting. -‐ Landfill waste should be weighed in bags. Recycling that is collected in bins
should be weighed in the bins. Recycling that is sorted out of the trash may be weighed in it’s new bag.
-‐ Always weigh one bag or bin of waste at a time by placing it gently on the scale.
Depositing -‐ Once bags are weighed and recorded, they may be deposited into the
appropriate dumpster. Do not attempt to open dumpster lids while carrying waste bags. Either set the bags down first or open dumpster lids before carrying waste bags outside.
-‐ When depositing bags, hold them over the open dumpster and drop them. Do not toss them from any distance.
Classroom Sample Protocol
-‐ One classroom or lecture hall per week will be sampled. The room will be designated by the researcher.
77 -‐ Use the recycling cart and one rolling trashcan (with a trash bag in it) from
the loading dock. Collect all waste discarded in the classroom. -‐ Remember to wear gloves! -‐ Sort the waste into landfill, paper/cardboard, and aluminum/plastic/glass
bins while collecting. -‐ Weigh and record classroom sample waste separately from all other waste
before depositing it into the appropriate dumpster.
Interobserver Agreement Protocol -‐ When prompted by the researcher during one data collection session per
week, data collectors will perform the Interobserver Agreement Protocol. -‐ The researcher will select one bag of waste to test and one data collector will
sort and weigh it according the above protocol while a second data collector is out of sight.
-‐ Also out of sight of the second data collector, the researcher will then mix the recycling back into the trash bag by setting the recycling items into the trash bag and using a push stick to mix them in.
-‐ The second data collector will then re-‐sort and weigh the same bag of waste. -‐ The waste can then be deposited into the appropriate dumpsters.
Waiver of Liability for
Western Michigan University Graduate Student Research Protocol
I have read and understand the Data Collection Protocol. I understand that there are risks associated with the collection and sorting of waste and agree to follow the protocol in order to minimize my risk. I further agree to release, hold harmless and indemnify researcher, Katherine Binder, Western Michigan University, and/or any of its Departments and affiliates from any suits, claims and damages of every kind and nature which may arise relating to this graduate student research protocol. Signature Date
78
Appendix E
Weight Trend Line Analysis

79
Floor
Expected increase weighted by total
mass per floor
Increase dictated by trend line
Increase as a percent of
expected
Expected decrease weighted by total
mass per floor
Decrease dictated by trend line
Decrease as a percent of
expected
Expected increase weighted by total
mass per floor
Increase dictated by trend line
Increase as a percent of
expected1 4.35 4 92% 1.92 -3 -156% 5.62 0.50 9%2 6.44 8.5 132% 2.94 9 306% 7.85 1.50 19%3 10.33 6.5 63% 3.02 0.05 17% 6.25 11 176%4 7.88 8.2 104% 2.52 2 79% 4.78 12 251%
Average 7.25 6.8 98% 2.6 2 61% 6.13 6.25 114%
Baseline Intervention Baseline and InterventionMass Trend Line Analysis
80
Appendix F
Answers to Open Ended Survey Questions
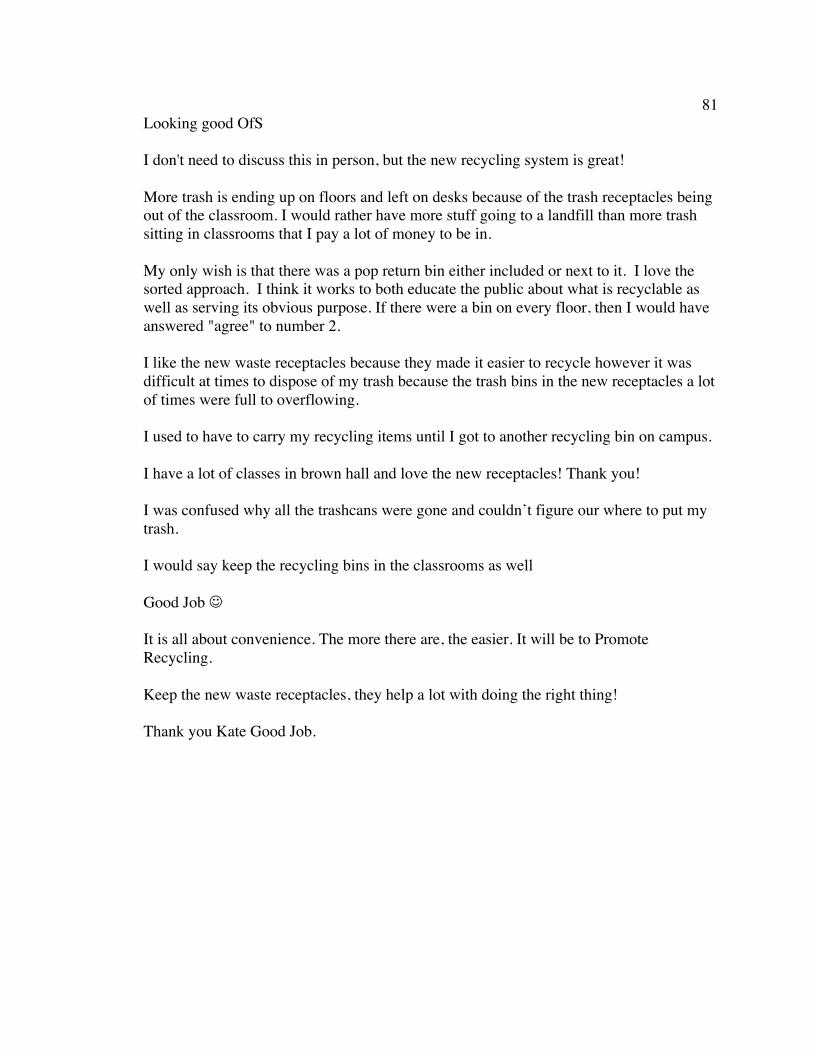
81 Looking good OfS I don't need to discuss this in person, but the new recycling system is great! More trash is ending up on floors and left on desks because of the trash receptacles being out of the classroom. I would rather have more stuff going to a landfill than more trash sitting in classrooms that I pay a lot of money to be in. My only wish is that there was a pop return bin either included or next to it. I love the sorted approach. I think it works to both educate the public about what is recyclable as well as serving its obvious purpose. If there were a bin on every floor, then I would have answered "agree" to number 2. I like the new waste receptacles because they made it easier to recycle however it was difficult at times to dispose of my trash because the trash bins in the new receptacles a lot of times were full to overflowing. I used to have to carry my recycling items until I got to another recycling bin on campus. I have a lot of classes in brown hall and love the new receptacles! Thank you! I was confused why all the trashcans were gone and couldn’t figure our where to put my trash. I would say keep the recycling bins in the classrooms as well Good Job J It is all about convenience. The more there are, the easier. It will be to Promote Recycling. Keep the new waste receptacles, they help a lot with doing the right thing! Thank you Kate Good Job.
82
Appendix G
Satisfaction Survey
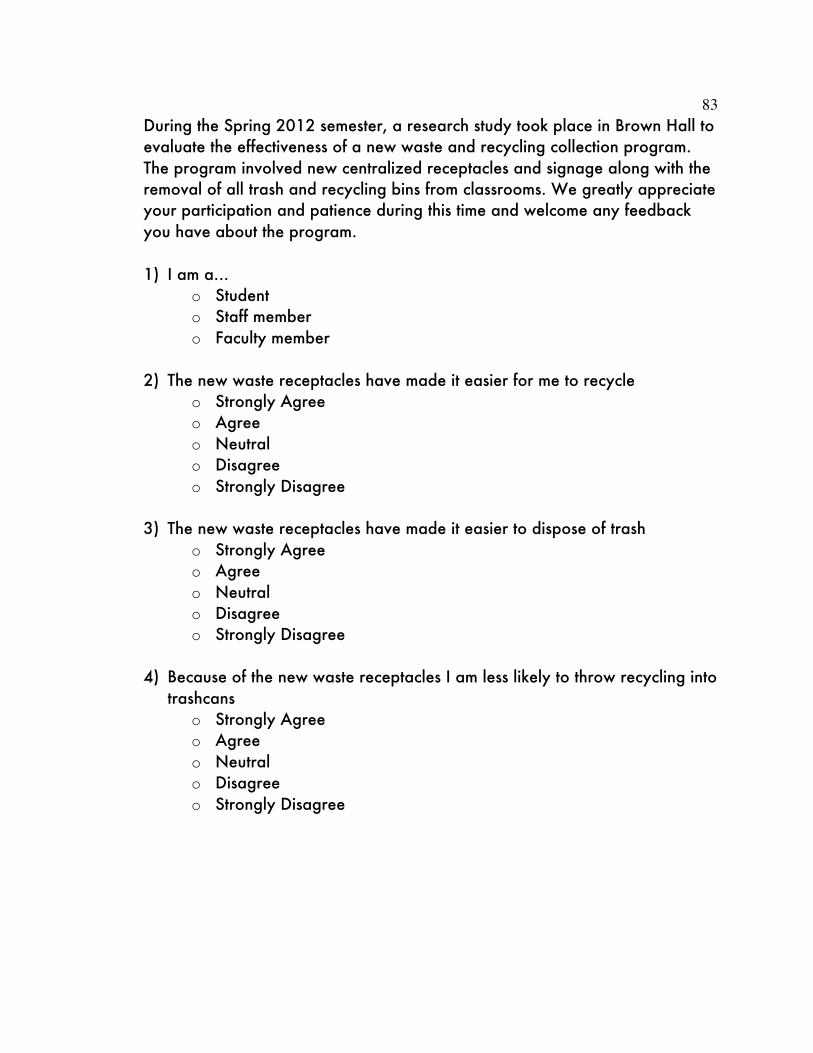
83 During the Spring 2012 semester, a research study took place in Brown Hall to evaluate the effectiveness of a new waste and recycling collection program. The program involved new centralized receptacles and signage along with the removal of all trash and recycling bins from classrooms. We greatly appreciate your participation and patience during this time and welcome any feedback you have about the program. 1) I am a…
o Student o Staff member o Faculty member
2) The new waste receptacles have made it easier for me to recycle
o Strongly Agree o Agree o Neutral o Disagree o Strongly Disagree
3) The new waste receptacles have made it easier to dispose of trash
o Strongly Agree o Agree o Neutral o Disagree o Strongly Disagree
4) Because of the new waste receptacles I am less likely to throw recycling into
trashcans o Strongly Agree o Agree o Neutral o Disagree o Strongly Disagree
84 5) Because of the new waste receptacles I am more likely to leave litter in
classrooms or other work areas o Strongly Agree o Agree o Neutral o Disagree o Strongly Disagree
6) I like the new waste receptacles in Brown Hall
o Strongly Agree o Agree o Neutral o Disagree o Strongly Disagree
7) OPTIONAL: additional comments
For more information about this research please contact: Kate Binder Graduate Assistant WMU Office for Sustainability [email protected]

85
Appendix H
HSIRB Approval Letter
86 Date: March 18, 2011 To: Kate Binder, Student Investigator From: Amy Naugle, Ph.D., Chair Re: Approval not needed This letter will serve as confirmation that your project “WMU’s Brown Hall: Testing the Effectiveness of a Newly Designed Comprehensive Trash/Recycling Bin” has been reviewed by the Human Subjects Institutional Review Board (HSIRB). Based on that review, the HSIRB has determined that approval is not required for you to conduct this project because you will be analyzing trash and you are not collecting personal information about individuals. Thank you for your concerns about protecting the rights and welfare of human subjects. A copy of your protocol and a copy of this letter will be maintained in the HSIRB files.
Recommended


![Preparation and characterization of very highly dispersed ... · pient wetness method resulted in well dispersed alumina-supported systems [16] but less well dispersed silica-supported](https://img.pdfslide.us/doc/110x75/5edc8590ad6a402d666736ef/preparation-and-characterization-of-very-highly-dispersed-pient-wetness-method.jpg)