The Digital Roll-out in Europe
by Elisabetta Brunella, by Elisabetta Brunella,
Secretary General, MEDIA SallesSecretary General, MEDIA Salles
DGT 2011DGT 2011
Helsinki - Tallinn Helsinki - Tallinn
PromotionInformation
Training

PromotionInformation
Training
Worldwide digitisation:
digital screens increasing everywhereas at 01 January of each year
2006 2007 2008 2009 2010 2011
Africa + Middle East AF 1 3 3 27 75 300
Asia and Pacific AS 207 354 786 1,458 3,469 8,000
Europe EU 205 527 897 1,535 4,684 10,346
Latin America LA 16 21 26 48 485 1,600
North America NA 173 1,957 4,576 5,660 8,854 15,000
TOTAL 602 2,862 6,288 8,728 17,567 35,246

PromotionInformation
Training
Focus on Europe:
Digital cinema sites and screensas at 01 January of each year
2004 2005 2006 2007 2008 2009 2010 2011
Digital screens 30 55 205
527 897 1,535 4,684 10,346
Digital sites 27 45 149
358 550 821 2,366 4,120
Degree of penetration as at 01 Jan 2011
Screens 29% - Sites 33%
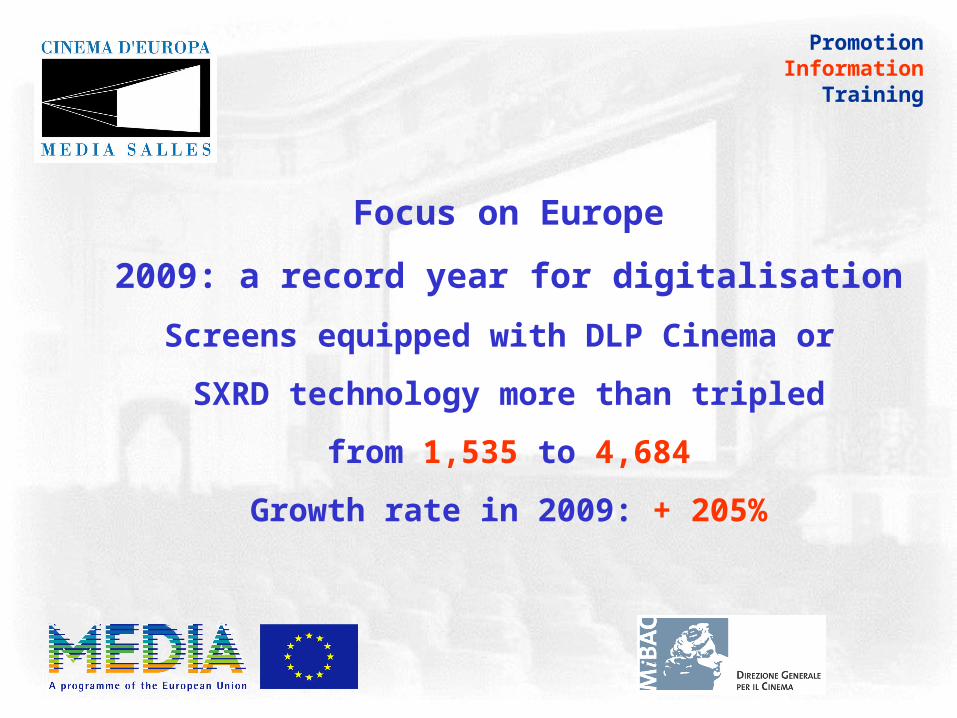
Focus on Europe
2009: a record year for digitalisation
Screens equipped with DLP Cinema or
SXRD technology more than tripled
from 1,535 to 4,684
Growth rate in 2009: + 205%
PromotionInformation
Training

PromotionInformation
Training
Digital cinema sites and screens in Europe (2004-2010)
0
500
1000
1500
2000
2500
3000
3500
4000
4500
5000
2004 2005 2006 2007 2008 2009 2010
Digital screens Digital sites

PromotionInformation
Training
Focus on Europe:
2009 changed the “geography” of digital cinemas
% of total digital screens: France became the leading market
% of digital screens in Europe January 2008 January 2010 June 2010
United Kingdom 32% 14% 15%
France 7% 20% 19%

PromotionInformation
Training
Focus on Europe:Digital cinema sites and screens
Growth continued in 2010
Jan2010
Jan2011
%variation
Digital screens 4,684 10,346 +121%
Digital sites 2,366 4,120 +74%

PromotionInformation
TrainingThe Development of Digital Screens
Half-year trend in the number of digital screens in Western Europe
0
200
400
600
800
1000
1200
1400
Jun-05 Jan-06 Jun-06 Jan-07 Jun-07 Jan-08 Jun-08 Jan-09 Jun-09 Jan-10 Jun-10
Nu
mb
er
of
dig
ita
l s
cre
en
s
F
UK
D
I
E
A
B
PromotionInformation
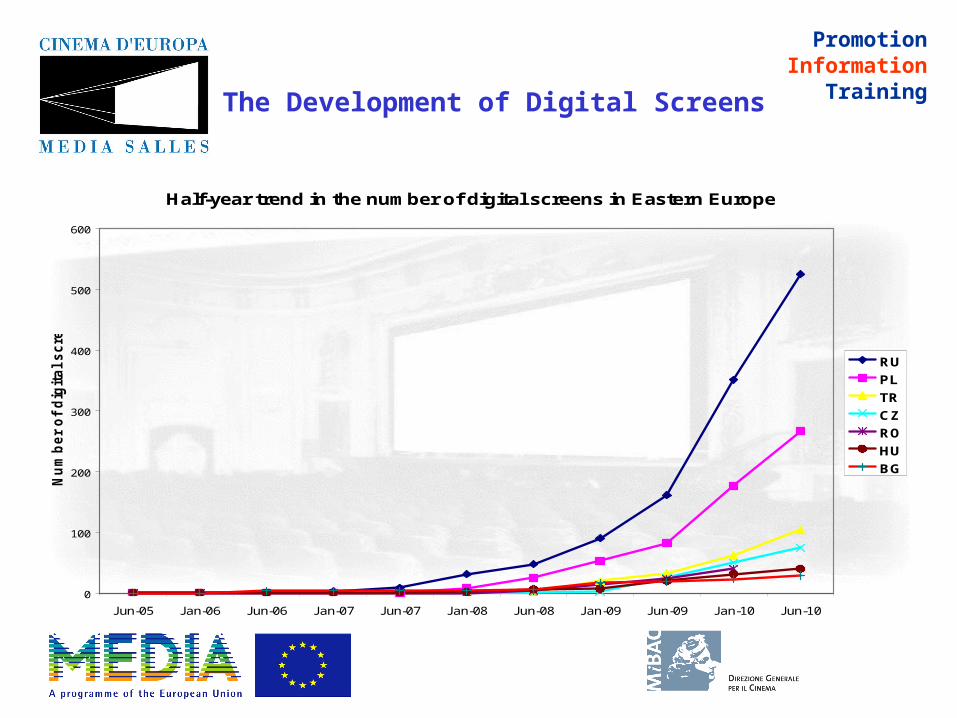
TrainingThe Development of Digital Screens
Half-year trend in the number of digital screens in Eastern Europe
0
100
200
300
400
500
600
Jun-05 Jan-06 Jun-06 Jan-07 Jun-07 Jan-08 Jun-08 Jan-09 Jun-09 Jan-10 Jun-10
Nu
mb
er
of
dig
ita
l s
cre
en
s
RU
PL
TR
CZ
RO
HU
BG

PromotionInformation
Training
Country 01 January 2010 01 January 201101 January 2011 – 3D
%
D566 1,248 89.8%
E252 758 77.3%
F904 1,887 74.5%
I
434 912 92.3%
RU
351 941 99.6%
UK667 1,408 77.9%
Total 3,174 7,154
PromotionInformation
Training
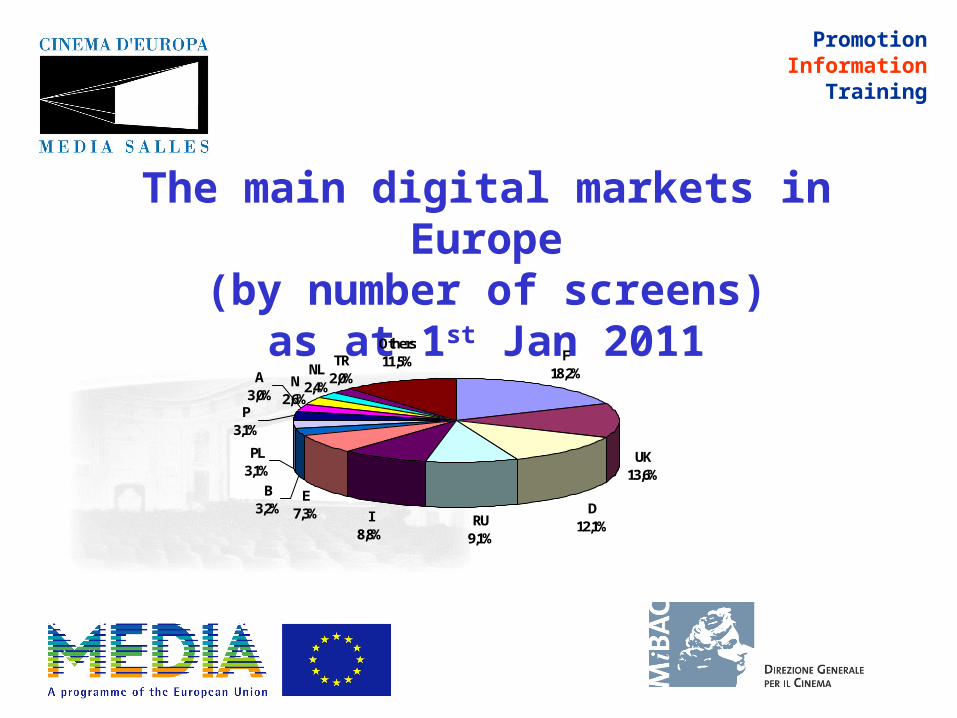
The main digital markets in Europe(by number of screens)
as at 1st Jan 2011F
18,2%
UK13,6%
D12,1%RU
9,1%
I8,8%
E7,3%
N2,6%
B3,2%
PL3,1%
A3,0%P
3,1%
NL2,4%
TR2,0%
Others11,5%
PromotionInformation
Training
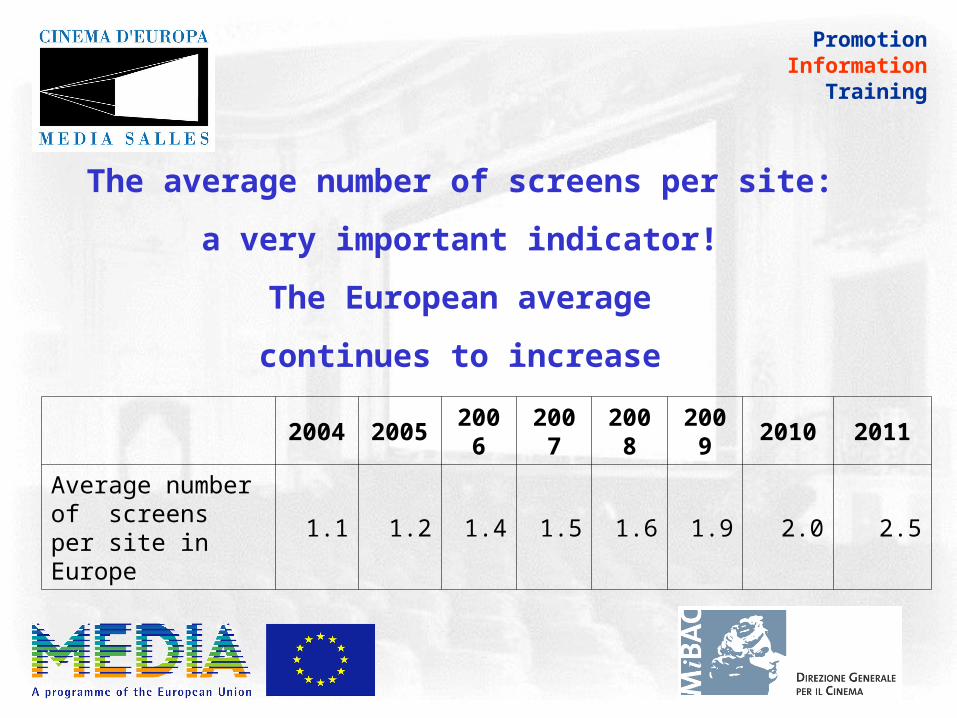
The average number of screens per site:
a very important indicator!
The European average
continues to increase
2004 2005 2006 2007 2008 2009 2010 2011
Average number of screens per site in Europe
1.1 1.2 1.4 1.5 1.6 1.9 2.0 2.5

PromotionInformation
TrainingAverage no. of screens per site
as at 1st Jan 2011
4,31
6,82
3,35
1,48
2,50
1,41
2,20
1,77
2,61
3,50
3,54
1,52
1,51
1,29
2,15
1,92
2,68
2,00
4,80
1,86
3,67
2,33
2,58
2,55
4,80
3,06
3,59
1,40
1,78
1,45
1,45
2,25
1,74
3,06
0 1 2 3 4 5 6 7 8
A
B
BG
CH
CY
CZ
D
DK
E
EE
F
FIN
GR
HR
HU
I
IRL
IS
L
LT
LV
MT
N
NL
P
PL
RO
RS
RU
S
SI
SK
TR
UK
European Average (2,51)

PromotionInformation
Training
Average number of screens per site:
a very important indicator!
In 2010 in some countries it decreased to raise again in 2011:
2008 2009 2010 2011
Belgium 4.8 5.8 5.3 6.8
Ireland 3.0 4.2 2.5 2.7

PromotionInformation
Training
Why has the average number of digital screens per site started to decrease?
The 3D effect:
if digital projectors are used to show 3D movies only, not all the screens in a cinema need to be
digitally equipped.

PromotionInformation
Training
The boom of 3D screens: 8,409at 1st Jan 2011
3D screens
Total digital screens
% of penetration of digital screens
30 June 2009 1,408 2,602 54%
01 January 2010 3,4674,684
74%
01 January 2011 8,409 10,346 81%
PromotionInformation
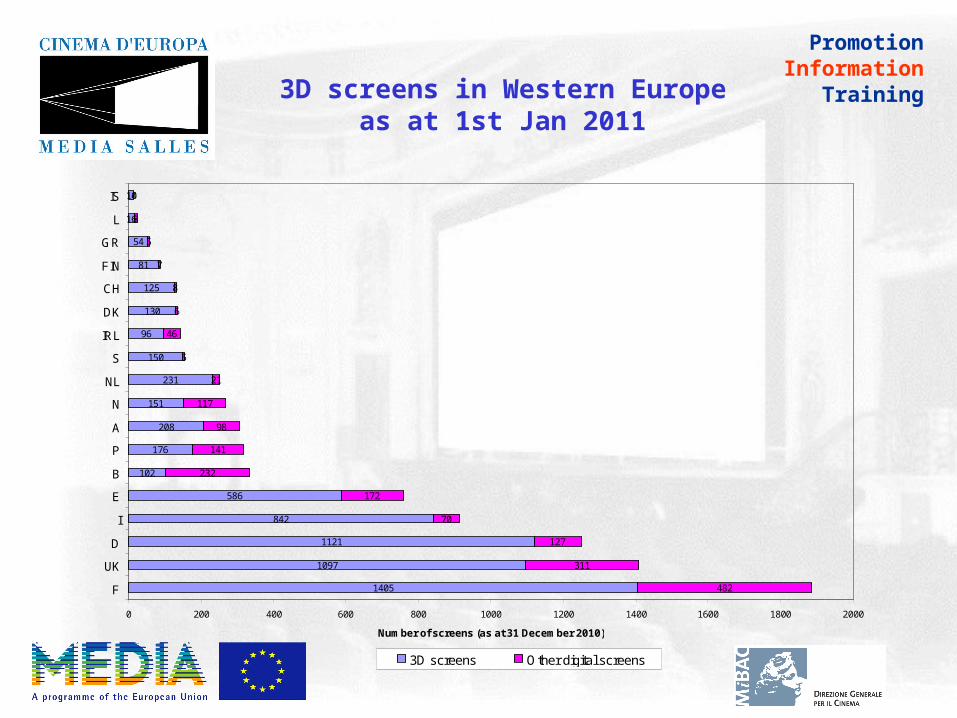
Training3D screens in Western Europeas at 1st Jan 2011
1097
1121
842
586
102
176
208
151
231
150
96
130
125
81
54
16
14
482
311
127
70
172
232
141
98
117
21
5
46
6
8
7
5
8
0
1405
0 200 400 600 800 1000 1200 1400 1600 1800 2000
F
UK
D
I
E
B
P
A
N
NL
S
IRL
DK
CH
FIN
GR
L
IS
Number of screens (as at 31 December 2010)
3D screens Other digital screens

PromotionInformation
Training3D screens in Central - Eastern Europe and Mediterranean Rim as at 1st Jan 2011
937
310
202
121
54
55
53
32
16
9
6
12
13
7
10
5
4
0
2
0 100 200 300 400 500 600 700 800 900 1000
RU
PL
TR
CZ
RO
HU
BG
SK
SI
HR
CY
EE
LT
RS
LV
MT
Number of screens (as at 31 December 2010)
3D screens Other digital screens

PromotionInformation
Training
2010 highlights
-The “rush” to 3D has continued;
- Hollywood output was the main driver;
(e.g. up to 4 new 3D releases over a two-week period in the UK)
- the number of 3D screens increased both because of “new comers” and existing players equipping more screens with 3D

PromotionInformation
Training2010 highlights
European producers started to take advantage of the new booming 3D technology
-Streetdance: first European live action film made in 3D released in the UK in May: huge success
-Other 3D movies from Europe:-Océans, Moomins and the Comet Chase, Sammy’s
Avonturen, Winx Club: Magic Adventure, Amphibious 3D, Konferenz der Tiere

3D: a passing phenomenon?
“3D is a language. In the near future it will invigorate the documentary, giving it body and volume.” Wim Wenders, Interview by Hans Ulrich Obrist,
Biennale Architettura 2010
PromotionInformation
Training

PromotionInformation
Training2010 highlights
The 3D rush was product driven and commercially driven
The growth was limited by the number of projectors and other equipment rolling off the production lines
Large cinema chains have increased their share in the D Cinema offer:
the 10 top players account for 36% of digital screens
(24% twelve months earlier)

PromotionInformation
TrainingTop playersExhibition companies with at least 100 digital screens
Digital screens - situation by exhibitor as at 30th June
127
338
79
144
175
26
89
44
76
2211
452
383
289
262
215 207
181161
116106 104
0
50
100
150
200
250
300
350
400
450
500
OD
EO
N a
nd
UC
I
Cin
em
as
Gro
up
CG
R
EU
RO
PA
LA
CE
S
CIN
EW
OR
LD
GR
OU
P
KIN
EP
OL
IS
LU
SO
MU
ND
O
CIN
EP
LE
XX
CIN
EM
A C
ITY
VU
E
MU
LT
IKIN
O
CIN
EP
LE
X
Total number of screens as at 30th June 2009 Total number of screens as at 30th June 2010

PromotionInformation
TrainingTop players:different strategies
Digital screens - situation by exhibitor as at 30th June 2010
452
383
289
262
215 207
181161
116106 104
2,2
10,9
3,3 3,4
9,8
7,1 7,0
3,2
1,8
5,0
1,8
0
50
100
150
200
250
300
350
400
450
500O
DE
ON
an
d U
CI
Cin
em
as
Gro
up
CG
R
EU
RO
PA
LA
CE
S
CIN
EW
OR
LD
GR
OU
P
KIN
EP
OL
IS
LU
SO
MU
ND
O
CIN
EP
LE
XX
CIN
EM
A C
ITY
VU
E
MU
LT
IKIN
O
CIN
EP
LE
X
Nu
mb
er
of
sc
ree
ns
0
2
4
6
8
10
12
Av
era
ge
sc
ree
ns
pe
r s
ite
Total number of screens as at 30th June 2010 Average screens per site

PromotionInformation
Training2010 highlights
Many schemes evolved to increase the number of digital screens available throughout Europe
- more VPF agreements (integrators)
- joint initiatives by small/medium sized exh. (UK)
- joint initiatives by exhibitors and distributors (Italy)
- public funding (the case of Malopolska, PL)

PromotionInformation
Training 18,500 digital screens between the end of 2011 and the beginning of 2012
Cinema Digitisation: what for?
“Today there are enormous opportunities for creation. My dream is that in this century communication tools will
increasingly be in the hands of the people rather than in those of the old powers.”
Wim Wenders, Interview by Hans Ulrich Obrist,
Biennale Architettura 2010
PromotionInformation
Training

PromotionInformation
Training
To know more on digitisation:
- pick up your copy of the DiGiTalk
- stay in touch on our website www.mediasalles.it
visit the DGT online informer section (publishing the Dailies on this course)
visit the European Cinema Yearbook at http://www.mediasalles.it/publicaz.htm
-collaborate to the survey just launched by MEDIA Salles and the European Audiovisual Observatory
Recommended