© 2012 Ipsos. All rights reserved. Contains Ipsos' Confidential and Proprietary information and may not be disclosed or reproduced without the prior written consent of Ipsos.
SPEC BarometerPress Release: One-Third Gender Rule
Prepared by: Ipsos
Release date: 8th May 2015

2
Methodology

Methodology
3
Dates of polling 28th March - 7th April 2015
Sample Size 1,964
Sampling methodology Random, Multi-stage stratified using PPS (proportionate to population size)
Universe
Data collection methodology
Sampling error
Face-to-Face interviews at the household level
Poll funding Ipsos Limited
Kenyan adults, aged 18 and above living in Urban and Rural areas
+/-2.2% with a 95% confidence level(Note: Higher error-margins for sub-samples)

Sample Structure Statistics
4
RegionSample Frame statistics
(April 2015)*Weighted data
% Population Census as at 2009
Adults (18 years +)%
Central 257 13 2,548,038 13
Coast 173 9 1,711,549 9
Eastern 293 15 2,907,293 15
Nairobi 206 10 2,042,770 10
North Eastern94* 5 929,158 5
Nyanza 257 13 2,547,980 13
Rift Valley484 25 4,795,482 25
Western 200 10 1,980,090 10
TOTAL 1,964 100 19,462,360 100
Quality Control Measures
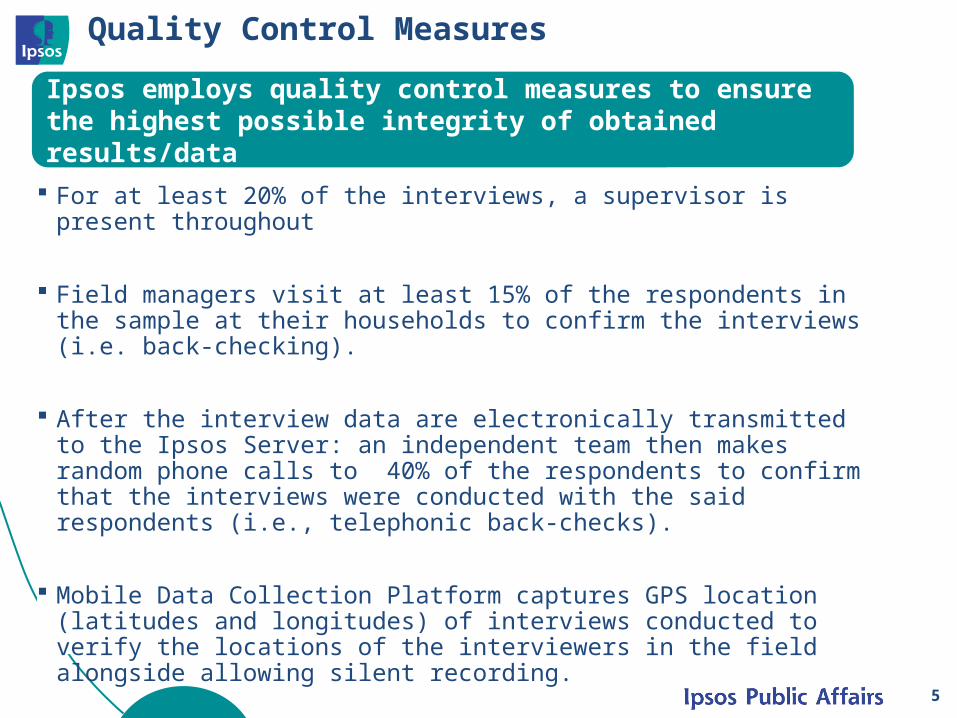
For at least 20% of the interviews, a supervisor is present throughout
Field managers visit at least 15% of the respondents in the sample at their households to confirm the interviews (i.e. back-checking).
After the interview data are electronically transmitted to the Ipsos Server: an independent team then makes random phone calls to 40% of the respondents to confirm that the interviews were conducted with the said respondents (i.e., telephonic back-checks).
Mobile Data Collection Platform captures GPS location (latitudes and longitudes) of interviews conducted to verify the locations of the interviewers in the field alongside allowing silent recording.
Logical data checks are made on selected questionnaire entries to ensure conformity to the sample’s statistical parameters.
5
Ipsos employs quality control measures to ensure the highest possible integrity of obtained results/data
6
Respondents’ Demographic Profile:

Catholic
Catholic Charismatic
Mainstream Protestant (ACK, Methodist, Presbyterian, AIC)
SDA
Evangelical
Other Christian
Muslim
Refused To Answer/None
No religion
Public Sector wages/salary
Private sector wages /salary
Gains from self employment/ Business owner/trader
Agriculture (own/household farm)
Livestock
Given money by others
Pension from previous employment
Other
Don’t Know
Refused To Answer
28%
2%
30%
8%
11%
9%
10%
1%
1%
9%
22%
28%
23%
4%
4%
2%
5%
1%
2%
Demographic Profile
Nairobi
Coast
Nyanza
Rift Valley
North Eastern
Eastern
Central
Western
Female
Male
18 - 24
25 - 34
35 - 44
45+
Urban
Rural
Kenyans
10%
9%
13%
25%
5%
15%
13%
10%
51%
49%
28%
29%
18%
25%
37%
63%
100%
7
Region
Gender
Age
Setting
Religion
Nationality
Source of Household Income
Base: All Respondents (n=1,964)

Demographic Profile
No formal education
Some primary education
Primary education completed
Some secondary education
Secondary education completed
Some middle level college (not university)
Completed mid-level college (Not University)
Some University education
University education completed
Post Graduate (Masters, MBA, PhD)
Less than 10,000
10,001 – 25,000
25,001 – 40,000
40,001 – 55,000
55,001 – 75,000
75,001 – 100,000
100,001 and above
Has No income
RTA/DK
4%
14%
19%
14%
26%
8%
7%
3%
3%
1%
42%
33%
11%
4%
1%
1%
0%
2%
7%
8
Level of Education
Monthly Household Income (ALL members of the Household)
Base: All Respondents (n=1,964)

Demographic Profile
Self-Employed
Unemployed
Employed in the private sector
Peasant/herder (own farm/pasture)
Casual labour
Employed in the public sector
Student
Retired
Other
41%
18%
11%
10%
7%
5%
5%
2%
1%
9
Employment Status
Base: All Respondents (n=1,964)

10
Awareness of 1/3 Gender Rule

“If you know, what is the constitutional requirement about the representation of women in all elected bodies such as parliament, county assemblies?” (By Total, Supporters of the Main Political Parties/Coalitions)
11
Total (n=1,964) Male (n=956) Female (n=1,008) CORD Supporters (n=624)
Jubilee Supporters (n=871)
0%
10%
20%
30%
40%
50%
39%
45%
33%
41%44%
25% 25% 24% 24% 24%
37%
29%
43%
36%
32%
Correct answer [at least one-third women] Incorrect answer Don't Know

12
YES; 52%
NO; 34%
Not sure/Don't Know; 14%
Base: Those aware of the one-third gender rule (n=764)
“Do you think that this requirement will be met within the period stated in the constitution (August 2015)?” (By Total)

13
All respondents (n=1,964)
Male (n=956) Female (n=1,008) CORD Supporters (n=624)
Jubilee Supporters (n=871)
0%
20%
40%
60%
80%
100%
48% 47% 48%44%
53%
27%32%
23%29% 27%25%
21%
29% 28%
20%
YES NO Not sure
“Do you think having at least 1/3 women in all elected bodies would improve the quality of politics and governance?” (By Total, Gender, Supporters of the Main Political Parties/Coalitions)
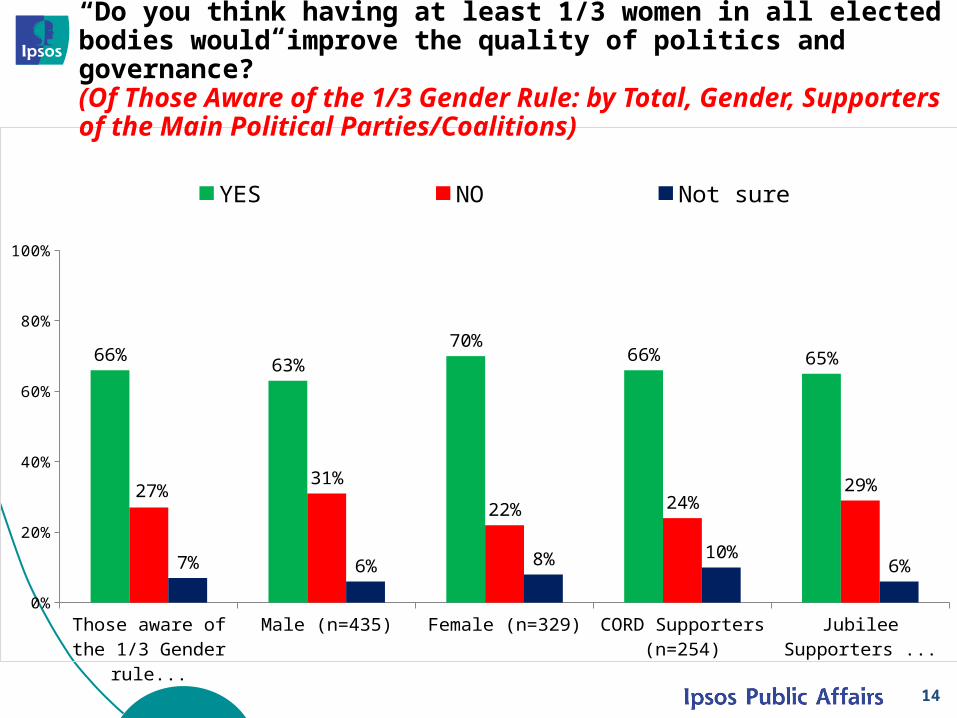
14
Those aware of the 1/3 Gender rule
(n=764)
Male (n=435) Female (n=329) CORD Supporters (n=254)
Jubilee Supporters (n=384)
0%
20%
40%
60%
80%
100%
66%63%
70%66% 65%
27%31%
22% 24%29%
7% 6% 8% 10%6%
YES NO Not sure
“Do you think having at least 1/3 women in all elected bodies would improve the quality of politics and governance?” (Of Those Aware of the 1/3 Gender Rule: by Total, Gender, Supporters of the Main Political Parties/Coalitions)

For further information contact: Dr Tom WolfSocial Political [email protected]
Victor RatengProject Manager - Opinion Polls [email protected]
Follow us on twitter: @IpsosKe
15
Recommended