Gibbergunyah Creek Flood Study Draft Report
VOLUME 1: Report and Appendices
Revision 1
December 2012


i
Gibbergunyah Creek Flood Study Draft Report
REVISION / REVIEW HISTORY
Revision # Description Prepared by Reviewed by
1 Draft report D. Tetley C. Ryan
DISTRIBUTION
Revision # Distribution List Date Issued Number of Copies
1 Wingecarribee Shire Council 12/12/2012 PDF
Catchment Simulation Solutions
Suite 302
5 Hunter Street
Sydney, NSW, 2000
(02) 6223 0882 [email protected]
(02) 8415 7118 www.csse.com.au
File Reference: gibbergunyah creek flood study (rev #1).docx
The information within this document is and shall remain the property of Catchment Simulation Solutions.

i

ii
FOREWORD
The State Government’s Flood Policy is directed towards providing solutions to existing flooding
problems in developed areas and ensuring that new development is compatible with the flood
hazard and does not create additional flooding problems in other areas. The Policy is defined in
the NSW Government’s ‘Floodplain Development Manual’ (NSW Government, 2005).
Under the Policy, the management of flood liable land remains the responsibility of Local
Government. The State Government subsidises flood mitigation works to alleviate existing
problems and provides specialist technical advice to assist Local Government in its floodplain
management responsibilities.
The Policy provides for technical and financial support by the State Government through the
following four sequential stages:
STAGE DESCRIPTION
1 Flood Study Determines the nature and extent of the flood problem.
2 Floodplain Management
Study
Evaluates management options for the floodplain in respect of
both existing and proposed developments.
3 Floodplain Management
Plan
Involves formal adoption by Council of a plan of management
for the floodplain.
4 Implementation of the
Plan
Construction of flood mitigation works to protect existing
development. Use of environmental plans to ensure new
development is compatible with the flood hazard.
The Gibbergunyah Creek Flood Study represents the first of the four stages in the process
outlined above. It has been prepared to assist Council and the community to define and
understand the manner in which floodwaters would be distributed across the Gibbergunyah
Creek catchment and to establish the basis for the assessment of floodplain risk management
measures.
The project was funded by the NSW Government’s ‘Floodplain Management Program’ and
Wingecarribee Shire Council. Technical support for the project was provided by the Office of
Environment and Heritage.

iii
ACKNOWLEDGEMENTS
Catchments Simulation Solutions would like to acknowledge the valuable contributions of a
number of individuals who assisted with the preparation of this study. In particular, Mr Sha
Prodhan and Mr Dominic Lucas of Wingecarribee Shire Council provided a substantial amount
of information and insights into flooding across the Gibbergunyah Creek catchment. Thanks are
also extended to Mr John Murtagh of the Office of Environment and Heritage for his technical
input and review of the flood study report.

iv
TABLE OF CONTENTS
1 INTRODUCTION .......................................................................................................... 1
2 METHODOLOGY ......................................................................................................... 2
2.1 General ................................................................................................................ 2
2.2 Objectives ............................................................................................................ 3
2.3 Adopted Approach ............................................................................................. 3
3 REVIEW OF AVAILABLE INFORMATION .............................................................. 4
3.1 Overview .............................................................................................................. 4
3.2 Previous Investigations ..................................................................................... 4
3.2.1 Lot 2 Bessemer Street, Mittagong – Flood Study (2009) ...................... 4
3.2.2 Hydraulic Assessment of Chinamans Creek, Mittagong (2006) .......... 5
3.2.3 Bowral Floodplain Risk Management Study and Plan (2005) .............. 6
3.2.4 Catalogue of Conceptual Models for Groundwater-Stream Interaction in Eastern Australia (2009) ........................................................................ 7
3.3 Hydrologic Data .................................................................................................. 8
3.3.1 Historic Rainfall Data .................................................................................. 8
3.3.2 Historic Streamflow Data .......................................................................... 10
3.4 Topographic Data ............................................................................................. 11
3.4.1 Aerial Laser Survey (ALS)........................................................................ 11
3.4.2 10 Metre Contours ..................................................................................... 12
3.5 GIS Data ............................................................................................................ 12
3.5.1 Aerial Photography .................................................................................... 12
3.5.2 Stormwater Network GIS layer ................................................................ 12
3.5.3 Bridges ........................................................................................................ 13
3.5.4 Building Footprint Polygons ..................................................................... 13
3.6 Community Consultation ................................................................................. 13
3.6.1 Flood Study Website. ................................................................................ 13
3.6.2 Community Information Brochure and Questionnaire ......................... 15
3.7 Cross-Section and Structure Survey ............................................................. 19
4 HYDROLOGY ............................................................................................................. 20

Gibbergunyah Creek Flood Study
v
4.1 General .............................................................................................................. 20
4.2 Hydrologic Model Development ..................................................................... 20
4.2.1 Subcatchment Parameterisation ............................................................. 20
4.2.2 Stream Routing .......................................................................................... 21
4.2.3 Rainfall Loss Model ................................................................................... 21
4.2.4 Flood Storage Basins................................................................................ 22
4.3 Hydrologic Model Calibration ......................................................................... 23
4.3.1 General........................................................................................................ 23
4.3.2 Rainfall Data ............................................................................................... 24
4.3.3 Results of Calibration and Verification Simulations ............................. 24
5 HYDRAULICS ............................................................................................................ 26
5.1 General .............................................................................................................. 26
5.2 Hydraulic Model Development ....................................................................... 26
5.2.1 Model Extent .............................................................................................. 26
5.2.2 Model Topography .................................................................................... 26
5.2.3 Material Types / Manning’s ‘n’ Roughness ........................................... 27
5.2.4 Culverts/Bridges ........................................................................................ 27
5.2.5 Pit/Culvert Blockage .................................................................................. 29
5.3 Hydraulic Model Calibration ........................................................................... 30
5.3.1 General........................................................................................................ 30
5.3.2 Calibration/Verification Event Selection ................................................. 30
5.3.3 Model Boundary Conditions ..................................................................... 30
5.3.4 Results of Calibration and Verification Simulations ............................. 31
5.3.5 Additional Model Verification ................................................................... 32
5.3.6 Summary ..................................................................................................... 33
6 DESIGN FLOOD ESTIMATION .............................................................................. 34
6.1 General .............................................................................................................. 34
6.2 Hydrology .......................................................................................................... 34
6.2.1 Design Rainfall ........................................................................................... 34
6.2.2 Probable Maximum Precipitation (PMP) ................................................ 34
6.2.3 Rainfall Loss Model ................................................................................... 35
6.2.4 Baseflow...................................................................................................... 36
6.2.5 Peak Discharges........................................................................................ 37
6.2.6 Verification of Peak Discharges .............................................................. 39

Gibbergunyah Creek Flood Study
vi
6.3 Hydraulics .......................................................................................................... 41
6.3.1 General........................................................................................................ 41
6.3.2 Model Boundary Conditions ..................................................................... 41
6.3.3 Design Flood Envelope ............................................................................ 41
6.3.4 Floodwater Depths, Levels and Velocities ............................................ 42
7 SENSITIVITY ANALYSIS ......................................................................................... 46
7.1 General .............................................................................................................. 46
7.2 Hydrologic Model ............................................................................................. 46
7.2.1 Initial Loss ................................................................................................... 46
7.2.2 Continuing Loss Rate................................................................................ 48
7.3 Hydraulic Model ................................................................................................ 49
7.3.1 Pipe/Culvert Blockage .............................................................................. 49
7.3.2 Manning’s ‘n’ .............................................................................................. 51
8 PROVISIONAL FLOOD HAZARD AND HYDRAULIC CATEGORISATION .... 54
8.1 Provisional Flood Hazard Categories ........................................................... 54
8.1.1 Provisional Flood Hazard ......................................................................... 54
8.2 Hydraulic Categories ....................................................................................... 55
8.2.1 Adopted Hydraulic Categories ................................................................. 56
8.3 Flood Risk Precincts ........................................................................................ 58
9 CLIMATE CHANGE ASSESSMENT ...................................................................... 59
9.1 Hydrology .......................................................................................................... 59
9.1.1 General........................................................................................................ 59
9.1.2 Results ........................................................................................................ 59
9.2 Hydraulics .......................................................................................................... 60
9.2.1 Results ........................................................................................................ 60
10 DISCUSSION ............................................................................................................. 63
10.1 Overview ............................................................................................................ 63
10.2 General Description of Flood Behaviour ...................................................... 63
10.3 Flood Liable Areas ........................................................................................... 63
10.4 Emergency Response Infrastructure ............................................................ 64
10.5 Roadways .......................................................................................................... 65
10.6 Railway .............................................................................................................. 66
11 CONCLUSION ............................................................................................................ 67

Gibbergunyah Creek Flood Study
vii
12 REFERENCES ........................................................................................................... 69
LIST OF APPENDICES
APPENDIX A Community Consultation
APPENDIX B XP-RAFTS Model Input Parameters
APPENDIX C XP-RAFTS Model Results for Calibration Simulations
APPENDIX D Bridge Loss Calculations
APPENDIX E PMP Calculations
APPENDIX F XP-RAFTS Model Results for Design Flood Simulations
APPENDIX G Probabilistic Rational Method Results
APPENDIX H XP-RAFTS Model Results for Sensitivity Analyses
APPENDIX I TUFLOW Model Results for Sensitivity Analyses
APPENDIX J XP-RAFTS Model Results for Climate Change Assessment
APPENDIX K TUFLOW Model Results for Climate Change Assessment
LIST OF TABLES
Table 1 Peak design discharges extracted from Lot 2 Bessemer Street, Mittagong – Flood Study (2009) ............................................................................................................ 4
Table 2 Available rain gauges in the vicinity of the Gibbergunyah Creek catchment ............. 9
Table 3 Temporal availability and percentage of annual record complete for rain gauges in the vicinity of Mittagong (source: http://www.bom.gov.au/climate/data/) ................. 10
Table 4 Significant Historic Rainfall Events ......................................................................... 11
Table 5 Adopted Impervious Percentage and Manning’s ‘n’ Values for Hydrologic Model ... 21
Table 6 Adopted XP-RAFTS Rainfall Losses for Calibration Simulations ............................ 22
Table 7 TUFLOW Manning's 'n' Roughness Values ............................................................ 28
Table 8 Design Rainfall Intensities ...................................................................................... 35
Table 9 Adopted XP-RAFTS Rainfall Losses for Design Simulations .................................. 36
Table 10 Adopted Baseflow Contributions for Design Simulations ........................................ 36
Table 11 Peak Design Discharges for Existing Conditions .................................................... 37
Table 12 Comparison between Probabilistic Rational Method and XP-RAFTS 100 Year ARI Peak Design Discharges ........................................................................................ 40
Table 13 Comparison between XP-RAFTS Design Discharges and Discharges Documented in Previous Flooding Investigations ........................................................................ 40
Table 14 Peak Design Floodwater Elevations ....................................................................... 43

Gibbergunyah Creek Flood Study
viii
Table 15 XP-RAFTS Sensitivity to Variations in Initial Losses ............................................... 47
Table 16 XP-RAFTS Sensitivity to Variations in Initial Losses ............................................... 48
Table 17 TUFLOW Sensitivity to Variations in Culvert/Pipe Blockage ................................... 50
Table 18 TUFLOW Sensitivity to Variations in Adopted Manning’s ‘n’ Roughness ................ 52
Table 19 Qualitative and Quantitative Criteria for Hydraulic Categories ............................... 55
Table 20 Flood Risk Precinct Definitions .............................................................................. 58
Table 21 Predicted Peak Design Discharges with Increases in Rainfall Intensity Associated with Climate Change .............................................................................................. 60
Table 22 TUFLOW Sensitivity to Variations in Culvert/Pipe Blockage ................................... 61
LIST OF PLATES
Plate 1 Chinamans Creek channel upstream of the Old Hume Highway showing dense vegetation in creek channel and overbank areas (i.e., Manning’s ‘n’ = ~0.1) ............ 6
Plate 2 Priestley Street culvert crossing of Chinamans Creek showing significant base flow 8
Plate 3 Conceptual diagram of geology and groundwater movement across the Upper Nepean River catchment (Sydney Catchment Authority, 2006) ................................ 9
Plate 4 Incomplete building polygon in Regent Street, Mittagong ....................................... 14
Plate 5 Missing building polygon in Henderson Avenue, Mittagong .................................... 14
Plate 6 Flooding across southern end of Gibbergunyah Lane during November 2010 event ............................................................................................................................... 16
Plate 7 Flooding across Gibbergunyah Lane during November 2010 event ....................... 16
Plate 8 Flooding in the vicinity of John Street, Mittagong during November 2010 event ..... 17
Plate 9 Flooding across John Street, Mittagong during November 2010 event ................... 17
Plate 10 Flooding across Bowral Lane, Welby during February 2005 event ......................... 18
Plate 11 Flooding across back yard at Lot 8 Bowral Lane, Welby during February 2005 event ............................................................................................................................... 18
Plate 12 Floodwaters along unnamed tributary at rear of properties fronting Bowral Lane, Welby during February 2005 event......................................................................... 19
Plate 13 Main outlet structure for Lake Alexandra ................................................................ 23
Plate 14 Arch culvert with wildlife ledge draining water beneath the railway line .................. 28
Plate 15 Example of vegetation blocking culvert outlet in Gibbergunyah Creek catchment. . 29
Plate 16 Railway Parade culverts showing plates that increase the effective blockage ........ 30
Plate 17 Adopted hydraulic category criteria ........................................................................ 56
Plate 18 Predicted Peak 100 year ARI Flood Levels, Depth and Velocities with Partial Blockage of Floodways (blockage locations highlighted by yellow circles).............. 57
Plate 19 Predicted Change in Peak 100 year ARI Flood Levels with Partial Blockage of Floodways (blockage locations highlighted by yellow circles) ................................. 57

Gibbergunyah Creek Flood Study
ix

i
GLOSSARY
acid sulphate soils are sediments which contain sulfidic mineral pyrite which may
become extremely acid following disturbance or drainage as sulfur
compounds react when exposed to oxygen to form sulfuric acid.
More detailed explanation and definition can be found in the NSW
Government Acid Sulfate Soil Manual published by Acid Sulfate Soil
Management Advisory Committee.
annual exceedance
probability (AEP)
the chance of a flood of a given or larger size occurring in any one
year, usually expressed as a percentage. Eg, if a peak flood discharge
of 500 m3/s has an AEP of 5%, it means that there is a 5% chance
(that is one-in-20 chance) of a 500 m3/s or larger events occurring in
any one year (see ARI).
Australian Height Datum
(AHD)
a common national surface level datum approximately corresponding
to mean sea level.
average annual damage
(AAD)
depending on its size (or severity), each flood will cause a different
amount of flood damage to a flood prone area. AAD is the average
damage per year that would occur in a nominated development
situation from flooding over a very long period of time.
average recurrence interval
(ARI)
the long-term average number of years between the occurrence of a
flood as big as or larger than the selected event. For example, floods
with a discharge as great as or greater than the 20 year ARI flood
event will occur on average once every 20 years. ARI is another way
of expressing the likelihood of occurrence of a flood event.
caravan and moveable home
parks
caravans and moveable dwellings are being increasingly used for
long-term and permanent accommodation purposes. Standards
relating to their siting, design, construction and management can be
found in the Regulations under the Local Governments Act.
catchment the land area draining through the main stream, as well as tributary
streams, to a particular site. It always relates to an area above a
specific location.
consent authority the council, government agency or person having the function to
determine a development application for land use under the EP&A
Act. The consent authority is most often the council, however
legislation or an EPI may specify
a Minister or public authority (other than a council), or the Director
General of DIPNR, as having the function to determine an application.

Gibbergunyah Creek Flood Study
ii
development is defined in Part 4 of the Environmental Planning and Assessment
Act (EP&A Act).
infill development: refers to development of vacant blocks of land
that are generally surrounded by developed properties and is
permissible under the current zoning of the land. Conditions such as
minimum floor levels may be imposed on infill development.
new development: refers to development of a completely different
nature to that associated with the former land use. For example, the
urban subdivision of an area previously used for rural purposes. New
developments involve rezoning and typically require major extensions
of existing urban services, such as roads, water supply, sewerage and
electric power.
redevelopment: refers to rebuilding in an area. For example, as
urban areas age, it may become necessary to demolish and
reconstruct buildings on a relatively large scale. Redevelopment
generally does not require either rezoning or major extensions to
urban services.
disaster plan (DISPLAN) a step by step sequence of previously agreed roles, responsibilities,
functions, actions and management arrangements for the conduct of
a single or series of connected emergency operations, with the object
of ensuring the coordinated response by all agencies having
responsibilities and functions in emergencies.
discharge the rate of flow of water measured in terms of volume per unit time,
for example, cubic metres per second (m3/s). Discharge is different
from the speed or velocity of flow, which is a measure of how fast the
water is moving for example, metres per second (m/s).
ESD using, conserving and enhancing natural resources so that ecological
processes, on which life depends, are maintained, and the total
quality of life, now and in the future, can be maintained or increased.
A more detailed definition is included in the Local Government Act,
1993. The use of sustainability and sustainable in this manual relate
to ESD.
effective warning time
The time available after receiving advice of an impending flood and
before floodwaters prevent appropriate flood response actions being
undertaken. The effective warning time is typically used to move
farm equipment, move stock, raise furniture, evacuate people and
transport their possessions.
emergency management a range of measures to manage risks to communities and the
environment. In the flood context it may include measures to
prevent, prepare for, respond to and recover from flooding.
flash flooding flooding which is sudden and unexpected. It is often caused by
sudden local or nearby heavy rainfall. Often defined as flooding which
peaks within six hours of the causative rain.
Gibbergunyah Creek Flood Study
iii
flood relatively high stream flow which overtops the natural or artificial
banks in any part of a stream, river, estuary, lake or dam, and/or local
overland flooding associated with major drainage (refer Section C6)
before entering a watercourse, and/or coastal inundation resulting
from super-elevated sea levels and/or waves overtopping coastline
defences excluding tsunami.
flood awareness Awareness is an appreciation of the likely effects of flooding and a
knowledge of the relevant flood warning, response and evacuation
procedures.
flood education flood education seeks to provide information to raise awareness of
the flood problem so as to enable individuals to understand how to
manage themselves and their property in response to flood warnings
and in a flood event. It invokes a state of flood readiness.
flood fringe areas the remaining area of flood prone land after floodway and flood
storage areas have been defined.
flood liable land is synonymous with flood prone land, i.e., land susceptible to flooding
by the PMF event. Note that the term flood liable land covers the
whole floodplain, not just that part below the FPL (see flood planning
area).
flood mitigation standard the average recurrence interval of the flood, selected as part of the
floodplain risk management process that forms the basis for physical
works to modify the impacts of flooding.
floodplain area of land which is subject to inundation by floods up to and
including the probable maximum flood event, that is, flood prone
land.
floodplain risk management
options
the measures that might be feasible for the management of a
particular area of the floodplain. Preparation of a floodplain risk
management plan requires a detailed evaluation of floodplain risk
management options.
floodplain risk management
plan
a management plan developed in accordance with the principles and
guidelines in this manual. Usually includes both written and
diagrammatic information describing how particular areas of flood
prone land are to be used and managed to achieve defined
objectives.
flood plan (local) A sub-plan of a disaster plan that deals specifically with flooding. They
can exist at state, division and local levels. Local flood plans are
prepared under the leadership of the SES.
flood planning area the area of land below the FPL and thus subject to flood related
development controls.
flood planning levels (FPLs) are the combinations of flood levels (derived from significant
historical flood events or floods of specific AEPs) and freeboards
selected for floodplain risk management purposes, as determined in

Gibbergunyah Creek Flood Study
iv
management studies and incorporated in management plans.
flood proofing a combination of measures incorporated in the design, construction
and alteration of individual buildings or structures subject to flooding,
to reduce or eliminate flood damages.
flood prone land land susceptible to flooding by the PMF event. Flood prone land is
synonymous with flood liable land.
flood readiness Readiness is an ability to react within the effective warning time.
flood risk potential danger to personal safety and potential damage to property
resulting from flooding. The degree of risk varies with circumstances
across the full range of floods. Flood risk in this manual is divided into
3 types, existing, future and continuing risks. They are described
below.
existing flood risk: the risk a community is exposed to as a result of its
location on the floodplain.
future flood risk: the risk a community may be exposed to as a result
of new development on the floodplain.
continuing flood risk: the risk a community is exposed to after
floodplain risk management measures have been implemented. For a
town protected by levees, the continuing flood risk is the
consequences of the levees being overtopped. For an area without
any floodplain risk management measures, the continuing flood risk is
simply the existence of its flood exposure.
flood storage areas those parts of the floodplain that are important for the temporary
storage of floodwaters during the passage of a flood. The extent and
behaviour of flood storage areas may change with flood severity, and
loss of flood storage can increase the severity of flood impacts by
reducing natural flood attenuation. Hence, it is necessary to
investigate a range of flood sizes before defining flood storage areas.
floodway areas those areas of the floodplain where a significant discharge of water
occurs during floods. They are often aligned with naturally defined
channels. Floodways are areas that, even if only partially blocked,
would cause a significant redistribution of flood flow, or a significant
increase in flood levels.
freeboard provides reasonable certainty that the risk exposure selected in
deciding on a particular flood chosen as the basis for the FPL is
actually provided. It is a factor of safety typically used in relation to
the setting of floor levels, levee crest levels, etc. Freeboard is
included in the flood planning level.
hazard a source of potential harm or a situation with a potential to cause
loss. In relation to this study the hazard is flooding which has the
potential to cause damage to the community.
Definitions of high and low hazard categories are provided in
Appendix L of the Floodplain Development Manual (2005).

Gibbergunyah Creek Flood Study
v
historical flood a flood which has actually occurred.
hydraulics term given to the study of water flow in waterways; in particular, the
evaluation of flow parameters such as water level and velocity.
hydrograph a graph which shows how the discharge or stage/flood level at any
particular location varies with time during a flood.
hydrology term given to the study of the rainfall and runoff process; in
particular, the evaluation of peak flows, flow volumes and the
derivation of hydrographs for a range of floods.
local overland flooding inundation by local runoff rather than overbank discharge from a
stream, river, estuary, lake or dam.
local drainage smaller scale problems in urban areas. They are outside the definition
of major drainage in this glossary.
mainstream flooding inundation of normally dry land occurring when water overflows the
natural or artificial banks of a stream, river, estuary, lake or dam.
major drainage councils have discretion in determining whether urban drainage
problems are associated with major or local drainage. For the
purposes of this manual major drainage involves:
• the floodplains of original watercourses (which may now be
piped, channelised or diverted), or sloping areas where overland
flows develop along alternative paths once system capacity is
exceeded; and/or
• water depths generally in excess of 0.3m (in the major system
design storm as defined in the current version of Australian
Rainfall and Runoff). These conditions may result in danger to
personal safety and property damage to both premises and
vehicles; and/or
• major overland flowpaths through developed areas outside of
defined drainage reserves; and/or
• the potential to affect a number of buildings along the major
flow path.
mathematical / computer
models
the mathematical representation of the physical processes involved
in runoff generation and stream flow. These models are often run on
computers due to the complexity of the mathematical relationships
between runoff, stream flow and the distribution of flows across the
floodplain.

Gibbergunyah Creek Flood Study
vi
merit approach the merit approach weighs social, economic, ecological and cultural
impacts of land use options for different flood prone areas together
with flood damage, hazard and behaviour implications, and
environmental protection and well-being of the State’s rivers and
floodplains.
The merit approach operates at two levels. At the strategic level it
allows for the consideration of social, economic, ecological, cultural
and flooding issues to determine strategies for the management of
future flood risk which are formulated into council plans, policy, and
EPIs. At a site specific level, it involves consideration of the best way
of conditioning development allowable under the floodplain risk
management plan, local flood risk management policy and EPIs.
minor, moderate and major
flooding
Both the State Emergency Service and the Bureau of Meteorology use
the following definitions in flood warnings to give a general indication
of the types of problems expected with a flood.
minor flooding: Causes inconvenience such as closing of minor roads
and the submergence of low level bridges. The lower limit of this
class of flooding on the reference gauge is the initial flood level at
which landholders and townspeople begin to be flooded.
moderate flooding: Low lying areas are inundated requiring removal
of stock and/or evacuation of some houses. Main traffic routes may
be covered.
major flooding: Appreciable urban areas are flooded and/or
extensive rural areas are flooded. Properties, villages and towns can
be isolated.
modification measures measures that modify either the flood, the property or the response
to flooding.
peak discharge the maximum discharge occurring during a flood event.
probable maximum flood
(PMF)
the PMF is the largest flood that could conceivably occur at a
particular location, usually estimated from probable maximum
precipitation, and where applicable, snow melt, coupled with the
worst flood producing catchment conditions. Generally, it is not
physically or economically possible to provide complete protection
against this event. The PMF defines the extent of flood prone land,
that is, the floodplain. The extent, nature and potential consequences
of flooding associated with a range of events rarer than the flood
used for designing mitigation works and controlling development, up
to and including the PMF event should be addressed in a floodplain
risk management study.
probable maximum
precipitation (PMP)
the PMP is the greatest depth of precipitation for a given duration
meteorologically possible over a given size storm area at a particular
location at a particular time of the year, with no allowance made for
long-term climatic trends (World Meteorological Organisation, 1986).
It is the primary input to PMF estimation.

Gibbergunyah Creek Flood Study
vii
probability A statistical measure of the expected chance of flooding (see annual
exceedance probability).
risk chance of something happening that will have an impact. It is
measured in terms of consequences and likelihood. In the context of
the manual it is the likelihood of consequences arising from the
interaction of floods, communities and the environment.
runoff the amount of rainfall which actually ends up as streamflow, also
known as rainfall excess.
stage equivalent to water level (both measured with reference to a
specified datum).
stage hydrograph a graph that shows how the water level at a particular location
changes with time during a flood. It must be referenced to a
particular datum.
survey plan a plan prepared by a registered surveyor.
TUFLOW is a 1-dimensional and 2-dimensional flood simulation software. It
simulates the complex movement of floodwaters across a particular
area of interest using mathematical approximations to derive
information on floodwater depths, velocities and levels.
velocity the speed or rate of motion (distance per unit of time, e.g., metres
per second) in a specific direction at which the flood waters are
moving.
water surface profile a graph showing the flood stage at any given location along a
watercourse at a particular time.
wind fetch the horizontal distance in the direction of wind over which wind
waves are generated.
XP-RAFTS is a non-linear runoff routing software. It incorporates subcatchment
information such as area, slope, roughness and percentage
impervious and is used to simulate the transformation of historic or
design rainfall into runoff (i.e., discharge hydrographs).

Gibbergunyah Creek Flood Study
viii

1
1 INTRODUCTION
The Gibbergunyah Creek catchment is located in the Southern Highlands of New South Wales
and occupies a total area of 10.5 km2. The extent of the catchment is shown in Figure 1 (refer
Flood Study: Volume 2).
Gibbergunyah Creek originates in the vicinity of Mount Gibraltar and drains in a northerly
direction through the Mittagong urban area, where it is joined by Chinamans Creek and Iron
Mines Creek. It continues to drain in a northerly direction beneath the Hume Highway before
joining the Nattai River. The majority of the catchment is developed comprising a mix of
residential, commercial and industrial land uses, although the downstream sections of the
catchment is undeveloped.
The catchment is drained primarily by natural watercourses and gullies. The urbanised sections
of the catchment are also drained by a stormwater system which carries local catchment runoff
into the natural watercourses via a network of stormwater pipes, pits, open channels and
culverts.
During periods of heavy rainfall, there is potential for the stormwater system to become
overwhelmed and for water to overtop the banks of the natural watercourses and inundate the
adjoining floodplain. Accordingly, there is potential for inundation of properties located in
close proximity to the creeks and drainage lines.
Although several flooding investigations have been completed at isolated locations across the
catchment, a comprehensive flood study of the entire Gibbergunyah Creek catchment has not
previously been prepared. Therefore, with the exception of isolated flooding complaints from
residents, the extent of the existing flooding problem is not well understood.
In recognition of this, Wingecarribee Shire Council decided to prepare a Floodplain Risk
Management Plan for the Gibbergunyah Creek catchment.
The first stage in the development of a Floodplain Risk Management Plan involves the
preparation of a Flood Study. The Flood Study provides a technical assessment of flood
behaviour.
This report forms the Flood Study for the Gibbergunyah Creek catchment. It documents flood
behaviour across the catchment for a range of design floods for existing topographic and
development conditions. This includes information on peak discharges, flood levels, flood
extents, flood depths and flow velocities for a range of design floods. It also provides
provisional estimates of the flood hazard and hydraulic categories across the catchment.
The Flood Study comprises two volumes. Volume 1 (i.e., this document) comprises the report
text and appendices. Volume 2 contains all accompanying report figures.

2
Floodplain Risk
Management
Committee
Data Collection
Flood Study
Floodplain Risk
Management Study
Floodplain Risk
Management Plan
Implementation of
Plan
Established by the local council, must include community groups and state agency specialists
Compilation of existing data and collection of additional data. Usually undertaken by consultants appointed
by the council.
Defines the nature and extent of the flood problem, in technical rather than map form. Usually undertaken by consultants appointed by the council.
Determines options in consideration of social, ecological and economic factors relating to flood risk. Usually undertaken by consultants appointed
by the council.
Preferred options publicly exhibited and subject to revision in light of responses. Formally approved by the council after public exhibition and any necessary revisions due to public comments.
Flood, response and property modification measures including mitigation works, planning controls, flood warnings, flood readiness and response plans, environmental rehabilitation, ongoing data collection and monitoring.
2 METHODOLOGY
2.1 General
The NSW Government’s ‘Floodplain Development Manual’ (NSW Government, 2005) outlines
the steps required to successfully develop a Floodplain Risk Management Plan for flood
affected areas.
The various steps involved in preparing a floodplain risk management plan are also outlined in
the diagram below. As shown, one of the key steps involved in formulating a Floodplain
Management Plan involves the preparation of a Flood Study.
The aim of the Flood Study is to produce information on flood discharges, levels, depths and
velocities, for a range of flood events under existing topographic and development conditions.
This information can then be used as a basis for identifying those areas where the greatest
flood damage is likely to occur, thereby allowing a targeted assessment of where flood
mitigation measures would be best implemented.
Wingecarribee Shire Council initiated the floodplain management process for the Gibbergunyah
Creek catchment by commissioning this Flood Study.

Gibbergunyah Creek Flood Study
3
2.2 Objectives
The objectives of the Gibbergunyah Creek Flood Study are:
to review available flood-related information for the Gibbergunyah Creek catchment;
to prepare design flow hydrographs describing the spatial and temporal variation in flows
across the catchment using a hydrologic computer model;
to develop a hydraulic computer model to simulate the passage of flood flows across the
Gibbergunyah Creek catchment;
to calibrate the hydrologic and hydraulic computer models to reproduce past floods;
to use the calibrated computer models to define peak discharges, water levels, depths and
velocities for the design 5, 10, 20, 50, 100 and 200 year ARI floods, and the Probable
Maximum Flood (PMF);
to produce maps showing the extent, depth and velocity of floodwaters for the range of
design floods; and,
to produce maps showing provisional flood hazard and hydraulic categories for the range
of design floods.
2.3 Adopted Approach
The general approach and methodology employed to achieve the study objectives involved:
compilation and review of available flood-related information (Chapter 3);
the development and calibration of a computer based hydrologic model to simulate the
transformation of rainfall into runoff (Chapter 4);
the development and calibration of a computer based hydraulic model to simulate the
movement of floodwaters across the Gibbergunyah Creek catchment (Chapter 5);
use of the computer models to determine peak discharges, water levels, depths, flow
velocities and flood extents for the full range of design events up to and including the PMF
(Chapter 6);
testing the sensitivity of the results generated by the computer model to variations in
model input parameters (Chapter 7);
use of the computer model results to generate provisional flood hazard and hydraulic
category mapping using definitions provided in the ‘Floodplain Development Manual’ (NSW
Government, 2005) (Chapter 8); and,
assessment of potential climate change implications on existing flood behaviour
(Chapter 9).
identifying flooding “trouble spots” and key infrastructure and transportation links
impacted by floodwaters (Chapter 10).

4
3 REVIEW OF AVAILABLE INFORMATION
3.1 Overview
A range of data were made available to assist with the preparation of the Gibbergunyah Creek
Flood Study. This included previous reports, hydrologic data and GIS data.
A description of each dataset along with a synopsis of its relevance to the flood study is
summarised below.
3.2 Previous Investigations
3.2.1 Lot 2 Bessemer Street, Mittagong – Flood Study (2009)
The ‘Lot 2 Bessemer Street, Mittagong – Flood Study’ (2009), was prepared by Bewsher
Consulting for Wingecarribee Shire Council. The study was commissioned to define flood
behaviour across the site of a proposed Family Community Centre that is traversed by Iron
Mines Creek (a tributary of Gibbergunyah Creek). The location of the site is shown on Figure 2.
The report incorporates a significant amount of information about the piped and open channel
drainage system in and around the site. This includes the location of stormwater pipes and pits,
pipe and culvert dimensions, pit invert elevations and pit types/lintel lengths.
As part of the investigation, a hydrologic model of the catchment draining to the Community
Centre site was developed using the Drains software. The hydrologic model was used to
simulate a range of design floods ranging from the 1 year ARI flood up to and including the
PMF. The results of the hydrologic modelling determined that the critical storm duration at the
site varied between 25 minutes and 2 hours.
Peak design discharges were extracted from the report at select locations and are reproduced
in Table 1. As shown in Table 1, the peak discharge downstream of Lot 2 is lower than the
corresponding peak discharge upstream of the site during the 1 Year ARI flood. This is most
likely associated with the flood storage that is afforded across the site during smaller storms.
Table 1 Peak design discharges extracted from Lot 2 Bessemer Street, Mittagong – Flood Study (2009)
Location
Peak Discharge (m3/s)
1 Yr ARI 5 Yr ARI 20 Yr ARI 50 Yr ARI 100 Yr ARI PMP
Bessemer Street railway
underpass 1.79 4.99 7.55 8.92 10.2 38.8
Bowral Road 1.08 7.27 11.6 13.7 16.0 63.4
A 2-dimensional hydraulic computer model was also developed as part of the study. The model
was developed using the TUFLOW software and extends from Railway Parade (upstream of the
railway line) to downstream of Bowral Road. The model was developed using a 2 metre grid

Gibbergunyah Creek Flood Study
5
size to represent the ground surface topography. All stormwater pipes and conduits were also
included as a 1-dimensional network inserted beneath the 2-dimensional domain. Accordingly,
the TUFLOW model provides a good description of the interaction between surface and
subsurface flows and the distribution of flows across the site and along the adjoining roadways.
It was noted, however, that none of the main channels were represented using a 1-dimensional
domain. Accordingly, the conveyance capacity of the relatively narrow channels may be
underestimated using the comparatively course 2 metre grid cells instead of a more detailed 1-
dimensional channel section.
The TUFLOW model was used to produce information on peak design flood levels, floodwater
depths, flow velocities and provisional flood hazard. Additional simulations were also
completed to assess the sensitivity of peak 100 year ARI results to variations in blockage of the
stormwater system.
The report notes that no historic flooding information could be uncovered for the site or the
broader catchment area (i.e., Gibbergunyah Creek catchment). Therefore, neither the
hydrologic or hydraulic models could be calibrated. It also notes that the collection of data
within the railway corridor was difficult due to fencing (i.e., access difficulties) and heavy
vegetation (i.e., poor visibility). Accordingly, it recommends that data within the railway
corridor be verified as part of any future flood study.
Although this report only covers a small part of the overall Gibbergunyah Creek catchment, it is
considered that the peak discharges documented in the report could be used to verify peak
discharges generated as part of this study. The TUFLOW model data could also be used to
assist in the development of the hydraulic computer model for this study.
3.2.2 Hydraulic Assessment of Chinamans Creek, Mittagong (2006)
The ‘Hydraulic Assessment of Chinamans Creek, Mittagong’ (2006) was prepared by RHM
Consulting Engineers as part of a ‘Statement of Environmental Effects’ to support a proposed
bulky goods development adjacent to Chinamans Creek at Mittagong. The report was prepared
to quantify the hydraulic impacts of rehabilitating a section of Chinamans Creek immediately
adjoining the proposed development. The development has since proceeded and is now known
as the Highlands Homemaker Centre.
As part of the investigation, a hydrologic model of the Chinamans Creek catchment was
developed using the Watershed Bounded Network Model (WBNM) hydrologic software. The
WBNM model generated a peak 100 year ARI discharge for Chinamans Creek of 24.6 m3/s at
the site. A rational method calculation was also completed and produced a peak 100 year ARI
discharge of 24 m3/s, although the inputs used in these rational method calculations were not
included in the report.
A steady state HEC-RAS hydraulic model of Chinamans Creek was also developed for the study.
The model extended from upstream of the Old Hume Highway to the downstream end of the
development site and incorporated 18 design cross-sections of the proposed creek channel as
well as the Old Hume Highway culvert crossing. A Manning’s ‘n’ of 0.04 was adopted for all
channel segments and an ‘n’ value of 0.05 was adopted for all overbank areas. It is considered
that these ‘n’ values would not be appropriate for contemporary conditions upstream of the
Old Hume Highway (refer Plate 1).

Gibbergunyah Creek Flood Study
6
Plate 1 Chinamans Creek channel upstream of the Old Hume Highway showing dense vegetation in creek
channel and overbank areas (i.e., Manning’s ‘n’ = ~0.1)
The outcomes of the HEC-RAS modelling determined that, with the proposed channel
modifications, the peak 100 year ARI flood extent would be fully contained to the creek. It also
determined that the peak 100 year ARI flood level varied between 596.2 mAHD at the
downstream end of the site up to 602.68 mAHD on the downstream side of the Old Hume
Highway.
As discussed, the vegetation density along Chinamans Creek has increased significantly relative
to the ‘design’ conditions documented in the report. Accordingly, contemporary peak 100 ARI
flood levels, depths and extents are likely to be higher than those documented in this report. In
addition the ‘design’ creek cross-sections do not necessarily reflect ‘as built’ conditions.
Nevertheless, the surveyed details of the Old Hume Highway culvert crossing could be
extracted and used in the hydraulic model developed for this study and the peak discharges
extracted from the hydrologic model could be used to assist in the verification of the hydrologic
model developed for this study.
3.2.3 Bowral Floodplain Risk Management Study and Plan (2005)
The ‘Bowral Floodplain Risk Management Study and Plan’ (2005) was prepared by Bewsher
Consulting for Wingecarribee Shire Council. The study was commissioned to investigate a range
of options that could be potentially implemented to reduce flood damages within the

Gibbergunyah Creek Flood Study
7
Mittagong Creek catchment. The Mittagong Creek catchment is located immediately south of
the Gibbergunyah Creek catchment.
Although this report does not contain any specific flooding information for the Gibbergunyah
Creek catchment, it does incorporate newspaper clippings from ‘The Bowral Free Press’
documenting a large flood that occurred in March 1893. Photos are also provided showing
flooding across different parts of Bowral on:
January, 1915;
March, 1975;
March, 1978;
November, 1985;
August, 1986;
April, 1988;
October, 1999;
February, 2005; and,
June, 2007.
Given the proximity of the Gibbergunyah Creek catchment to the Mittagong Creek catchment,
it is likely that flooding would have also been experienced in the Gibbergunyah Creek
catchment during each of these events.
3.2.4 Catalogue of Conceptual Models for Groundwater-Stream Interaction in Eastern
Australia (2009)
Discussions with Wingecarribee Shire Council staff determined that considerable “base” flow
can originate from the Mount Gibraltar area and enter the various watercourses within the
Gibbergunyah Creek catchment. This anecdotal information appeared to be confirmed based
on the outcomes of a field reconnaissance that was completed on 23rd
May 2012, which
showed flowing water in most tributaries (refer Plate 2) despite less than 0.5 mm of rain falling
in the preceding week.
The presence of base flow within major creeks may reduce the available conveyance (i.e., flow
carrying) capacity of each creek during major storm events, thereby leading to increased
severity of flooding. Accordingly, a review of available literature was completed to identify the
base flow potential across the catchment.
The ‘Catalogue of Conceptual Models for Groundwater-Stream Interaction in Eastern Australia’
(2009), is a technical report prepared by Reid et al for the eWater Cooperative Research Centre.
It was prepared in an effort to estimate exchanges between groundwater and surface water
supplies and predict how these may change with different groundwater and surface water
management techniques across Eastern Australia.
The report incorporates a review of the Upper Nepean catchment, which is located
immediately east of the Gibbergunyah Creek catchment. Therefore, the geologic formations
that extend across the Upper Nepean River also extend into the Gibbergunyah Creek
catchment.

Gibbergunyah Creek Flood Study
8
Plate 2 Priestley Street culvert crossing of Chinamans Creek showing significant base flow
The report notes that three main geologic units extend across the region. This includes
Hawkesbury Sandstone, which forms a major aquifer within the Sydney Basin. The sandstone
layer generally flows from south-south-west to north-north-east, is typically located between
confining geologic layers and follows the local topography (refer Plate 3). However, the
sandstone can be exposed to the surface in areas of sudden topographic changes, such as
Mount Gibraltar, resulting in the aquifer discharging to surface water systems. The report also
states that base flow from aquifer discharge is evident throughout the year, even during
periods of drought.
Accordingly, the report appears to confirm the potential for groundwater flow contributions
from Mount Gibraltar to the Gibbergunyah Creek catchment. Unfortunately, the report does
not provide any information on the magnitude of the potential base flow contributions.
3.3 Hydrologic Data
3.3.1 Historic Rainfall Data
A number of daily read and continuous (i.e., pluviometer) rainfall gauges are located in close
proximity to the Gibbergunyah Creek catchment. The location of each gauge is shown in
Figure 3. Key information for those gauges located within 10 kilometres of the catchment is
summarised in Table 2 and the temporal availability of rain gauge data is provided in Table 3.

Gibbergunyah Creek Flood Study
9
Plate 3 Conceptual diagram of geology and groundwater movement across the Upper Nepean River
catchment (Sydney Catchment Authority, 2006)
Table 2 Available rain gauges in the vicinity of the Gibbergunyah Creek catchment
Gauge
Number Gauge Name
Gauge
Type Owner* Period of Record
Percentage
of Record
Complete
Distance
From
Catchment
(km)
68044 Mittagong (Alfred St) Daily BOM 01/01/1886 -> present 86 2.0
68163 Mittagong (Leicester Park) Daily SCA 01/01/1957 -> 31/12/1970 86 4.9
68102 Bowral (Parry Drive) Cont. BOM 30/11/1992 -> present 87 5.1
68102 Bowral (Parry Drive) Daily BOM 08/10/1961 -> present 98 5.1
68184 Bowral Centennial Road Daily BOM 01/01/1967 ->31/12/1977 93 5.1
68255 Bowral (Orchard St) Daily BOM 09/01/2000 -> present 99 5.2
68033 Mittagong (Kia-Ora) Daily SCA 01/01/1902 -> present 67 5.4
68087 Spring Hill (Warana) Daily BOM 01/01/1959->31/12/1967 72 6.2
68005 Bowral Post Office Daily BOM 01/01/1885 -> 01/01/1965 99 6.4
68157 Yarrow (Boural) Daily BOM 01/01/1912 -> 31/12/1930 99 6.4
68092 Berrima (Hillview) Daily BOM 01/01/1959 -> 31/12/1967 98 7.2
68239 Moss Vale AWS Daily BOM 23/02/2001 -> present 98 8.4
NOTE: * BOM = Bureau of Meteorology, SCA = Sydney Catchment Authority

Gibbergunyah Creek Flood Study
10
Table 3 Temporal availability and percentage of annual record complete for rain gauges in the vicinity of
Mittagong (source: http://www.bom.gov.au/climate/data/)
68044 Mittagong (Alfred Street)
68163 Mittagong (Leicester
Park)
68102 Bowral (Parry Drive)
68184 Bowral Centennial Road
68255 Bowral (Orchard St)
68033 Mittagong (Kia-Ora)
68087 Spring Hill (Warana)
68005 Bowral Post Office
68157 Yarrow (Boural)
68092 Berrima (Hillview)
68239 Moss Vale AWS
The information provided in Tables 2 and 3 indicate that the majority of rain gauges have a
limited record length. Nevertheless, the Mittagong (Alfred St) gauge has over 100 years of daily
rainfall records. The Mittagong (Kia-Ora) gauge also provides over 100 years of daily rainfall
records, however, the record is only 67% complete. Table 2 also shows that no continuous
rainfall data are available prior to November 1992.
A review of the available rainfall data was completed to identify when significant historic
rainfall events have occurred and, consequently, when flooding may have been experienced in
the catchment. The details of the top ten rainfall events are summarised in Table 4.
As shown in Table 4, the most significant rainfall event on record occurred in March 1893,
where nearly 300 mm of rain fell within a 24 hour period. This concurs with a large reported
flood documented in ‘The Bowral Free Press’ (refer Section 2.2.2).
The most significant recent rainfall events occurred in March 1978 and August 1990.
3.3.2 Historic Streamflow Data
There are no stream gauges located within the Gibbergunyah Creek catchment. The closest
stream gauge is operated by the Sydney Catchment Authority and is located downstream of the
Braemer Sewage Treatment (Station 2122791). However, this gauge is located in an adjoining
catchment approximately 5 kilometres away from Gibbergunyah Creek and only has a limited
record length (~10 years, of which, 11% is missing). Accordingly, this gauge was not considered
suitable for use in this study.

Gibbergunyah Creek Flood Study
11
Table 4 Significant Historic Rainfall Events
Rank Year Day/Month Rainfall in 24 hour
Period (mm)
Rainfall in Preceding 24
Hour Period (mm)
Rainfall in Following 24
Hour Period (mm)
1 1893 5th
March 297 15 3.8
3 1950 18th
January 159 0 5.6
7 1964 11th
June 133 120# 11
5 1966 8th
November 136 27 30
9 1975 20th
June 121 3.4 80
2 1978 19th
March 162 144 109
10 1986 5th
August 118 51 61
4 1990 1st
August 138 73 19
6 1991 10th
June 135 132 58
8 1995 24th
September 123 1.4 26
NOTE: Information in the above table is based upon interrogation of daily rainfall records from Mittagong (Alfred St),
Mittagong (Leicester Park) & Bowral (Parry Drive) rain gauges.
#: this rainfall depth is the accumulated total from the preceding 48 hours
3.4 Topographic Data
3.4.1 Aerial Laser Survey (ALS)
AAM Pty Limited collected Aerial Laser Survey (ALS) across a 124 km2 section of the
Wingecarribee Shire Council Local Government Area on 1st
April 2010. This included a
significant proportion of the Gibbergunyah Creek catchment (refer Figure 3).
The ALS was used as the basis for the development of contours at 0.5 metre intervals as well as
a 1 metre grid-based Digital Elevation Model (DEM). Both of these datasets were provided by
Council for this study.
The ALS has a stated absolute horizontal accuracy of better than 0.55 metres and an absolute
vertical accuracy of better than 0.15 metres (AAM, 2010). Validation of the ALS was completed
using 290 reference points that were surveyed using traditional ground survey techniques. This
included 92 reference points in the Mittagong area. The outcomes of the data validation
determined that the mean difference between ALS and ground surveyed spot heights within
the Mittagong area was less than 2 cm. Therefore, the vertical and horizontal accuracy provided
by the ALS data appears to be suitable for use in this study.
A review of aerial photography indicates that there has been negligible significant developed
across the catchment since the ALS was collected in 2010. As a result, the ALS provides a good
representation of contemporary topography across the catchment and is considered to be
suitable for use in defining topography across the majority of the catchment as part of this
investigation.
However, the ALS does not extend across the entire catchment and the metadata notes that
the ALS data may be less reliable in areas of high vegetation density. In addition, the ALS data
will not pick up the details of topographic and drainage features that are obscured from aerial

Gibbergunyah Creek Flood Study
12
survey techniques, such as culvert obvert elevations. Accordingly, it was necessary to
supplement the ALS data with additional survey to ensure a reliable representation of the
terrain and drainage structures is provided across all areas of the catchment.
3.4.2 10 Metre Contours
Land and Property Information (LPI) ground surface contours at 10 metres intervals were also
provided by Council. The contours extend across all of the Gibbergunyah Creek catchment. The
horizontal and vertical accuracy of the data is not available. However, it is considered that the
contours are suitable for defining the ground surface topography across the steeper areas of
the catchment not covered by the ALS data. The extent of the area covered by the contours
(not including that area already covered by ALS data) is shown in Figure 2.
The ALS data and the 10 metre contours were combined to form a complete Digital Elevation
Model (DEM) of the study area. The DEM is shown in Figure 2.
3.5 GIS Data
A number of GIS data layers were also provided by Council to assist with the study. This
included:
Aerial Photography;
Stormwater network;
Bridges; and,
Building footprint polygons.
Further detailed information on the GIS layers is provided below.
3.5.1 Aerial Photography
Aerial photography that was captured in 2009 was provided by Council to assist with the
investigation. The imagery is provided at a 0.5 metre pixel size and allowed major features such
as buildings to be identified.
The aerial photography was used to assist with the review of available information (e.g.,
identification of missing buildings). The photography also served as a background layer in the
majority of report figures (refer Flood Study: Volume 2).
3.5.2 Stormwater Network GIS layer
The sub-surface stormwater pipe system plays a significant role in the conveyance of flows
during storm events. Accordingly, it is important to include the trunk stormwater system in any
computer model that is used to define flood behaviour across the Gibbergunyah Creek
catchment.
Two stormwater-related GIS layers were provided by Council. This included:
“Stormwater Nodes”: contains stormwater pit locations. The database was last updated in
October/November 2008 for the Mittagong area. It was noted that only major Council-
owned pits were included (i.e., no pits on privately owned land were incorporated).
“Stormwater Conduits”: contains stormwater pipe / culvert alignments and properties
including conduit type (e.g. pipe, box culvert), material (e.g., concrete), dimensions and
length.

Gibbergunyah Creek Flood Study
13
The extent of the area covered by the stormwater network GIS layers is shown in Figure 2.
Accordingly, most of the information necessary to include the trunk stormwater drainage
system in the hydraulic model is provided in these GIS layers. Nevertheless, some additional
information including pit depths/invert elevations, pit types (e.g., kerb inlet, gully inlet) and
culvert invert elevations are not available in these layers.
3.5.3 Bridges
A bridges GIS layer was provided by Council showing the location of all bridges within the Local
Government Area. A review of this GIS layer showed that, with the exception of the Hume
Highway crossing of Gibbergunyah Creek, no bridges are located within the catchment.
3.5.4 Building Footprint Polygons
A GIS layer containing building footprint polygons for every significant building within the
Gibbergunyah Creek catchment was provided by Council. The building polygons can be used to
define the impediment to flow afforded by buildings across the catchment.
A review of the building polygons relative to 2009 aerial photography showed the layer suitably
described the majority of buildings across the catchment. However, as shown in Plates 4 and 5,
some buildings were not included in the building polygons layer. Therefore, additional
polygons were digitised by hand based on the 2009 aerial photography to ensure all buildings
were defined.
3.6 Community Consultation
A key component of the flood study involves development and calibration of hydrologic and
hydraulic computer models. Calibration involves using the computer models to replicate floods
that have occurred in the past. Council holds minimal information on historic flooding across
the Gibbergunyah Creek catchment.
However, it is likely that residents and business owners within the Gibbergunyah Creek
catchment may have witnessed past flood events. Accordingly, several community consultation
devices were developed to inform the community about the study and to obtain information
from the community about their past flooding experiences. Further information on each of
these consultation devices is provided below.
3.6.1 Flood Study Website.
A flood study website was established for the duration of the study. The website address is:
http://www.gibbergunyah.floodstudy.com.au/
The website was developed to provide the community with detailed information about the
study and also provide a chance for the community to ask questions and complete an online
questionnaire (this online questionnaire was identical to the questionnaire distributed to
residents and business owners, as discussed in Section 3.6.2).

Gibbergunyah Creek Flood Study
14
Plate 4 Incomplete building polygon in Regent Street, Mittagong
Plate 5 Missing building polygon in Henderson Avenue, Mittagong
Gibbergunyah Creek Flood Study
15
During the course of the study (until December 2012), the website was visited 169 times by 79
unique visitors.
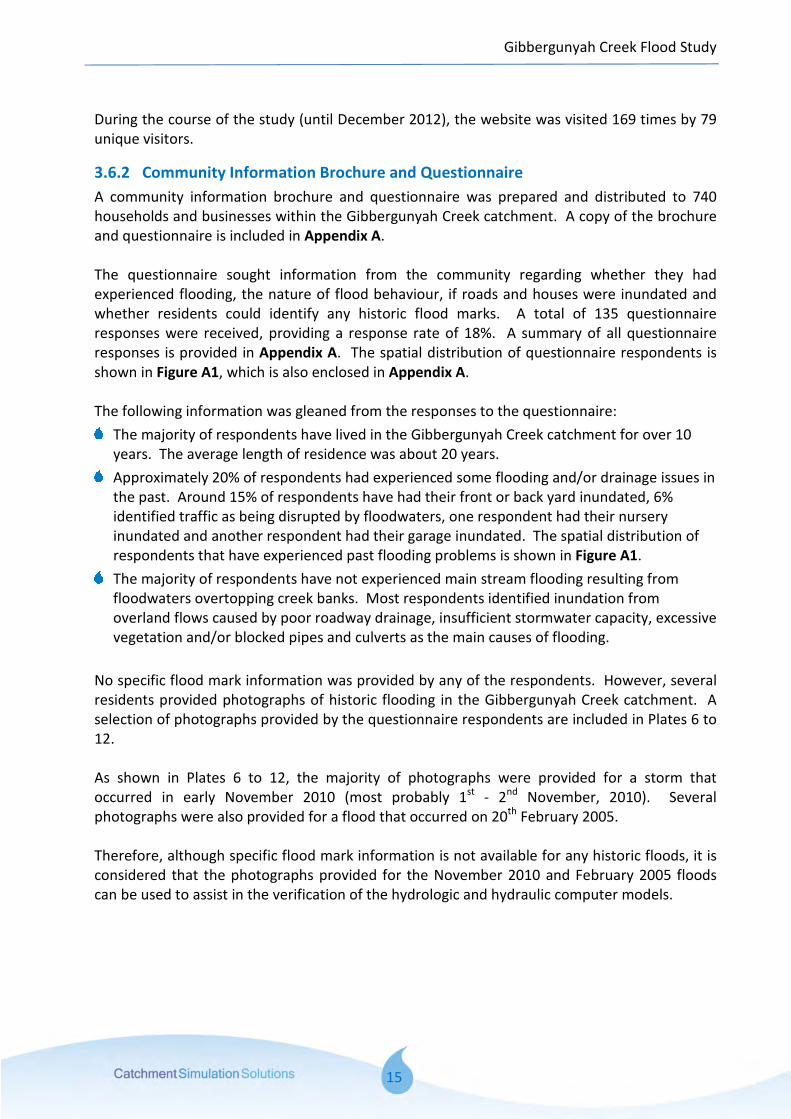
3.6.2 Community Information Brochure and Questionnaire
A community information brochure and questionnaire was prepared and distributed to 740
households and businesses within the Gibbergunyah Creek catchment. A copy of the brochure
and questionnaire is included in Appendix A.
The questionnaire sought information from the community regarding whether they had
experienced flooding, the nature of flood behaviour, if roads and houses were inundated and
whether residents could identify any historic flood marks. A total of 135 questionnaire
responses were received, providing a response rate of 18%. A summary of all questionnaire
responses is provided in Appendix A. The spatial distribution of questionnaire respondents is
shown in Figure A1, which is also enclosed in Appendix A.
The following information was gleaned from the responses to the questionnaire:
The majority of respondents have lived in the Gibbergunyah Creek catchment for over 10
years. The average length of residence was about 20 years.
Approximately 20% of respondents had experienced some flooding and/or drainage issues in
the past. Around 15% of respondents have had their front or back yard inundated, 6%
identified traffic as being disrupted by floodwaters, one respondent had their nursery
inundated and another respondent had their garage inundated. The spatial distribution of
respondents that have experienced past flooding problems is shown in Figure A1.
The majority of respondents have not experienced main stream flooding resulting from
floodwaters overtopping creek banks. Most respondents identified inundation from
overland flows caused by poor roadway drainage, insufficient stormwater capacity, excessive
vegetation and/or blocked pipes and culverts as the main causes of flooding.
No specific flood mark information was provided by any of the respondents. However, several
residents provided photographs of historic flooding in the Gibbergunyah Creek catchment. A
selection of photographs provided by the questionnaire respondents are included in Plates 6 to
12.
As shown in Plates 6 to 12, the majority of photographs were provided for a storm that
occurred in early November 2010 (most probably 1st
- 2nd
November, 2010). Several
photographs were also provided for a flood that occurred on 20th
February 2005.
Therefore, although specific flood mark information is not available for any historic floods, it is
considered that the photographs provided for the November 2010 and February 2005 floods
can be used to assist in the verification of the hydrologic and hydraulic computer models.

Gibbergunyah Creek Flood Study
16
Plate 6 Flooding across southern end of Gibbergunyah Lane during November 2010 event
Plate 7 Flooding across Gibbergunyah Lane during November 2010 event

Gibbergunyah Creek Flood Study
17
Plate 8 Flooding in the vicinity of John Street, Mittagong during November 2010 event
Plate 9 Flooding across John Street, Mittagong during November 2010 event

Gibbergunyah Creek Flood Study
18
Plate 10 Flooding across Bowral Lane, Welby during February 2005 event
Plate 11 Flooding across back yard at Lot 8 Bowral Lane, Welby during February 2005 event

Gibbergunyah Creek Flood Study
19
Plate 12 Floodwaters along unnamed tributary at rear of properties fronting Bowral Lane, Welby during
February 2005 event
3.7 Cross-Section and Structure Survey
To enable development of a hydraulic model capable of providing reliable estimates of flood
behaviour within the study area it was necessary to collect additional survey across the
Gibbergunyah Creek catchment. Consulting surveyors, Lawrence Group, collected the
additional survey information.
The additional data collection comprised the survey of 65 creek cross-sections and 38 hydraulic
structures (i.e., culverts and bridges). The location of cross-sections and structures that were
surveyed is shown in Figure 4.

20
4 HYDROLOGY
4.1 General
The most common method of quantifying flood flows (i.e., discharges) at a particular location in
a catchment is via a hydrologic computer model. A hydrologic model is a mathematical
representation of the various processes that transform rainfall into runoff. The model is
developed so that it incorporates key hydrologic characteristics of the catchment such as area,
slope and roughness. The model can then be used to simulate the transformation of rainfall
into runoff for either historic or statistically derived (i.e., design) rainfall.
The XP-RAFTS software was used to develop a hydrologic computer model of the Gibbergunyah
Creek catchment. XP-RAFTS is a lumped hydrologic computer model that is developed by XP
Software (2009) and is used extensively across Australia for deriving discharge estimates. The
following sections provide a summary of how the model was developed, the adopted input
parameters and the outcomes of the model verification.
4.2 Hydrologic Model Development
4.2.1 Subcatchment Parameterisation
The Gibbergunyah Creek catchment was subdivided into 299 subcatchments based on the
alignment of major flow paths, key topographic divides and the location of stormwater pipes
and pits. The subcatchments were delineated with the assistance of the CatchmentSIM
software (Catchment Simulation Solutions, 2011) using a 2 metre Digital Elevation Model (DEM)
developed using ALS and contour data. The final subcatchment layout is presented in Figure 5.
The Gibbergunyah Creek catchment includes significant urban areas that are relatively
impervious. Urbanisation effectively separates the catchment into two hydrologic systems,
i.e.,:
rapid rainfall response and low infiltration potential across impervious areas; and,
slower rainfall response and high infiltration potential across pervious areas.
In recognition of the differing characteristics of the two hydrologic systems, each XP-RAFTS
subcatchment was subdivided into two sub-areas. The first sub-area was used to represent the
pervious sections of the subcatchment and the second sub-area was used to represent the
impervious sections of the subcatchment. The division of each subcatchment into pervious and
impervious sub-areas allows different loss rates and roughness coefficients to be specified,
thereby providing a more realistic representation of rainfall-runoff processes from the two
different hydrologic systems.
Key hydrologic properties including area and average vectored slope were calculated
automatically for each subcatchment using CatchmentSIM.

Gibbergunyah Creek Flood Study
21
The catchment was also subdivided into different land use types based on 2009 aerial imagery.
Percentage impervious and Manning’s ‘n’ values were assigned to each land use and are
summarised in Table 5. The percentage impervious and Manning’s ‘n’ values were
subsequently used to calculate weighted average percentage impervious and ‘n’ values for each
subcatchment. The final subcatchment parameters are provided in Appendix B.
Table 5 Adopted Impervious Percentage and Manning’s ‘n’ Values for Hydrologic Model
Land Use Description Manning’s ‘n’ Impervious
(%)
Short grass with isolated trees 0.035 5
Long grass with isolated trees 0.045 2
Light tree coverage 0.050 2
Medium density tree coverage 0.075 2
Dense stand of trees 0.100 2
Rock outcrops 0.040 80
Roadway pavement 0.016 100
Concrete surfaces 0.015 100
Car parks 0.022 100
Water bodies 0.030 100
Railway corridor 0.060 50
Buildings/roof area 0.025 100
4.2.2 Stream Routing
In addition to local subcatchment runoff, most subcatchments will also carry flow from
upstream catchments along the main watercourses. The flow along the watercourses in XP-
RAFTS is represented using a “link” between successive subcatchment “nodes”.
“Routing” type links were used to represent the routing of runoff along the main watercourses
into downstream subcatchments. The routing links employ Muskingum-Cunge routing
procedures and require a representative cross-section, slope, length and Manning’s ‘n’ values
to be defined for each channel reach. Cross-sections were extracted from the available ALS
data and main stream slopes and lengths were calculated automatically by CatchmentSIM.
Manning’s ‘n’ values for the main channel and overbank areas were defined by hand based on
inspection of 2009 aerial photography in conjunction with the Manning’s ‘n’ values listed in
Table 5.
4.2.3 Rainfall Loss Model
During a typically rainfall event, not all of the rain falling on a catchment is converted to runoff.
Some of the rainfall may be intercepted and stored by vegetation, some may be stored in small
depression areas and some may infiltrate into the underlying soils.
To account for rainfall “losses” of this nature, the hydrologic model incorporates a rainfall loss
model. For this study, the “Initial-Continuing” loss model was adopted, which is recommended
in ‘Australian Rainfall and Runoff – A Guide to Flood Estimation’ (Engineers Australia, 1987) for
Eastern NSW.

Gibbergunyah Creek Flood Study
22
This loss model assumes that a specified amount of rainfall is lost during the initial
saturation/wetting of the catchment (referred to as the ‘Initial Loss’). Further losses are
applied at a constant rate to simulate infiltration/interception once the catchment is saturated
(referred to as the ‘Continuing Loss Rate’). The initial and continuing losses are effectively
deducted from the total rainfall over the catchment, leaving the residual rainfall to be
distributed across the catchment as runoff.
Initial and continuing losses were applied based on standard design values documented in
‘Australian Rainfall and Runoff – A Guide to Flood Estimation’ (Engineers Australia, 1987) and
are summarised in Table 6.
Table 6 Adopted XP-RAFTS Rainfall Losses for Calibration Simulations
Land Use Description
February 2005 Event November 2010 Event
Initial Loss
(mm)
Continuing Loss
(mm/hr)
Initial Loss
(mm)
Continuing Loss
(mm/hr)
Pervious 10 2.5 20 2.5
Impervious 1.5 0 1.5 0
4.2.4 Flood Storage Basins
There are no dedicated flood detention basins located within the Gibbergunyah Creek
catchment. However, Lake Alexandra would likely attenuate downstream flows during
significant storm events by temporarily storing runoff from the upstream catchment. Due to
the potential for the lake to impact on downstream flows, it was incorporated as a flood
storage basin in the XP-RAFTS model.
The representation of flood storage basins in XP-RAFTS requires the outflow and storage
characteristics of the basin to be defined. The outflow characteristics were specified using a
stage-discharge relationship and the storage characteristics were defined using a stage-storage
relationship. The stage-storage relationship was developed using the 2009 ALS data. It was
assumed that no storage was provided below the permanent water level of the lake.
As shown in Plate 13, the Lake Alexandra outlet is quite complex, incorporating 4 separate
outlet structures:
A dual span pedestrian bridge; and,
Three separate pipe outlets (two pipes located adjacent to the pedestrian bridge and a
separate pipe located near the north-eastern corner of the lake).
The stage-discharge relationship for the outlet was developed with the assistance of the HY-8
software (version 7.2), which automates the hydraulic calculations for pipes, culverts and weirs
in accordance with ‘Hydraulic Design Series Number 5 – Hydraulic Design of Highway Culverts’
(U.S. Federal Highway Administration, 2005). The stage-storage and stage-discharge
relationships that were developed for Lake Alexandra are provided in Figure B1, which is
enclosed in Appendix B.

Gibbergunyah Creek Flood Study
23
Plate 13 Main outlet structure for Lake Alexandra
4.3 Hydrologic Model Calibration
4.3.1 General
Hydrologic computer models are typically developed using parameters that are not known with
a high degree of certainty including imperious proportions, rainfall loss rates and catchment
roughness. Accordingly, the model should be calibrated using rainfall and stream flow data
from historic flood events to ensure the adopted parameters are producing reliable estimates
of rainfall-runoff behaviour.
Recorded stream flow records are required to perform a meaningful hydrologic model
calibration. As discussed in Section 3.3.2, no stream gauges are located within the catchment.
Therefore, the lack of stream flow data means that a comprehensive calibration of the
hydrologic model cannot be completed. Nevertheless, it is possible to complete a ‘pseudo-
calibration’ by routing historic rainfall through the hydrologic model and then routing the
resultant discharge hydrographs through the hydraulic model. Peak flood extents and depths
produced by the hydraulic model can then be compared against recorded flood extents / flood
photographs to verify the combined performance of the hydrologic and hydraulic models.
Calibration is achieved by adjusting hydrologic and/or hydraulic inputs parameters until the

Gibbergunyah Creek Flood Study
24
recorded flood depths and extents are reproduced by the hydraulic model as closely as
possible.
As discussed in Section 3.6.2, photographs of floods that occurred in February 2005 and
November 2010 were provided by several residents. Accordingly, these events were selected
for the purposes of model calibration / verification.
As a joint calibration was performed using both the hydrologic and hydraulic models, the
hydrologic model calibration should be read in conjunction with the hydraulic model
calibration, which is documented in Section 5.3.
4.3.2 Rainfall Data
Continuous rainfall data are required to define the temporal (i.e., time-varying) distribution of
rainfall in the hydrologic computer model for the nominated calibration / verification event.
There is one continuous rainfall gauge located near the Gibbergunyah Creek catchment that has
records from 1992 onwards (i.e., Bowral (Parry Road) gauge). Accordingly, continuous rainfall
data are available for the February 2005 and November 2010 events.
There are also several daily read rainfall gauges located in close proximity to the catchment.
The daily read rainfall records can be used to provide an indication of the spatial variation in
rainfall during the historic event. Accordingly, these gauges provide sufficient information to
describe the spatial variation in rainfall during both events.
4.3.3 Results of Calibration and Verification Simulations
February 2005 Simulation
The rainfall pluviograph for the Bowral (Parry Road) gauge for the February 2005 event is
enclosed in Appendix C. A review of the rainfall records indicates that approximately 45 mm of
rain fell over a 10 hour period during the 2005 event. A review of intensity-frequency-duration
data indicates that this is slightly less than a 1 year ARI event.
Accumulated daily rainfall totals for each rainfall gauge that was operational during the 2005
event are provided in Figure 6. As shown in Figure 6, four rainfall gauges were operational
during the 2005 event (i.e., 1 pluviometer and 3 daily read gauges).
The accumulated daily rainfall totals were also used to develop a rainfall isohyet map for the
2005 event, which is also included on Figure 6. The isohyet map shows the spatial variation in
daily rainfall depths in the vicinity of the Gibbergunyah Creek catchment for the 2005 event.
The isohyet map indicates that there was minimal spatial variation in rainfall across the
Gibbergunyah Creek catchment during the 2005 event. Total daily rainfall depths across the
Gibbergunyah Creek catchment are estimated to vary between 39 mm and 41 mm.
Accordingly, it was considered that application of a uniform daily rainfall depth of 40mm across
the Gibbergunyah Creek catchment would provide a reasonable estimate of the average depth
of rainfall across the catchment.
The Bowral (Parry Road) pluviometer was used to describe the temporal distribution of rainfall
across the 24 hour period for the 2005 event.

Gibbergunyah Creek Flood Study
25
A review of the daily read rainfall records indicates the February 2005 event was preceded by
between 5 and 10 mm of rainfall. Therefore, the catchment would have been wet at the start
of the main storm event. Accordingly, an initial loss at the lower end of the suggested
‘Australian Rainfall and Runoff’ range was applied to pervious areas for the 2005 event. A
summary of the adopted initial losses and continuing loss rates is provided in Table 6.
A summary of peak discharges that were generated by the XP-RAFTS model for the February
2005 simulation is provided in Appendix C.
The discharges generated by the XP-RAFTS model were subsequently input into the TUFLOW
hydraulic model to simulate February 2005 flood event. Further information regarding the
TUFLOW model setup and the outcomes of the 2005 flood simulation are provided in Section 5.
November 2010 Simulation
Available rainfall records indicate that approximately 50 mm of rain fell over a 12 hour period
during the November 2010 event. A review of intensity-frequency-duration data indicates that
this rainfall intensity is roughly equivalent to a 1 year ARI event (i.e., slightly more severe than
the 2005 event). The pluviograph for the Bowral (Parry Road) gauge for the November 2010
event is enclosed in Appendix C.
Accumulated daily rainfall totals for the November 2010 event for each rainfall gauge are
provided in Figure 7. The accumulated daily rainfall totals were used to develop a rainfall
isohyet map, which is also included on Figure 7. The isohyet map shows that accumulated daily
rainfall across the catchment varied between 49 mm and 52 mm. Accordingly, there was
negligible spatial variation in rainfall across the catchment. Therefore, a constant accumulated
rainfall depth of 50.5 mm was adopted and applied uniformly across the catchment.
The Bowral (Parry Road) gauge was used to describe the temporal distribution of rainfall across
the 24 hour period for the November 2010 event.
A review of the daily read rainfall records indicates the November 2010 event was preceded by
negligible rainfall. Therefore, the catchment would have been relatively dry at the start of the
main storm event. Accordingly, a higher initial loss of 20 mm was applied to the 2010 event to
reflect additional losses associated with the initial saturation of the catchment. A summary of
the adopted continuing loss rates is provided in Table 6.
A summary of peak discharges that were produced by the XP-RAFTS model for the November
2010 simulation is provided in Appendix C.
The discharges generated by the XP-RAFTS model were subsequently input into the TUFLOW
hydraulic model to simulate the distribution of flows during the November 2011 event. Further
information regarding the TUFLOW model setup and the outcomes of the 2011 flood simulation
are provided in Section 5.

26
5 HYDRAULICS
5.1 General
Hydraulic computer models are the preferred method of simulating flood behaviour through a
particular area of interest. They can be used to predict flood characteristics such as peak flood
level and flow velocity and the results of the modelling can also be used to define the variation
in flood hazard and hydraulic categories across the study area.
The TUFLOW software was used to develop a hydraulic computer model of the Gibbergunyah
Creek catchment. TUFLOW is a fully dynamic, 1D/2D finite difference model developed by BMT
WBM (2012). It is used extensively across Australia to assist in defining flood behaviour.
The following sections describe the model development process as well as the outcomes of the
model calibration and verification.
5.2 Hydraulic Model Development
5.2.1 Model Extent
A linked 1-dimensional/2-dimensional hydraulic model of the creek, floodplain, stormwater
network and overland flow system was developed for the Gibbergunyah Creek catchment using
the TUFLOW software. The model extends across all of the Gibbergunyah Creek catchment
downstream to its confluence with the Nattai River. The extent of the hydraulic model is
shown in Figure 8.
The TUFLOW software uses a uniform grid to define the spatial variation in topography and
hydraulic properties (e.g., Manning’s ‘n’) across the 2D model domain. A 2 metre grid size was
adopted for this study. The 2 metre grid size is considered to provide a reasonable
representation of the variation in terrain, while ensuring simulation times are kept to a
reasonable level and the TUFLOW software is applied appropriately.
A dynamically linked 1-dimensional (1D) network was embedded within the 2D domain to
represent areas that would not be well represented by the 2 metre grid (e.g., narrow creek
channels). The sub-surface piped stormwater system was also represented as a separate 1D
domain. The stormwater pipes were inserted underneath the 2D domain allowing
representation of the conveyance of flows by the stormwater system below ground as well as
simulation of surficial flows in 2D once the capacity of the stormwater system is exceeded. The
extent of the 1D (i.e., channel and stormwater pipe system) and 2D model domains are shown
in Figure 8.
5.2.2 Model Topography
Elevations were assigned to grid cells within the 2D domain based on the Digital Elevation
Model derived from ALS data and contours. As the ALS data was collected in 2009, the terrain
representation in TUFLOW is representative of topographic conditions at that time. That is, any
topographic modifications completed since 2009 will not be reflected in the model. A review of
recent aerial photography indicates there has been negligible large topographic modifications

Gibbergunyah Creek Flood Study
27
across the catchment since the ALS data was collected. Therefore, the ALS is considered to
provide a reliable representation of contemporary topographic conditions across the majority
of the catchment.
It should be noted that the ALS data does not extend across all of the Gibbergunyah Creek
catchment. Accordingly, the topography across some areas is based on less detailed and less
reliable contour information. However, this typically only impacts on steeper, undeveloped
sections of the catchment.
The elevations assigned to grid cells located within building footprints were elevated by
0.3 metres based on the assumption that the floor level of houses will typically be elevated
above the natural ground surface.
The topography within the surficial 1D domain was defined using surveyed cross-sections. This
was also supplemented with cross-sections extracted from the ALS is areas that were not
obstructed by vegetation. The details of culverts were assigned based on survey information
and the details of the sub-surface piped drainage network were defined based on information
contained within Council’s stormwater asset GIS layer.
5.2.3 Material Types / Manning’s ‘n’ Roughness
The TUFLOW software employs material polygons to define the variation in hydraulic roughness
(i.e., Manning's 'n' values) across a particular study area. 2009 aerial photography was used as
a basis for subdividing the catchment into different material types. Different Manning’s ‘n’
values were assigned to each material to define the resistance to flow afforded by the different
material types.
1D cross-sections, pipes and culverts within the 1D domain of the TUFLOW model also require
the specification of Manning's 'n' values. These values were defined based on field
assessments, survey photography and inspection of 2009 aerial photography.
The adopted materials types and the corresponding Manning's 'n' values are provided in
Table 7.
5.2.4 Culverts/Bridges
Culverts and bridges can have a significant influence on flood behaviour through a particular
study area. For circular or rectangular culverts, the physical dimensions and invert elevations of
the structures were included directly in the TUFLOW model based on the survey information
that was collected. Entry and exit loss coefficients were defined based on default values
provided in the TUFLOW Manual (BMT WBM, 2012). Typically, an entry loss coefficient of 0.5
and an exit loss coefficient 1.0 were adopted for all culverts.
The Gibbergunyah Creek catchment also includes several irregular shaped culvert crossings
(refer Plate 14). The irregular shape of the crossings was defined using a flow height versus
flow width relationship. An entry loss coefficient of 0.5 and an exit loss coefficient of 1.0 was
also adopted for irregular culverts.

Gibbergunyah Creek Flood Study
28
Table 7 TUFLOW Manning's 'n' Roughness Values
Material Description Manning's 'n'
Open space (i.e., grass) 0.035
Rural grasslands / light brush 0.045
Grass with sparse trees 0.050
Grass with medium density trees 0.075
Dense tree coverage 0.100
Rock outcrops 0.040
Roadway pavement 0.016
Concrete surfaces 0.015
Water bodies 0.030
Railway corridor 0.060
Buildings 3.000
Plate 14 Arch culvert with wildlife ledge draining water beneath the railway line
The catchment also includes several bridge crossings (typically single span pedestrian bridges).
The physical dimensions of the bridge were specified using a surveyed cross-section to define
the variable waterway area beneath the bridge deck. Energy losses were defined using a height

Gibbergunyah Creek Flood Study
29
versus loss coefficient relationship that was developed based on procedures outlined in
‘Hydraulics of Bridge Waterways’ (Bradley, 1978). The loss coefficient calculations for each
bridge are included in Appendix D.
5.2.5 Pit/Culvert Blockage
As shown in Plate 15, culverts can be subject to partial blockage. Similarly, stormwater inlets
may also become blocked by debris during the course of a flood. As a result, most stormwater
inlets, pipes and culverts will not operate at full efficiency during most floods. This can increase
the severity of flooding across areas located adjacent to this drainage infrastructure.
Plate 15 Example of vegetation blocking culvert outlet in Gibbergunyah Creek catchment.
In recognition of this, blockage factors were applied to all stormwater inlets and culverts. A
blockage factor of 50% was applied to all culvert crossings with a diagonal dimension of less
than 6 metres in accordance with findings documented by Rigby et al (2002) following the 1998
Wollongong floods. A 50% blockage factor was also applied to all sag stormwater inlets and
20% blockage was applied to on-grade stormwater inlets. The impact of alternate blockage
scenarios on flood behaviour was also analysed as part of the TUFLOW model sensitivity
analysis.
A higher blockage factor was applied to a double pipe culvert that drains beneath Railway
Parade (near Huxley Street). As shown in Plate 16, this culvert incorporates plates across both
culvert openings. In recognition of these plates as well as the potential blockage contribution
from vegetation and debris from the upstream catchment, a blockage factor of 80% was
applied to this culvert.

Gibbergunyah Creek Flood Study
30
Plate 16 Railway Parade culverts showing plates that increase the effective blockage
5.3 Hydraulic Model Calibration
5.3.1 General
A full calibration of the XP-RAFTS hydrologic and TUFLOW hydraulic computer models could not
be completed due to the lack of stream gauging and flood mark data for the Gibbergunyah
Creek catchment. Nevertheless, a joint calibration of the hydrologic and hydraulic models was
attempted to verify the computer models were providing realistic reproductions of past flood
events.
5.3.2 Calibration/Verification Event Selection
As discussed in Section 3.6.2, photographs of floods that occurred in February 2005 and
November 2010 were provided by several residents. Accordingly, these events were selected
for the purposes of model calibration / verification.
As a joint calibration was performed using the hydrologic and hydraulic models, the hydraulic
model calibration should be read in conjunction with the hydrologic model calibration
previously discussed in Section 4.3.
5.3.3 Model Boundary Conditions
Upstream Boundary Conditions
Upstream boundary conditions define the spatial variation in flows with respect to time across
the hydraulic model domain. Inflows to the TUFLOW hydraulic model were defined using 'local'

Gibbergunyah Creek Flood Study
31
discharge hydrographs (representing flows from the local subcatchments only) extracted from
the XP-RAFTS hydrologic modelling discussed in Section 4.3.
For those XP-RAFTS subcatchments containing stormwater pits, local inflows were distributed
equally to the surface of all pits. For those subcatchments not containing stormwater pits, local
inflows were applied to the lowest point within each sub-catchment.
Downstream Boundary Conditions
Hydraulic computer models also require the adoption of a suitable downstream boundary
condition in order to reliably define flood behaviour throughout the area of interest. The
downstream boundary is typically defined as a known water surface elevation (i.e., stage).
As shown in Figure 8, the downstream boundary of the TUFLOW model is located at the
confluence of Gibbergunyah Creek with the Nattai River. Accordingly, the downstream water
elevation will be governed by the water surface elevation within the Nattai River at the time of
the flood.
Unfortunately, no stream gauges or automatic water level recorders are located along the
Nattai River in the vicinity of Gibbergunyah Creek to provide an indication of water levels during
the 2005 and 2010 floods. In the absence of historic Nattai River water level information, a
“normal depth” boundary was applied at the downstream end of the Gibbergunyah Creek
TUFLOW model. This approach assumes that the downstream water level is influenced only by
the geometry, roughness and slope of the Gibbergunyah Creek channel. Given the relatively
steep slope of the downstream reaches of the Gibbergunyah Creek channel, it is considered
that any uncertainties associated with the downstream boundary condition should not impact
on hydraulic model results across the “built up” sections of the catchment where historic flood
photographs are available.
5.3.4 Results of Calibration and Verification Simulations
February 2005 Simulation
Calibration of the TUFLOW hydraulic model was attempted based on three photographs that
were provided of the Bowral Lane, Welby area during the February 2005 event. The verification
was undertaken by routing the discharge hydrographs generated by the XP-RAFTS model for
the 2005 event through the TUFLOW model and adjusting roughness parameter values until the
model provided a reasonable reproduction of the extent and depth of floodwater depicted in
the photographs.
The roughness values listed in Table 7 were adopted for the 2005 flood simulation. All
roughness parameter values listed in Table 7 are within reasonable limits.
The simulated extent and depth of inundation during the February 2005 event is provided in
Figure 9. Figure 9 also incorporates velocity vector arrows, which show the direction and speed
of movement of the floodwaters, as well as flood level contours, which indicate the maximum
height (i.e., stage) the floodwaters reached during the flood (relative to Australian Height
Datum).
The three photographs that were used as the basis for the model calibration are included in
Figures 9.9 and 9.10. The photographs provided in Figures 9.9 and 9.10, indicate that during
the 2005 event floodwaters travelled along Bowral Lane to a low point in the roadway profile

Gibbergunyah Creek Flood Study
32
near Lot 8 Bowral Lane. At this location, the water ponded until it started to discharge down
the driveway of Lot 8, surrounding the residence to a depth of 50-100 mm before eventually
draining into an unnamed tributary at the rear of the property.
The flood behaviour shown in Figures 9.9 and 9.10 generally replicates the available
photographic evidence. In particular, it shows water accumulating along Bowral Lane, flowing
south and surrounding some residential dwellings (the depths of inundation are typically
around 50-100 mm). The model results also show the unnamed tributary at the rear of the
property flowing at close to bank-full capacity, which is also consistent with the available
photographs.
Overall, the TUFLOW model is considered to be providing a realistic representation of flood
behaviour across the Bowral Lane, Welby area during the February 2005 flood.
November 2010 Simulation
The TUFLOW hydraulic model was also verified using four photographs for a flood that occurred
in November 2010. The photographs show floodwater depths and extents across
Gibbergunyah Lane and John Street, Mittagong. The verification was completed by routing the
discharge hydrographs generated by the XP-RAFTS model for the 2010 event through the
TUFLOW model while retaining the same roughness parameter values that were adopted for
the 2005 calibration simulation (refer Table 7).
Peak floodwater depths, levels and velocities generated by the TUFLOW model for the 2010
simulation are provided in Figure 10. The four photographs that were used as the basis for
verification are shown on Figures 10.6 and 10.10.
Figure 10.6 shows historic flood photographs of John Street, Mittagong. The photographs
indicate that floodwater in this area originates from undeveloped land to the south of John
Street. Water from this undeveloped area travels down a relatively steep slope onto John
Street, where it ponds at a low point in the roadway profile. The floodwaters are sufficiently
deep to cover the entire roadway at this low point, although the depths of inundation appear
to be less than 100 mm.
Figure 10.10 shows historic flood photographs at the southern end of Gibbergunyah Lane,
Mittagong. They show water ponded behind the small embankment formed by Gibbergunyah
Lane. The depths of inundation appear to be between 100 and 200 mm upstream of the
roadway. Floodwaters overtop the very southern end of Gibbergunyah Lane to a depth of
approximately 50 mm.
The depths and extents of inundation produced by the TUFLOW model appear to provide a
reasonable reproduction of the extents and depths of inundation shown in all four
photographs. Accordingly, the TUFLOW model is considered to be providing realistic estimates
of historic flood behaviour for the November 2010 flood.
5.3.5 Additional Model Verification
Figures 9 and 10 also incorporate points corresponding to locations where community
questionnaire responses were received. These locations were colour-coded based on whether
the resident had reported flooding or drainage problems as part of the questionnaire response.
Accordingly, it was considered that this information could be compared against the extents of

Gibbergunyah Creek Flood Study
33
inundation for the 2005 and 2010 events to provide an additional means of verifying the model
performance. That is, if the extents of inundation produced by the TUFLOW model coincided
with areas where flooding problems have been reported, it would provide additional
confidence that the model was providing a reasonable reproduction of past floods.
It should be noted that in a lot of instances the exact dates of the flooding problems were not
specified. Accordingly, it is not known whether the reported flooding problems occurred in
2005 or 2010. In addition, the locations are based on the address provided by the respondent
and may not reflect the actual location of the reported flooding “trouble spot”. Nevertheless, it
can provide a general indication of the “reasonableness” of the hydraulic model performance
relative to past flood events.
As shown in Figures 9 and 10, the inundation extents typically coincide with locations where
flooding/drainage problems were reported. There are some areas where inundation is shown
and no flooding problems were reported. However, the depth of inundation across these areas
is typically less than 50 mm and respondents may not have classified these shallow depths of
inundation as flooding.
In general, Figures 9 and 10 indicate that the model is identifying areas were historic flooding
problems have occurred.
5.3.6 Summary
A definitive calibration of the Gibbergunyah Creek XP-RAFTS hydrologic model and TUFLOW
hydraulic model could not be completed due to the lack of historic stream gauging data and
flood marks. Nevertheless, a pseudo calibration and verification of the models was attempted
using historic rainfall data in conjunction with flood photographs provided by members of the
community.
The outcomes of the calibration and verification simulations indicate that the XP-RAFTS
hydrologic model and TUFLOW hydraulic model provides a reliable reproduction of the historic
flood behaviour depicted in the flood photographs. Accordingly, it is considered that the XP-
RAFTS and TUFLOW models are suitable for use in simulating design flood behaviour across the
Gibbergunyah Creek catchment.

34
6 DESIGN FLOOD ESTIMATION
6.1 General
Design floods are hypothetical floods that are commonly used for planning and floodplain
management investigations. Design floods are based on statistical analysis of rainfall and
flood records and are defined by their probability of occurrence. For example, a 100 year
Average Recurrence Interval (ARI) flood is the best estimate of a flood that will likely occur
once every one hundred years, on average.
Design floods can also be expressed by their probability of occurring in a given year. For
example, the 100 year ARI flood can also be expressed as the 1% Annual Exceedance
Probability (AEP) flood. That is, there is a 1% chance of the 100 year ARI flood occurring in
any given year.
It should be noted that there is no guarantee that a 100 year ARI flood will occur just once in
a one hundred year period. It may occur more than once, or at no time at all in the one
hundred year period. This is because design floods are based upon a long-term statistical
average.
The hydrologic and hydraulic computer models were used to derive design flood estimates
for the 5, 10, 20, 50, 100 and 200 year ARI floods, as well as the Probable Maximum Flood
(PMF). The procedures employed in deriving these design flood estimates are outlined in
the following sections.
6.2 Hydrology
6.2.1 Design Rainfall
Design storms for the 5, 10, 20, 50, 100 and 200 year ARI events were derived using
standard procedures outlined in ‘Australian Rainfall and Runoff – A Guide to Flood
Estimation’ (Engineers Australia, 1987). Design rainfall intensities were extracted from
‘Australian Rainfall and Runoff’ and were used in conjunction with design temporal patterns
to describe the temporal variation in rainfall throughout each design storm.
Adopted rainfall intensities for each design storm and duration are summarised in Table 8.
6.2.2 Probable Maximum Precipitation (PMP)
As part of the flood study it was also necessary to define flood characteristics for the
Probable Maximum Flood (PMF). The PMF is estimated by routing the Probable Maximum
Precipitation (PMP) through the hydrologic model. The PMP is defined as the greatest depth
of precipitation that is meteorologically possible for a given duration at a specific location at
a particular time of year.

Gibbergunyah Creek Flood Study
35
Table 8 Design Rainfall Intensities
DURATION
Return Period (Years) / Rainfall Intensity (mm/hr)
5 10 20 50 100 200 PMP
10 mins 57.5 74.6 97.8 112 130 327.8 N/A
15 mins 41.8 54.2 71.2 81.2 94.4 165.1 560
30 mins 33.9 44 57.8 66 76.8 117.9 420
45 mins N/A N/A N/A N/A N/A 95.0 360
1 hour 23 29.9 39.3 44.8 52.2 81 310
90 mins N/A N/A N/A N/A N/A 63.6 267
2 hours 15.1 19.7 25.9 29.5 34.4 53.3 235
2.5 hours N/A N/A N/A N/A N/A N/A 208
3 hours 11.8 15.3 20.1 23 26.7 41.5 190
4 hours N/A N/A N/A N/A N/A N/A 163
5 hours N/A N/A N/A N/A N/A N/A 142
6 hours 7.61 9.9 13 14.9 17.3 27.0 127
12 hours 4.98 6.47 8.5 9.72 11.3 17.6 N/A
24 hours 3.3 4.28 5.62 6.41 7.44 11.5 N/A
48 hours 2.17 2.81 3.66 4.16 4.82 7.3 N/A
72 hours 1.64 2.13 2.76 3.13 3.63 5.5 N/A
NOTE: N/A indicates a design rainfall is not available for the nominated storm duration
PMP depths were derived for a range of different durations for the Gibbergunyah Creek
catchment based on procedures set out in the Bureau of Meteorology's Generalised Short
Duration Method (GSDM) (Bureau of Meteorology, 2003). The GSDM PMP calculations are
included in Appendix E and the PMP intensities are also summarised in Table 8.
6.2.3 Rainfall Loss Model
As discussed in Section 4.2.3, the Initial-Continuing Loss Model was used to simulated
rainfall losses across the catchments in the XP-RAFTS hydrologic model.
The adopted rainfall losses are summarised in Table 9. The adopted rainfall losses for all
design events up to and including the 100 year ARI were consistent with those adopted in
the calibration simulations. In accordance with recommendations in ‘Australian Rainfall and
Runoff’, no rainfall losses were applied for "extreme" events (i.e., events in excess of the 100
year ARI).

Gibbergunyah Creek Flood Study
36
Table 9 Adopted XP-RAFTS Rainfall Losses for Design Simulations
Land Use Description
5,10, 20, 50 and 100 Year ARI 200 Year ARI and PMP
Initial Loss
(mm)
Continuing Loss
(mm/hr)
Initial Loss
(mm)
Continuing Loss
(mm/hr)
Pervious 15 2.5 0 0
Impervious 1.5 0 0 0
6.2.4 Baseflow
As discussed in Section 3.2.4, there is potential for baseflow contributions from the Mount
Gibraltar section of the Gibbergunyah Creek catchment. This may reduce the available flow
carrying capacity of major watercourses across the catchment resulting in more severe
flooding.
Therefore, potential baseflow contributions were estimated based on procedures set out in
the Australian Rainfall and Runoff document titled ‘Revision Project 7: Baseflow for
Catchment Simulation’ (Engineers Australia, 2011). This document allows a ratio of
streamflow peak to the baseflow discharge at the time of the streamflow peak to be
calculated. A summary of the calculated ratios for each design flood is provided in Table 10.
Table 10 Adopted Baseflow Contributions for Design Simulations
Design
Event
(ARI)
Baseflow Under
Peak Storm Flow
Ratio
Peak Storm
Discharge*
(m3/s)
Baseflow at Peak
Storm Discharge*
(m3/s)
Baseflow per Unit
Area
(m3/s/km
2)
5 0.084 88.7 7.5 0.69
10 0.070 110 7.7 0.70
20 0.056 142 8.0 0.73
50 0.049 177 8.7 0.80
100 0.042 210 8.8 0.81
200 N/A 250 8.8 0.81
PMF N/A 1100 8.8 0.81
NOTE: * Peak discharge and associated baseflow discharge are calculated at catchment outlet
Once a ratio is derived it can be used in conjunction with the peak stormflow discharge to
estimate the baseflow discharge at the time of peak storm discharge. The resulting
baseflow discharge estimates are provided in Table 10. A complete listing of baseflow
calculations is provided in Appendix B.
For this study, the baseflow discharge was distributed to each subcatchment in the XP-
RAFTS model based on the contributing subcatchment area. The baseflow per unit area that
was applied to each XP-RAFTS subcatchment for each design flood is summarised in
Table 10.
No information is contained in ‘Revision Project 7: Baseflow for Catchment Simulation’
(Engineers Australia, 2011) for estimation of the baseflow discharge during events greater

Gibbergunyah Creek Flood Study
37
than the 100 year ARI. Therefore, the 100 year ARI baseflow was also applied to the 200
year ARI and PMF events.
6.2.5 Peak Discharges
The XP-RAFTS model was used to simulate the 5, 10, 20, 50, 100, and 200 year ARI design
floods as well as the PMF.
A range of storm durations were modelled for each design storm to establish the critical
storm durations for each Gibbergunyah Creek subcatchment. Peak discharges were
extracted from the XP-RAFTS model for each subcatchment and each storm duration. These
are provided in Appendix F. Peak discharges at key locations throughout the catchment are
also summarised in Table 11.
Table 11 Peak Design Discharges for Existing Conditions
Location
(XP-RAFTS ID)
Peak Discharge (m3/s)
5 Year
ARI
10 Year
ARI
20 Year
ARI
50 Year
ARI
100
Year
ARI
200
Year
ARI
PMF
Thomas Road
(1.13)
Gibbergunyah
Creek 21.1 26.0 34.0 42.5 50.5 58.5 255
Old Hume Highway
(1.17)
Gibbergunyah
Creek 32.4 39.7 51.5 64.1 76.1 88.6 397
Thomas St
(23.03)
Tributary of
Gibbergunyah
Creek
2.15 2.72 3.51 4.30 5.16 5.99 26.1
Old Bowral Rd at
Railway Underpass
(28.07)
Gibbergunyah
Creek 5.63 7.11 9.08 10.9 12.7 14.5 55.1
Thomas St
(28.10)
Tributary of
Gibbergunyah
Creek
7.93 10.2 13.2 15.9 18.6 21.4 88.1
Cook St
(28.11)
Tributary of
Gibbergunyah
Creek
8.39 10.8 13.9 16.8 19.6 22.6 94.5
Old Hume Highway
(28.13)
Tributary of
Gibbergunyah
Creek
14.0 17.2 22.4 27.6 32.3 37.6 171
US Railway
(52.07) Chinamans Creek 13.7 17.6 22.5 27.4 32.0 36.9 139
Bowral Rd
(52.08) Chinamans Creek 13.4 17.0 21.7 26.5 31.0 36.0 139
Priestley St
(52.11) Chinamans Creek 14.3 18.1 23.0 28.0 32.8 37.8 149

Gibbergunyah Creek Flood Study
38
Location
(XP-RAFTS ID)
Peak Discharge (m3/s)
5 Year
ARI
10 Year
ARI
20 Year
ARI
50 Year
ARI
100
Year
ARI
200
Year
ARI
PMF
Old Hume Highway
(52.12) Chinamans Creek 17.6 22.1 27.7 33.8 39.3 45.2 187
Railway Parade
(63.03)
Tributary of
Chinamans Creek 1.96 2.45 3.15 3.86 4.55 5.22 19.0
Brewster St
(63.05)
Tributary of
Chinamans Creek 3.59 4.57 5.9 7.24 8.58 9.95 37.3
US Etheridge St
Retirement Village
(63.06)
Tributary of
Chinamans Creek 4.44 5.63 7.38 9.00 10.6 12.34 46.2
Bessemer St Railway
Underpass
(67.06)
Iron Mines Creek 4.58 5.84 7.51 9.20 10.8 12.36 46.2
Regent Lane
(67.07) Iron Mines Creek 7.69 9.64 12.4 15.1 17.8 20.5 76.6
US RSL Carpark Entry
(67.08) Iron Mines Creek 9.47 11.9 15.2 18.7 22.2 25.6 99.0
DS RSL Carpark Exit
(67.09) Iron Mines Creek 9.91 12.5 15.9 19.6 23.3 26.9 105
Old Hume Highway
(67.09) Iron Mines Creek 9.91 12.5 15.9 19.6 23.3 26.9 105
DS Railway Pde, US
Railway line
(88.04/91.01)
Lake Alexandra 4.22 4.04 5.20 6.20 7.00 8.07 29.3
Main St
(88.05/98.01/97.01) Lake Alexandra 8.69 5.85 7.44 8.78 9.97 11.5 43.9
Edward St
(88.08)
Lake Alexandra 6.60 8.77 11.2 13.5 15.5 17.9 74.6
Alfred St - Upstream
Lake Alexandra entry
(88.09)
Lake Alexandra 7.20 9.56 12.2 14.4 16.7 19.4 83.4
Lake Alexandra Outlet
(88.10) Lake Alexandra 7.77 9.83 12.7 15.5 17.9 20.6 91.6

Gibbergunyah Creek Flood Study
39
Location
(XP-RAFTS ID)
Peak Discharge (m3/s)
5 Year
ARI
10 Year
ARI
20 Year
ARI
50 Year
ARI
100
Year
ARI
200
Year
ARI
PMF
Bendooley St – Welby
(48.02/44.04/47.01)
Gibbergunyah
Creek 5.89 7.36 9.30 11.2 13.1 15.1 53.5
Hume Highway (~DS
extent of model)
(1.31)
Gibbergunyah
Creek 95.3 118 149 184 216 254 1164
The results of the design simulations indicate that the critical storm duration for the
majority of subcatchments varies between 1.5 and 4.5 hours. However, during the PMF, the
critical duration is typically between 15 and 45 minutes.
6.2.6 Verification of Peak Discharges
As a comprehensive calibration of the XP-RAFTS model could not be completed due to a lack
of recorded stream flow data. However, the peak 100 year ARI discharges generated by the
XP-RAFTS model were verified against peak discharges calculated using the Probabilistic
Rational Method (PRM). A complete listing of 100 year ARI XP-RAFTS discharges and PRM
discharges at the outlet of each subcatchment is provided in Appendix G. A comparison
between XP-RAFTS and PRM discharges at key locations across the Gibbergunyah Creek
catchment is also provided in Table 12.
In general, the XP-RAFTS and PRM discharges provided in Appendix G and Table 12 show a
good correlation. The PRM typically predicts slightly lower discharges relative to the XP-
RAFTS model. This is not unexpected as the PRM fails to account for the increased runoff
potential across impervious sections of the catchment.
The peak 100 year ARI discharges predicted by XP-RAFTS and the PRM were also compared
against previous flooding investigations within the catchments. This comparison is
summarised in Table 13.
The comparison shows that the peak 100 year ARI discharge generated by the XP-RAFTS
model at the Bessemer Street railway underpass compares favourably with the peak 100
year ARI discharge documented in the ‘Lot 2 Bessemer Street, Mittagong – Flood Study’
(Bewsher Consulting, 2009). Peak discharges at this location agree to within 5%.
However, the comparison in Table 13 also shows that the XP-RAFTS 100 year ARI discharge
is significantly higher than the 100 year ARI discharge documented in the ‘Hydraulic
Assessment of Chinamans Creek, Mittagong’ (RHM Consulting Engineers, 2006). In this
instance, the XP-RAFTS discharge is nearly 40% higher. As outlined in Section 3.2.2,
calibration and verification of the WBNM hydrologic model was not completed as part of
this study. Although the WBNM model was verified against the Rational Method, the
associated rational method calculations are not included in the report. Therefore the
veracity of this verification cannot be confirmed.

Gibbergunyah Creek Flood Study
40
Table 12 Comparison between Probabilistic Rational Method and XP-RAFTS 100 Year ARI Peak Design
Discharges
Location
(XP-RAFTS ID)
Peak 100 Year ARI Discharge (m3/s)
XP-RAFTS Probabilistic Rational
Method
Old Hume Highway
(1.17) Gibbergunyah Creek 76.1 67.0
Old Bowral Rd at Railway Underpass
(28.07) Gibbergunyah Creek 12.7 11.9
Old Hume Highway
(28.13)
Tributary of
Gibbergunyah Creek 32.3 31.1
Priestley St
(52.11) Chinamans Creek 32.8 30.9
Old Hume Highway
(52.12) Chinamans Creek 39.3 38.5
Brewster St
(63.05)
Tributary of
Chinamans Creek 8.58 8.80
US Etheridge St Retirement Village
(63.06)
Tributary of
Chinamans Creek 10.6 11.6
Bessemer St Railway Underpass
(67.06) Ironmines Creek 10.8 11.4
Old Hume Highway
(67.09) Ironmines Creek 23.3 22.5
Lake Alexandra Outlet
(88.10) Lake Alexandra 17.9 23.6
Hume Highway
(1.31) Gibbergunyah Creek 216 171
Table 13 Comparison between XP-RAFTS Design Discharges and Discharges Documented in Previous
Flooding Investigations
Location
Current Study
(XP-RAFTS)
Previous Studies
Hydraulic Assessment of
Chinamans Ck
(RHM, 2006)
Lot 2 Bessemer St, Flood
Study
(Bewsher, 2009)
Old Hume Highway crossing of
Chinamans Creek 39.3 24.6 -

Gibbergunyah Creek Flood Study
41
Bessemer Street Railway Underpass 10.8 - 10.2
Nevertheless, the outcomes of the calibration and verification and the similarity in
discharges generated by the XP-RAFTS model with the PRM and Bewsher Consulting
discharge estimates indicates that the XP-RAFTS model is producing realistic design
discharge estimates.
6.3 Hydraulics
6.3.1 General
The TUFLOW hydraulic model was used to simulate design flood behaviour across the
Gibbergunyah Creek catchment for the 5, 10, 20, 50, 100, and 200 Year ARI events as well as
the Probable Maximum Flood (PMF).
The procedures employed in developing the design flood estimates are outlined in the
following sections.
6.3.2 Model Boundary Conditions
Flow Boundary Conditions
Flow boundary conditions provide a description of the spatial and time variation of flows
across the hydraulic model domain during each design storm. Inflows to the TUFLOW
hydraulic model were defined using 'local' discharge hydrographs (representing flows from
the local subcatchments only) extracted from the XP-RAFTS hydrologic modelling.
For those XP-RAFTS subcatchments containing stormwater pits, local inflows were
distributed equally to the surface of all pits. For those sub-catchments not containing
stormwater pits, local inflows were applied to the lowest point within each sub-catchment.
Downstream Boundary Conditions
As no definitive design stage information is available for the Nattai River, downstream
boundary conditions for the Gibbergunyah Creek TUFLOW model were defined using a
“normal depth” calculation. That is, the downstream stage was defined based on the
stream geometry and slope as well as the total discharge at the downstream model
boundary.
Given the relatively steep slope of the downstream reaches of the Gibbergunyah Creek
channel, it is considered that any uncertainties associated with the downstream boundary
condition should not impact on hydraulic model results across the “built up” sections of the
catchment.
6.3.3 Design Flood Envelope
The TUFLOW hydraulic model was used to simulate flood behaviour across the
Gibbergunyah Creek catchment for a range of design floods and a range of storm durations.
The model produced information on flood levels, depths and velocities across the
Gibbergunyah Creek catchment for each design flood and each duration.

Gibbergunyah Creek Flood Study
42
As discussed, a range of critical durations are evident across the study area. Therefore, a
single storm duration will not necessarily produce the “worst case” flooding across all
sections of the catchment.
An important outcome of this study was to ensure that the "worst case" flooding conditions
were defined across the entire Gibbergunyah Creek catchment. Therefore, a design flood
envelope was developed for each ARI based on analysis of each storm duration at each
TUFLOW grid cell. This involved extracting and comparing peak flood levels, depths and
velocities at each TUFLOW model grid cell for each simulated duration and the highest
depth, level and velocity at each grid cell was subsequently adopted. It is this design flood
envelope, comprising the worst case depths, velocities and levels at each grid cell that forms
the basis for the results documented in the following sections.
6.3.4 Floodwater Depths, Levels and Velocities
Peak flood levels, depths and velocities for the 5, 10, 20, 50, 100, and 200 Year ARI events as
well as the Probable Maximum Flood (PMF) were extracted from the results of the TUFLOW
model. Peak floodwater depths and velocity vectors are presented in Figures 11 to 17.
Peak flood levels were also extracted from the results of the modelling and are presented in
Table 14 at key locations throughout the Gibbergunyah Creek catchment. The location
identification (ID) numbers can also be referenced by the yellow points in Figures 11 to 17.

Gibbergunyah Creek Flood Study
43
Table 14 Peak Design Floodwater Elevations
ID Location Tributary
Peak Stage (mAHD)
5 Year ARI 10 Year
ARI
20 Year
ARI
50 Year
ARI
100 Year
ARI
200 Year
ARI PMF
1 Thomas Road Gibbergunyah Creek 614.78 614.83 614.90 615.66 615.02 615.08 615.78
2 Old Hume Highway Gibbergunyah Creek 600.82 601.03 601.58 602.03 602.10 602.28 603.18
3 Thomas St Tributary of Gibbergunyah Creek 611.88 613.08 613.09 613.08 613.11 613.10 613.24
4 Old Bowral Rd at Railway
Underpass Gibbergunyah Creek 648.81 648.92 649.11 649.20 649.30 649.40 650.63
5 Thomas St Tributary of Gibbergunyah Creek 611.60 611.68 611.78 611.84 611.91 611.96 612.58
6 Cook St Tributary of Gibbergunyah Creek 603.86 603.91 603.96 603.99 604.02 604.05 604.36
7 Old Hume Highway Tributary of Gibbergunyah Creek 600.48 601.04 601.59 601.98 602.11 602.21 603.17
8 U/S Railway Chinamans Creek 633.64 634.38 635.27 636.01 636.59 637.04 643.75
9 Bowral Rd Chinamans Creek 631.06 632.18 633.34 633.87 634.03 634.11 634.96
10 Priestley St Chinamans Creek 613.61 613.65 613.67 613.74 613.80 613.84 614.33
11 Old Hume Highway Chinamans Creek 602.92 603.01 603.09 603.27 603.49 603.65 604.71
12 Railway Parade Tributary of Chinamans Creek 639.13 639.89 640.00 640.03 640.05 640.07 640.29
13 Brewster St Tributary of Chinamans Creek 615.86 615.87 615.90 615.91 615.93 615.94 616.28
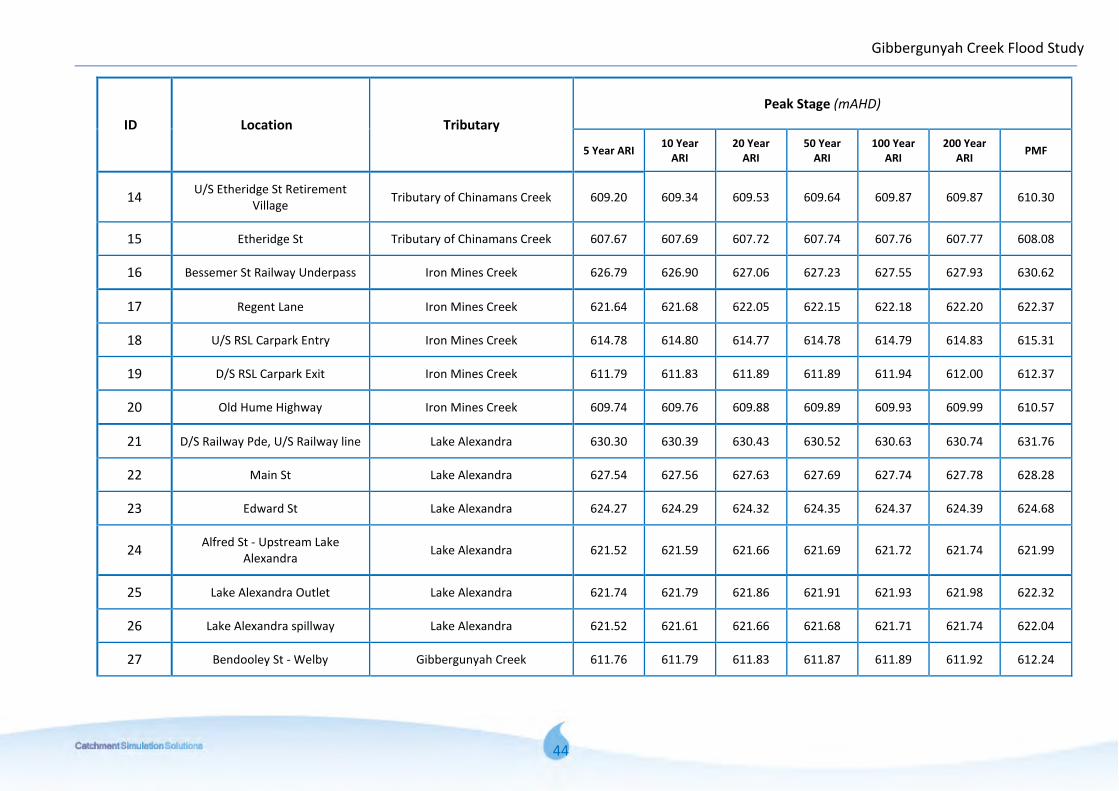
Gibbergunyah Creek Flood Study
44
ID Location Tributary
Peak Stage (mAHD)
5 Year ARI 10 Year
ARI
20 Year
ARI
50 Year
ARI
100 Year
ARI
200 Year
ARI PMF
14 U/S Etheridge St Retirement
Village Tributary of Chinamans Creek 609.20 609.34 609.53 609.64 609.87 609.87 610.30
15 Etheridge St Tributary of Chinamans Creek 607.67 607.69 607.72 607.74 607.76 607.77 608.08
16 Bessemer St Railway Underpass Iron Mines Creek 626.79 626.90 627.06 627.23 627.55 627.93 630.62
17 Regent Lane Iron Mines Creek 621.64 621.68 622.05 622.15 622.18 622.20 622.37
18 U/S RSL Carpark Entry Iron Mines Creek 614.78 614.80 614.77 614.78 614.79 614.83 615.31
19 D/S RSL Carpark Exit Iron Mines Creek 611.79 611.83 611.89 611.89 611.94 612.00 612.37
20 Old Hume Highway Iron Mines Creek 609.74 609.76 609.88 609.89 609.93 609.99 610.57
21 D/S Railway Pde, U/S Railway line Lake Alexandra 630.30 630.39 630.43 630.52 630.63 630.74 631.76
22 Main St Lake Alexandra 627.54 627.56 627.63 627.69 627.74 627.78 628.28
23 Edward St Lake Alexandra 624.27 624.29 624.32 624.35 624.37 624.39 624.68
24 Alfred St - Upstream Lake
Alexandra Lake Alexandra 621.52 621.59 621.66 621.69 621.72 621.74 621.99
25 Lake Alexandra Outlet Lake Alexandra 621.74 621.79 621.86 621.91 621.93 621.98 622.32
26 Lake Alexandra spillway Lake Alexandra 621.52 621.61 621.66 621.68 621.71 621.74 622.04
27 Bendooley St - Welby Gibbergunyah Creek 611.76 611.79 611.83 611.87 611.89 611.92 612.24

Gibbergunyah Creek Flood Study
45
ID Location Tributary
Peak Stage (mAHD)
5 Year ARI 10 Year
ARI
20 Year
ARI
50 Year
ARI
100 Year
ARI
200 Year
ARI PMF
28 Hume Highway Gibbergunyah Creek 534.41 534.55 534.71 534.90 535.11 535.31 537.66
# refer to Figures 11 to 17 for Location ID

46
7 SENSITIVITY ANALYSIS
7.1 General
Hydrologic and hydraulic computer models require the adoption of several parameters that are
not necessarily known with a high degree of certainty. Each of these parameters can impact on
the results generated by the model.
Typically hydrologic and hydraulic computer models are calibrated using recorded rainfall,
stream flow and/or flood mark information. Calibration is achieved by adjusting the
parameters that are not known with a high degree of certainty until the computer models
reproduce the recorded flood information.
As discussed, the XP-RAFTS hydrologic and TUFLOW hydraulic models developed for this study
could not be comprehensively calibrated as there was insufficient recorded stream flow and
flood mark information. However, the models were verified against floods that occurred in
2005 and 2010 and were found to provide a reasonable description of historic flood behaviour.
Nevertheless, it is important to understand how any uncertainties in model input parameters
may impact on the results produced by the model. Therefore, a sensitivity analysis was
undertaken to establish the sensitivity of the results generated by the computer model to
changes in model input parameter values. The outcomes of the sensitivity analysis are
provided below.
7.2 Hydrologic Model
7.2.1 Initial Loss
An analysis was undertaken for the 100 year ARI storm to assess the sensitivity of the results
generated by the XP-RAFTS model to variations in antecedent wetness conditions (i.e., the
dryness or wetness of the land within the catchment prior to the design storm event). A
catchment that has been saturated prior to a major storm will have less capacity to absorb
rainfall. Therefore, under wet antecedent conditions, there will be less “loss” of rainfall and
consequently more runoff.
The variation in antecedent wetness conditions was represented by modifying the adopted
initial rainfall losses in the XP-RAFTS model. The results of the sensitivity analysis are
summarised in Table 15 at selected locations across the Gibbergunyah Creek catchment for the
100 year ARI event. A complete listing of peak discharges for each XP-RAFTS subcatchment is
provided in Appendix H.

Gibbergunyah Creek Flood Study
47
Table 15 XP-RAFTS Sensitivity to Variations in Initial Losses
Location
(XP-RAFTS ID)
Peak 100 Year ARI Discharge (m3/s)
Adopted Initial
Losses
Pervious = 15mm
Impervious = 1.5mm
Wet Antecedent
Conditions
Pervious = 0mm
Impervious = 0mm
Dry Antecedent
Conditions
Pervious = 30mm
Impervious = 3mm
Old Hume Highway
(1.17)
Gibbergunyah
Creek 76.1 88.7 55.6
Old Bowral Rd at Railway
Underpass
(28.07)
Gibbergunyah
Creek 12.7 13.4 9.49
Old Hume Highway
(28.13)
Tributary of
Gibbergunyah
Creek
32.3 37.1 23.9
Priestley St
(52.11) Chinamans Creek 32.8 36.5 24.4
Old Hume Highway
(52.12) Chinamans Creek 39.3 44.6 30.2
Brewster St
(63.05)
Tributary of
Chinamans Creek 2.92 3.08 2.09
US Etheridge St Retirement
Village
(63.06)
Tributary of
Chinamans Creek 10.63 12.42 7.52
Bessemer St Railway
Underpass
(67.06)
Iron Mines Creek 10.8 11.9 7.78
Old Hume Highway
(67.09) Iron Mines Creek 23.3 25.7 16.9
Lake Alexandra Outlet
(88.10) Lake Alexandra 17.9 20.9 14.1
Hume Highway
(1.31)
Gibbergunyah
Creek 216 258 165
The results of the initial loss sensitivity analysis show that decreasing the initial losses would
typically increase the peak discharges generated by the model by up to 20%. However, the
average increase in peak discharge is only predicted to be about 10%.
Increasing the initial loss would decrease peak discharge by 25% (on average). However,
isolated decreases of over 30% are predicted to occur at some isolated locations.

Gibbergunyah Creek Flood Study
48
Therefore, it can be concluded that the XP-RAFTS model is moderately sensitive to changes in
the adopted initial loss. 'Australian Rainfall & Runoff' (Engineers Australia, 1987) suggests
adopting an initial loss of between 10 mm and 30 mm for design flood estimation. The adopted
initial loss of 15 mm is towards the lower end of the suggested range and would, therefore,
provide reasonably conservative design flood discharge estimates.
7.2.2 Continuing Loss Rate
An analysis was also undertaken to assess the sensitivity of the results generated by the XP-
RAFTS model for the 100 year ARI event to variations in the adopted continuing loss rates. The
results of the sensitivity analysis are summarised in Table 16 at selected locations across the
Gibbergunyah Creek catchment. A complete listing of peak discharges for each XP-RAFTS
subcatchment is provided in Appendix E.
Table 16 XP-RAFTS Sensitivity to Variations in Initial Losses
Location
(XP-RAFTS ID)
Peak 100 Year ARI Discharge (m3/s)
Adopted Continuing
Loss Rates
Pervious=2.5mm/hr
Imperv.=0mm/hr
Lower Continuing
Loss Rates
Pervious=1.5mm/hr
Imperv.=0mm/hr
Higher Continuing
Loss Rates
Pervious=3.5mm/hr
Imperv.=1mm/hr
Old Hume Highway
(1.17)
Gibbergunyah
Creek 76.1 76.8 75.3
Old Bowral Rd at Railway
Underpass
(28.07)
Gibbergunyah
Creek 12.7 12.8 12.6
Old Hume Highway
(28.13)
Tributary of
Gibbergunyah
Creek
32.3 32.6 31.9
Priestley St
(52.11) Chinamans Creek 32.8 33.1 32.4
Old Hume Highway
(52.12) Chinamans Creek 39.3 39.7 38.9
Brewster St
(63.05)
Tributary of
Chinamans Creek 2.92 2.94 2.90
US Etheridge St Retirement
Village
(63.06)
Tributary of
Chinamans Creek 10.63 10.71 10.53
Bessemer St Railway
Underpass
(67.06)
Iron Mines Creek 10.8 10.8 10.6
Old Hume Highway
(67.09) Iron Mines Creek 23.3 23.5 23.1
Lake Alexandra Outlet Lake Alexandra 17.9 18.3 17.6

Gibbergunyah Creek Flood Study
49
Location
(XP-RAFTS ID)
Peak 100 Year ARI Discharge (m3/s)
Adopted Continuing
Loss Rates
Pervious=2.5mm/hr
Imperv.=0mm/hr
Lower Continuing
Loss Rates
Pervious=1.5mm/hr
Imperv.=0mm/hr
Higher Continuing
Loss Rates
Pervious=3.5mm/hr
Imperv.=1mm/hr
(88.10)
Hume Highway
(1.31)
Gibbergunyah
Creek 216 218 213
The results of the sensitivity analysis show that the XP-RAFTS model is relatively insensitive to
changes in continuing loss rates. Increasing the adopted continuing loss values is predicted to
decrease peak 100 year ARI discharges by an average of 1%.
Decreasing the adopted loss rates is predicted to increase peak discharges by an average of
about 1.5%.
Therefore, it can be concluded that any uncertainties associated with the adopted continuing
loss rates are not predicted to have a significant impact on the results generated by the XP-
RAFTS model.
7.3 Hydraulic Model
7.3.1 Pipe/Culvert Blockage
As discussed in Section 5.2.5, a default blockage factor of 50% was applied to all minor culverts
in the TUFLOW hydraulic model. A minor pipe/culvert was defined as having a diameter (for
circular pipes/culverts) or diagonal dimension (for rectangular culverts) less than 6 metres.
Additional TUFLOW simulations were completed to determine the impact that alternate
blockage scenarios would have on simulated flood behaviour. Specifically, additional
simulations with no blockage as well as complete blockage of all minor pipes and culverts were
completed.
The TUFLOW model was updated to represent no blockage of minor pipes and culverts and was
used to re-simulate the 100 year ARI flood. Peak floodwater depths and velocity vectors were
extracted from the results of the modelling and are presented in Figure I1.1 to I1.12, which is
enclosed in Appendix I. The predicted extent of inundation for "baseline" conditions is
superimposed on Figure I1 for comparison.
The TUFLOW model was also updated to include 100% blockage of all minor pipes and culverts
and was used to re-simulate the 100 year ARI flood. Peak floodwater depths and velocity
vectors were extracted from the results of the modelling and are presented in Figure I2.1 to
I2.12, which is enclosed in Appendix I. The predicted extent of inundation for "baseline"
conditions is superimposed on Figure I2 for comparison.
Tabulated flood level comparisons are also provided at select location across the catchment in
Table 17.

Gibbergunyah Creek Flood Study
50
Table 17 TUFLOW Sensitivity to Variations in Culvert/Pipe Blockage
Location
ID#
Description of Location
Standard 0% Blockage 100% Blockage
Peak Water
Elevation
(mAHD)
Peak Water
Elevation
(mAHD)
Difference
Peak Water
Elevation
(mAHD)
Difference
1 Thomas Road 615.02 615.01 -0.01 615.01 -0.01
2 Old Hume Highway 602.10 602.42 0.32 602.42 0.32
3 Thomas St 613.11 612.82 -0.29 612.82 -0.29
4 Old Bowral Rd at Railway Underpass 649.30 649.37 0.07 649.37 0.07
5 Thomas St 611.91 612.14 0.23 612.14 0.23
6 Cook St 604.02 604.09 0.07 604.09 0.07
7 Old Hume Highway 602.11 602.41 0.30 602.41 0.30
8 U/S Railway 636.59 636.89 0.30 636.89 0.30
9 Bowral Rd 634.03 634.44 0.41 634.44 0.41
10 Priestley St 613.80 613.91 0.11 613.91 0.11
11 Old Hume Highway 603.49 604.56 1.07 604.56 1.07
12 Railway Parade 640.05 640.08 0.04 640.08 0.04
13 Brewster St 615.93 615.90 -0.03 615.90 -0.03
14 U/S Etheridge St Retirement Village 609.87 609.87 0.00 609.87 0.00
15 Etheridge St 607.76 607.76 -0.01 607.76 -0.01
16 Bessemer St Railway Underpass 627.55 629.10 1.55 629.10 1.55
17 Regent Lane 622.18 622.31 0.13 622.31 0.13
18 U/S RSL Carpark Entry 614.79 614.85 0.06 614.85 0.06
19 D/S RSL Carpark Exit 611.94 612.06 0.12 612.06 0.12
20 Old Hume Highway 609.93 609.86 -0.06 609.86 -0.06
21 D/S Railway Pde, U/S Railway line 630.63 631.28 0.65 631.28 0.65
22 Main St 627.74 627.76 0.02 627.76 0.02
23 Edward St 624.37 624.38 0.01 624.38 0.01
24 Alfred St - Upstream Lake Alexandra 621.72 621.68 -0.03 621.68 -0.03
25 Lake Alexandra Outlet 621.93 621.94 0.00 621.94 0.00

Gibbergunyah Creek Flood Study
51
Location
ID#
Description of Location
Standard 0% Blockage 100% Blockage
Peak Water
Elevation
(mAHD)
Peak Water
Elevation
(mAHD)
Difference
Peak Water
Elevation
(mAHD)
Difference
26 Lake Alexandra spillway 621.71 621.68 -0.03 621.68 -0.03
27 Bendooley St - Welby 611.89 611.90 0.01 611.90 0.01
28 Hume Highway 535.11 535.15 0.04 535.15 0.04
The results documented in Figure I1, Figure I2 and Table 17 show that complete blockage
typically increases the severity of flooding upstream of blocked pipes and culverts, while
decreasing the severity of flooding downstream of blocked pipes and culverts. The average
increase in peak flood level with 100% blockage is predicted to be 200 mm. However, isolated
increases of over 1 metre are predicated upstream of the Old Hume Highway and Bessemer
Street Railway underpass.
The no blockage scenario typically increases the severity of flooding downstream of the
pipes/culverts and decreases the severity of flooding upstream of pipes/culverts. The average
reduction in peak 100 year ARI flood level is about 150mm, although decreases of over
0.5metres are predicted at isolated locations.
The results of the blockage simulations show some significant changes in flood levels at some
locations relative to the “standard” blockage scenario. Accordingly, it is considered that the
hydraulic model is relatively sensitive to variation in culvert and pipe blockage. This outcome
emphasises the need to ensure key drainage infrastructure and bridges/culverts are well
maintained (i.e., debris is removed on a regular basis).
7.3.2 Manning’s ‘n’
Manning’s’ ‘n’ roughness coefficients are one of the primary hydraulic model inputs and
calibration parameters. They are used to describe the resistance to flow afforded by different
land uses / surfaces across the catchment. However, they can be subject to considerable
variability (e.g., vegetation density in the summer would typically be higher than the winter
leading to higher Manning’s ‘n’ values). Therefore, additional analyses were completed to
quality the impact that any uncertainties associated with Manning’s ‘n’ roughness values may
have on predicted design flood behaviour.
The TUFLOW model was updated to reflect an increase and a decrease in “baseline” Manning’s
‘n’ values of 20%. Peak floodwater depths and velocity vectors were extracted from the results
of the modelling and are presented in Figure I3.1 to I3.12 and Figure I4.1 to I4.12, which are
enclosed in Appendix I. The predicted extent of inundation for "baseline" conditions is also
superimposed on Figures I3 and I4 for comparison.
Tabulated flood level comparisons are provided at select location across the catchment in
Table 18.
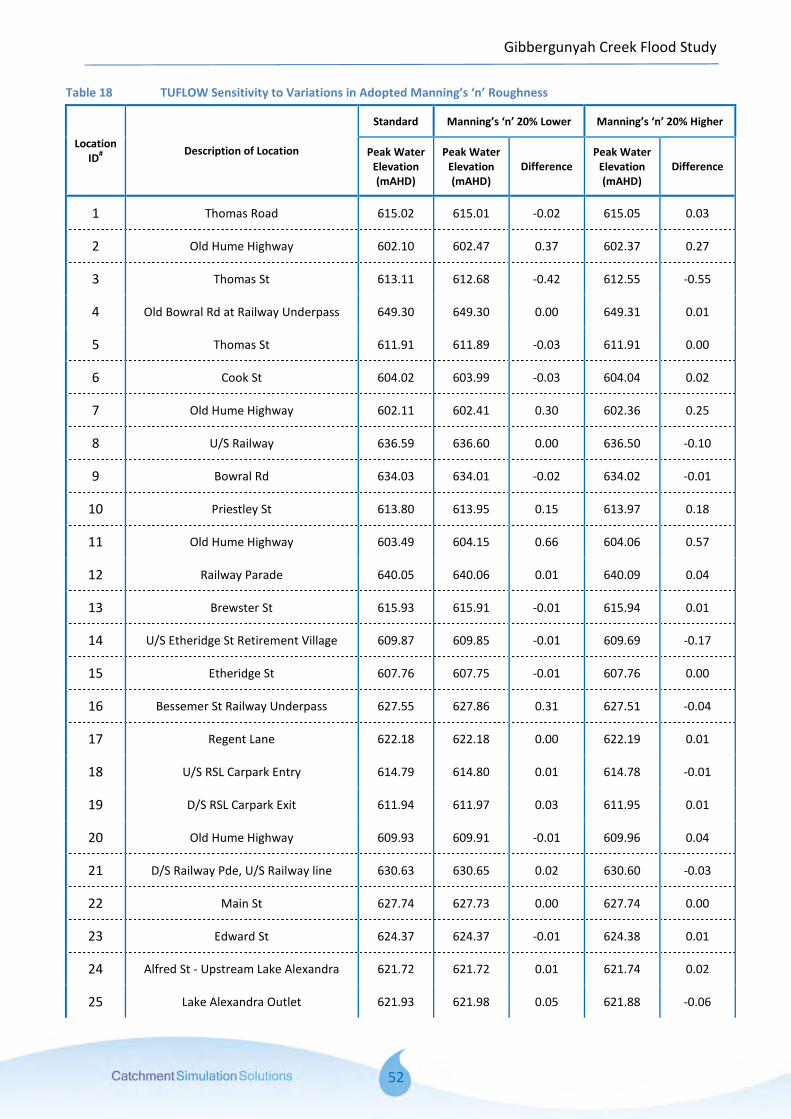
Gibbergunyah Creek Flood Study
52
Table 18 TUFLOW Sensitivity to Variations in Adopted Manning’s ‘n’ Roughness
Location
ID#
Description of Location
Standard Manning’s ‘n’ 20% Lower Manning’s ‘n’ 20% Higher
Peak Water
Elevation
(mAHD)
Peak Water
Elevation
(mAHD)
Difference
Peak Water
Elevation
(mAHD)
Difference
1 Thomas Road 615.02 615.01 -0.02 615.05 0.03
2 Old Hume Highway 602.10 602.47 0.37 602.37 0.27
3 Thomas St 613.11 612.68 -0.42 612.55 -0.55
4 Old Bowral Rd at Railway Underpass 649.30 649.30 0.00 649.31 0.01
5 Thomas St 611.91 611.89 -0.03 611.91 0.00
6 Cook St 604.02 603.99 -0.03 604.04 0.02
7 Old Hume Highway 602.11 602.41 0.30 602.36 0.25
8 U/S Railway 636.59 636.60 0.00 636.50 -0.10
9 Bowral Rd 634.03 634.01 -0.02 634.02 -0.01
10 Priestley St 613.80 613.95 0.15 613.97 0.18
11 Old Hume Highway 603.49 604.15 0.66 604.06 0.57
12 Railway Parade 640.05 640.06 0.01 640.09 0.04
13 Brewster St 615.93 615.91 -0.01 615.94 0.01
14 U/S Etheridge St Retirement Village 609.87 609.85 -0.01 609.69 -0.17
15 Etheridge St 607.76 607.75 -0.01 607.76 0.00
16 Bessemer St Railway Underpass 627.55 627.86 0.31 627.51 -0.04
17 Regent Lane 622.18 622.18 0.00 622.19 0.01
18 U/S RSL Carpark Entry 614.79 614.80 0.01 614.78 -0.01
19 D/S RSL Carpark Exit 611.94 611.97 0.03 611.95 0.01
20 Old Hume Highway 609.93 609.91 -0.01 609.96 0.04
21 D/S Railway Pde, U/S Railway line 630.63 630.65 0.02 630.60 -0.03
22 Main St 627.74 627.73 0.00 627.74 0.00
23 Edward St 624.37 624.37 -0.01 624.38 0.01
24 Alfred St - Upstream Lake Alexandra 621.72 621.72 0.01 621.74 0.02
25 Lake Alexandra Outlet 621.93 621.98 0.05 621.88 -0.06
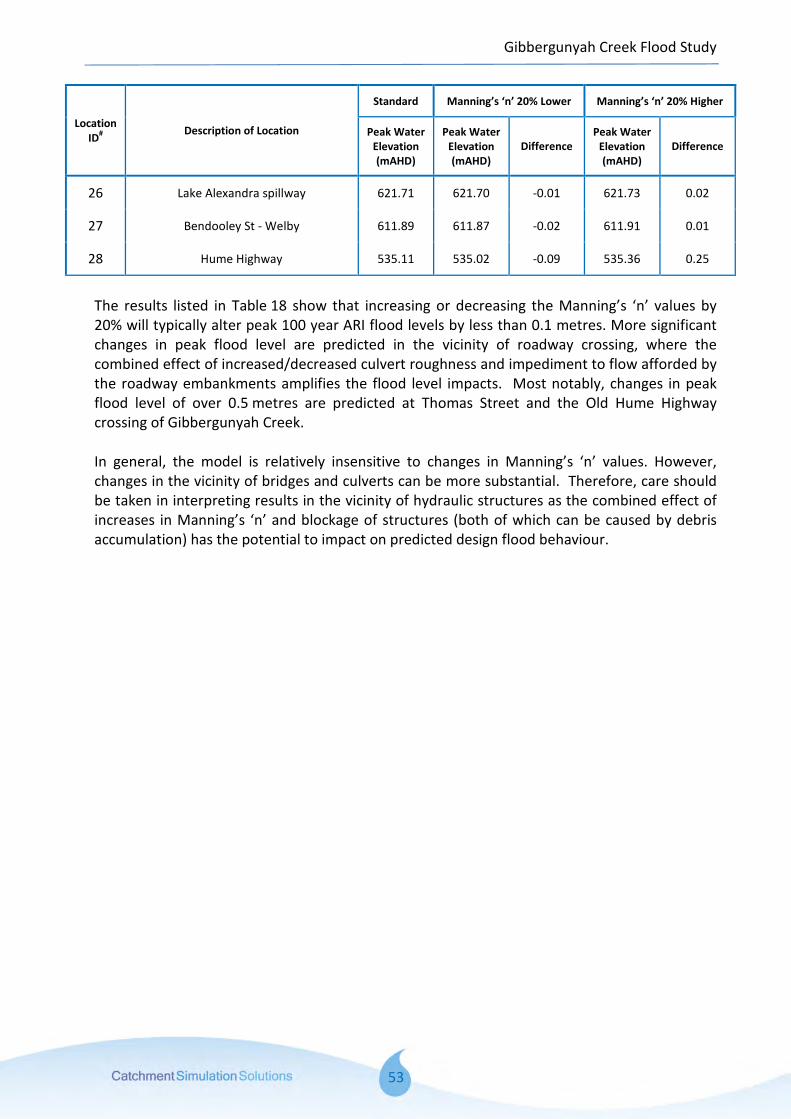
Gibbergunyah Creek Flood Study
53
Location
ID#
Description of Location
Standard Manning’s ‘n’ 20% Lower Manning’s ‘n’ 20% Higher
Peak Water
Elevation
(mAHD)
Peak Water
Elevation
(mAHD)
Difference
Peak Water
Elevation
(mAHD)
Difference
26 Lake Alexandra spillway 621.71 621.70 -0.01 621.73 0.02
27 Bendooley St - Welby 611.89 611.87 -0.02 611.91 0.01
28 Hume Highway 535.11 535.02 -0.09 535.36 0.25
The results listed in Table 18 show that increasing or decreasing the Manning’s ‘n’ values by
20% will typically alter peak 100 year ARI flood levels by less than 0.1 metres. More significant
changes in peak flood level are predicted in the vicinity of roadway crossing, where the
combined effect of increased/decreased culvert roughness and impediment to flow afforded by
the roadway embankments amplifies the flood level impacts. Most notably, changes in peak
flood level of over 0.5 metres are predicted at Thomas Street and the Old Hume Highway
crossing of Gibbergunyah Creek.
In general, the model is relatively insensitive to changes in Manning’s ‘n’ values. However,
changes in the vicinity of bridges and culverts can be more substantial. Therefore, care should
be taken in interpreting results in the vicinity of hydraulic structures as the combined effect of
increases in Manning’s ‘n’ and blockage of structures (both of which can be caused by debris
accumulation) has the potential to impact on predicted design flood behaviour.

54
8 PROVISIONAL FLOOD HAZARD AND
HYDRAULIC CATEGORISATION
8.1 Provisional Flood Hazard Categories
Flood hazard effectively defines the impact that flooding will have on development and people
across different sections of the floodplain.
The determination of flood hazard at a particular location requires consideration of a number
of factors, including (NSW Government, 2005):
� depth and velocity of floodwaters;
� size of the flood;
� effective warning time;
� flood awareness;
� rate of rise of floodwaters;
� duration of flooding; and
� potential for evacuation.
Consideration of all of the above items is generally
completed as part of the Floodplain Risk Management
Study. The scope of the Flood Study typically only
requires a provisional estimate of the flood hazard to
be determined. The provisional flood hazard is based
solely on the depth and velocity of floodwaters.
The provisional flood hazard at a particular area of a
floodplain can be established from Figure L2 of the
‘Floodplain Development Manual’ (NSW Government,
2005). This figure is reproduced on the right.
As shown in Figure L2, the ‘Floodplain Development
Manual’ (NSW Government, 2005) divides hazard into
two categories, namely high and low. It also includes a
“transition zone” between the low and high hazard categories. Sections of the floodplain
located in the “transition zone” may be classified as either high or low depending on site
conditions or the nature of any proposed development.
8.1.1 Provisional Flood Hazard
The TUFLOW hydraulic software was used to automatically calculate the variation in provisional
flood hazard across the Gibbergunyah Creek catchment based on the criteria shown in
Figure L2. These hazard categories are shown in Figures 18 to 24.

Gibbergunyah Creek Flood Study
55
It needs to be reinforced that the hazard represented in this mapping is provisional only. This is
because it is based only on an interpretation of the flood hydraulics and does not reflect the
effects of other factors that influence flood hazard.
Accordingly, modification of the hazard categories presented in Figures 18 to 24 may occur as
part of investigations to be carried out during the subsequent Floodplain Risk Management
Study.
8.2 Hydraulic Categories
The NSW Government’s ‘Floodplain Development Manual’ (NSW Government, 2005) also
characterises flood prone areas according to the hydraulic categories presented in Table 19.
The hydraulic categories provide an indication of the potential for development across different
sections of the floodplain to impact on existing flood behaviour and highlights areas that should
be retained for the conveyance of floodwaters.
Table 19 Qualitative and Quantitative Criteria for Hydraulic Categories
Hydraulic Category Qualitative Description Adopted Criteria*
Floodway those areas where a significant volume of water flows
during floods
often aligned with obvious natural channels and
drainage depressions
they are areas that, even if only partially blocked,
would have a significant impact on upstream water
levels and/or would divert water from existing
flowpaths resulting in the development of new
flowpaths.
they are often, but not necessarily, areas with deeper
flow or areas where higher velocities occur.
If not Flood Fringe or Flood
Storage.
Flood Storage those parts of the floodplain that are important for the
temporary storage of floodwaters during the passage
of a flood
if the capacity of a flood storage area is substantially
reduced by, for example, the construction of levees or
by landfill, flood levels in nearby areas may rise and
the peak discharge downstream may be increased.
substantial reduction of the capacity of a flood storage
area can also cause a significant redistribution of flood
flows.
If not Flood Fringe and:
• D <= 2 m AND
V <= (-0.3D +1)
OR
• D >= 2 m AND
V <= 0.4 m/s
Flood Fringe the remaining area of land affected by flooding, after
floodway and flood storage areas have been defined.
development (e.g., filling) in flood fringe areas would
not have any significant effect on the pattern of flood
flows and/or flood levels.
• V <= 2 m/s AND
D <= 0.2
NOTES: V = Velocity, D = Depth
Hydraulic categories were only applied to areas subject to inundation (i.e., D > 0m)
*The adopted criteria were developed specifically for the Gibbergunyah Creek Catchment only and may not
be appropriate for any other areas.

Gibbergunyah Creek Flood Study
56
8.2.1 Adopted Hydraulic Categories
Unlike provisional hazard categories, the ‘Floodplain Development Manual’ (NSW Government,
2005) does not provide explicit quantitative criteria for defining hydraulic categories. This is
because the extent of floodway, flood storage and flood fringe areas are typically specific to a
particular catchment.
However, the ‘Floodplain Development Manual’ (NSW Government, 2005) does provide
qualitative guidelines to assist in the delineation of hydraulic categories. The 'Floodway
Definition' guideline (Department of Environment and Climate Change, 2007) also provides
additional guidance for the definition of floodway extents. These qualitative guidelines are
summarised in Table 19.
The results of the design flood simulations were interrogated to assess the potential extent of
floodway, flood storage and flood fringe areas based on the qualitative guidelines listed in
Table 19. Preliminary hydraulic category boundaries were delineated by hand across different
areas of the Gibbergunyah Creek catchment. The extent of each preliminary hydraulic category
boundary was superimposed on peak depth, flow velocity and velocity-depth product values to
determine if the hydraulic categories could be defined numerically. The results of this
assessment determined that the depth, velocity and velocity-depth product values listed in the
third column of Table 19 could be used to automate the delineation of hydraulic categories for
the Gibbergunyah Creek catchment. A graphical representation of the numerical criteria listed
in Table 19 is also provided in Plate 17.
Plate 17 Adopted hydraulic category criteria
The resulting hydraulic category maps for the 5, 10, 20, 50, 100, and 200 Year ARI events as well
as the Probable Maximum Flood (PMF) are shown in Figures 25 to 31.
0
0.2
0.4
0.6
0.8
1
1.2
1.4
1.6
1.8
2
2.2
0 0.2 0.4 0.6 0.8 1 1.2 1.4 1.6 1.8 2 2.2 2.4 2.6 2.8 3
Ve
loc
ity (
m/s
)
Depth of Flood at Site (m)
Floodway
Flo
od
Fri
ng
e
Flood Storage

Gibbergunyah Creek Flood Study
57
In order to verify the suitability of the delineated floodways, additional checks were performed
in accordance with recommendations outlined in the DECC 'Floodway Definition' guideline. This
involved blocking sections of the delineated floodways and quantifying the impact that this
blockage had on peak flood levels as well as the distribution of floodwaters in the vicinity of the
blockage. The outcomes of this assessment are presented in Plates 18 and 19.
Plate 18 Predicted Peak 100 year ARI Flood Levels, Depth and Velocities with Partial Blockage of Floodways
(blockage locations highlighted by yellow circles)
Plate 19 Predicted Change in Peak 100 year ARI Flood Levels with Partial Blockage of Floodways (blockage
locations highlighted by yellow circles)

Gibbergunyah Creek Flood Study
58
The flood level difference mapping presented in Plate 19 shows that partial blockage of the
delineated floodway extents would increase peak flood level by over 0.3 metres in most
instances. This is considered to be a “significant impact” on upstream water levels.
Plate18 also shows that the blockages would cause a significant redistribution of floodwaters.
That is, a significant proportion of floodwaters would be forced into areas that weren’t
previously conveying a significant amount of the total flow.
The results depicted in Plates 18 and 19 are considered to be consistent with the qualitative
floodway descriptions outlined in the 'Floodway Definition' guideline and indicate that the
delineated floodway extents are reasonable.
8.3 Flood Risk Precincts
Wingecarribee Shire Council’s Develop Control Plan (DCP) No. 34, titled ‘Managing our Flood
Risks’, outlines Council’s requirements for development on all floodplains within the Local
Government Area. This includes the floodplain of Gibbergunyah Creek.
Section 2.3 of the DCP, introduces the concept of “Flood Risk Precincts”, which subdivides the
floodplain accordingly to the potential flood hazard/risk. This flood risk precinct classification,
in turn, determines which development controls are applicable for a particular parcel of land.
The four flood risk precincts that are documented in the DCP are summarised in Table 20.
Table 20 Flood Risk Precinct Definitions
Flood Risk
Precinct
Description
High This Precinct contains that land below the 100 year flood that is either subject to a
high hydraulic hazard or where there are significant evacuation difficulties. The high
flood risk precinct is where high flood damages, potential risk to life, and evacuation
problems would be anticipated or development would significantly and adversely
affect flood behaviour. Most development should be restricted in this precinct. In this
precinct, there would be a significant risk of flood damages without compliance with
flood related building and planning controls.
Medium This Precinct contains that land below the 100 year flood that is not subject to a high
hydraulic hazard and where there are no significant evacuation difficulties. In this
precinct there would still be a significant risk of flood damage, but these damages can
be minimised by the application of appropriate development controls.
Fringe-Low This Precinct contains that land between the extents of the 100 year flood and the
100 year flood plus 0.5m in elevation (being a freeboard). In this precinct there would
still be a significant risk of flood damage, but these damages can be minimised by the
application of appropriate development controls.
Low This Precinct contains that land within the floodplain (i.e. within the extent of the
probable maximum flood) but not identified within any of the above Flood Risk
Precincts. The Low Flood Risk Precinct is where risk of damages is low for most land
uses and most land uses would be unrestricted within this precinct.
To aid Council in defining the spatial variation in flood risk precincts across the Gibbergunyah
Creek catchment, a Flood Risk Precinct map was prepared based on the outcomes of the design
flood simulations and provisional hazard mapping and is shown in Figure 32.

59
9 CLIMATE CHANGE ASSESSMENT
The Office of Environment and Heritage’s (formerly Department of Environment, Climate
Change and Water) 'Practical Consideration of Climate Change' states that climate change is
expected to have adverse impacts on sea levels and rainfall intensities into the future.
Although any future rises in see level are unlikely to have an impact on flood behaviour across
the Gibbergunyah Creek catchment, increases in rainfall intensities have the potential to
increase runoff volumes and peak discharges, thereby increasing the severity of flooding.
This flood study will form the basis for defining flood behaviour for a number of years into the
future. It will also form the basis for the future Floodplain Risk Management Study, where a
range of flood risk mitigation measures will be evaluated. Therefore, it is important that
potential climate change impacts are quantified so that development decisions and the
robustness of flood risk mitigation measures can be assessed in an informed manner.
The following sections describe the process that was employed to quantify climate change
impacts on flooding across the Gibbergunyah Creek catchment.
9.1 Hydrology
9.1.1 General
The 'Practical Consideration of Climate Change' (Department of Environment and Climate
Change, 2007) guideline states that rainfall intensities are predicted to increase in the future.
The NSW Government's 'Climate Change in the Sydney Metropolitan Catchments' (CSIRO, 2007)
elaborates on this further and suggests that annual rainfall is likely to decrease, however,
extreme rainfall events are likely to more intense. It is anticipated that extreme rainfall
intensities could increase by between 2% and 24% by 2070 (Department of Environment and
Climate Change, 2007).
Due to the wide potential variability of future rainfall intensities, the 'Practical Consideration of
Climate Change' (Department of Environment and Climate Change, 2007) provides guidelines
for quantifying the potential impacts of these changes. The guideline states that additional
simulations should be completed with 10%, 20% and 30% increases in rainfall intensities to
quantify the potential impacts associated with climate change.
9.1.2 Results
The XP-RAFTS model was used to perform additional simulations incorporating increases in
rainfall intensity of 10%, 20% and 30% in accordance with the OEH guidelines. The results of
the climate change assessment are summarised in Table 21 at selected locations across the
Gibbergunyah Creek catchment. Complete listings of peak discharges for each subcatchment
are provided in Appendix J.

Gibbergunyah Creek Flood Study
60
Table 21 Predicted Peak Design Discharges with Increases in Rainfall Intensity Associated with Climate
Change
Location
(XP-RAFTS ID)
Peak 100 Year ARI Discharge (m3/s)
Adopted Rainfall
Intensities
10% Increase in
Rainfall Intensities
20% Increase in
Rainfall Intensities
30% Increase in
Rainfall Intensities
Old Hume Highway
(1.17)
76.1 87.5 98.9 110.2
Old Bowral Rd at Railway
Underpass
(28.07)
12.7 14.3 15.9 17.6
Old Hume Highway
(28.13)
15.2 17.2 19.2 21.1
Priestley St
(52.11)
32.8 37.4 41.6 46.1
Old Hume Highway
(52.12)
39.3 44.7 49.6 55.3
Brewster St
(63.05)
8.58 9.82 11.00 12.21
US Etheridge St Retirement
Village
(63.06)
10.6 12.2 13.8 15.3
Bessemer St Railway Underpass
(67.06)
10.8 12.2 13.6 15.1
Old Hume Highway
(67.09)
23.3 26.6 29.8 33.1
Lake Alexandra Outlet
(88.10)
17.9 20.4 22.9 25.9
Hume Highway
(1.31)
216 251 280 315
The results provided in Table 21 and Appendix J show that a 10% increase in peak 100 year ARI
design rainfall intensities will increase peak 100 year ARI discharges about 14%, on average.
The results also show that a 20% and 30% increase in design rainfall intensities will increase
peak 100 year ARI discharges by about 27% and 40% respectively. Accordingly, increases in
rainfall intensity of this magnitude have the potential to cause significant increases in flood
flows across the entire catchment.
9.2 Hydraulics
9.2.1 Results
In order to verify the impact that increases in rainfall intensity of 10%, 20% and 30% may have
on design floodwater levels, depths and velocities, the flows were extracted from the results of
the updated XP-RAFTS modelling and were routed through the TUFLOW hydraulic model.

Gibbergunyah Creek Flood Study
61
Peak floodwater depths and velocity vectors were extracted from the results of the modelling
and are presented in Figures K1 to K3, which is enclosed in Appendix K. The predicted extent
of inundation for "baseline" conditions is superimposed on Figures K1 to K3 for comparison.
Tabulated flood level comparisons are also provided at select location across the catchment in
Table 22.
Table 22 TUFLOW Sensitivity to Variations in Culvert/Pipe Blockage
Location
ID#
Description of Location
Peak 100 Year ARI Flood Level (mAHD)
Adopted
Rainfall
Intensities
10% Increase in
Rainfall
Intensities
20% Increase in
Rainfall
Intensities
30% Increase in
Rainfall
Intensities
1 Thomas Road 615.02 615.08 615.12 615.16
2 Old Hume Highway 602.10 602.27 602.32 602.34
3 Thomas St 613.11 613.10 613.11 613.10
4 Old Bowral Rd at Railway
Underpass 649.30 649.38 649.43 649.46
5 Thomas St 611.91 611.96 612.00 612.03
6 Cook St 604.02 604.05 604.06 604.08
7 Old Hume Highway 602.11 602.21 602.28 602.34
8 U/S Railway 636.59 636.99 637.48 637.93
9 Bowral Rd 634.03 634.10 634.17 634.21
10 Priestley St 613.80 613.84 613.86 613.88
11 Old Hume Highway 603.49 603.64 603.76 603.80
12 Railway Parade 640.05 640.07 640.08 640.09
13 Brewster St 615.93 615.94 615.96 615.97
14 U/S Etheridge St Retirement Village 609.87 609.87 609.87 609.88
15 Etheridge St 607.76 607.77 607.77 607.79
16 Bessemer St Railway Underpass 627.55 627.90 628.15 628.38
17 Regent Lane 622.18 622.20 622.21 622.22
18 U/S RSL Carpark Entry 614.79 614.83 614.86 614.90
19 D/S RSL Carpark Exit 611.94 611.99 612.03 612.07
20 Old Hume Highway 609.93 609.98 610.03 610.06
21 D/S Railway Pde, U/S Railway line 630.63 630.73 630.83 630.91

Gibbergunyah Creek Flood Study
62
Location
ID#
Description of Location
Peak 100 Year ARI Flood Level (mAHD)
Adopted
Rainfall
Intensities
10% Increase in
Rainfall
Intensities
20% Increase in
Rainfall
Intensities
30% Increase in
Rainfall
Intensities
22 Main St 627.74 627.77 627.80 627.83
23 Edward St 624.37 624.39 624.41 624.43
24 Alfred St - Upstream Lake
Alexandra 621.72 621.73 621.76 621.79
25 Lake Alexandra Outlet 621.93 622.04 622.06 622.16
26 Lake Alexandra spillway 621.71 621.75 621.76 621.80
27 Bendooley St - Welby 611.89 611.91 611.93 611.95
28 Hume Highway 535.11 535.29 535.43 535.55
The results provided in Table 22 and Appendix K show that a 10% increase in peak 100 year ARI
design rainfall intensities will increase peak 100 year flood levels by less than 100mm, on
average. The results also show that a 20% and 30% increase in design rainfall intensities will
increase peak 100 year ARI flood levels by about 150 mm and 200 mm respectively.
Accordingly, as floodwater depths across the majority of the floodplain areas are quite shallow,
increases in flood level of this magnitude have the potential to increase the severity of flooding
considerably.

63
10 DISCUSSION
10.1 Overview
The results of the flood modelling were interpolated to identify areas of the Gibbergunyah
Creek catchment that were particularly susceptible to inundation from floodwaters. The results
were also reviewed with respect to key infrastructure and emergency response facilities to
determine if they may be impacted during a flood. A discussion on the outcomes of this review
is presented below.
10.2 General Description of Flood Behaviour
The results of the hydraulic modelling show that:
The Gibbergunyah Creek channel carries the majority of flow during the 100 year ARI flood
and limited inundation of properties occurs as a result of overtopping of the creek banks.
This is consistent with the outcomes of community consultation (refer Section 3.6.2).
Nevertheless, inundation of some properties does occur as a result of overland flows
making their way towards the creek.
Chinaman’s Creek overtops in multiple locations, which results in inundation of a number of
adjoining properties. Most notably, properties in the vicinity of Old Bowral Road and
Priestly Street are subject to inundation.
Floodwaters along Iron Mines Creek are generally contained to the creek channel during
the 100 year ARI flood. However, floodwaters are predicted to overtop the Old Hume
Highway and travel in a westerly direction along the highway toward Chinamans Creek.
Similarly to Gibbergunyah Creek, overland flow is predicted to inundate a number of
properties, however, the depths of inundation are typically shallow (i.e., < 0.1 metres)
Runoff across the Lake Alexandra subcatchment is conveyed via subsurface stormwater
pipes. Accordingly, during large events, water in excess of the capacity of the pipe system
is conveyed overland inundating a number of residential and commercial properties.
10.3 Flood Liable Areas
The results of the modelling show that floodwaters are typically confined to defined
watercourses, drainage lines and roadways. Nevertheless, there are some areas that
experience higher depths of inundation. These areas include:
Commercial/Industrial areas in the vicinity of Cavendish Avenue, most notably at the
intersection with Priestly Street. This same overland flow path is also predicted to cause
inundation of commercial premises on the corner of the Old Hume Highway and Frankland
Street (refer Figure 15.5 and 15.9). A high provisional flood hazard is predicted across
these areas indicating that the floodwaters would pose a significant hazard during the 100
year ARI flood (refer Figures 22.5 and 22.9).
Bessemer Street, between the railway line and the Mittagong RSL Club carries a significant
proportion of flow, especially in the vicinity of the railway underpass. This roadway is

Gibbergunyah Creek Flood Study
64
predicted to function as a high hazard floodway at the peak of the 100 year ARI flood. (see
Figure 22.4 and 22.8)
A number of properties across West Mittagong are predicted to be subject to inundation.
This includes properties fronting John Street, William Street, Thomas Street, Elizabeth
Street, Cook Street and Hood Street. Flooding across this area appears to be primarily
associated with an inadequate drainage system. In general, this area is predicted to be
exposed to a low provisional flood hazard.
Properties adjoining Main Street, Albert Street, Edward Street/Lane and Alfred Street, are
also predicted to be subject to inundation at the peak of the 100 year ARI flood. This
appears to be primarily associated with a drainage system that is only designed to convey
flows during smaller, more frequent storms.
A significant overland flow path extending between Currockbilly Street and Bendooley
Street at Welby is also predicted to inundate a number of properties (see Figure 15.10).
Additionally, there are numerous ‘pockets’ across Welby that are subject to a high
provisional flood hazard, including a significant portion of Mittagong Street (see Figure
22.10).
10.4 Emergency Response Infrastructure
There is significant infrastructure located within the Gibbergunyah catchment that can play a
key role in emergency response management during floods. As such, it was considered
important to assess the relative safety and accessibility of these buildings during flood events.
Such key infrastructure includes:
Wingecarribee Shire SES/RFS Headquarters (Corner of Priestly St and Etheridge St,
Mittagong). This building is located adjacent to Chinamans Creek, and experiences
inundation across a significant proportion of the site in all design events with depths
ranging from 0.04m in the 5 year ARI event, 0.15m during the 100 year ARI event up to
0.5m during the PMF. Higher depths are experienced adjacent to the buildings; however,
the lack of detailed floor level survey means the flood immunity of the buildings cannot be
defined.
SES station (Regent Lane, Mittagong) is located close to Iron Mines Creek and the Bessemer
St Railway Underpass. However, the main building is located on high ground that does not
experience inundation in any events, including the PMF. Nevertheless, it should be noted
that access to and from the station requires passing across a major overland flow path that
extends across Regent Lane. However, peak depths of inundation during the design 100
year ARI flood are less than 0.2 metres meaning vehicular and pedestrian access should be
achievable. It should also be noted that Bessemer Street is designated as a high hazard
flood hazard and would not be passable during the 100 year ARI flood.
Mittagong Police Station (Corner Regent St and Station St, Mittagong). During all design
events, Station Street becomes an overland flow path with depths ranging from 0.06m
during the 5 year ARI, 0.15m in the 100 year ARI, and 0.30m in the PMF. These depths do
not cause inundation of any buildings along Station Street and are unlikely to cause a
significant impediment to pedestrian and vehicular access during most floods.
Living Care Henley Brae Retirement Village (Etheridge St, Mittagong). This retirement
Village is of special concern due to the probability of a large number of elderly and less
mobile residents being present. This village is also situated in very close proximity to a
tributary of Chinamans Creek (the tributary actually passes under two of the village villas).

Gibbergunyah Creek Flood Study
65
The majority of the village is predicted to be exposed to a low provisional flood hazard,
however, some areas in close proximity to the watercourse are designated as high hazard
areas. Velocities through the village are generally low (~0.5m/s), however, given the
potential vulnerability of the residents in the area, and the uncertainty of floor levels,
further detailed investigations are recommended and appropriate considerations are made
in emergency planning.
Sewage Pumping Station (Lee St, Mittagong). This pumping station is predicted to be
inundated during every simulated design flood. As such, if any wastewater was located
within pumping station at the time of the flood, there is potential for it to be conveyed into
Iron Mines Creek and then into Gibbergunyah Creek. There is no significant development
downstream of this location, so human exposure is unlikely. However, contamination of
Iron Mines Creek and Gibbergunyah Creek may occur.
10.5 Roadways
There are several major roadways within the Gibbergunyah Creek catchment which may be
required for evacuation or access for emergency vehicles during floods. An investigation was
completed to quantify the impact of flooding on major roadways across the Gibbergunyah
Creek catchment. The outcomes of this investigation indicate that:
Old Hume Highway/ Main St: These roadways link Mittagong to Welby and provide access
to the Hume Highway. They also provide access for residents between the Eastern and
Western portion of Mittagong. During the 100 year ARI flood, there are four major
positions where water crosses these roadways and could potentially cause closure of the
roadway. These locations are :
o Just east of the main Gibbergunyah Creek culvert crossing, where depths generally do
not exceed 0.3m. However, a small section of the roadway is designated as a high
provisional flood hazard area at the peak of the 100 year ARI flood;
o Between Owen St and Franklin St. Depths at this location again generally do not exceed
0.3m;
o Between Iron Mines and Chinamans Creek crossings, where depths can reach in excess
0.7m. As a result, this section of roadway can be subject to a high provisional flood; and
o Between Station St and Fitzroy St, where depths can reach 0.8m in places.
At all four locations, the roadways can be inundated for between 1 and 2 hours.
Bowral Road: This roadway links Mittagong with Bowral/Moss Vale. During the 100 year
ARI flood, the majority of Bowral Road between Tulloona Avenue and the railway overpass
experiences shallow depths. However, more significant depths form at three locations:
o the intersection of Old Bowral Rd and Cavendish St where depths reach up to 0.3m;
o the intersection with Brewster St where depth reach 0.3m; and
o between Iron Mines Creek and Bessemer St, where depths peak at 0.3m.
These depths are generally maintained for less than half an hour. All three locations are
predicted to be exposed to a high provisional flood hazard, and therefore, should not be
traversed for around 30 minutes.
Gibbergunyah Creek Flood Study
66
10.6 Railway
The Main Southern Railway also passes through Mittagong. The railway is typically elevated
above the floodplain, however, it is subject to inundation at some locations during the 100 year
ARI flood. There are two major locations where the railway is overtopped:
1) Mittagong Station, where a number of overland flow paths converge and cause floodwater
depths to reach up to 0.4m across the station; and,
2) Between the Mount Gibraltar Railway cutting and Old Bowral Road, where a major
overland flow path occurs adjacent to the railway tracks and reaches a depth of 0.6m.
The inundation at these locations is predicted to be maintained for between 1 and 2 hours.

67
11 CONCLUSION
This report documents the outcomes of investigations completed to quantify main stream and
overland flooding across the Gibbergunyah Creek catchment for a full range of design floods up
to and including the PMF. It provides information on design flood discharges, levels, depths,
velocities as well as hydraulic categories and provisional estimates of flood hazard.
Flood behaviour across the study area was defined using a hydrologic computer model of the
Gibbergunyah Creek catchment as well as a two-dimensional hydraulic model incorporating all
major watercourses, stormwater pipes and overland flow paths. The hydrologic computer
model was developed using the XP-RAFTS software and the hydraulic model was developed
using the TUFLOW software.
The computer models were calibrated/verified using rainfall data and photographs for floods
that occurred in 2005 and 2010. The models were subsequently used to simulate a range of
design floods including the 5, 20, 50, 100, 500 and 1000 year ARI floods as well as the PMF. The
following conclusions can be drawn from the results of the investigation:
Flooding across the Gibbergunyah Creek catchment can occur as a result of major
watercourses overtopping their banks as well as overland flooding when the capacity of the
stormwater system is exceeded.
Flooding can occur as a result of a variety of different storm durations. However, a storm
duration of less than 3 hours typically produces the worst case flooding conditions across
most of the study area. That is, relatively short, high intensity rainfall events typically
produce the worst case flooding.
Large areas of the Gibbergunyah Creek catchment are predicted to be inundated during
each of the design floods. The majority of flow during most design floods are predicted to
be contained in designated drainage areas (e.g., waterways, swales). A number of
roadways and properties are also predicted to be inundated, however, the depths of
inundation are typically quite shallow. As a result, most areas are subject to a low
provisional flood hazard.
The catchment incorporates a range of drainage infrastructure to convey storm/flood
waters (e.g., culverts, stormwater pipes). The results of a blockage sensitivity analysis
shows that the severity of flooding upstream of these structures can be increased due to
blockage. Conversely, no blockage typically increases the severity of flooding downstream
of the structures.
A number of properties across the catchment are predicted to be inundated during a range
of design floods. Most notably, a large section of West Mittagong, sections of Welby and
the commercial sections of Easter Mittagong are predicted to be exposed to significant
depths of inundation during the design 100 year ARI flood.
A number of roadway as well as the Main Southern Railway are predicted to be overtopped
at several locations during the 100 year ARI flood. This would typically render the
roadways/railway impassable for up to 2 hours.

Gibbergunyah Creek Flood Study
68
The Wingecarribee Shire SES/RFS Headquarters located on the corner of Priestly St and
Etheridge St at Mittagong is predicted to be inundated during floods as frequent as the 5
year ARI event. Detailed floor level information should be collected to determine the
susceptibility of the building to over floor flooding. Regardless, it is likely that vehicular
access to the headquarters would be difficult during severe flooding with the catchment.

69
12 REFERENCES
AAM Pty Ltd. (2010). Wingecarribee Flood Study LiDAR Survey. Volume 16563A01NOB:
Prepared for Wingecarribee Shire Council.
Bewsher Consulting. (2005). Bowral Floodplain Risk Management Study and Plan. Prepared
for Wingecarribee Shire Council.
Bewsher Consulting. (2009). Lot 2 Besemer Street, Mittagong - Flood Study (Final Report).
Prepared for Wingecarribee Shire Council.
BMT WBM. (2012). TUFLOW User Manual: GIS Based 1D/2D Hydrodynamic Modelling.
Build 2012-05-AA.
Bradley, J. N. (1978). Hydraulics of Bridge Waterways: HDS 1.
Bureau of Meteorology. (2003). The Estimation of Probable Maximum Precipitation in
Australia: Generalised Short Duration Method.
Catchment Simulation Solutions. (2011). CatchmentSIM User Manual. Version 2.5.
CSIRO. (2007). Climate Change in the Sydney Metropolitan Catchments. Prepared for the
NSW Government.
Department of Environment and Climate Change. (2007). Floodplain Risk Management
Guideline: Floodway Defintion. Version 1.01.
Department of Environment and Climate Change. (2007). Floodplain Risk Management
Guideline: Practical Consideration of Climate Change. Version No. 1.0.
Engineers Australia. (1987). Australian Rainfall and Runoff - A Guide to Flood Estimation.
Edited by D. Pilgrim.
Engineers Australia. (2011). Australian Rainfall and Runoff - Revision Project 7: Baseflow for
Catchment Simulation. ISBN: 978-0-85825-916-4.
NSW Government. (2005). Floodplain Development Manual: the Management of Flood
Liable Land.
Reid, M., Cheng, X., Banks, E., Jankowski, J., Jolly, I., Kumar, P., et al. (2009). Catalogue of
Conceptual Models for Groundwater-Stream Interaction in Eastern Australia. eWater
Technical Report.
RHM Consulting Engineers. (2006). Hydraulic Assessment of Chinamans Creek, Mittagong.
Prepared for BB Retail Capital.
Rigby, E. H., Boyd, M. J., Roso, S., Silveri, P., & David, A. (2002). Causes and Effects of
Culvert Blockage during Large Storms. Eric W. Strecker, Wayne C. Huber, Editors Portland,
Oregon, USA, September 8-13, 2002: 9th International Conference on Urban Drainage.
Wingecarribee Shire Council. (Adopted 28 April 2010, Effective 17 May 2010). Managing
Our Flood Risks - Development Control Plan (DCP) No. 34 (Environemtnal Planning and
Assessment Act, 1979).

Gibbergunyah Creek Flood Study
70
XP Software. (2009). XP-RAFTS: Urban & Rural Runoff Routing Application. User Manual.

APPENDIX A
COMMUNITY CONSULTATION

Council calls for local data as part of flood studies
Wingecarribee Shire Council is calling on residents living within the Gibbergunyah and Chinaman’s Creek areas to provide information on local flood sites as part of a major flood study designed to help better prepare for future flood events. Flooding causes over $100 million worth of damage each year across the nation and historically causes more damage annually than any other natural disasters in Australia. Council is subsequently preparing three major flood studies across some of the Shire’s key catchment areas in an effort to better plan, predict and manage the risk of flooding across our Shire. The studies will form part of Council’s Floodplain Risk Management Program which aims to reduce the impact of flooding on the community. The Gibbergunyah Creek Flood Study will focus attention on the Gibbergunyah and Chinaman’s Creek areas in Mittagong, which covers an area approximately 10.5 km² in size. As part of the study, computer models will be used to simulate flood behaviour across the catchment. For the study to be as accurate as possible, Council is asking residents to submit any historical information they may have collected. This could include written data or historical photographs. Alternatively, a questionnaire can be completed online at the dedicated website, www.gibbergunyah.floodstudy.com.au. Responses close on the 31st of July 2012 but earlier responses will be appreciated. Two further studies targeting the Wingecarribee River from the Wingecarribee Dam to Berrima and the Burradoo Catchment will be undertaken concurrently with the Gibbergunyah study. For further information about the Gibbergunyah Creek Flood Study or to fill out an online questionnaire visit: www.gibbergunyah.floodstudy.com.au, contact Council’s Floodplain and Stormwater Engineer on phone 4868 0798 or via email at: [email protected], or Council’s consultant - Catchment Simulation
Solutions - David Tetely on (02) 9223 0882 or via email at: [email protected]. The Gibbergunyah Creek Flood Study is jointly funded by Wingecarribee Shire Council and NSW Government’s Office of Environment and Heritage.
END

Your contribution to thisstudy is greatly appreciated!
Fu
rther In
form
ation
:
To obtain further information on the G
ibbergunyah Creek Flood Study or to subm
it any information
that you think may be valuable to the study, please
contact:
David Tetley Catchm
ent Simulation Solutions
Suite 302, 5 Hunter Street Sydney N
SW 2000
(02) 9223 0882
(02) 8415 7118
.au
Sha Prodhan W
ingecaribee Shire Council PO
Box 141 M
oss Vale NSW
2577 (02) 4868 0798
(02) 4869 1203
sha.prodhan@w
sc.nsw.gov.au
Alternatively, you can visit the flood study website:
ww
w.gibbergunyah.floodstudy.com
.au
Brochure prepared by:
Ho
w yo
u can
help
!The flood study w
ill include the development
of computer m
odels to simulate flood
behaviour across the catchment. To ensure
the computer m
odels are providing reliable descriptions of flood behaviour they w
ill be calibrated so they reproduce floods that have occurred in the past.
Enclosed with this brochure is a questionnaire
that aims to collect as m
uch historic flood inform
ation as possible to assist with the m
odel calibration. Anybody w
ith information and/
or historic flood photographs is encouraged to com
plete the questionnaire and return it by 31st July 2012. Alternatively, the questionnaire can be com
pleted online via the Gibbergunyah Creek Flood Study w
ebsite:
ww
w.gibbergunyah.floodstudy.com
.au
Why d
o w
e need
to
prep
are a floo
d stu
dy?
Flooding in Australia is estimated to cause over
$100 million w
orth of damage each year. O
ver 2,300 people have also lost their lives due to floods in Australia over the past 200 years. Accordingly, flooding can im
pose significant financial burdens and place lives at risk.
The preparation of a flood study will help Council
to understand the existing flooding problem w
ithin the G
ibbergunyah Creek catchment. It w
ill also help Council to identify w
ere flood damage reduction
measures m
ay be best implem
ented to reduce the cost of flooding to the com
munity, assist w
ith em
ergency managem
ent / evacuation processes and guide future developm
ent in a way that is
compatible w
ith the flood hazard.
Gibbergunyah
C
reekFlood S
tudyC
om
mu
nity
Info
rmatio
n
Bro
chu
re

Intro
du
ction
The Gibbergunyah Creek catchm
ent covers an area of approxim
ately 10.5 km2 w
ithin the W
ingecarribee Shire Council Local Governm
ent Area. The extent of the G
ibbergunyah Creek catchm
ent is shown below
. It incorporates G
ibbergunyah Creek, Chinamans Creek, Iron M
ines Creek as w
ell as a number of m
inor tributaries, w
hich flow past m
any residential, comm
ercial and industrial properties in M
ittagong. Accordingly, there is potential for significant dam
age, inconvenience and risk to life during large floods w
ithin the catchment.
In recognition of these issues, Wingecarribee Shire
Council has decided to prepare a flood study for the G
ibbergunyah Creek catchment. The flood
study is the first step in assisting Council to better understand, plan and m
anage the risk of flooding across the catchm
ent.
The flood study is being completed as part of
Council’s Floodplain Risk Managem
ent Program,
which aim
s to reduce the impact of flooding on the
comm
unity.
Backg
rou
nd
The NSW
State Governm
ent’s Flood Prone Land Policy is directed tow
ards providing solutions to existing flood problem
s in developed areas and ensuring new
development is com
patible with the
flood hazard and does not create additional flooding problem
s in other areas.
Under the Policy, the m
anagement of flood liable
land is the responsibility of Local Governm
ent with
financial and technical support provided by the State G
overnment. The Policy specifies a staged
approach to the floodplain managem
ent process:
Council has initiated this process by comm
issioning the G
ibbergunyah Creek Flood Study. The main
purpose of the flood study is to determine the
nature and extent of the existing flood problem.
Once the Flood Study is com
pleted, a Floodplain Risk M
anagement Study and Plan can be prepared.
This will quantify the benefits of im
plementing a
range of measures aim
ed at reducing the damage
and inconvenience caused by flooding.
So
wh
at’s a floo
d stu
dy?
A considerable amount of w
ork is involved in the preparation of a flood study. This w
ork typically includes:
Collection and review of all available flood-
related information for the catchm
ent
Consultation with the com
munity to obtain
additional information on flooding
Development of com
puter models to sim
ulate the transform
ation of rainfall into runoff and to sim
ulate how the runoff is distributed across
the catchment
Calibration of the computer m
odels to reproduce historic floods
Use of the com
puter models to sim
ulate a range of hypothetical floods ranging from
relatively frequent storm
s right up to the largest flood that could conceivably occur
Interpretation of the computer m
odel outputs to identify the variation in flood hazard across the catchm
ent and to identify areas that should be preserved in the future for the conveyance of flood flow
s
Preparation of a flood study report and maps
summ
arising the outcomes of all stages of the
investigation
The flood study will ultim
ately provide Council w
ith information on flood flow
s, extents, levels, depths and velocities throughout the catchm
ent.Council has com
missioned specialist flood
consultants, Catchment Sim
ulation Solutions, to prepare the flood study.
Flo
od
Stu
dy
Flo
od
plain
Risk
Man
agem
ent S
tud
y
Flo
od
plain
Risk
Man
agem
ent P
lan
Imp
lemen
tation
o
f Plan
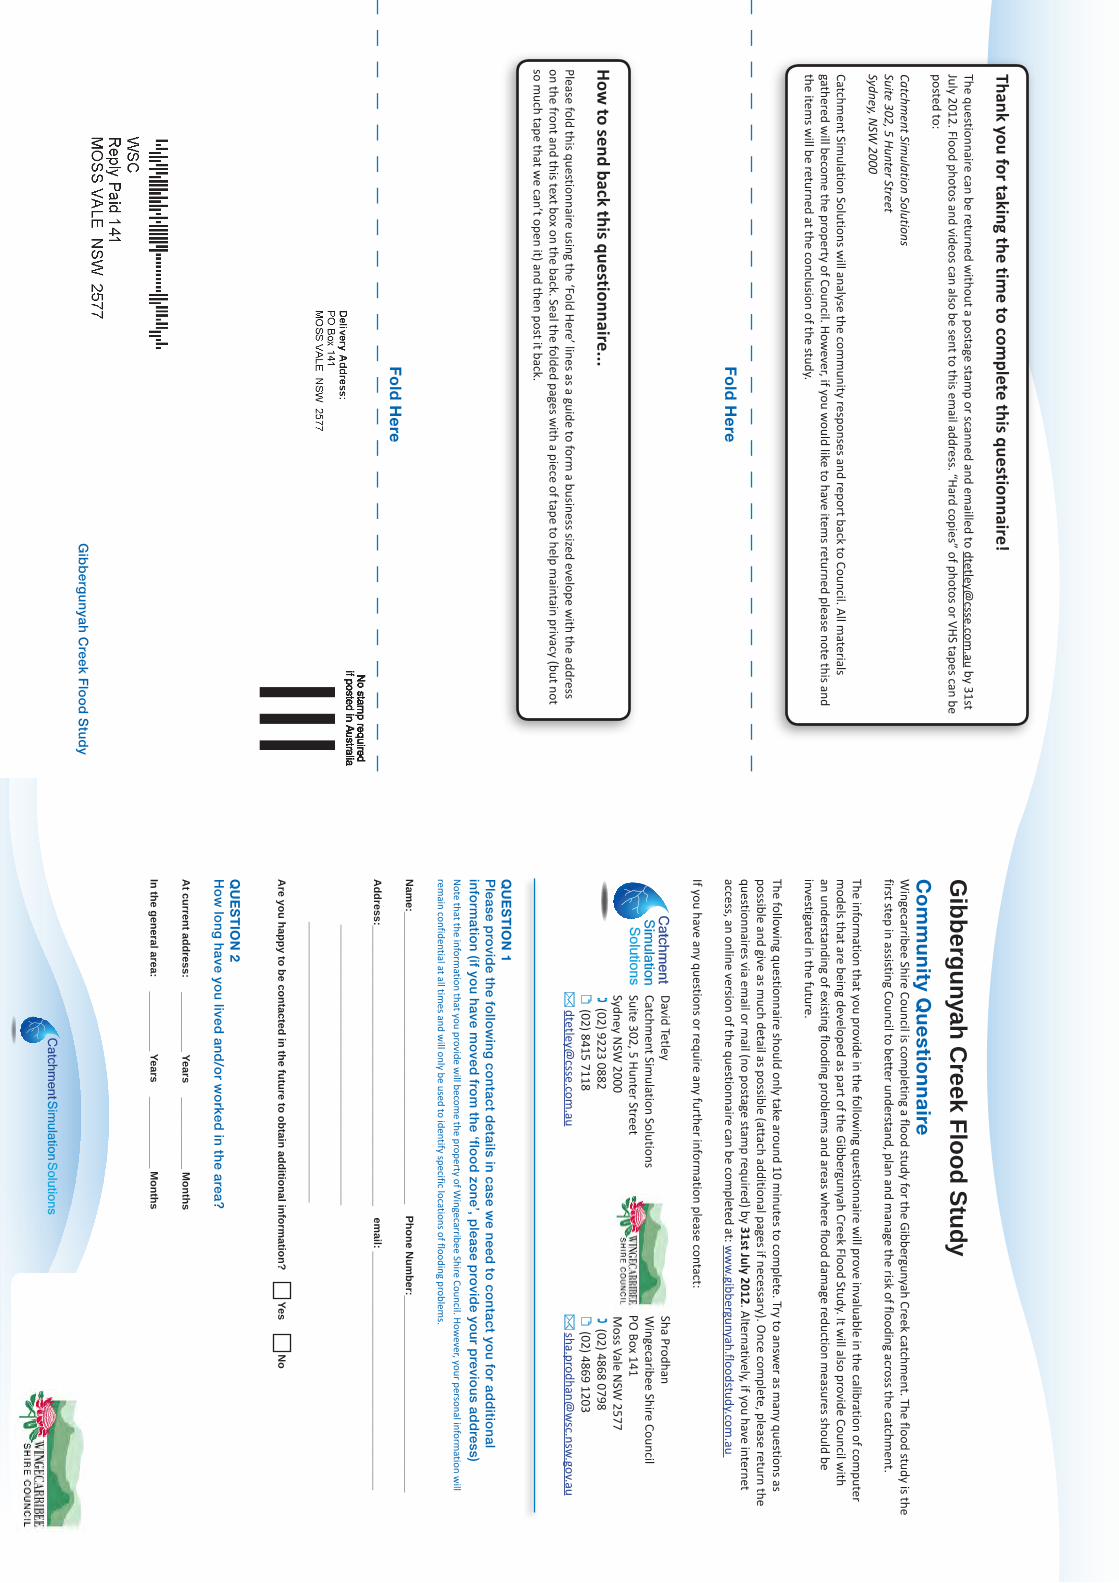
Gib
berg
unyah
Creek F
loo
d S
tud
yC
om
mu
nity Q
uestio
nn
aireW
ingecarribee Shire Council is completing a flood study for the G
ibbergunyah Creek catchment. The flood study is the
first step in assisting Council to better understand, plan and manage the risk of flooding across the catchm
ent.
The information that you provide in the follow
ing questionnaire will prove invaluable in the calibration of com
puter m
odels that are being developed as part of the Gibbergunyah Creek Flood Study. It w
ill also provide Council with
an understanding of existing flooding problems and areas w
here flood damage reduction m
easures should be investigated in the future.
The following questionnaire should only take around 10 m
inutes to complete. Try to answ
er as many questions as
possible and give as much detail as possible (attach additional pages if necessary). O
nce complete, please return the
questionnaires via email or m
ail (no postage stamp required) by 31st July 2012. Alternatively, if you have internet
access, an online version of the questionnaire can be completed at: w
ww
.gibbergunyah.floodstudy.com.au
If you have any questions or require any further information please contact:
David Tetley Sha Prodhan Catchm
ent Simulation Solutions W
ingecaribee Shire Council Suite 302, 5 Hunter Street PO
Box 141 Sydney N
SW 2000 M
oss Vale NSW
2577 (02) 9223 0882 (02) 4868 0798
(02) 8415 7118 (02) 4869 1203
dtetley@
csse.com.au
sha.prodhan@w
sc.nsw.gov.au
QU
ES
TIO
N 1
Please p
rovid
e the fo
llow
ing
con
tact details in
case we n
eed to
con
tact you
for ad
ditio
nal
info
rmatio
n (if yo
u h
ave mo
ved fro
m th
e ‘floo
d zo
ne’, p
lease pro
vide yo
ur p
reviou
s add
ress)N
ote that the information that you provide w
ill become the property of W
ingecarribee Shire Council. However, your personal inform
ation will
remain confidential at all tim
es and will only be used to identify specific locations of flooding problem
s.
Nam
e:_________________________________________________ Phone Num
ber:_________________________________
Address:_______________________________________________ em
ail: ________________________________________
_______________________________________________
_______________________________________________
Are you happy to be contacted in the future to obtain additional inform
ation? Yes No
QU
ES
TIO
N 2
Ho
w lo
ng
have yo
u lived
and
/or w
orked
in th
e area?
At current address: __________ Years ____________ M
onths
In the general area: __________ Years ____________ Months
Fo
ld H
ere
Gib
berg
un
yah C
reek Flo
od
Stu
dy
Fo
ld H
ere
Thank you for taking the time to com
plete this questionnaire! The questionnaire can be returned w
ithout a postage stamp or scanned and em
ailled to [email protected]
.au by 31st July 2012. Flood photos and videos can also be sent to this em
ail address. “Hard copies” of photos or VHS tapes can be posted to:
Catchment Sim
ulation SolutionsSuite 302, 5 Hunter StreetSydney, N
SW 2000
Catchment Sim
ulation Solutions will analyse the com
munity responses and report back to Council. All m
aterials gathered w
ill become the property of Council. How
ever, if you would like to have item
s returned please note this and the item
s will be returned at the conclusion of the study.
How
to send back this questionnaire... Please fold this questionnaire using the ‘Fold Here’ lines as a guide to form
a business sized evelope with the address
on the front and this text box on the back. Seal the folded pages with a piece of tape to help m
aintain privacy (but not so m
uch tape that we can’t open it) and then post it back.

QU
ES
TIO
N 4 - C
ON
TIN
UE
Dc) D
id yo
u keep
any rain
fall record
s du
ring
any p
ast storm
events? If so
can yo
u p
lease inclu
de a co
py o
f th
e record
s or p
rovid
e a descrip
tion
of th
e record
s belo
w?
Yes No
______________________________________________________________________________________________________
______________________________________________________________________________________________________
______________________________________________________________________________________________________
______________________________________________________________________________________________________
QU
ES
TIO
N 5
Are yo
u co
ncern
ed th
at you
r pro
perty co
uld
be flo
od
ed in
the fu
ture?
Yes No
If ‘Yes’, wh
at makes yo
u co
ncern
ed?
_____________________________________________________________________________________________________
_____________________________________________________________________________________________________
_____________________________________________________________________________________________________
______________________________________________________________________________________________________
QU
ES
TIO
N 6
Do
you
have an
y oth
er com
men
ts or in
form
ation
that yo
u th
ink w
ou
ld b
e usefu
l for th
is in
vestigatio
n? (feel free to
inclu
de sketch
es on
add
ition
al pag
es)
______________________________________________________________________________________________________
______________________________________________________________________________________________________
______________________________________________________________________________________________________
______________________________________________________________________________________________________
______________________________________________________________________________________________________
______________________________________________________________________________________________________
______________________________________________________________________________________________________
_____________________________________________________________________________________________________
_____________________________________________________________________________________________________
______________________________________________________________________________________________________
______________________________________________________________________________________________________
QU
ES
TIO
N 3
Have yo
u b
een affected
by flo
od
ing
in th
e past?
Yes No
If ‘Yes’, ho
w h
ave you
been
affected? (Yo
u can
select mo
re than
on
e. Please also
list the lo
cation
/add
ress at w
hich
the flo
od
ing
pro
blem
occu
red an
d th
e app
roxim
ate date o
f the flo
od
)
Traffic was disrupted (please provide a description below
if possible)
My back/front yard w
as flooded (please provide a description below if possible)
My house/business and its contents w
ere flooded (please provide a description below if possible)
Other (please provide a description below
if possible)
Description: ________________________________________________________________________________________________
__________________________________________________________________________________________________________
__________________________________________________________________________________________________________
___________________________________________________________________________________________________________
QU
ES
TIO
N 4
Can
you
pro
vide sp
ecific details o
r eviden
ce of h
ow
hig
h flo
od
waters reach
ed (e.g
., ph
oto
s, hig
h w
ater mark o
n b
uild
ing
, dep
th o
f water acro
ss road
way)?
Yes No
a) If ‘Yes’, please g
ive as mu
ch d
etail as po
ssible (e.g
., dates, tim
es, descrip
tion
of w
ater mo
vemen
t, dep
th o
f w
ater, floo
d m
ark locatio
n, h
igh
water m
ark on
bu
ildin
g, level o
n flo
od
dep
th in
dicato
r)?
___________________________________________________________________________________________________________
___________________________________________________________________________________________________________
__________________________________________________________________________________________________________
___________________________________________________________________________________________________________
b) In
you
r op
inio
n, w
hat w
as the m
ain so
urce/cau
se of th
e floo
din
g (e.g
., water o
vertop
pin
g creek b
anks,
blo
ckage o
f culverts/p
ipes, in
sufficien
t storm
water system
capacity)?
___________________________________________________________________________________________________________
___________________________________________________________________________________________________________
__________________________________________________________________________________________________________
___________________________________________________________________________________________________________

MAP!1
MAP!2
LEGEND!
Suite 302, 5 Hunter St
Sydney, NSW 2000
Notes:
File Name: FigureB1 Spatial Distribution of Questionnaire Responses.wor
Aerial Photograph Date: 2009
Figure A1:Spatial Distribution
of QuestionnaireResponses
LEGEND
Prepared By:
0 1
Km
Scale 1:16,000 (at A3)
WELBYWELBYWELBYWELBYWELBYWELBYWELBYWELBYWELBY
MITTAGONGMITTAGONGMITTAGONGMITTAGONGMITTAGONGMITTAGONGMITTAGONGMITTAGONGMITTAGONG
Gib
berg
unyah C
k
Gib
berg
unyah C
k
Gib
berg
unyah C
k
Gib
berg
unyah C
k
Gib
berg
unyah C
k
Gib
berg
unyah C
k
Gib
berg
unyah C
k
Gib
berg
unyah C
k
Gib
berg
unyah C
k
Nattai RNattai RNattai RNattai RNattai RNattai RNattai RNattai RNattai R
Main Southern Railway
Main Southern Railway
Main Southern Railway
Main Southern Railway
Main Southern Railway
Main Southern Railway
Main Southern Railway
Main Southern Railway
Main Southern Railway
Main
South
ern
Railw
ay
Main
South
ern
Railw
ay
Main
South
ern
Railw
ay
Main
South
ern
Railw
ay
Main
South
ern
Railw
ay
Main
South
ern
Railw
ay
Main
South
ern
Railw
ay
Main
South
ern
Railw
ay
Main
South
ern
Railw
ay
OLD HUME HWY
OLD HUME HWY
OLD HUME HWY
OLD HUME HWY
OLD HUME HWY
OLD HUME HWY
OLD HUME HWY
OLD HUME HWY
OLD HUME HWY
(((((((((((((((((((((((((((((((((((((((((((((((((
(((((((((((((((((((((((((((((((((((((((((((((((((
(((((((((((((((((((((((((((((((((((((((((((((((((
(((((((((((((((((((((((((((((((((((((((((((((((((
((((((((((((((((((((((((((((((((((((((((((((((((((((((((((((((((((((((((((((((((((((((((((((((((((
(((((((((((((((((((((((((((((((((((((((((((((((((
(((((((((((((((((((((((((((((((((((((((((((((((((
((((((((((((((((((((((((((((((((((((((((((((((((((((((((((((((((((((((((((((((((((((((((((((((((((
((((((((((((((((((((((((((((((((((((((((((((((((((((((((((((((((((((((((((((((((((((((((((((((((((
(((((((((((((((((((((((((((((((((((((((((((((((((
(((((((((((((((((((((((((((((((((((((((((((((((((
(((((((((((((((((((((((((((((((((((((((((((((((((
(((((((((((((((((((((((((((((((((((((((((((((((((
(((((((((((((((((((((((((((((((((((((((((((((((((
(((((((((((((((((((((((((((((((((((((((((((((((((
(((((((((((((((((((((((((((((((((((((((((((((((((
(((((((((((((((((((((((((((((((((((((((((((((((((
(((((((((((((((((((((((((((((((((((((((((((((((((
(((((((((((((((((((((((((((((((((((((((((((((((((
((((((((((((((((((((((((((((((((((((((((((((((((((((((((((((((((((((((((((((((((((((((((((((((((((
(((((((((((((((((((((((((((((((((((((((((((((((((
(((((((((((((((((((((((((((((((((((((((((((((((((
(((((((((((((((((((((((((((((((((((((((((((((((((
(((((((((((((((((((((((((((((((((((((((((((((((((
((((((((((((((((((((((((((((((((((((((((((((((((((((((((((((((((((((((((((((((((((((((((((((((((((
(((((((((((((((((((((((((((((((((((((((((((((((((
(((((((((((((((((((((((((((((((((((((((((((((((((
(((((((((((((((((((((((((((((((((((((((((((((((((
(((((((((((((((((((((((((((((((((((((((((((((((((
(((((((((((((((((((((((((((((((((((((((((((((((((
(((((((((((((((((((((((((((((((((((((((((((((((((
(((((((((((((((((((((((((((((((((((((((((((((((((
(((((((((((((((((((((((((((((((((((((((((((((((((
(((((((((((((((((((((((((((((((((((((((((((((((((
(((((((((((((((((((((((((((((((((((((((((((((((((
(((((((((((((((((((((((((((((((((((((((((((((((((
(((((((((((((((((((((((((((((((((((((((((((((((((
(((((((((((((((((((((((((((((((((((((((((((((((((
(((((((((((((((((((((((((((((((((((((((((((((((((((((((((((((((((((((((((((((((((((((((((((((((((((((((((((((((((((((((((((((((((((((((((((((((((((
(((((((((((((((((((((((((((((((((((((((((((((((((
(((((((((((((((((((((((((((((((((((((((((((((((((
(((((((((((((((((((((((((((((((((((((((((((((((((
(((((((((((((((((((((((((((((((((((((((((((((((((
(((((((((((((((((((((((((((((((((((((((((((((((((
(((((((((((((((((((((((((((((((((((((((((((((((((
(((((((((((((((((((((((((((((((((((((((((((((((((
((((((((((((((((((((((((((((((((((((((((((((((((((((((((((((((((((((((((((((((((((((((((((((((((((
(((((((((((((((((((((((((((((((((((((((((((((((((
(((((((((((((((((((((((((((((((((((((((((((((((((
(((((((((((((((((((((((((((((((((((((((((((((((((
(((((((((((((((((((((((((((((((((((((((((((((((((
(((((((((((((((((((((((((((((((((((((((((((((((((
(((((((((((((((((((((((((((((((((((((((((((((((((
(((((((((((((((((((((((((((((((((((((((((((((((((
(((((((((((((((((((((((((((((((((((((((((((((((((
(((((((((((((((((((((((((((((((((((((((((((((((((
(((((((((((((((((((((((((((((((((((((((((((((((((
(((((((((((((((((((((((((((((((((((((((((((((((((
(((((((((((((((((((((((((((((((((((((((((((((((((
(((((((((((((((((((((((((((((((((((((((((((((((((
(((((((((((((((((((((((((((((((((((((((((((((((((
(((((((((((((((((((((((((((((((((((((((((((((((((
(((((((((((((((((((((((((((((((((((((((((((((((((
(((((((((((((((((((((((((((((((((((((((((((((((((
(((((((((((((((((((((((((((((((((((((((((((((((((
(((((((((((((((((((((((((((((((((((((((((((((((((
(((((((((((((((((((((((((((((((((((((((((((((((((
(((((((((((((((((((((((((((((((((((((((((((((((((
(((((((((((((((((((((((((((((((((((((((((((((((((
(((((((((((((((((((((((((((((((((((((((((((((((((
(((((((((((((((((((((((((((((((((((((((((((((((((
(((((((((((((((((((((((((((((((((((((((((((((((((
((((((((((((((((((((((((((((((((((((((((((((((((( (((((((((((((((((((((((((((((((((((((((((((((((((
(((((((((((((((((((((((((((((((((((((((((((((((((
(((((((((((((((((((((((((((((((((((((((((((((((((
(((((((((((((((((((((((((((((((((((((((((((((((((
(((((((((((((((((((((((((((((((((((((((((((((((((
(((((((((((((((((((((((((((((((((((((((((((((((((
(((((((((((((((((((((((((((((((((((((((((((((((((
(((((((((((((((((((((((((((((((((((((((((((((((((
(((((((((((((((((((((((((((((((((((((((((((((((((
(((((((((((((((((((((((((((((((((((((((((((((((((
(((((((((((((((((((((((((((((((((((((((((((((((((
(((((((((((((((((((((((((((((((((((((((((((((((((
(((((((((((((((((((((((((((((((((((((((((((((((((
(((((((((((((((((((((((((((((((((((((((((((((((((
(((((((((((((((((((((((((((((((((((((((((((((((((
(((((((((((((((((((((((((((((((((((((((((((((((((
((((((((((((((((((((((((((((((((((((((((((((((((((((((((((((((((((((((((((((((((((((((((((((((((((
(((((((((((((((((((((((((((((((((((((((((((((((((
(((((((((((((((((((((((((((((((((((((((((((((((((
(((((((((((((((((((((((((((((((((((((((((((((((((
(((((((((((((((((((((((((((((((((((((((((((((((((
(((((((((((((((((((((((((((((((((((((((((((((((((
(((((((((((((((((((((((((((((((((((((((((((((((((
(((((((((((((((((((((((((((((((((((((((((((((((((
(((((((((((((((((((((((((((((((((((((((((((((((((
((((((((((((((((((((((((((((((((((((((((((((((((((((((((((((((((((((((((((((((((((((((((((((((((((
(((((((((((((((((((((((((((((((((((((((((((((((((
(((((((((((((((((((((((((((((((((((((((((((((((((
(((((((((((((((((((((((((((((((((((((((((((((((((
(((((((((((((((((((((((((((((((((((((((((((((((((
Chin
am
ans C
k
Chin
am
ans C
k
Chin
am
ans C
k
Chin
am
ans C
k
Chin
am
ans C
k
Chin
am
ans C
k
Chin
am
ans C
k
Chin
am
ans C
k
Chin
am
ans C
k
Gib
berg
unyah C
k
Gib
berg
unyah C
k
Gib
berg
unyah C
k
Gib
berg
unyah C
k
Gib
berg
unyah C
k
Gib
berg
unyah C
k
Gib
berg
unyah C
k
Gib
berg
unyah C
k
Gib
berg
unyah C
k
Iron M
ines C
k
Iron M
ines C
k
Iron M
ines C
k
Iron M
ines C
k
Iron M
ines C
k
Iron M
ines C
k
Iron M
ines C
k
Iron M
ines C
k
Iron M
ines C
k
Natta
i RN
atta
i RN
atta
i RN
atta
i RN
atta
i RN
atta
i RN
atta
i RN
atta
i RN
atta
i R
Nattai CkNattai CkNattai Ck
Nattai CkNattai Ck
Nattai CkNattai CkNattai CkNattai Ck
BOWRAL RD
BOWRAL RD
BOWRAL RDBOWRAL RD
BOWRAL RDBOWRAL RD
BOWRAL RD
BOWRAL RDBOWRAL RD
BE
SS
EM
ER
ST
BE
SS
EM
ER
ST
BE
SS
EM
ER
ST
BE
SS
EM
ER
ST
BE
SS
EM
ER
ST
BE
SS
EM
ER
ST
BE
SS
EM
ER
ST
BE
SS
EM
ER
ST
BE
SS
EM
ER
ST
OLD HUME HWY
OLD HUME HWY
OLD HUME HWY
OLD HUME HWY
OLD HUME HWY
OLD HUME HWY
OLD HUME HWY
OLD HUME HWY
OLD HUME HWY
HUME HWYHUME HWYHUME HWYHUME HWYHUME HWYHUME HWYHUME HWYHUME HWYHUME HWY
OLD BOW
RAL RD
OLD BOW
RAL RD
OLD BOW
RAL RD
OLD BOW
RAL RD
OLD BOW
RAL RD
OLD BOW
RAL RD
OLD BOW
RAL RD
OLD BOW
RAL RD
OLD BOW
RAL RD
MIT
TA
GO
NG
RD
MIT
TA
GO
NG
RD
MIT
TA
GO
NG
RD
MIT
TA
GO
NG
RD
MIT
TA
GO
NG
RD
MIT
TA
GO
NG
RD
MIT
TA
GO
NG
RD
MIT
TA
GO
NG
RD
MIT
TA
GO
NG
RD
THIRLMERETAHMOOR
BARGO
MITTAGONG
BOWRAL
MOSS VALE
BUNDANOON
Questionnaire Response LocationsHas flooding been experienced?
((((((((((((((((((((((((((((((((((((((((((((((((( Yes
((((((((((((((((((((((((((((((((((((((((((((((((( No
Roads
Railway
Watercourse
Gibbergunyah CreekCatchment
Wingecarribee ShireCouncil LGA
Figure Extent
0.5

Traffic
Disrupted
Yard
Flooded
House/Business
FloodedOther Description Flood Descriptions Source of Flooding Rainfall Records
1 37 years 60 years No No No No No No No No
2 50 years years No Yes No NoBack yard flooded when neighbour at back
loosened back fence to drain their propertyNo
Insufficient stormwater
system capacityNo No
3 23 years 32 years No Yes No No
Council drain running at back of property
overtopped send water across front yard
and driveway on 2 occasions
Water was approximately 15cm deep
but moving very quickly in first week of
Novermber 2010
Insufficient stormwater
system capacity & culvert
blockage
No
Yes - drainage channel leading to
Gibbergunyah Creek is full of
debris/branches
There were 2 storms that caused water to overtop drain
and cause damage to Gibbergunyah Lane and driveway.
Photos also provided.
4 10 years 10 years No No No No No No No
Yes - natural debris and dumping of
rubbish blocking drain in front of my
property and needs constant
attention to keep it clean. Family
can no longer do this alone.
A general cleanup every 12 months to remove
vegetation as well as council not leaving the removal of
illegal dumping to residents.
5 10 years 10 years No No No No No No No No
6 3 years 3 years No No No No No No No No
7 44 years 44 years No No No No No No No No
8 4 years 4 years No No No No No No No No
Mittagong/Meranie St has rocks,stones and other debris
after heavy rain making crossing difficult. Often
rainwater over Meranie St itself.
9 44 years 60 years No No No No No No No No
10 24 years 58 years No Yes No NoLack of drainage in the street and no
connection to creekNo No No No Guttering in street would improve the problem
11 46 years 50 years No No No No No No No No
12 13 years 28 years No No No No No No No NoPlease eradicate non native vegetation from creek bank
(Chinamans Creek)
13 13 years 38 years No No No No No No No No
14 23 years 40 years No No No No No No No No
Water runs down the hill slope through our property but
does not flood us. We have good drainage around our
house and drains cleared often.
15 0.25 years 0.25 years No No No No No No No Yes Insurance Cover
16 8 years 82 years No No No No No No No NoHave been in the areas for 82 years and have never seen
flooding problems on Henderson Road.
17 26 years 48 years No No No No No No No No
It is important to keep creeks clean and clear of weeds
and rubbish. Attached map of spill from a tributary,
transit along Thomas St and re-entry to another tributary
of Gibbergunyah Creek.
18 11 years 12 years No No No No
Heavy flow along Meranie St (12 months
ago) from OHH to Welby Cr. Caused by
drain blockage. Neighbours diverted water
saving property.
No No No No
Concern regarding insurance implications of flood prone
status. Concern for Wombats in vicinity of Gibbergunyah
Creek, and for this to be considered if flood mitigation
works occur
19 17 years 18 years No Yes No No
Approx 10 years ago, backyard flooded as
water couldn’t drain fast enough - problem
with backyard drainage
No No No
Yes - neighbours, employer said it
used to flood here, and neighbours
have previously had water inside
The Park in Anne St frequently floods, although it hasn’t
rained since the creek was cleared. The neighbours
house used to have a spring before drought.
20 9 years 9 years Yes
2005, 2008, Mittagong street was a river
and awash with stones/soil 2011/2012.
Bowral Lane awash also
Curb and guttering on stormwater
control up Mittagong St. Streets not
cleared and council verges not
maintained, blocking the few drains
there are in such hilly terrain.
Stormwater pits blocked NoYes-sinkhole may form as spring
runs under 30,32,34 Mittagong St
Lack of curb, gutter and drains in Welby. Better drainage
could prevent flooding to some extent. Maintenance of
verges (grass cutting).
21 13 years 13 years No No No No No No No No High point in area…not building an ark.
22 10 years 10 years No No No No No No No No
23 12 years 43 years No No No No No No No No
Lots of rubbish (incl.shopping trolleys) in Gibbergunyah
Ck especially on the Western side of OHH underpass,
would impact flows during flood event.
24 12 years 70 years No No No No No Blockage No No
25 40 years 40 years No No No No
Large amount of water run down back
coundary, comed out at no 12, due to old
railway line fence catching debris on
hillview property behind us.
No No No No Map - water collects from gutter
Are you worried your property
could be flooded in the future?Any additional nformation?
Current Address In General Area
Community Questionnaire Responses - Gibbergunyah Creek Flood StudyHow long have your lived in area?
#
Have you been affected by flooding in the past? Can you provide historic flood information?
Questionnaire Response Summary.xlsx Page - 1

Traffic
Disrupted
Yard
Flooded
House/Business
FloodedOther Description Flood Descriptions Source of Flooding Rainfall Records
Are you worried your property
could be flooded in the future?Any additional nformation?
Current Address In General Area
How long have your lived in area?
#
Have you been affected by flooding in the past? Can you provide historic flood information?
26 8 years 9 years No Yes No No Backyard soden as no way to runoff No No No No
27 25 years 68 years No No No No No No No No
28 36 years 36 years Yes Mittagong St was flood across Meranie St No No No No Keep the drains free of debris!
29 29 years 29 years No No No No No No No No
30 16 years 17 years No No No No No No No No
31 1.5 years 3.5 years No No No No No No No No
32 14 years 14 years No No No No No No No No
33 18.5 years 18.5 years No No No No No No No NoPrevious governor of bushcare group, would like to meet
onsite with Sha
34 35 years 80 years No No No No No No No No
35 14.75 years 14.75 years No Yes No No
Flow from culverts under Gibbergunyah
Lane causing channel through property,
storage in SE corner of property
From western side =
concentrated flow from
culverts under
Gibbergunyah Lane, from
Northern side = overland
flow adjacent property
No Yes
Detiailed information of culverts under Gibbergunyah
Lane, photos of flow through property and
stagnation/storage point
36 58 years 58 years No No No No No No No No
37 42 years 42 years No No No No No No No No
38 11 years 27 years Yes Photos previously provided to Council Photos previously provided to CouncilNot sure- surcrity of
rainfall amount perhaps
Photos previously
provided to CouncilYes - due to previous experience
39 1 years 50 years No No No No No No No No Lived at 8 Cook St for 15 years, and never had a problem
40 27.5 years 27.5 years No No No No No No No No
41 80 years 80 years No No No No
Recalls some flooding around Payten St.
The dome at Welsh St used to flood
although.
No No No No
The last time Gibbergunyah and Chinamans Ck flooded
was in Cobb & Co times. A coach had to wait at the
Hume Horse Inn until water receeded. There was no
bridge along the highway then.
42 33 years 33 years No No No No No No No No
43 34 years 63 years No No No NoGibbergunyah Ck usually 50cm after
heavy rain, never more than 1mNo No No
Gibbergunyah Ck has never surpassed 1m deep and is
usually about 50cm deep after heavy rain. It has never
burst its banks behind Spring St due to the steep
gradient, but not so fast to cause erosion.
44 9.75 years 9.75 years Yes No No NoWater across road (Hood St) near the creek
after heavy rainfall.No
Creek not cleared of
reeds causing spilling of
water
No No
45 17 years 17 years No No No Yes
Water pooling at bottom of driveway,
causing driveway to wash away as flow
from top of Thomas street rushes down
street. No stormwater drain on my side of
street.
No No No NoWater pools across road at bridge in Cook St and also in
Old Bowral Road past Gib Gak school heading south.
46 2.25 years 8 years No Yes No NoWater was just under back step. Still have
water lying under back verandah by 50MLSNo
WSC came to look and
stated pits covered with
debris.
NoYard becomes slush and we have
two small dogs.
47 years years No No No No No No NoYes - knowing that it is in a flood
area (address not supplied)
48 6 years 30 years No No No No No No No No
49 40 years 40 years No No No No No No No NoThe creek flows intermittently, the banks are very step (6
metres)
50 39.25 years 40.5 years No No No No No No No No
51 15 years 89.5 years YesDalton St East covered by 20-30cm deep
waterNo No No No
In 2001, water flowed through properties on north side
of Dalton St due to inadequite drainage through 2
culverts under Dalton St. Corner of Dalton St, water from
driveways flows across from south to north. Council
drain on north totally inadequite
Questionnaire Response Summary.xlsx Page - 2

Traffic
Disrupted
Yard
Flooded
House/Business
FloodedOther Description Flood Descriptions Source of Flooding Rainfall Records
Are you worried your property
could be flooded in the future?Any additional nformation?
Current Address In General Area
How long have your lived in area?
#
Have you been affected by flooding in the past? Can you provide historic flood information?
52 20 years 20 years No No No No No
In my experience, water
across roads is due to
blocked drains
No No I will wave to Noah if I flood.
53 42.5 years 42.5 years No No No No No No No No
54 52 years 87.75 years No No No No No No No No
55 22.5 years 30.5 years
Drainage creek between no 8&10 Cook St
overtops and flows across the road. Did not
stop traffic however.
blockage of
culverts/pipesEven with pipe cleaning, would still overflow at OHH.
56 38 years 38 years No No No No No No No No
57 7.75 years 29.25 years No No No No No No No No
58 17 years 17 years Yes Yes
Water over road in Cook St between
Elizabeth and Anne St. Backyard can flood,
but not from creek, just ponding.
Blocked pipes and
culverts, reeds in channel.
Some incomplete
records.
Following the wet summer, whole backyard is a bog
hole. Is this a backlog of water from the creek system?
Also wonder if main road drainage is working properly.
59 11.5 years 11.5 years Yes
Street became flooded so you couldn’t walk
through it…flow from spring, down cook to
elizabeth st.
Blockage in stormwater
drainage and overgrown
plants in creek
60 20 years 20 years No No No No No No No No
61 30 years 30 years No No No No No No No No
62 20 years 20 years Yes
Stormwater from roads and drains have
overflowed and then travelled through
nursery and buildings
blockage of
culverts/pipes
Yes - storm events and high
amounts of water racing through
areas causing erosion and
contamination
The need for drainage on roadways to direct high flows
away from properties
63 19 years 19 years No No No No No No No No
64 24 years 24 years No No No No No No No No
65 36 years 60 years No No No No No No No No
66 4.5 years 15 years Yes
2007, Henley Brae villa 8 - heavy rain water
came under front door & wet carpet - bad
drainage was the cause
Bad drainage at no 10
(complex of 3 - 8 to12)
drain water beside and
under road at this point
into Henley Brae
(Pavilion)
Would like to see stormwater drain covered from
Brewster to Henley Brae
67 4.25 years 4.5 years Yes yesHouse on low side of Bong Bong rd (not in
Gibbergunyah catchment). Early 2008
Shopping centre (Big W and Aldi) are probably subjected
to flooding in carparks. Flash flooding main concern.
68 12 years 17 years No No No No No No No No
69 13 years 13 years Yes Yes
Annually, water builds to bottom rail on
pailing fence. Cook St flooded between
Elizabeth & Anne St on any heavy rain
occurrence
Gushing down driveway, running into
garage, pool, lawn, pooling at back
fence to nearly knee height (had to
knock fence pailings off to let water
through)
Blocked drain and creek
overflow (overgrown of
weeds), uncleaned
gutters/drains
No
Yes - backyard becomes unusable
due to large amount of water
running over/into it
Regular cleaning of creek and gutters to stop it running
through properties
70 13.5 years 50 years YesDalton St flooded, rubbish left behind,
locals + council cleaned up
Yes - maybe bottom of yard, not
house
Stormwater drains, but cant do too much when it really
comes down
71 50 years 50 years Yes
The last time it flooded was 2002, a little
creek out the back as didn’t drain correctly
between Lyell and Anne Rd but better now
due to deviation of water and piping
Lack of cleaning which
has recently improved
Yes - since 2002, in
diaries so difficult to
copy but will if
absolutely necissary
No - but a good regime of cleaning
pipes should be done as even
cleaning cant stop kids throwing
objects into pipes.
72 16 years 71 years No No No NoI have never experienced floods in Medway,
bowral or MittagongNo No No No
73 25 years 25 years No No No No No No No No
74 8.5 years 8.5 years No No No No No No No No
75 5 years 5 years No No No No No No No No
76 47 years 47 years No No No No No No No No
77 5 years 10 years No No No No No No No
Yes - new development taking place
in area could change drainage
patterns, Climate change increase
rainfall
78 5 years 5 years No No No No No No No
Yes- map provided with
questionaaire shows where
watercourses run
Outside study area
79 24 years 24 years No No No No No No No No
Questionnaire Response Summary.xlsx Page - 3

Traffic
Disrupted
Yard
Flooded
House/Business
FloodedOther Description Flood Descriptions Source of Flooding Rainfall Records
Are you worried your property
could be flooded in the future?Any additional nformation?
Current Address In General Area
How long have your lived in area?
#
Have you been affected by flooding in the past? Can you provide historic flood information?
80 27.5 years 27.5 years No No No No No No No No
81 30 years 32 years No No No No NoBlocked creek with
overgrowthNo No
Upstream land use rezoning on Gibbergunyah Ck for
more residential land
82 20 years 22 years Yes
Backyard has flooded several times, not due
to creek but hilly rural land runoff from
between Bowral golf course. Needs a
culvert and re-grading to creek
Western side of John
street needs grading and
culvert put in.
No yes
Gibbergunyah Ck behing #74 Spring St will not flood over
the banks as the erosion has resulted in approx 3m deep
gully
83 8.5 years 24.5 years No No No No No No No NoConcerns for increased insurance if a street is 'coloured'
as flood liable
84 12.75 years 12.75 years YesAt back fence, about 4 inches in depth, runs
in from back of Gib Gate school
Yes - lots of rain with the levee that
was built out the back a couple of
years ago.
Get rid of levee out back and put in drainage.
85 13 years 13 years No No No No No No No No Keep creeks free of vegetation and rubbish
86 24 years 24 years No No No No No No No No Concers for vehicular access via Lyell St
87 17.25 years 37 years No No No No No No No No
88 25 years 52 years Yes Creek crossing over Cook St, opposite park No
All reasons (overtopping,
blockage, insufficient
capacity)
No No
89 48 years 75 years No No No No No No No No
I have never seeen the creeks flood, the overgrowth in
the channels could cause a problem with continuous and
heavy rain
90 6 years 10 years No No No No No No No No
Property not directly impacted, local roads have been
constantly eroded due to runoff and absence of
guttering. Mitigation works should include Kerb &
guttering to maximise effectiveness
91 25 years 25 years Yes
Flooding over road in Cook St - near the
park - often water on road after/during rain
due to blockage
No No No NoClear reeds,bushes,etc leads to overflows & Road
Drainage
92 12 years 12 years No No No No No No No No
93 2 years 20 years No No No No No No No NoLots of rubbish in creek and rivulets, should organise
cleanup.
94 4 years 27 years No No No No No No No No
95 52 years 60 years No No No No No NoMeasure but don’t
keep recordsNo
96 1 years 10 years Yes No No No No No No
97 38 years 38 years No No No No No No No No
98 8 years 8 years No No No No No No No No Oily water seeping out of the ground
99 3 years 6.75 years Yes
Water from Thomas St residences flowed
through yard/under house. Water also
flows from Richard/Hood St through front
yard
Insufficient Stormwater
Capacity
100 13.75 years 13.75 years No No No No No No
Feb 2012 -266mm (for
the month) Nov
26,2010 storm, 52mm,
total for month 228mm
Creek in "flood" from this event (2010) but below top of
bank
101 16 years 30 years No No No No No No No NoAbout 2 years ago, creek swelled into a raging torrent,
house was not in danger. No photos taken.
102 3 years 13 years No Yes Yes details sent to Phil MarshallInsufficient Stormwater
Capacity
Yes, because it has flooded in the
past
I have been trying to get something done for 2 years, I
am not keen to invest more time unless it is face to face
103 22 years 22 years Yes YesNumerous flood events - photos and
documents provided
Insufficient
drainage/stormwater on
Bowral lane
No Yes - recent history of flooding See attached documents
104 10.5 years 12 years No No No No No No No
Yes - trees which have fallen into the
creek may cause blockage and
flooding to adjacent properties
105 8 years 8 years No Yes Yes
Water flowing into backyard from
neighbours yards. It took a few days to
soak into the ground.
No No NoNo -not sure, maybe if it rained
heavy for a few days
Questionnaire Response Summary.xlsx Page - 4

Traffic
Disrupted
Yard
Flooded
House/Business
FloodedOther Description Flood Descriptions Source of Flooding Rainfall Records
Are you worried your property
could be flooded in the future?Any additional nformation?
Current Address In General Area
How long have your lived in area?
#
Have you been affected by flooding in the past? Can you provide historic flood information?
106 2 years 5 years No No No No No No No
107 10.25 years 54.25 years No No No No No No No
108 12.25 years 12.25 years No No No No No No No
109 11.25 years 12 years No No No No No NoYes, I have records
from 2002No
110 2 years 12 years Yes Yes
Back shed damaged, driveway had to be
replaced. 2004 approx, Severe rain and
poorly maintained drainage system caused
flooding
Insufficient stormwater
capacity, poorly
maintained drainage
Yes - Drainage problems still exist,
William, Thomas and John st subject
to flooding from poor drainage
More effective/modern drainage. It is unsatisfactory that
ratepayers have to endure lack of/no drainage
111 79 years 79 years No No No No No No No
112 7 years 7 years No No No No
Blocked drain between Elizabeth and Cook
ST sometimes impacts traffic. Council has
recently removed reeds anc cleared
channel.
No No No No
At no time, even with extreme conditions has
Gibbergunyah Creek not been able to cope. Rubbish
contributes to clockage and a tree blocks creek and will
cause eventual blockage. Council has not removed after
serveral calls.
113 1 years 1 years No No No No No No No No
114 27 years 33 years No No No No No No No No
115 11.25 years 11.25 years Yes Yes
Deep water frequently on Cook St, water
collects on Spring St. Backyard continues to
flood despite small drainage channels with
blue metal/gravel
Photos emailed of John st 2008-2010 of
runoff from Gibbergunyah Estate onto
John St with water marker in backyard.
Insufficient stormwater
capacity, residence where
dam was previously,
water table height,
springs.
No
Yes - backyard currently floods,
springs will not dissappear, and
curent drainage inadequite
Emailed photos should be of assistance, neighbour has a
council installed drain, amny residences (including ours)
need this also! *More Drainage Essential*
116 45 years 45 years No No No No No No No No
117 45 years 45 years No No No No No No No No
118 8.75 years 20.75 years Yes Yes
Water for gutters was too much for grate
inlet, council has replaced inlet with drain
entrance. Prior to replacement, had water
throughou 10x4m garage
Stormwater down driveway was 12
inches high, flooding garage at end of
driveway
Stormwater grate
blocked, was wrong sort
of grate, has been
rectified
No No
119 3 years 3 years Yes No No No No No No No
Tennants have never complained about flooding in over
10 years. The soil through the front section get
extremely wet during periods of wet weather.
120 17 years 17 years No No No No No No No No
121 14 years 14 years No No No No No No No No
122 25 years 25 years No No No No No No No
Yes- fallen trees may cause
obstruction and have not been
removed or attended to.
123 10 years 15 years Yes Yes
11 Years ago flooding in area from creek
that runs from Elizabeth to Cook St, roads
closed for 2 days. We were all isolated and
some houses flooded. Lots of water from
Mt Gibraltar. Water diverts across the road
(Dalton St) and through peoples properties.
Lights at Bessemer/Bowral St floods as
insufficient drainage.
Blockage of
culverts/pipes and
insufficient capacity.
Cleaning needs to be
undertaken, especially in
winter when leaves fill
gutters/drains.
Yes - the water that comes from the
embankment on Bowral Rd is
suppose to go directly into
Chinamans Creek and it comes into
my yard and then it washes out
driveway access away
124 28 years 28 years No No No No No No No No
125 4 years 40 years Yes
We've had minor flooding in our yard. We
also had a blockage in the drain on the road
on Thomas Street which led to flooding
through our property during a severe
downpour.
the water came up to about 20 cms
through our property caused by a
blockage in the drain on Thomas St.
Blockage of the
stormwater drain on
Thomas St.
We have a small creek running
through our property, so always a
potential issue. We have had
incredibly wet weather this year and
no flooding to cause major damage
to our yard.
We do have considerable issues with water laying in the
south east corner of our block. It appears that the
problem is stemming from a lack of any culverts or
drainage along the western side of Elizabeth St outside
our property.
Questionnaire Response Summary.xlsx Page - 5

Traffic
Disrupted
Yard
Flooded
House/Business
FloodedOther Description Flood Descriptions Source of Flooding Rainfall Records
Are you worried your property
could be flooded in the future?Any additional nformation?
Current Address In General Area
How long have your lived in area?
#
Have you been affected by flooding in the past? Can you provide historic flood information?
126 7 years 9 years Yes
Cook St used to flood across the road
regularly, works have been done to rectify
this, however bank stabilisation has been
neglected. My neighbour adjusts the height
of the pipe and stormwater entry. There are
kerb and gutter on neighbours but nit my
place. A pothole helps direct water away.
Road surface is eroding on verge.
Probably a combination
of blockages from tree
roots, an insufficient
stormwater capacity and
there being combinations
of areas with and without
cubs and guttering.
127 5 years 5 years Yes
A very brief inundation of side yard - water
coming from next door.
About 3 cm of water on two occasions
after very heavy rain.
Neighbours yard built to a
level higher than ours, no
drainage on their side.
The non-existance of
drainage pipes adds to
the problem
Emailed
128 years years
129 17 years 20 years No No No No No No No No
130 20 years 41 years No No No No No No No
yes -due to changing weather
patterns and increased in-fill
development, run-off will increase.
The block can be frequently sodden (marshy) underfoot,
due to rainfall, run-off from rainfall, and shading from
trees. I have undertaken drainage measures to protect
my built property from being affected
131 1 years 5 years Yes
Council land adjacent to property runs off
into our backyard causing it to become a
lake. During prolonged rain, open drain at
front of property overflows and water
comes straight down driveway and into
garage. Ditch drain in crown land is
completely unsuitable for the flow even
when only slightest bit of rain. The ditch
gets blocked with branches, sticks and
debris then overflows. Ditch is extremely
dangerous to children as flows and has a
steep drop into pipe without grate cover.
water sits for weeks and gets smelly. Angle
of culvert is not enough for it to runiff into
drain.
Insufficient stormwater
system has overtopped
across John St from
'Kennards land'. Blockage
from insufficient trench
on crown land also causes
overflowing. Culvert in-
front and on crown land
is insufficient.
Yes - in Jan 2011, garage flooded
and all belongings under a foot of
water
132 6 years 18 years No No No No No No NoYes - property has been listed as a 1
in 100 year flood risk
133 38 years 64 years No No No NoChinamans Ck has never flooded in the 38+
years we have lived hereNo No No No
The Flood Study is a total waste of time for the two
creeks nominated.
134 50 years 50 years No No No No No No No No
There has never been any flooding. The map provided is
inaccurate in its depiction of the creek alignment and I
hope the simulated solution is accurate and not based on
this map.
135 21 years 39 years Yes Yes Yes Yes
Water ran from vacant land south of John
St, drain blocked, water overflowed through
yards to my property about 200mm deep.
(1997,1999,2003)
I have photos of all three events if
needed.
Each time was due to
blocked drain in John St
and runoff from land
south of John St
No
Yes, no attention or improvements
to the drainage and water
channeling options have been made
after the three floods.
The entire area appears to be channeled via the drain
and the creek in flood conditions backs up and is blocked
by debris.
136 0.5 years 0.5 years Yes
When heavy rain falls, water flows across
Bowral St, down our driveway, under the
house and makes backyard sodden for
days/weeks afterwards
Photos of March/April 2012, dug a
trench and installed a french drain to
disperse water. We also dug a second
drain further down the garden. Also
dug shallow trnch on Bowral St to
prevent water across Bowral St.
Insufficient drainage on
Bowral St. this
exacerbates the drainage
problems with the clay
soils in the backyard.
No
yes, we wxpect water to collect
under the house and garden unless
drainage along Bowral St is
improved.
Questionnaire Response Summary.xlsx Page - 6

APPENDIX B
XP-RAFTS MODEL INPUT PARAMETERS

0.0
10,000.0
20,000.0
30,000.0
40,000.0
50,000.0
60,000.0
70,000.0R
ain
fall
(mm
)
Date/Time
Stage-Discharge Relationship
Stage-Storage Relationship
LEGEND:
Notes:
File Name: Lake Alexandra Stage Storage and Stage Discharge.xls
Figure B1:
Stage-Storage and Stage- Discharge
Relationships for Lake Alexandra
LEGEND:
Notes:
LEGEND:
Notes:
Suite 302, 5 Hunter Street Sydney, NSW, 2000
0
20
40
60
80
100
120
140
0
5,000
10,000
15,000
20,000
25,000
30,000
35,000
40,000
45,000
50,000
620.5 620.7 620.9 621.1 621.3 621.5 621.7 621.9 622.1 622.3 622.5
Dis
ch
arg
e (
m3/s
)
Sto
rag
e (
m3)
Stage (mAHD)
LEGEND:
Notes:
LEGEND:
Notes:
Prepared By:
Suite 302, 5 Hunter Street Sydney, NSW, 2000

XP-RAFTS INPUT PARAMETERS - Gibbergunyah Creek
Subcatchment ID Sub-Area Area [ha]Catchment Slope
[%]
Percentage
Impervious [%]Mannings 'n'
1 3.28 51.00 0 0.079
2 0.27 51.00 100 0.015
1 4.19 13.90 0 0.057
2 1.02 13.90 100 0.015
1 2.12 15.62 0 0.072
2 0.29 15.62 100 0.015
1 4.00 16.38 0 0.065
2 0.56 16.38 100 0.015
1 5.74 12.01 0 0.077
2 0.56 12.01 100 0.015
1 5.61 9.80 0 0.093
2 0.61 9.80 100 0.015
1 0.71 6.69 0 0.078
2 0.12 6.69 100 0.015
1 4.50 11.61 0 0.083
2 0.41 11.61 100 0.015
1 4.75 10.05 0 0.072
2 0.25 10.05 100 0.015
1 1.73 13.11 0 0.066
2 0.09 13.11 100 0.015
1 5.71 8.87 0 0.087
2 0.30 8.87 100 0.015
1 1.12 9.96 0 0.074
2 0.06 9.96 100 0.015
1 5.56 4.16 0 0.064
2 0.64 4.16 100 0.015
1 7.02 4.81 0 0.062
2 1.05 4.81 100 0.015
1 2.39 4.30 0 0.069
2 0.50 4.30 100 0.015
1 4.66 4.67 0 0.047
2 1.08 4.67 100 0.015
1 1.02 5.14 0 0.044
2 0.57 5.14 100 0.015
1 4.10 5.86 0 0.060
2 1.15 5.86 100 0.015
1 2.93 4.95 0 0.057
2 0.50 4.95 100 0.015
1 2.68 7.24 0 0.088
2 0.19 7.24 100 0.015
1 2.12 7.15 0 0.041
2 3.17 7.15 100 0.015
1 2.15 7.97 0 0.048
2 1.24 7.97 100 0.015
1 4.11 10.99 0 0.095
2 0.22 10.99 100 0.015
1.19
1.2
1.21
1.22
1.23
1.1
1.11
1.12
1.13
1.14
1.15
1.16
1.17
1.18
1.01
1.02
1.03
1.04
1.05
1.06
1.07
1.08
1.09
Gibbergunyah XP-RAFTS Inputs
XP-RAFTS Inputs Existing.xlsx Page - 1

Subcatchment ID Sub-Area Area [ha]Catchment Slope
[%]
Percentage
Impervious [%]Mannings 'n'
1 0.67 12.30 0 0.083
2 0.18 12.30 100 0.015
1 6.10 10.97 0 0.092
2 0.91 10.97 100 0.015
1 6.44 10.24 0 0.096
2 0.60 10.24 100 0.015
1 3.43 13.68 0 0.095
2 0.39 13.68 100 0.015
1 2.79 32.90 0 0.094
2 0.37 32.90 100 0.015
1 9.12 26.41 0 0.098
2 0.67 26.41 100 0.015
1 9.52 26.52 0 0.087
2 0.71 26.52 100 0.015
1 3.93 30.41 0 0.076
2 0.68 30.41 100 0.015
1 6.63 28.84 0 0.095
2 0.70 28.84 100 0.015
1 3.16 29.30 0 0.094
2 0.30 29.30 100 0.015
1 3.25 18.93 0 0.066
2 0.36 18.93 100 0.015
1 2.33 30.57 0 0.100
2 0.12 30.57 100 0.015
1 7.15 17.94 0 0.095
2 0.38 17.94 100 0.015
1 1.04 31.36 0 0.100
2 0.05 31.36 100 0.015
1 2.91 29.01 0 0.100
2 0.15 29.01 100 0.015
1 4.86 15.66 0 0.100
2 0.26 15.66 100 0.015
1 7.48 6.28 0 0.061
2 1.05 6.28 100 0.015
1 0.37 14.30 0 0.052
2 0.13 14.30 100 0.015
1 4.92 15.76 0 0.100
2 0.26 15.76 100 0.015
1 3.05 21.93 0 0.100
2 0.16 21.93 100 0.015
1 10.63 15.77 0 0.097
2 1.03 15.77 100 0.015
1 7.05 10.98 0 0.100
2 0.37 10.98 100 0.015
1 6.91 10.49 0 0.100
2 0.36 10.49 100 0.015
1 2.70 22.26 0 0.100
2 0.14 22.26 100 0.015
5.01
5.02
1.28
1.29
1.3
1.31
1.32
1.33
3.01
3.02
4.01
2.01
1.24
1.25
1.26
1.27
9.01
9.02
9.03
9.04
6.01
6.02
7.01
8.01
Gibbergunyah XP-RAFTS Inputs
XP-RAFTS Inputs Existing.xlsx Page - 2

Subcatchment ID Sub-Area Area [ha]Catchment Slope
[%]
Percentage
Impervious [%]Mannings 'n'
1 5.07 21.69 0 0.100
2 0.27 21.69 100 0.015
1 0.60 19.26 0 0.100
2 0.03 19.26 100 0.015
1 2.00 6.78 0 0.097
2 0.11 6.78 100 0.015
1 2.18 30.79 0 0.100
2 0.11 30.79 100 0.015
1 7.41 14.69 0 0.096
2 0.83 14.69 100 0.015
1 11.49 14.29 0 0.096
2 1.09 14.29 100 0.015
1 5.88 10.85 0 0.100
2 0.31 10.85 100 0.015
1 12.22 14.27 0 0.098
2 0.90 14.27 100 0.015
1 2.63 13.26 0 0.100
2 0.14 13.26 100 0.015
1 2.87 24.42 0 0.100
2 0.15 24.42 100 0.015
1 5.15 25.44 0 0.100
2 0.27 25.44 100 0.015
1 3.48 17.24 0 0.100
2 0.18 17.24 100 0.015
1 3.43 20.12 0 0.100
2 0.18 20.12 100 0.015
1 4.40 19.87 0 0.100
2 0.23 19.87 100 0.015
1 4.05 10.57 0 0.091
2 0.25 10.57 100 0.015
1 6.50 24.82 0 0.099
2 0.34 24.82 100 0.015
1 9.49 14.49 0 0.091
2 0.50 14.49 100 0.015
1 11.13 8.13 0 0.082
2 0.59 8.13 100 0.015
1 4.66 5.72 0 0.073
2 0.30 5.72 100 0.015
1 9.04 15.17 0 0.100
2 0.48 15.17 100 0.015
1 5.81 13.02 0 0.100
2 0.31 13.02 100 0.015
1 2.30 7.95 0 0.084
2 0.19 7.95 100 0.015
1 7.26 7.83 0 0.052
2 0.38 7.83 100 0.015
1 4.13 5.59 0 0.047
2 0.54 5.59 100 0.015
9.05
9.06
14.01
14.02
15.01
16.01
16.02
16.03
9.07
10.01
11.01
12.01
12.02
13.01
19.02
19.03
20.01
21.01
17.01
18.01
18.02
18.03
18.04
19.01
Gibbergunyah XP-RAFTS Inputs
XP-RAFTS Inputs Existing.xlsx Page - 3

Subcatchment ID Sub-Area Area [ha]Catchment Slope
[%]
Percentage
Impervious [%]Mannings 'n'
1 1.93 8.93 0 0.054
2 0.20 8.93 100 0.015
1 5.19 4.36 0 0.046
2 0.75 4.36 100 0.015
1 3.79 5.85 0 0.057
2 0.54 5.85 100 0.015
1 7.16 5.08 0 0.052
2 0.50 5.08 100 0.015
1 2.34 4.26 0 0.030
2 0.98 4.26 100 0.015
1 2.47 4.64 0 0.031
2 1.27 4.64 100 0.015
1 1.99 4.05 0 0.031
2 1.00 4.05 100 0.015
1 3.33 8.93 0 0.053
2 0.18 8.93 100 0.015
1 2.12 8.10 0 0.045
2 0.35 8.10 100 0.015
1 4.15 4.51 0 0.050
2 1.25 4.51 100 0.015
1 2.07 2.45 0 0.041
2 0.37 2.45 100 0.015
1 1.47 7.31 0 0.032
2 0.28 7.31 100 0.015
1 3.43 7.14 0 0.064
2 0.37 7.14 100 0.015
1 2.19 4.48 0 0.048
2 0.12 4.48 100 0.015
1 1.41 69.95 0 0.075
2 0.34 69.95 100 0.015
1 1.86 12.46 0 0.057
2 0.31 12.46 100 0.015
1 1.52 9.88 0 0.064
2 0.19 9.88 100 0.015
1 1.32 7.53 0 0.055
2 0.38 7.53 100 0.015
1 1.58 4.67 0 0.053
2 0.14 4.67 100 0.015
1 0.68 3.40 0 0.056
2 0.12 3.40 100 0.015
1 1.12 5.66 0 0.069
2 0.28 5.66 100 0.015
1 1.50 4.69 0 0.053
2 0.58 4.69 100 0.015
1 3.18 4.22 0 0.053
2 0.17 4.22 100 0.015
1 4.35 4.11 0 0.055
2 1.01 4.11 100 0.015
22.01
22.02
25.01
26.01
26.02
26.03
27.01
27.02
22.03
23.01
23.02
23.03
23.04
24.01
28.07
28.08
28.09
28.1
28.01
28.02
28.03
28.04
28.05
28.06
Gibbergunyah XP-RAFTS Inputs
XP-RAFTS Inputs Existing.xlsx Page - 4

Subcatchment ID Sub-Area Area [ha]Catchment Slope
[%]
Percentage
Impervious [%]Mannings 'n'
1 1.78 3.37 0 0.031
2 0.76 3.37 100 0.015
1 0.67 2.21 0 0.047
2 0.14 2.21 100 0.015
1 0.63 1.78 0 0.043
2 0.14 1.78 100 0.015
1 0.76 4.07 0 0.046
2 0.21 4.07 100 0.015
1 2.63 8.04 0 0.054
2 0.58 8.04 100 0.015
1 0.93 81.96 0 0.066
2 0.72 81.96 100 0.015
1 2.35 13.61 0 0.063
2 0.36 13.61 100 0.015
1 3.56 7.77 0 0.057
2 0.44 7.77 100 0.015
1 1.05 3.09 0 0.060
2 0.36 3.09 100 0.015
1 1.47 8.18 0 0.087
2 0.27 8.18 100 0.015
1 3.23 45.15 0 0.081
2 0.95 45.15 100 0.015
1 3.63 11.24 0 0.073
2 0.49 11.24 100 0.015
1 2.18 8.65 0 0.054
2 0.55 8.65 100 0.015
1 3.55 5.39 0 0.053
2 0.59 5.39 100 0.015
1 0.51 3.04 0 0.061
2 0.50 3.04 100 0.015
1 2.82 4.59 0 0.051
2 0.53 4.59 100 0.015
1 3.66 3.51 0 0.048
2 0.93 3.51 100 0.015
1 1.98 6.27 0 0.068
2 0.22 6.27 100 0.015
1 2.79 43.31 0 0.098
2 0.21 43.31 100 0.015
1 1.72 10.37 0 0.063
2 0.27 10.37 100 0.015
1 1.32 9.45 0 0.070
2 0.25 9.45 100 0.015
1 1.71 11.19 0 0.067
2 0.46 11.19 100 0.015
1 2.69 4.13 0 0.057
2 0.70 4.13 100 0.015
1 1.24 2.25 0 0.031
2 3.12 2.25 100 0.015
28.11
28.12
32.01
33.01
33.02
33.03
33.04
34.01
28.13
28.14
29.01
30.01
30.02
31.01
38.03
38.04
38.05
38.06
35.01
35.02
36.01
37.01
38.01
38.02
Gibbergunyah XP-RAFTS Inputs
XP-RAFTS Inputs Existing.xlsx Page - 5
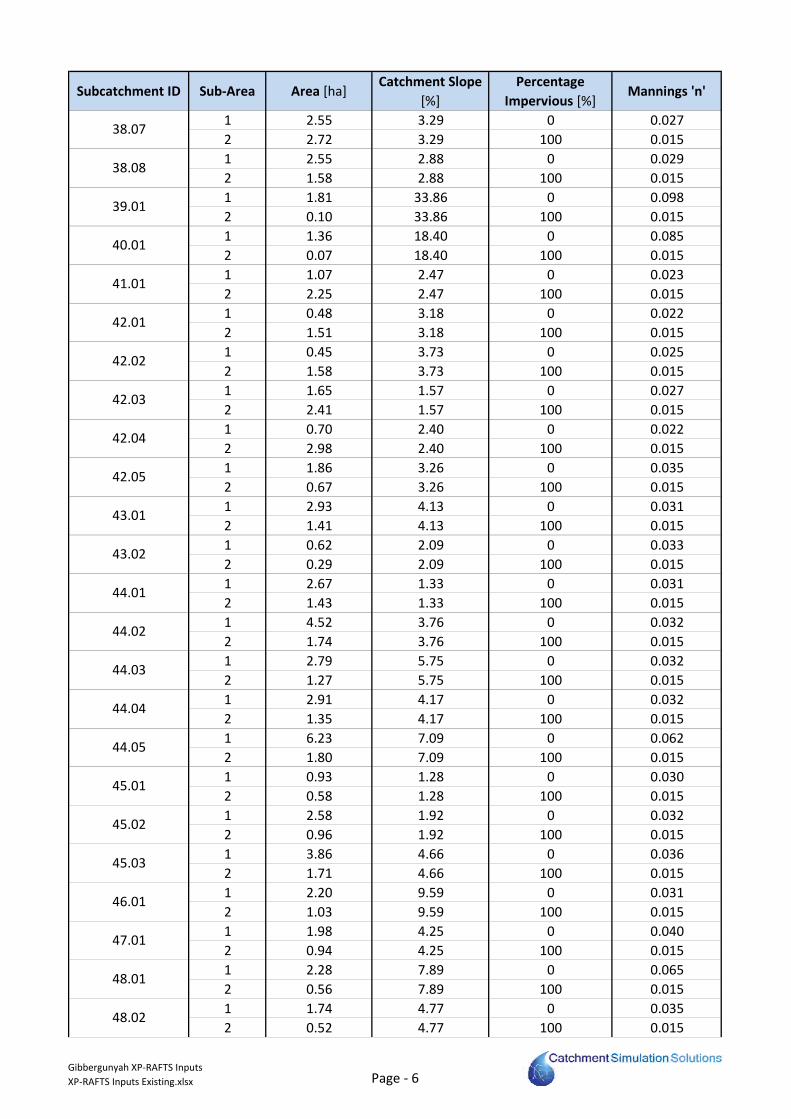
Subcatchment ID Sub-Area Area [ha]Catchment Slope
[%]
Percentage
Impervious [%]Mannings 'n'
1 2.55 3.29 0 0.027
2 2.72 3.29 100 0.015
1 2.55 2.88 0 0.029
2 1.58 2.88 100 0.015
1 1.81 33.86 0 0.098
2 0.10 33.86 100 0.015
1 1.36 18.40 0 0.085
2 0.07 18.40 100 0.015
1 1.07 2.47 0 0.023
2 2.25 2.47 100 0.015
1 0.48 3.18 0 0.022
2 1.51 3.18 100 0.015
1 0.45 3.73 0 0.025
2 1.58 3.73 100 0.015
1 1.65 1.57 0 0.027
2 2.41 1.57 100 0.015
1 0.70 2.40 0 0.022
2 2.98 2.40 100 0.015
1 1.86 3.26 0 0.035
2 0.67 3.26 100 0.015
1 2.93 4.13 0 0.031
2 1.41 4.13 100 0.015
1 0.62 2.09 0 0.033
2 0.29 2.09 100 0.015
1 2.67 1.33 0 0.031
2 1.43 1.33 100 0.015
1 4.52 3.76 0 0.032
2 1.74 3.76 100 0.015
1 2.79 5.75 0 0.032
2 1.27 5.75 100 0.015
1 2.91 4.17 0 0.032
2 1.35 4.17 100 0.015
1 6.23 7.09 0 0.062
2 1.80 7.09 100 0.015
1 0.93 1.28 0 0.030
2 0.58 1.28 100 0.015
1 2.58 1.92 0 0.032
2 0.96 1.92 100 0.015
1 3.86 4.66 0 0.036
2 1.71 4.66 100 0.015
1 2.20 9.59 0 0.031
2 1.03 9.59 100 0.015
1 1.98 4.25 0 0.040
2 0.94 4.25 100 0.015
1 2.28 7.89 0 0.065
2 0.56 7.89 100 0.015
1 1.74 4.77 0 0.035
2 0.52 4.77 100 0.015
38.07
38.08
42.04
42.05
43.01
43.02
44.01
44.02
39.01
40.01
41.01
42.01
42.02
42.03
46.01
47.01
48.01
48.02
44.03
44.04
44.05
45.01
45.02
45.03
Gibbergunyah XP-RAFTS Inputs
XP-RAFTS Inputs Existing.xlsx Page - 6

Subcatchment ID Sub-Area Area [ha]Catchment Slope
[%]
Percentage
Impervious [%]Mannings 'n'
1 1.56 12.99 0 0.054
2 0.52 12.99 100 0.015
1 3.01 10.32 0 0.054
2 0.89 10.32 100 0.015
1 3.73 13.92 0 0.100
2 0.20 13.92 100 0.015
1 1.85 10.33 0 0.090
2 0.23 10.33 100 0.015
1 3.93 7.68 0 0.052
2 0.51 7.68 100 0.015
1 2.56 11.31 0 0.041
2 0.30 11.31 100 0.015
1 2.89 21.96 0 0.076
2 0.25 21.96 100 0.015
1 3.76 22.86 0 0.095
2 0.34 22.86 100 0.015
1 4.70 15.43 0 0.097
2 0.41 15.43 100 0.015
1 2.89 9.81 0 0.093
2 0.44 9.81 100 0.015
1 4.98 8.58 0 0.084
2 0.89 8.58 100 0.015
1 2.68 0.49 0 0.056
2 1.53 0.49 100 0.015
1 1.66 3.46 0 0.050
2 0.38 3.46 100 0.015
1 4.44 4.23 0 0.043
2 1.54 4.23 100 0.015
1 1.03 3.07 0 0.032
2 1.06 3.07 100 0.015
1 2.11 2.92 0 0.037
2 1.73 2.92 100 0.015
1 1.76 7.25 0 0.040
2 1.73 7.25 100 0.015
1 2.19 15.53 0 0.053
2 0.50 15.53 100 0.015
1 2.57 26.59 0 0.090
2 0.41 26.59 100 0.015
1 2.66 13.18 0 0.067
2 1.72 13.18 100 0.015
1 5.24 18.75 0 0.076
2 0.82 18.75 100 0.015
1 3.12 36.58 0 0.099
2 0.20 36.58 100 0.015
1 4.66 22.37 0 0.096
2 0.25 22.37 100 0.015
1 5.22 19.88 0 0.070
2 1.03 19.88 100 0.015
49.01
50.01
52.05
52.06
52.07
52.08
52.09
52.1
50.02
51.01
52.01
52.02
52.03
52.04
54.02
54.03
54.04
55.01
52.11
52.12
52.13
53.01
53.02
54.01
Gibbergunyah XP-RAFTS Inputs
XP-RAFTS Inputs Existing.xlsx Page - 7

Subcatchment ID Sub-Area Area [ha]Catchment Slope
[%]
Percentage
Impervious [%]Mannings 'n'
1 2.41 6.64 0 0.067
2 1.25 6.64 100 0.015
1 3.61 34.07 0 0.094
2 0.61 34.07 100 0.015
1 2.42 14.16 0 0.056
2 0.50 14.16 100 0.015
1 3.08 31.29 0 0.094
2 0.44 31.29 100 0.015
1 1.08 23.73 0 0.099
2 0.06 23.73 100 0.015
1 3.21 24.78 0 0.097
2 0.17 24.78 100 0.015
1 3.55 18.65 0 0.042
2 0.24 18.65 100 0.015
1 8.89 17.99 0 0.079
2 0.63 17.99 100 0.015
1 5.15 10.37 0 0.092
2 0.48 10.37 100 0.015
1 0.54 24.44 0 0.099
2 0.03 24.44 100 0.015
1 3.23 5.52 0 0.080
2 0.89 5.52 100 0.015
1 1.55 4.94 0 0.031
2 0.84 4.94 100 0.015
1 1.05 28.85 0 0.063
2 0.07 28.85 100 0.015
1 6.10 16.55 0 0.067
2 0.87 16.55 100 0.015
1 3.59 9.78 0 0.045
2 1.19 9.78 100 0.015
1 2.03 2.34 0 0.050
2 1.69 2.34 100 0.015
1 2.61 4.56 0 0.036
2 0.93 4.56 100 0.015
1 2.36 3.12 0 0.031
2 1.18 3.12 100 0.015
1 5.81 7.04 0 0.054
2 1.63 7.04 100 0.015
1 1.62 4.73 0 0.028
2 1.38 4.73 100 0.015
1 1.44 2.98 0 0.047
2 0.18 2.98 100 0.015
1 2.06 5.49 0 0.030
2 0.89 5.49 100 0.015
1 1.64 1.65 0 0.030
2 0.79 1.65 100 0.015
1 0.81 29.30 0 0.074
2 0.07 29.30 100 0.015
56.01
56.02
60.03
61.01
61.02
62.01
63.01
63.02
57.01
57.02
58.01
59.01
60.01
60.02
66.01
66.02
66.03
67.01
63.03
63.04
63.05
63.06
64.01
65.01
Gibbergunyah XP-RAFTS Inputs
XP-RAFTS Inputs Existing.xlsx Page - 8

Subcatchment ID Sub-Area Area [ha]Catchment Slope
[%]
Percentage
Impervious [%]Mannings 'n'
1 4.99 11.30 0 0.066
2 0.68 11.30 100 0.015
1 2.95 10.27 0 0.043
2 1.09 10.27 100 0.015
1 3.47 3.29 0 0.041
2 1.46 3.29 100 0.015
1 2.31 6.55 0 0.047
2 0.61 6.55 100 0.015
1 2.15 6.38 0 0.044
2 0.66 6.38 100 0.015
1 0.63 3.14 0 0.039
2 0.58 3.14 100 0.015
1 4.30 2.78 0 0.042
2 2.71 2.78 100 0.015
1 2.82 3.02 0 0.040
2 2.34 3.02 100 0.015
1 3.95 4.62 0 0.047
2 0.95 4.62 100 0.015
1 4.05 4.18 0 0.047
2 3.26 4.18 100 0.015
1 4.56 12.60 0 0.046
2 1.04 12.60 100 0.015
1 4.42 11.29 0 0.058
2 0.76 11.29 100 0.015
1 0.94 3.20 0 0.032
2 0.45 3.20 100 0.015
1 2.15 18.25 0 0.049
2 0.68 18.25 100 0.015
1 2.27 7.58 0 0.046
2 0.76 7.58 100 0.015
1 1.51 7.13 0 0.041
2 0.61 7.13 100 0.015
1 2.17 14.24 0 0.048
2 0.51 14.24 100 0.015
1 1.69 4.50 0 0.047
2 0.71 4.50 100 0.015
1 2.35 2.32 0 0.035
2 1.19 2.32 100 0.015
1 0.34 0.08 0 0.044
2 0.26 0.08 100 0.015
1 0.73 3.07 0 0.039
2 1.09 3.07 100 0.015
1 1.35 2.49 0 0.031
2 0.56 2.49 100 0.015
1 0.22 3.81 0 0.041
2 1.10 3.81 100 0.015
1 1.50 4.64 0 0.032
2 1.11 4.64 100 0.015
67.02
67.03
67.1
67.11
68.01
69.01
70.01
71.01
67.04
67.05
67.06
67.07
67.08
67.09
74.03
75.01
76.01
76.02
71.02
71.03
72.01
73.01
74.01
74.02
Gibbergunyah XP-RAFTS Inputs
XP-RAFTS Inputs Existing.xlsx Page - 9

Subcatchment ID Sub-Area Area [ha]Catchment Slope
[%]
Percentage
Impervious [%]Mannings 'n'
1 1.61 3.07 0 0.033
2 1.80 3.07 100 0.015
1 1.69 4.40 0 0.036
2 1.17 4.40 100 0.015
1 0.83 4.98 0 0.032
2 0.42 4.98 100 0.015
1 0.53 1.27 0 0.029
2 0.78 1.27 100 0.015
1 0.76 5.05 0 0.029
2 0.56 5.05 100 0.015
1 1.47 6.56 0 0.029
2 1.09 6.56 100 0.015
1 2.55 3.81 0 0.038
2 0.86 3.81 100 0.015
1 5.77 5.32 0 0.062
2 1.19 5.32 100 0.015
1 3.14 3.88 0 0.031
2 1.21 3.88 100 0.015
1 0.17 1.55 0 0.063
2 1.97 1.55 100 0.015
1 0.96 1.90 0 0.034
2 0.32 1.90 100 0.015
1 4.94 16.25 0 0.097
2 0.46 16.25 100 0.015
1 2.37 26.27 0 0.068
2 0.69 26.27 100 0.015
1 2.50 6.72 0 0.087
2 0.49 6.72 100 0.015
1 1.00 8.70 0 0.031
2 0.42 8.70 100 0.015
1 2.73 7.18 0 0.055
2 0.97 7.18 100 0.015
1 1.92 4.83 0 0.041
2 0.68 4.83 100 0.015
1 2.76 1.78 0 0.033
2 1.48 1.78 100 0.015
1 1.41 1.39 0 0.030
2 1.43 1.39 100 0.015
1 0.57 0.62 0 0.036
2 1.18 0.62 100 0.015
1 0.96 2.30 0 0.029
2 0.63 2.30 100 0.015
1 1.18 1.84 0 0.029
2 1.02 1.84 100 0.015
1 2.12 3.35 0 0.031
2 1.01 3.35 100 0.015
1 0.15 0.01 0 0.031
2 1.78 0.01 100 0.015
77.01
78.01
82.01
83.01
84.01
85.01
86.01
87.01
79.01
80.01
80.02
80.03
81.01
81.02
88.07
88.08
88.09
88.1
88.01
88.02
88.03
88.04
88.05
88.06
Gibbergunyah XP-RAFTS Inputs
XP-RAFTS Inputs Existing.xlsx Page - 10
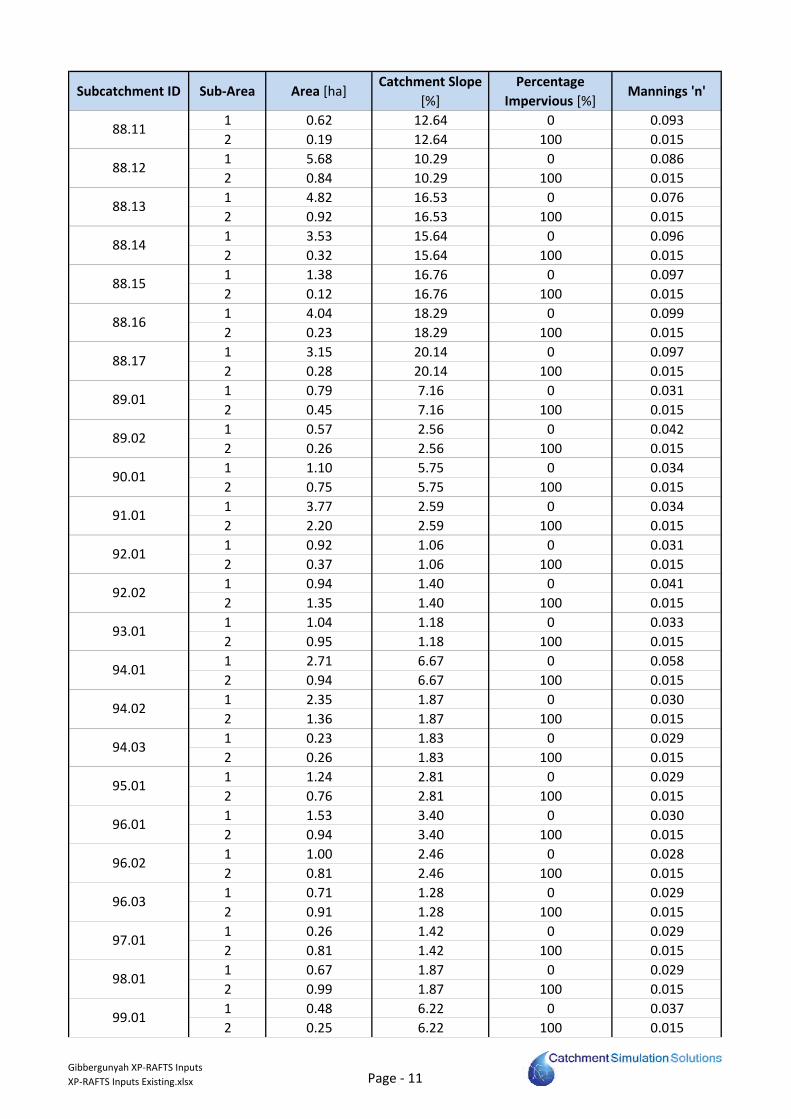
Subcatchment ID Sub-Area Area [ha]Catchment Slope
[%]
Percentage
Impervious [%]Mannings 'n'
1 0.62 12.64 0 0.093
2 0.19 12.64 100 0.015
1 5.68 10.29 0 0.086
2 0.84 10.29 100 0.015
1 4.82 16.53 0 0.076
2 0.92 16.53 100 0.015
1 3.53 15.64 0 0.096
2 0.32 15.64 100 0.015
1 1.38 16.76 0 0.097
2 0.12 16.76 100 0.015
1 4.04 18.29 0 0.099
2 0.23 18.29 100 0.015
1 3.15 20.14 0 0.097
2 0.28 20.14 100 0.015
1 0.79 7.16 0 0.031
2 0.45 7.16 100 0.015
1 0.57 2.56 0 0.042
2 0.26 2.56 100 0.015
1 1.10 5.75 0 0.034
2 0.75 5.75 100 0.015
1 3.77 2.59 0 0.034
2 2.20 2.59 100 0.015
1 0.92 1.06 0 0.031
2 0.37 1.06 100 0.015
1 0.94 1.40 0 0.041
2 1.35 1.40 100 0.015
1 1.04 1.18 0 0.033
2 0.95 1.18 100 0.015
1 2.71 6.67 0 0.058
2 0.94 6.67 100 0.015
1 2.35 1.87 0 0.030
2 1.36 1.87 100 0.015
1 0.23 1.83 0 0.029
2 0.26 1.83 100 0.015
1 1.24 2.81 0 0.029
2 0.76 2.81 100 0.015
1 1.53 3.40 0 0.030
2 0.94 3.40 100 0.015
1 1.00 2.46 0 0.028
2 0.81 2.46 100 0.015
1 0.71 1.28 0 0.029
2 0.91 1.28 100 0.015
1 0.26 1.42 0 0.029
2 0.81 1.42 100 0.015
1 0.67 1.87 0 0.029
2 0.99 1.87 100 0.015
1 0.48 6.22 0 0.037
2 0.25 6.22 100 0.015
88.11
88.12
89.02
90.01
91.01
92.01
92.02
93.01
88.13
88.14
88.15
88.16
88.17
89.01
96.03
97.01
98.01
99.01
94.01
94.02
94.03
95.01
96.01
96.02
Gibbergunyah XP-RAFTS Inputs
XP-RAFTS Inputs Existing.xlsx Page - 11

Subcatchment ID Sub-Area Area [ha]Catchment Slope
[%]
Percentage
Impervious [%]Mannings 'n'
1 0.61 0.53 0 0.039
2 1.75 0.53 100 0.015
1 0.49 2.88 0 0.032
2 1.31 2.88 100 0.015
1 1.04 2.64 0 0.028
2 1.07 2.64 100 0.015
1 0.56 6.62 0 0.035
2 0.46 6.62 100 0.015
1 0.57 4.37 0 0.030
2 0.33 4.37 100 0.015
1 0.46 4.83 0 0.029
2 0.31 4.83 100 0.015
1 2.22 18.81 0 0.096
2 0.27 18.81 100 0.015
1 1.69 15.83 0 0.065
2 0.40 15.83 100 0.015
1 1.47 8.24 0 0.045
2 0.78 8.24 100 0.015
1 0.89 9.48 0 0.058
2 0.41 9.48 100 0.015
1 1.74 3.91 0 0.028
2 1.34 3.91 100 0.015
1 0.88 12.56 0 0.031
2 0.38 12.56 100 0.015
1 1.70 8.54 0 0.040
2 0.69 8.54 100 0.015
1 2.16 26.76 0 0.100
2 0.11 26.76 100 0.015
1 2.22 25.51 0 0.100
2 0.12 25.51 100 0.015
1 1.99 13.84 0 0.096
2 0.27 13.84 100 0.015
1 3.49 32.38 0 0.100
2 0.18 32.38 100 0.015
1 3.08 31.30 0 0.100
2 0.16 31.30 100 0.015
1 3.14 25.35 0 0.099
2 0.22 25.35 100 0.015
1 1.86 5.73 0 0.100
2 0.10 5.73 100 0.015
1 4.73 34.26 0 0.100
2 0.25 34.26 100 0.015
1 4.84 31.82 0 0.100
2 0.25 31.82 100 0.015
1 2.49 32.94 0 0.100
2 0.13 32.94 100 0.015
1 3.44 18.00 0 0.082
2 0.64 18.00 100 0.015
104.03
104.02
104.01
103.02
103.01
102.01
101.01
100.02
108.02
108.01
107.03
107.02
107.01
106.01
105.02
105.01
104.04
110.01
109.04
109.03
109.02
109.01
108.03
100.01
Gibbergunyah XP-RAFTS Inputs
XP-RAFTS Inputs Existing.xlsx Page - 12

Subcatchment ID Sub-Area Area [ha]Catchment Slope
[%]
Percentage
Impervious [%]Mannings 'n'
1 5.84 25.90 0 0.100
2 0.31 25.90 100 0.015
1 3.77 21.17 0 0.100
2 0.20 21.17 100 0.015
1 2.69 31.06 0 0.100
2 0.14 31.06 100 0.015
1 1.68 1.31 0 0.049
2 0.09 1.31 100 0.015
1 4.17 4.70 0 0.081
2 0.67 4.70 100 0.015
1 4.43 10.01 0 0.065
2 0.51 10.01 100 0.015
1 4.70 17.61 0 0.088
2 0.77 17.61 100 0.015
1 4.51 4.60 0 0.092
2 0.65 4.60 100 0.015
1 1.71 4.90 0 0.098
2 0.18 4.90 100 0.015
1 5.15 44.08 0 0.099
2 0.30 44.08 100 0.015
1 1.71 8.64 0 0.074
2 0.24 8.64 100 0.015
1 6.77 35.19 0 0.081
2 0.51 35.19 100 0.015
111.03
111.02
111.01
115.02
115.01
114.01
113.02
113.01
112.04
112.03
112.02
112.01
Gibbergunyah XP-RAFTS Inputs
XP-RAFTS Inputs Existing.xlsx Page - 13

BASEFLOW AT PEAK STREAMFLOW: CALCULATION SHEET (Calculations based on ‘Revision Project 7: Baseflow for Catchment Simulation’ (Engineers Australia, 2011) )
CATCHMENT INFORMATION
Catchment Gibbergunyah Creek Area 10.89 km2
State New South Wales
10 year ARI Baseflow Peak Factor
(RBPF10yr) (Figure 2 – ARR P7)
0.1
Baseflow Under Peak Streamflow Calculations
ARI
ARI factor for baseflow
peak factor (FARI)
(Table 1 – ARR P7)
Baseflow Peak Factor
RBPFARI
(RBPFARI = RBPF10yr * FARI)
Ratio of baseflow under the
Peak Streamflow RBUPF
RBUPF = 0.7 * RBPFARI
0.5 3.0 0.30 0.210
1 2.2 0.22 0.154
2 1.7 0.17 0.119
5 1.2 0.12 0.084
10 1.0 0.10 0.070
20 0.8 0.08 0.056
50 0.7 0.07 0.049
100 0.6 0.06 0.042
Baseflow Under Peak Streamflow Calculations
ARI Q(m
3/s) Peak
Surface Runoff
Ratio of baseflow
under the Peak
Streamflow RBUPF
Q(m3/s) baseflow at
time of peak surface
runoff
(= QPeak Surface
Runoff * RBUPF)
Q(m3/s) per km
2
(= Q baseflow at
time of peak
surface runoff /
Catchment Area
(km2))
0.5 N/A 0.210 N/A N/A
1 N/A 0.154 N/A N/A
2 N/A 0.119 N/A N/A
5 88.68 0.084 7.50 0.69
10 109.62 0.070 7.67 0.70
20 142.02 0.056 7.95 0.73
50 176.99 0.049 8.67 0.80
100 209.5 0.042 8.80 0.81
200 250 N/A 8.80 0.81
PMF 1100 N/A 8.80 0.81
Prepared By D. Fedcyzna
Date
14/06/2012
Checked By D. Tetley
Date 11/09/2012

APPENDIX C
XP-RAFTS MODEL RESULTS FOR
CALIBRATION SIMULATIONS

0.0
0.2
0.4
0.6
0.8
1.0
1.2
1.4R
ain
fall
(mm
)
Date/Time
Bowral (Parry Rd)
LEGEND:
Notes:
Figure C1: Pluvio Rainfall Data for
Feburary 2005 Event
Prepared By:
Suite 302, 5 Hunter Street Sydney, NSW, 2000
File Name: 2005 Pluvios Chart.xls

0.0
0.5
1.0
1.5
2.0
2.5R
ain
fall
(mm
)
Date/Time
Bowral (Parry Rd)
LEGEND:
Notes:
Prepared By:
Suite 302, 5 Hunter Street Sydney, NSW, 2000
File Name: 2010 Pluvios Chart.xls
Figure C2: Pluvio Rainfall Data for November 2010 Event
LEGEND:
Notes:
LEGEND:
Notes:
Prepared By:
Suite 302, 5 Hunter Street Sydney, NSW, 2000

1
10
100
1,000R
ain
fall
Inte
nsi
ty (
mm
/ho
ur)
Duration (hours)
100 Year ARI
50 Year ARI
20 Year ARI
5 Year ARI
1 Year ARI
November 2010 Event
February 2005 Event
LEGEND
Notes:
Figure C4: Intensity-Frequency-Duration Curves for Gibbergunyah Creek
Catchment
Prepared By:
Suite 302, 5 Hunter Street Sydney, NSW, 2000
File Name: 2005 Pluvios Chart.xls

PEAK FLOOD DISCHARGES - Calibration/Verification Events
Feb-05 Nov-10
1.01 0.09 0.15
1.02 0.22 0.35
1.03 0.28 0.43
1.04 0.47 0.74
1.05 0.61 0.94
1.06 0.97 1.48
1.07 1.17 1.78
1.08 1.47 2.21
1.09 1.58 2.37
1.10 1.73 2.59
1.11 1.93 2.86
1.12 3.99 5.87
1.13 4.20 6.17
1.14 5.68 8.25
1.15 6.46 9.35
1.16 6.62 9.55
1.17 6.66 9.58
1.18 7.09 10.15
1.19 9.81 13.94
1.20 10.94 15.58
1.21 11.25 15.95
1.22 11.32 16.03
1.23 11.40 16.11
1.24 15.06 21.17
1.25 17.73 24.72
1.26 18.02 25.09
1.27 18.15 25.24
1.28 20.14 28.40
1.29 20.42 28.73
1.30 20.61 28.94
1.31 20.86 29.21
1.32 20.99 29.34
1.33 21.05 29.39
2.01 0.09 0.14
3.01 0.06 0.09
3.02 0.22 0.33
4.01 0.03 0.04
5.01 0.07 0.11
5.02 0.18 0.28
6.01 0.19 0.26
6.02 0.20 0.28
7.01 0.11 0.17
8.01 0.07 0.11
9.01 0.25 0.34
9.02 0.45 0.63
Subcatchment IDPeak Discharge (m
3/s)
Cal Ver
XP-RAFTS Output.xlsx Page - 1

Feb-05 Nov-10Subcatchment ID
Peak Discharge (m3/s)
9.03 0.76 1.07
9.04 1.46 2.04
9.05 1.68 2.37
9.06 1.80 2.55
9.07 2.08 2.98
10.01 0.06 0.09
11.01 0.18 0.25
12.01 0.26 0.36
12.02 0.65 0.90
13.01 0.27 0.37
14.01 0.06 0.09
14.02 0.13 0.19
15.01 0.12 0.19
16.01 0.08 0.12
16.02 0.16 0.25
16.03 0.26 0.40
17.01 0.09 0.14
18.01 0.16 0.23
18.02 0.37 0.52
18.03 0.59 0.83
18.04 0.69 0.97
19.01 0.20 0.28
19.02 0.32 0.46
19.03 0.38 0.53
20.01 0.17 0.25
21.01 0.11 0.16
22.01 0.05 0.08
22.02 0.18 0.26
22.03 0.28 0.39
23.01 0.17 0.23
23.02 0.32 0.47
23.03 0.41 0.61
23.04 0.48 0.70
24.01 0.08 0.13
25.01 0.06 0.09
26.01 0.12 0.19
26.02 0.31 0.45
26.03 0.35 0.52
27.01 0.08 0.13
27.02 0.14 0.20
28.01 0.05 0.08
28.02 0.10 0.16
28.03 0.21 0.34
28.04 0.37 0.57
28.05 0.49 0.76
28.06 0.54 0.83
28.07 0.87 1.33
Cal Ver
XP-RAFTS Output.xlsx Page - 2

Feb-05 Nov-10Subcatchment ID
Peak Discharge (m3/s)
28.08 0.92 1.40
28.09 1.08 1.63
28.10 1.40 2.08
28.11 1.50 2.22
28.12 2.30 3.29
28.13 2.81 3.92
28.14 2.83 3.95
29.01 0.08 0.12
30.01 0.05 0.08
30.02 0.11 0.18
31.01 0.09 0.14
32.01 0.03 0.05
33.01 0.04 0.05
33.02 0.15 0.23
33.03 0.24 0.37
33.04 0.30 0.47
34.01 0.09 0.14
35.01 0.03 0.04
35.02 0.10 0.15
36.01 0.10 0.15
37.01 0.05 0.07
38.01 0.07 0.12
38.02 0.12 0.19
38.03 0.20 0.31
38.04 0.29 0.44
38.05 0.36 0.54
38.06 0.47 0.66
38.07 0.60 0.82
38.08 0.79 1.08
39.01 0.05 0.07
40.01 0.03 0.05
41.01 0.10 0.16
42.01 0.06 0.10
42.02 0.13 0.20
42.03 0.23 0.36
42.04 0.34 0.52
42.05 0.41 0.61
43.01 0.11 0.17
43.02 0.14 0.20
44.01 0.09 0.14
44.02 0.24 0.37
44.03 0.33 0.53
44.04 0.76 1.18
44.05 1.18 1.76
45.01 0.04 0.05
45.02 0.12 0.17
45.03 0.33 0.51
Cal Ver
XP-RAFTS Output.xlsx Page - 3

Feb-05 Nov-10Subcatchment ID
Peak Discharge (m3/s)
46.01 0.09 0.14
47.01 0.07 0.11
48.01 0.07 0.10
48.02 0.12 0.18
49.01 0.05 0.08
50.01 0.10 0.15
50.02 0.22 0.34
51.01 0.05 0.07
52.01 0.11 0.16
52.02 0.17 0.27
52.03 0.25 0.39
52.04 0.48 0.75
52.05 1.64 2.51
52.06 1.71 2.61
52.07 2.33 3.56
52.08 2.37 3.57
52.09 2.41 3.62
52.10 2.54 3.75
52.11 2.64 3.85
52.12 3.44 4.80
52.13 3.66 5.06
53.01 0.07 0.11
53.02 0.14 0.22
54.01 0.12 0.17
54.02 0.42 0.62
54.03 0.68 1.03
54.04 0.98 1.49
55.01 0.16 0.23
56.01 0.09 0.13
56.02 0.19 0.29
57.01 0.07 0.12
57.02 0.16 0.25
58.01 0.03 0.04
59.01 0.08 0.12
60.01 0.10 0.16
60.02 0.30 0.46
60.03 0.42 0.64
61.01 0.01 0.02
61.02 0.10 0.15
62.01 0.07 0.10
63.01 0.03 0.05
63.02 0.20 0.29
63.03 0.32 0.47
63.04 0.57 0.84
63.05 0.65 0.96
63.06 0.82 1.20
64.01 0.17 0.26
Cal Ver
XP-RAFTS Output.xlsx Page - 4

Feb-05 Nov-10Subcatchment ID
Peak Discharge (m3/s)
65.01 0.08 0.13
66.01 0.04 0.05
66.02 0.11 0.17
66.03 0.16 0.24
67.01 0.02 0.04
67.02 0.15 0.23
67.03 0.25 0.38
67.04 0.50 0.76
67.05 0.69 1.05
67.06 0.80 1.18
67.07 1.32 1.95
67.08 1.77 2.55
67.09 1.89 2.70
67.10 2.13 3.05
67.11 2.70 3.83
68.01 0.14 0.22
69.01 0.13 0.19
70.01 0.04 0.05
71.01 0.07 0.12
71.02 0.15 0.23
71.03 0.33 0.50
72.01 0.07 0.11
73.01 0.06 0.09
74.01 0.08 0.12
74.02 0.14 0.20
74.03 0.18 0.27
75.01 0.05 0.07
76.01 0.04 0.07
76.02 0.11 0.17
77.01 0.10 0.14
78.01 0.08 0.11
79.01 0.03 0.05
80.01 0.04 0.06
80.02 0.07 0.11
80.03 0.15 0.22
81.01 0.08 0.12
81.02 0.34 0.50
82.01 0.11 0.17
83.01 0.07 0.11
84.01 0.03 0.04
85.01 0.12 0.18
86.01 0.08 0.13
87.01 0.06 0.09
88.01 0.04 0.06
88.02 0.13 0.20
88.03 0.19 0.29
88.04 0.38 0.58
Cal Ver
XP-RAFTS Output.xlsx Page - 5

Feb-05 Nov-10Subcatchment ID
Peak Discharge (m3/s)
88.05 0.72 1.08
88.06 1.21 1.75
88.07 1.26 1.81
88.08 1.40 1.98
88.09 1.57 2.20
88.10 1.75 2.28
88.11 1.52 1.85
88.12 1.65 1.92
88.13 1.80 2.00
88.14 1.84 2.02
88.15 2.00 2.12
88.16 2.08 2.35
88.17 2.24 2.88
89.01 0.03 0.05
89.02 0.05 0.08
90.01 0.05 0.08
91.01 0.14 0.22
92.01 0.03 0.04
92.02 0.09 0.13
93.01 0.05 0.08
94.01 0.09 0.13
94.02 0.17 0.25
94.03 0.23 0.34
95.01 0.05 0.08
96.01 0.07 0.10
96.02 0.11 0.16
96.03 0.15 0.22
97.01 0.03 0.05
98.01 0.05 0.07
99.01 0.02 0.03
100.01 0.06 0.11
100.02 0.11 0.19
101.01 0.06 0.09
102.01 0.03 0.05
103.01 0.03 0.04
103.02 0.05 0.07
104.01 0.06 0.09
104.02 0.11 0.16
104.03 0.16 0.25
104.04 0.20 0.29
105.01 0.09 0.12
105.02 0.12 0.18
106.01 0.06 0.10
107.01 0.05 0.08
107.02 0.11 0.16
107.03 0.16 0.24
108.01 0.09 0.14
Cal Ver
XP-RAFTS Output.xlsx Page - 6

Feb-05 Nov-10Subcatchment ID
Peak Discharge (m3/s)
108.02 0.16 0.26
108.03 0.24 0.38
109.01 0.04 0.05
109.02 0.14 0.23
109.03 0.26 0.41
109.04 0.32 0.50
110.01 0.10 0.15
111.01 0.14 0.21
111.02 0.23 0.34
111.03 0.29 0.44
112.01 0.03 0.04
112.02 0.13 0.18
112.03 0.35 0.53
112.04 0.45 0.70
113.01 0.10 0.14
113.02 0.13 0.19
114.01 0.13 0.21
115.01 0.04 0.06
115.02 0.21 0.33
Cal Ver
XP-RAFTS Output.xlsx Page - 7

APPENDIX D
BRIDGE LOSS CALCULATIONS

Representation of Bridges in TUFLOW
TUFLOW does not explicitly allow inclusion of bridge structure details, such as abutments or piers like
other hydraulic software, such as HEC-RAS. Therefore, the variation in energy losses that can be expected
through a bridge opening must be defined using a height varying loss coefficent.
This requires calculation of suitable loss coefficient values from the channel invert up to the elevation of
the underside of the bridge deck.
The following pages present the calculations that were completed to determine appropriate bridge loss
coefficients.
All calculations were completed in accordance with procedures detailed in the 'TUFLOW User Manual'
(BMT WBM, 2010) and 'Hydraulics of Bridge Waterways' (Bradley, 1978).
Introduction
Appendix - Bridge Loss Calculations_GibbergunyahTimber.xlsx 1 of 13

Prepared by: Date:Checked by: Date:
Reference: 'Hydraulics of Bridge Waterways: HDS 1' (Bradley, March 1978)
The total backwater (i.e., energy loss) coefficient is calculated as:
K* = K b + K p + K e + K s
First need to calculate the Bridge Opening Ratio (M) All flow contained in channel
M = Unimpeded Flow / Total Flow Unimpeded Flow = 3.1 m3/s
M = Qb / (Qa + Qb + Qc) Total Flow= 3.1 m3/s
M = 1.00
John Street Crossing of Gibbergunyah Creek
Kb (base coefficient)
D. Tetley 3/09/2012
GibbTimber Low Flow
Appendix - Bridge Loss Calculations_GibbergunyahTimber.xlsx 2 of 13
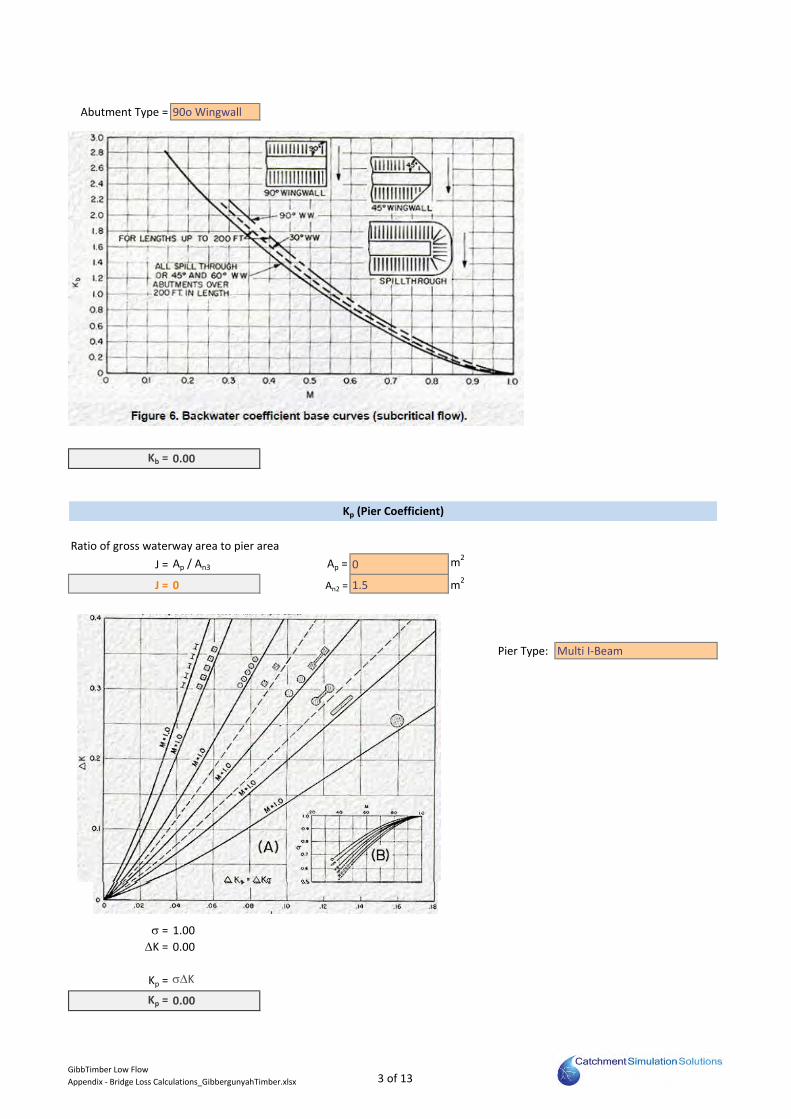
Abutment Type = 90o Wingwall
Kb = 0.00
Ratio of gross waterway area to pier area
J = Ap / An3 Ap = 0 m2
J = 0 An2 = 1.5 m2
Pier Type: Multi I-Beam
s = 1.00
DK = 0.00
Kp = sDK
Kp = 0.00
Kp (Pier Coefficient)
GibbTimber Low Flow
Appendix - Bridge Loss Calculations_GibbergunyahTimber.xlsx 3 of 13

Qc = 1 m3/s
Qa = 1 m3/s
e = 0.00
Ke = 0.00
f = 0
Ke (Eccentricity Coefficient)
Ks (Skew Coefficient)
GibbTimber Low Flow
Appendix - Bridge Loss Calculations_GibbergunyahTimber.xlsx 4 of 13

Abutment Type = (A)-Angled
theta
0
15
20
30
40
45
theta
0
15
30
45
A
B
Ks = 0.00
K* = Kb + Kp + Ke + Ks
K* = 0.00
(K*) Total Backwater Coefficient
Notes
No obstructions in low flow channel. Therefore, K* = 0.0 between 616.52 & 617.02
GibbTimber Low Flow
Appendix - Bridge Loss Calculations_GibbergunyahTimber.xlsx 5 of 13
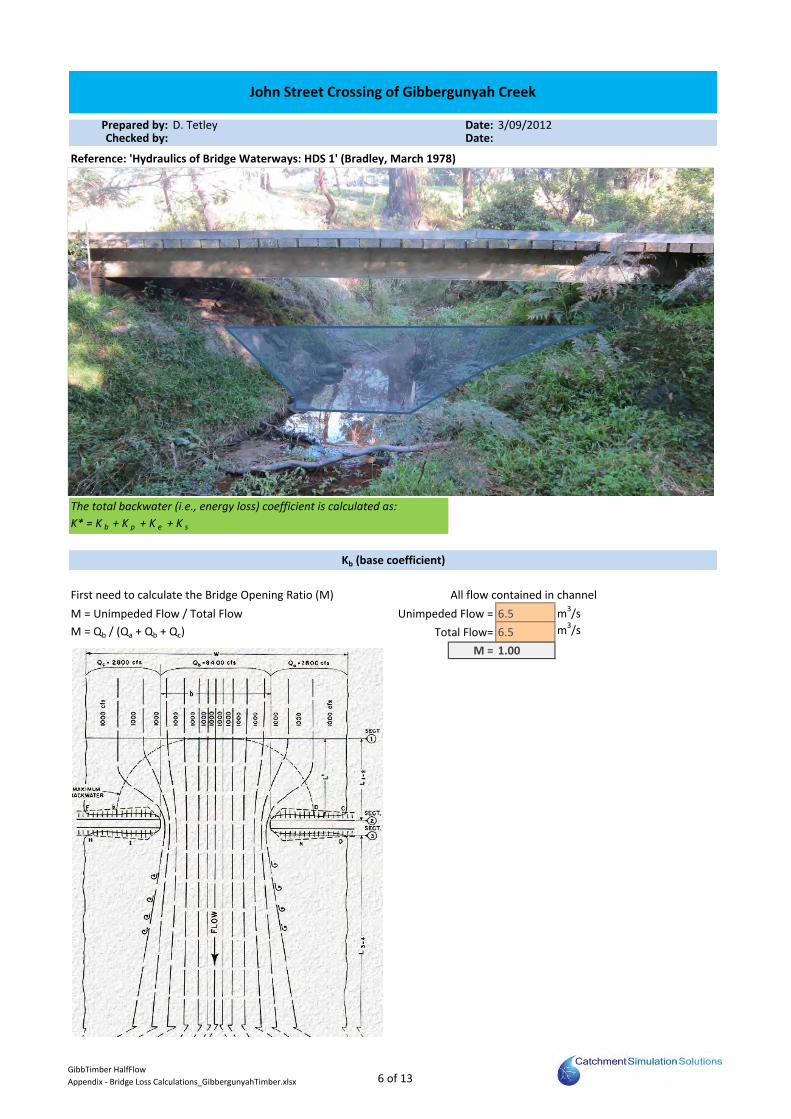
Prepared by: Date:Checked by: Date:
Reference: 'Hydraulics of Bridge Waterways: HDS 1' (Bradley, March 1978)
The total backwater (i.e., energy loss) coefficient is calculated as:
K* = K b + K p + K e + K s
First need to calculate the Bridge Opening Ratio (M) All flow contained in channel
M = Unimpeded Flow / Total Flow Unimpeded Flow = 6.5 m3/s
M = Qb / (Qa + Qb + Qc) Total Flow= 6.5 m3/s
M = 1.00
Kb (base coefficient)
John Street Crossing of Gibbergunyah Creek
D. Tetley 3/09/2012
GibbTimber HalfFlow
Appendix - Bridge Loss Calculations_GibbergunyahTimber.xlsx 6 of 13

Abutment Type = 90o Wingwall
Kb = 0.00
Assume fences abstruct flow similar to pier
Ratio of gross waterway area to pier area
J = Ap / An3 Ap = 0 m2
J = 0 An2 = 5 m2
Pier Type: Single Rectangular Pier
s = 1.00
DK = 0.00
Kp = sDK
Kp = 0.00
Kp (Pier Coefficient)
GibbTimber HalfFlow
Appendix - Bridge Loss Calculations_GibbergunyahTimber.xlsx 7 of 13

Qc = 1 m3/s
Qa = 1 m3/s
e = 0.00
0.9
0.85
0.8
0
0.8
0.85
0.9
0.95
1
Ke = 0.00
f = 0
Ke (Eccentricity Coefficient)
Ks (Skew Coefficient)
GibbTimber HalfFlow
Appendix - Bridge Loss Calculations_GibbergunyahTimber.xlsx 8 of 13

Abutment Type = (A)-Angled
40
45
theta
0
15
30
45
A
B
Ks = 0.00
K* = Kb + Kp + Ke + Ks
K* = 0.00
Notes
No obstructions in channel. Therefore, K* = 0.0 between 617.02 & 618.02
(K*) Total Backwater Coefficient
GibbTimber HalfFlow
Appendix - Bridge Loss Calculations_GibbergunyahTimber.xlsx 9 of 13

Prepared by: Date:Checked by: Date:
Reference: 'Hydraulics of Bridge Waterways: HDS 1' (Bradley, March 1978)
The total backwater (i.e., energy loss) coefficient is calculated as:
K* = K b + K p + K e + K s
First need to calculate the Bridge Opening Ratio (M) Some obstruction from abutments:
M = Unimpeded Flow / Total Flow Unimpeded Flow = 8.3328 m3/s
M = Qb / (Qa + Qb + Qc) Total Flow= 8.5 m3/s
M = 0.98
Kb (base coefficient)
John Street Crossing of Gibbergunyah Creek
D. Tetley 3/09/2012
GibbTimber Invert Deck
Appendix - Bridge Loss Calculations_GibbergunyahTimber.xlsx 10 of 13

Abutment Type = 90o Wingwall
Kb = 0.03
Assume fences abstruct flow similar to pier
Ratio of gross waterway area to pier area
J = Ap / An3 Ap = 0 m2
J = 0 An2 = 8.5 m2
Pier Type: Single Rectangular Pier
s = 1.00
DK = 0.00
Kp = sDK
Kp = 0.00
Kp (Pier Coefficient)
GibbTimber Invert Deck
Appendix - Bridge Loss Calculations_GibbergunyahTimber.xlsx 11 of 13

Qc = 1 m3/s
Qa = 1 m3/s
e = 0.00
0.9
0.85
0.8
0
0.8
0.85
0.9
0.95
1
Ke = 0.00
f = 0
Ke (Eccentricity Coefficient)
Ks (Skew Coefficient)
GibbTimber Invert Deck
Appendix - Bridge Loss Calculations_GibbergunyahTimber.xlsx 12 of 13

Abutment Type = (A)-Angled
40
45
theta
0
15
30
45
A
B
Ks = 0.00
K* = Kb + Kp + Ke + Ks
K* = 0.03
Notes
Minor obstruction by abutment. Therefore, K* = 0.03 between 618.02 to 618.47
(K*) Total Backwater Coefficient
GibbTimber Invert Deck
Appendix - Bridge Loss Calculations_GibbergunyahTimber.xlsx 13 of 13

Prepared by: Date:Checked by: Date:
Reference: 'Hydraulics of Bridge Waterways: HDS 1' (Bradley, March 1978)
The total backwater (i.e., energy loss) coefficient is calculated as:
K* = K b + K p + K e + K s
First need to calculate the Bridge Opening Ratio (M) All flow contained in channel
M = Unimpeded Flow / Total Flow Unimpeded Flow = 0.455 m3/s
M = Qb / (Qa + Qb + Qc) Total Flow= 0.455 m3/s
M = 1.00
Abutment Type = 90o Wingwall
D. Tetley 3/09/2012
Lake Alexandra Pedestrian Bridge
Kb (base coefficient)
LakeAFootbridge LowFlow
Appendix - Bridge Loss Calculations_LakeAFootbridge.xlsx 1 of 8

Kb = 0.00
Ratio of gross waterway area to pier area
J = Ap / An3 Ap = 0 m2
J = 0 An2 = 1.88 m2
Pier Type: Multi I-Beam
s = 1.00
DK = 0.00
Kp = sDK
Kp = 0.00
Kp (Pier Coefficient)
Ke (Eccentricity Coefficient)
LakeAFootbridge LowFlow
Appendix - Bridge Loss Calculations_LakeAFootbridge.xlsx 2 of 8
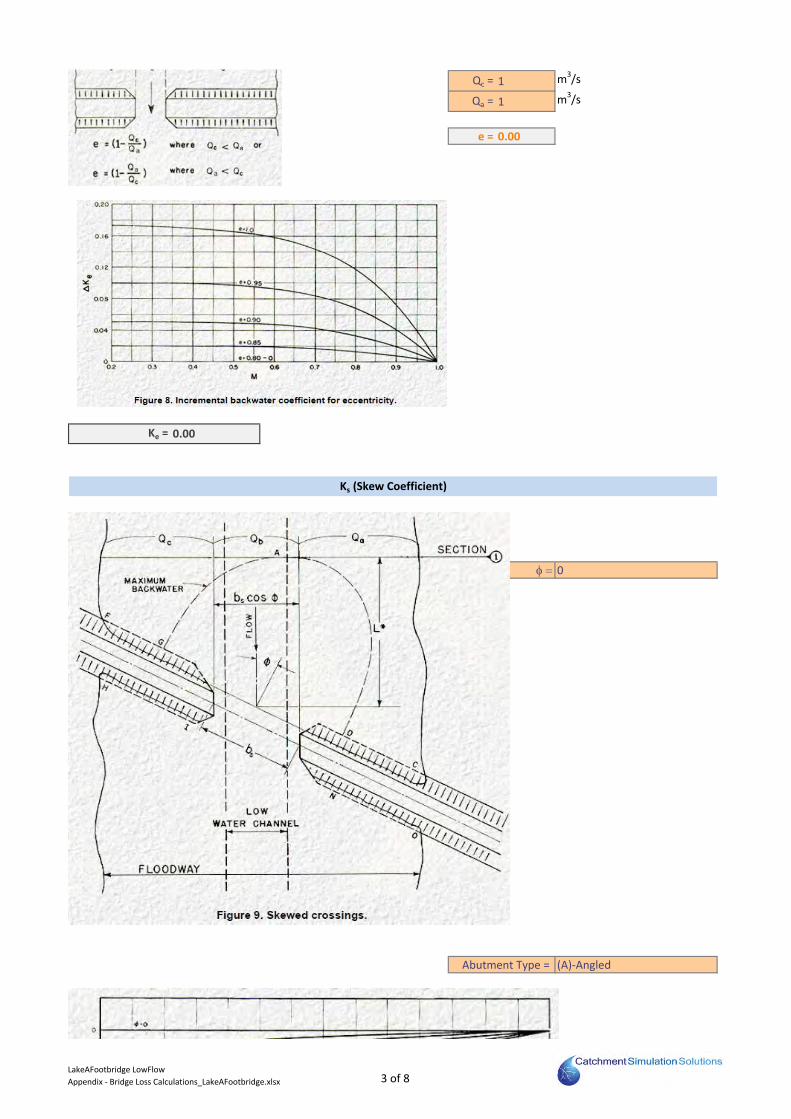
Qc = 1 m3/s
Qa = 1 m3/s
e = 0.00
Ke = 0.00
f = 0
Abutment Type = (A)-Angled
Ks (Skew Coefficient)
LakeAFootbridge LowFlow
Appendix - Bridge Loss Calculations_LakeAFootbridge.xlsx 3 of 8

theta
0
15
20
30
40
45
theta
0
15
30
45
Ks = 0.00
K* = Kb + Kp + Ke + Ks
K* = 0.00
Notes
No obstructions in low flow channel. Therefore, K* = 0.0 between 619.66 & 620.57
(K*) Total Backwater Coefficient
LakeAFootbridge LowFlow
Appendix - Bridge Loss Calculations_LakeAFootbridge.xlsx 4 of 8

Prepared by: Date:Checked by: Date:
Reference: 'Hydraulics of Bridge Waterways: HDS 1' (Bradley, March 1978)
The total backwater (i.e., energy loss) coefficient is calculated as:
K* = K b + K p + K e + K s
First need to calculate the Bridge Opening Ratio (M) Some flow obstructed by abutments
M = Unimpeded Flow / Total Flow Unimpeded Flow = 5.05 m3/s
M = Qb / (Qa + Qb + Qc) Total Flow= 6.475 m3/s
M = 0.78
Abutment Type = 90o Wingwall
Kb (base coefficient)
Lake Alexandra Pedestrian Bridge
D. Tetley 3/09/2012
LakeAFootbridge HalfFlow
Appendix - Bridge Loss Calculations_LakeAFootbridge.xlsx 5 of 8

Kb = 0.41
Assume fences abstruct flow similar to pier
Ratio of gross waterway area to pier area
J = Ap / An3 Ap = 0 m2
J = 0 An2 = 6.6 m2
Pier Type: Single Rectangular Pier
s = 0.94
DK = 0.00
Kp = sDK
Kp = 0.00
Kp (Pier Coefficient)
Ke (Eccentricity Coefficient)
LakeAFootbridge HalfFlow
Appendix - Bridge Loss Calculations_LakeAFootbridge.xlsx 6 of 8

Qc = 1 m3/s
Qa = 1 m3/s
e = 0.00
Ke = 0.00
f = 0
Abutment Type = (A)-Angled
Ks (Skew Coefficient)
LakeAFootbridge HalfFlow
Appendix - Bridge Loss Calculations_LakeAFootbridge.xlsx 7 of 8

theta
0
15
20
30
40
45
theta
0
15
30
45
Ks = 0.00
K* = Kb + Kp + Ke + Ks
K* = 0.41
Notes
K* = 0.41 between 620.57 and 621.13
(K*) Total Backwater Coefficient
LakeAFootbridge HalfFlow
Appendix - Bridge Loss Calculations_LakeAFootbridge.xlsx 8 of 8

Prepared by: Date:Checked by: Date:
Reference: 'Hydraulics of Bridge Waterways: HDS 1' (Bradley, March 1978)
The total backwater (i.e., energy loss) coefficient is calculated as:
K* = K b + K p + K e + K s
First need to calculate the Bridge Opening Ratio (M) All flow contained in channel
M = Unimpeded Flow / Total Flow Unimpeded Flow = 1.88 m3/s
M = Qb / (Qa + Qb + Qc) Total Flow= 1.88 m3/s
M = 1.00
Mittagong RSL Pedestrian Bridge Crossing or Iron Mines Creek
Kb (base coefficient)
D. Tetley 3/09/2012
RSLFoorbridge LowFlow
Appendix - Bridge Loss Calculations_RSLFootbridge.xlsx 1 of 16

Abutment Type = 90o Wingwall
Kb = 0.00
Ratio of gross waterway area to pier area
J = Ap / An3 Ap = 0 m2
J = 0 An2 = 1.88 m2
Pier Type: Multi I-Beam
s = 1.00
DK = 0.00
Kp = sDK
Kp = 0.00
Kp (Pier Coefficient)
RSLFoorbridge LowFlow
Appendix - Bridge Loss Calculations_RSLFootbridge.xlsx 2 of 16

Qc = 1 m3/s
Qa = 1 m3/s
e = 0.00
Ke = 0.00
f = 0
Ke (Eccentricity Coefficient)
Ks (Skew Coefficient)
RSLFoorbridge LowFlow
Appendix - Bridge Loss Calculations_RSLFootbridge.xlsx 3 of 16

Abutment Type = (A)-Angled
theta
0
15
20
30
40
45
theta
0
15
30
45
A
B
Ks = 0.00
K* = Kb + Kp + Ke + Ks
K* = 0.00
(K*) Total Backwater Coefficient
Notes
No obstructions in low flow channel. Therefore, K* = 0.0 between 611.94 & 612.60
RSLFoorbridge LowFlow
Appendix - Bridge Loss Calculations_RSLFootbridge.xlsx 4 of 16

Prepared by: Date:Checked by: Date:
Reference: 'Hydraulics of Bridge Waterways: HDS 1' (Bradley, March 1978)
The total backwater (i.e., energy loss) coefficient is calculated as:
K* = K b + K p + K e + K s
First need to calculate the Bridge Opening Ratio (M) All flow contained in channel
M = Unimpeded Flow / Total Flow Unimpeded Flow = 6.6 m3/s
M = Qb / (Qa + Qb + Qc) Total Flow= 6.6 m3/s
M = 1.00
Kb (base coefficient)
Mittagong RSL Pedestrian Bridge Crossing or Iron Mines Creek
D. Tetley 3/09/2012
RSLFoorbridge HalfFlow
Appendix - Bridge Loss Calculations_RSLFootbridge.xlsx 5 of 16

Abutment Type = 90o Wingwall
Kb = 0.00
Assume fences abstruct flow similar to pier
Ratio of gross waterway area to pier area
J = Ap / An3 Ap = 0 m2
J = 0 An2 = 6.6 m2
Pier Type: Single Rectangular Pier
s = 1.00
DK = 0.00
Kp = sDK
Kp = 0.00
Kp (Pier Coefficient)
RSLFoorbridge HalfFlow
Appendix - Bridge Loss Calculations_RSLFootbridge.xlsx 6 of 16
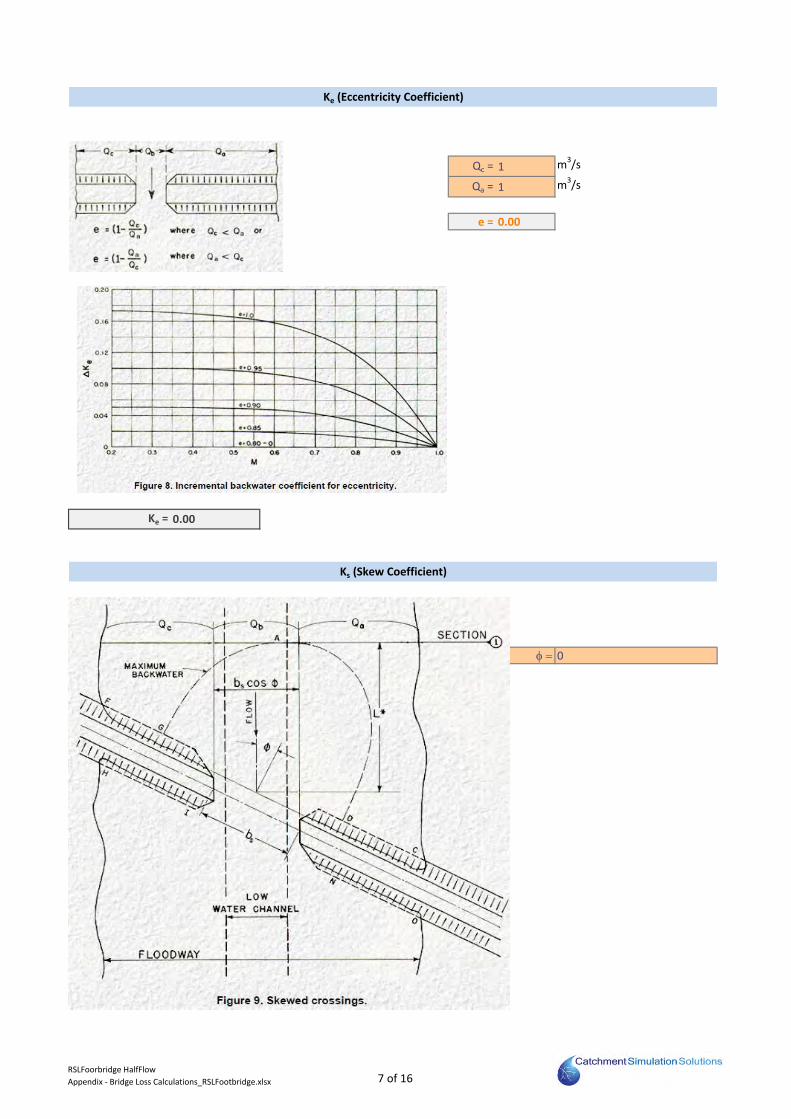
Qc = 1 m3/s
Qa = 1 m3/s
e = 0.00
Ke = 0.00
f = 0
Ke (Eccentricity Coefficient)
Ks (Skew Coefficient)
RSLFoorbridge HalfFlow
Appendix - Bridge Loss Calculations_RSLFootbridge.xlsx 7 of 16

Abutment Type = (A)-Angled
theta
0
15
20
30
40
45
theta
0
15
30
45
A
B
Ks = 0.00
K* = Kb + Kp + Ke + Ks
K* = 0.00
Notes
No obstructions in channel. Therefore, K* = 0.0 between 612.60 and 613.37
(K*) Total Backwater Coefficient
RSLFoorbridge HalfFlow
Appendix - Bridge Loss Calculations_RSLFootbridge.xlsx 8 of 16
Recommended