PPIC WATER POLICY CENTER
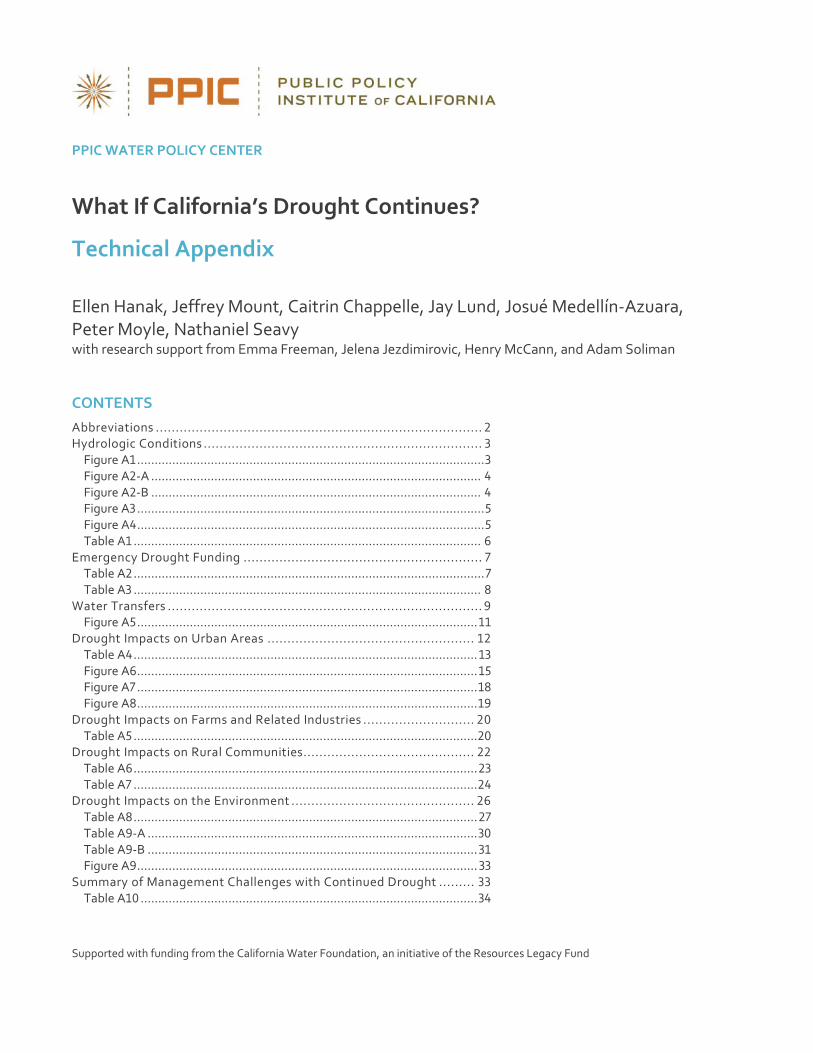
What If California’s Drought Continues?
Technical Appendix
Ellen Hanak, Jeffrey Mount, Caitrin Chappelle, Jay Lund, Josué Medellín-Azuara, Peter Moyle, Nathaniel Seavy with research support from Emma Freeman, Jelena Jezdimirovic, Henry McCann, and Adam Soliman
CONTENTS Abbreviations .................................................................................. 2 Hydrologic Conditions ...................................................................... 3
Figure A1 ................................................................................................... 3 Figure A2-A .............................................................................................. 4 Figure A2-B .............................................................................................. 4 Figure A3 ................................................................................................... 5 Figure A4 ................................................................................................... 5 Table A1 ................................................................................................... 6
Emergency Drought Funding ............................................................ 7 Table A2 .................................................................................................... 7 Table A3 ................................................................................................... 8
Water Transfers ............................................................................... 9 Figure A5 ................................................................................................. 11
Drought Impacts on Urban Areas .................................................... 12 Table A4 .................................................................................................. 13 Figure A6 ................................................................................................. 15 Figure A7 ................................................................................................. 18 Figure A8 ................................................................................................. 19
Drought Impacts on Farms and Related Industries ............................ 20 Table A5 .................................................................................................. 20
Drought Impacts on Rural Communities ........................................... 22 Table A6 .................................................................................................. 23 Table A7 .................................................................................................. 24
Drought Impacts on the Environment .............................................. 26 Table A8 .................................................................................................. 27 Table A9-A .............................................................................................. 30 Table A9-B .............................................................................................. 31 Figure A9 ................................................................................................. 33
Summary of Management Challenges with Continued Drought ......... 33 Table A10 ................................................................................................ 34
Supported with funding from the California Water Foundation, an initiative of the Resources Legacy Fund
PPIC.ORG Technical Appendix What If California’s Drought Continues? 2
Technical Appendix
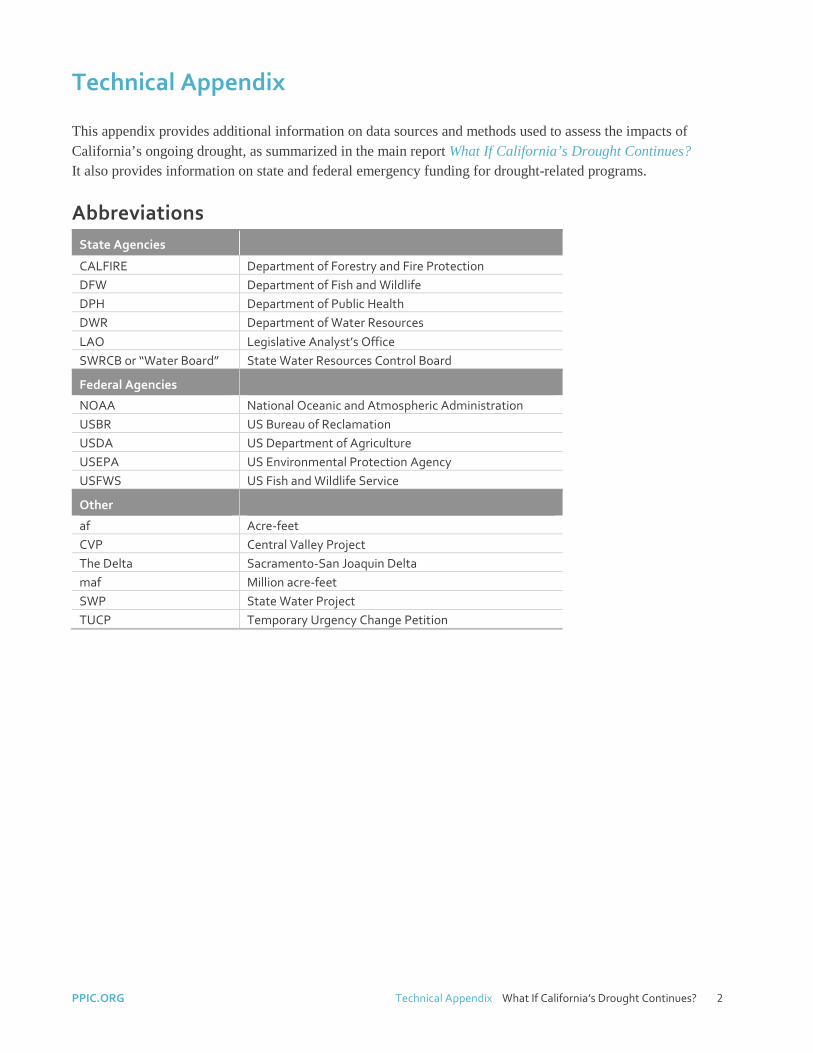
This appendix provides additional information on data sources and methods used to assess the impacts of California’s ongoing drought, as summarized in the main report What If California’s Drought Continues? It also provides information on state and federal emergency funding for drought-related programs.
Abbreviations State Agencies
CALFIRE Department of Forestry and Fire Protection DFW Department of Fish and Wildlife DPH Department of Public Health DWR Department of Water Resources LAO Legislative Analyst’s Office SWRCB or “Water Board” State Water Resources Control Board
Federal Agencies
NOAA National Oceanic and Atmospheric Administration USBR US Bureau of Reclamation USDA US Department of Agriculture USEPA US Environmental Protection Agency USFWS US Fish and Wildlife Service
Other
af Acre-feet CVP Central Valley Project The Delta Sacramento-San Joaquin Delta maf Million acre-feet SWP State Water Project TUCP Temporary Urgency Change Petition
PPIC.ORG Technical Appendix What If California’s Drought Continues? 3
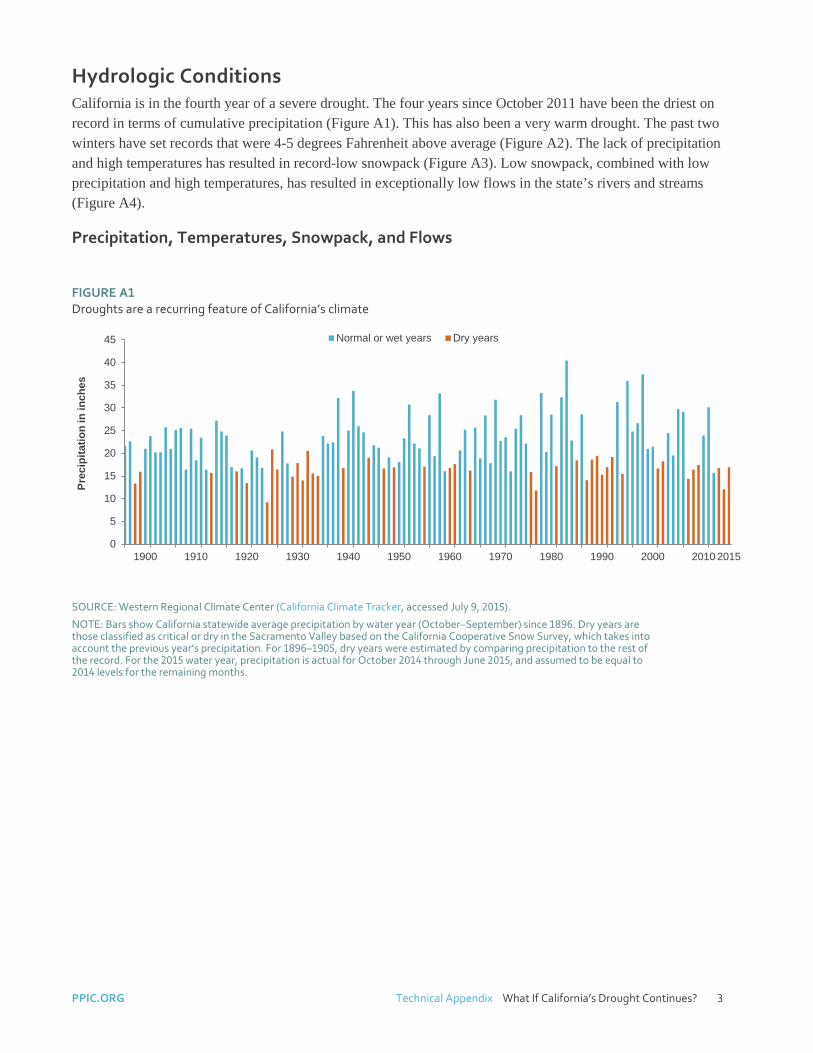
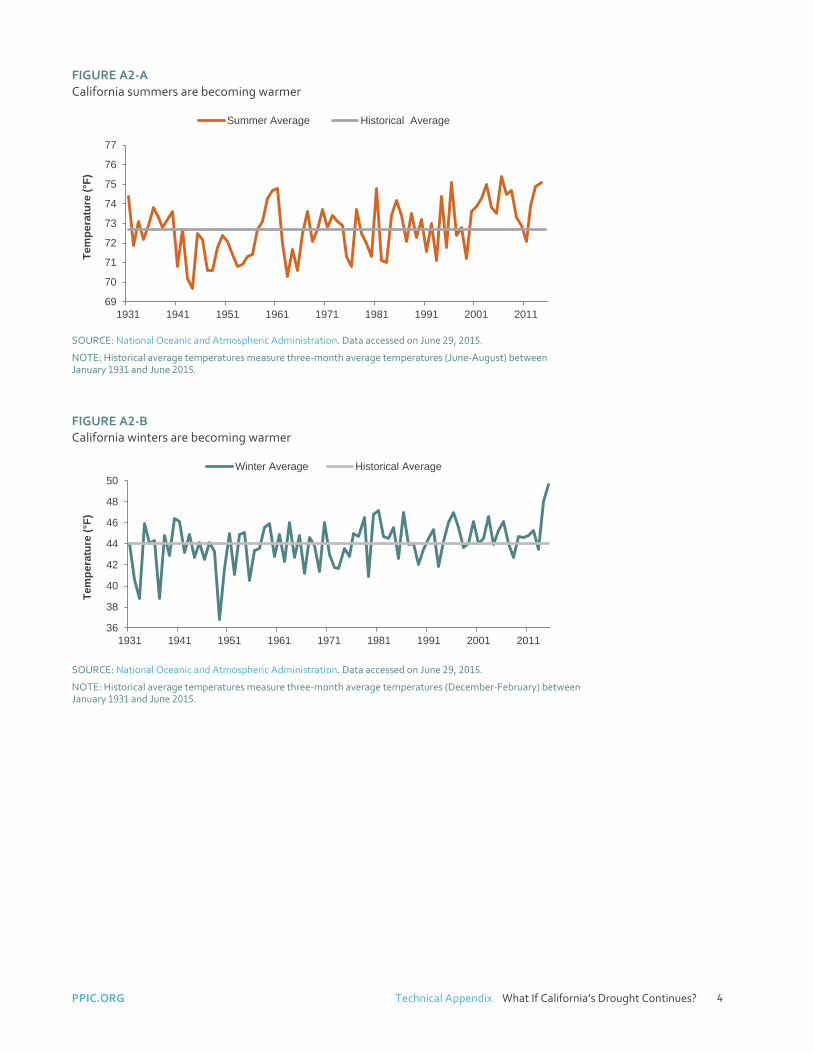
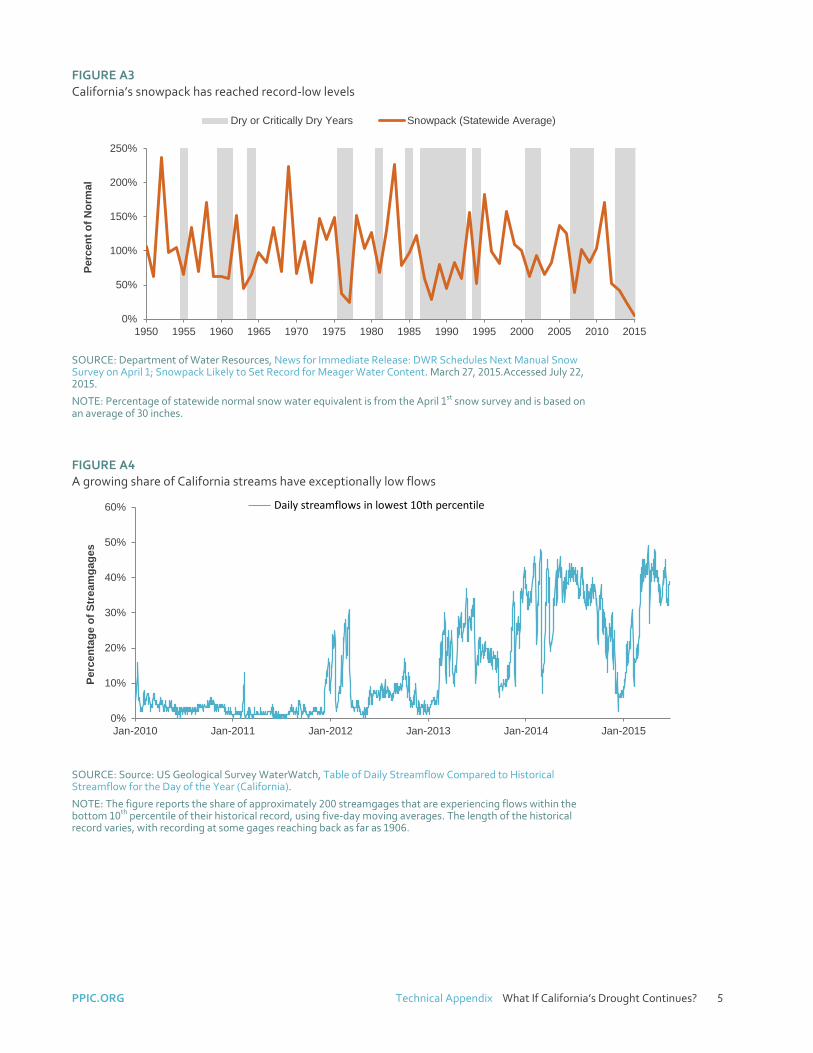
Hydrologic Conditions California is in the fourth year of a severe drought. The four years since October 2011 have been the driest on record in terms of cumulative precipitation (Figure A1). This has also been a very warm drought. The past two winters have set records that were 4-5 degrees Fahrenheit above average (Figure A2). The lack of precipitation and high temperatures has resulted in record-low snowpack (Figure A3). Low snowpack, combined with low precipitation and high temperatures, has resulted in exceptionally low flows in the state’s rivers and streams (Figure A4).
Precipitation, Temperatures, Snowpack, and Flows
FIGURE A1 Droughts are a recurring feature of California’s climate
SOURCE: Western Regional Climate Center (California Climate Tracker, accessed July 9, 2015).
NOTE: Bars show California statewide average precipitation by water year (October–September) since 1896. Dry years are those classified as critical or dry in the Sacramento Valley based on the California Cooperative Snow Survey, which takes into account the previous year’s precipitation. For 1896–1905, dry years were estimated by comparing precipitation to the rest of the record. For the 2015 water year, precipitation is actual for October 2014 through June 2015, and assumed to be equal to 2014 levels for the remaining months.
0
5
10
15
20
25
30
35
40
45
1900 1910 1920 1930 1940 1950 1960 1970 1980 1990 2000 2010 2015
Prec
ipita
tion
in in
ches
Normal or wet years Dry years
PPIC.ORG Technical Appendix What If California’s Drought Continues? 4
FIGURE A2-A California summers are becoming warmer
SOURCE: National Oceanic and Atmospheric Administration. Data accessed on June 29, 2015.
NOTE: Historical average temperatures measure three-month average temperatures (June-August) between January 1931 and June 2015.
FIGURE A2-B California winters are becoming warmer
SOURCE: National Oceanic and Atmospheric Administration. Data accessed on June 29, 2015.
NOTE: Historical average temperatures measure three-month average temperatures (December-February) between January 1931 and June 2015.
69
70
71
72
73
74
75
76
77
1931 1941 1951 1961 1971 1981 1991 2001 2011
Tem
pera
ture
(°F)
Summer Average Historical Average
36
38
40
42
44
46
48
50
1931 1941 1951 1961 1971 1981 1991 2001 2011
Tem
pera
ture
(°F)
Winter Average Historical Average
PPIC.ORG Technical Appendix What If California’s Drought Continues? 5
FIGURE A3 California’s snowpack has reached record-low levels
SOURCE: Department of Water Resources, News for Immediate Release: DWR Schedules Next Manual Snow Survey on April 1; Snowpack Likely to Set Record for Meager Water Content. March 27, 2015.Accessed July 22, 2015.
NOTE: Percentage of statewide normal snow water equivalent is from the April 1st snow survey and is based on an average of 30 inches.
FIGURE A4 A growing share of California streams have exceptionally low flows
SOURCE: Source: US Geological Survey WaterWatch, Table of Daily Streamflow Compared to Historical Streamflow for the Day of the Year (California).
NOTE: The figure reports the share of approximately 200 streamgages that are experiencing flows within the bottom 10th percentile of their historical record, using five-day moving averages. The length of the historical record varies, with recording at some gages reaching back as far as 1906.
0%
50%
100%
150%
200%
250%
1950 1955 1960 1965 1970 1975 1980 1985 1990 1995 2000 2005 2010 2015
Perc
ent o
f Nor
mal
Dry or Critically Dry Years Snowpack (Statewide Average)
0%
10%
20%
30%
40%
50%
60%
Jan-2010 Jan-2011 Jan-2012 Jan-2013 Jan-2014 Jan-2015
Perc
enta
ge o
f Str
eam
gage
s
Daily streamflows in lowest 10th percentile
PPIC.ORG Technical Appendix What If California’s Drought Continues? 6
Reduced Water Flows: Temporary Urgency Change Petitions Drought conditions have made it difficult to maintain standards in water flows and quality. To make adjustments to the conditions of their permit or license, water rights holders can petition the State Water Resources Control Board (the Water Board) by filing a Temporary Urgency Change Petition (TUCP). If approved, these petitions last for a maximum of 180 days. During the drought emergency, the Water Board’s executive director has been delegated the authority to approve, modify, or deny a TUCP. From early 2014 to the time of this writing (July 2015) a total of 38 TUCPs were filed, excluding those related to water transfers. This total includes requests for extensions beyond the initial approval period of 180 days. For example, for changes in the operation of the Central Valley Project (CVP) and State Water Project (SWP), there were two original orders (one in early 2014 and one in early 2015), and those orders were modified and/or extended 11 times. Out of 38 orders, only three were denied.1 The Water Board modified the terms of several petitions substantially prior to approval.
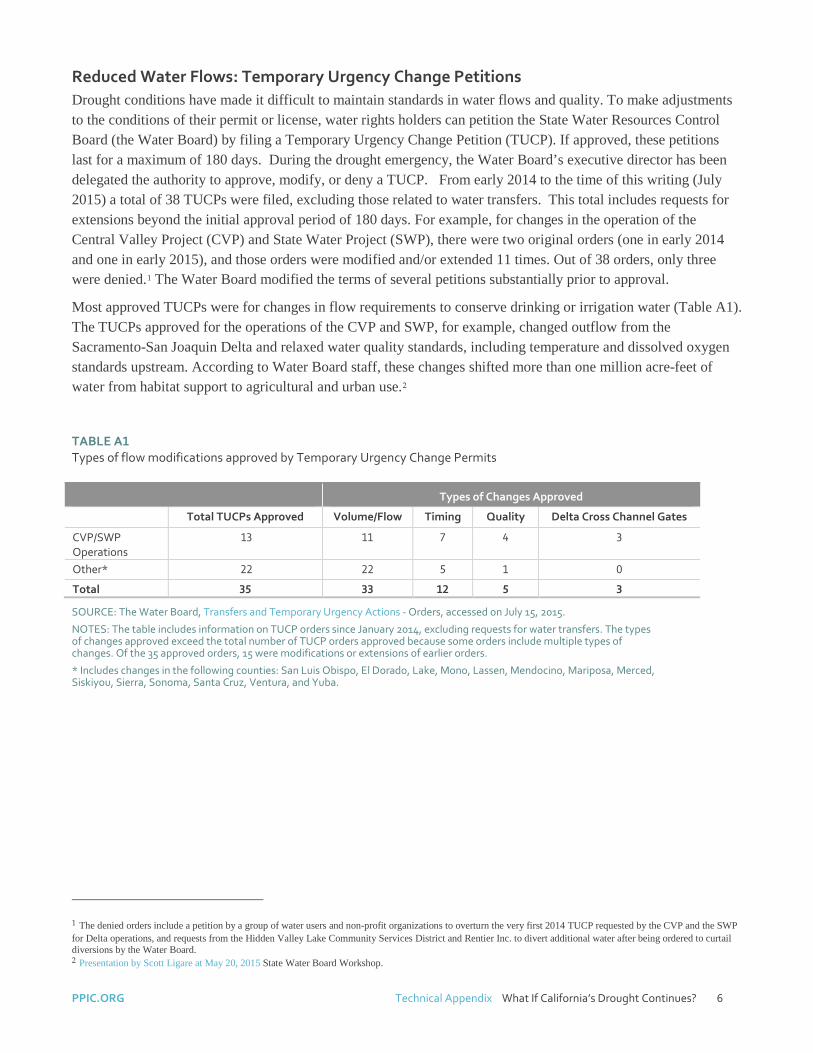
Most approved TUCPs were for changes in flow requirements to conserve drinking or irrigation water (Table A1). The TUCPs approved for the operations of the CVP and SWP, for example, changed outflow from the Sacramento-San Joaquin Delta and relaxed water quality standards, including temperature and dissolved oxygen standards upstream. According to Water Board staff, these changes shifted more than one million acre-feet of water from habitat support to agricultural and urban use.2
TABLE A1 Types of flow modifications approved by Temporary Urgency Change Permits
SOURCE: The Water Board, Transfers and Temporary Urgency Actions - Orders, accessed on July 15, 2015.
NOTES: The table includes information on TUCP orders since January 2014, excluding requests for water transfers. The types of changes approved exceed the total number of TUCP orders approved because some orders include multiple types of changes. Of the 35 approved orders, 15 were modifications or extensions of earlier orders.
* Includes changes in the following counties: San Luis Obispo, El Dorado, Lake, Mono, Lassen, Mendocino, Mariposa, Merced, Siskiyou, Sierra, Sonoma, Santa Cruz, Ventura, and Yuba.
1 The denied orders include a petition by a group of water users and non-profit organizations to overturn the very first 2014 TUCP requested by the CVP and the SWP for Delta operations, and requests from the Hidden Valley Lake Community Services District and Rentier Inc. to divert additional water after being ordered to curtail diversions by the Water Board. 2 Presentation by Scott Ligare at May 20, 2015 State Water Board Workshop.
Types of Changes Approved
Total TUCPs Approved Volume/Flow Timing Quality Delta Cross Channel Gates
CVP/SWP Operations
13 11 7 4 3
Other* 22 22 5 1 0
Total 35 33 12 5 3
PPIC.ORG Technical Appendix What If California’s Drought Continues? 7
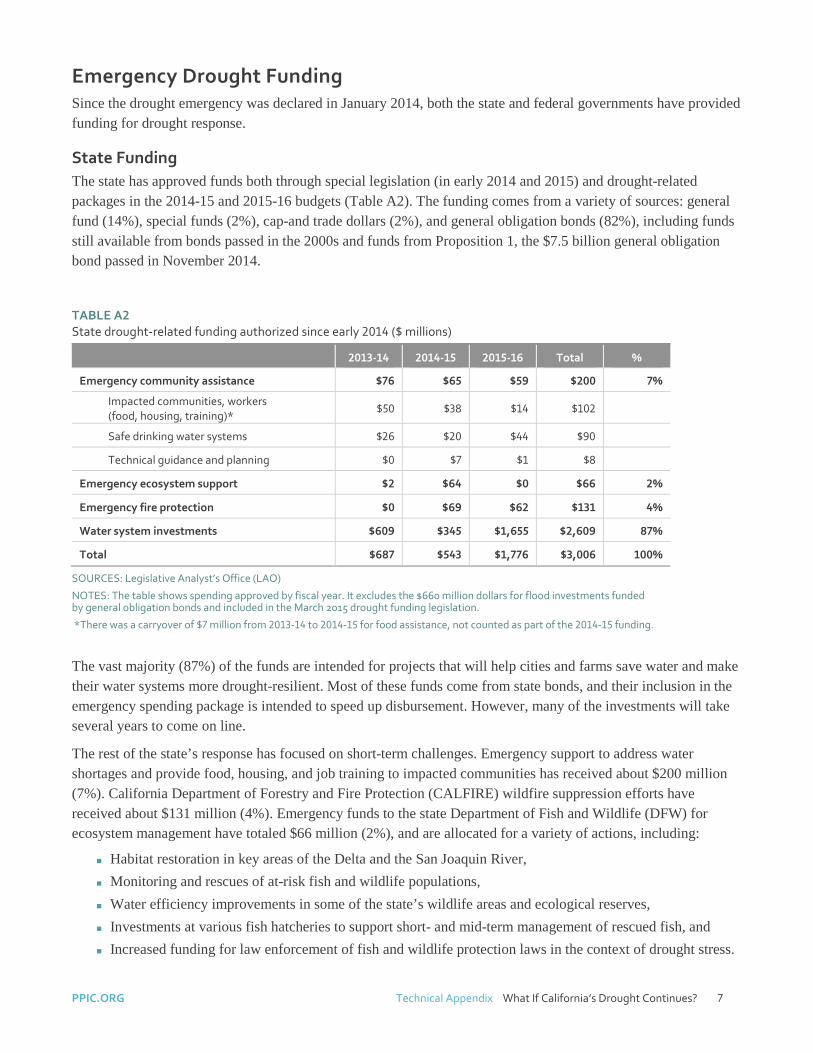
Emergency Drought Funding Since the drought emergency was declared in January 2014, both the state and federal governments have provided funding for drought response.
State Funding The state has approved funds both through special legislation (in early 2014 and 2015) and drought-related packages in the 2014-15 and 2015-16 budgets (Table A2). The funding comes from a variety of sources: general fund (14%), special funds (2%), cap-and trade dollars (2%), and general obligation bonds (82%), including funds still available from bonds passed in the 2000s and funds from Proposition 1, the $7.5 billion general obligation bond passed in November 2014.
TABLE A2 State drought-related funding authorized since early 2014 ($ millions)
2013-14 2014-15 2015-16 Total %
Emergency community assistance $76 $65 $59 $200 7%
Impacted communities, workers (food, housing, training)*
$50 $38 $14 $102
Safe drinking water systems $26 $20 $44 $90
Technical guidance and planning $0 $7 $1 $8
Emergency ecosystem support $2 $64 $0 $66 2%
Emergency fire protection $0 $69 $62 $131 4%
Water system investments $609 $345 $1,655 $2,609 87%
Total $687 $543 $1,776 $3,006 100%
SOURCES: Legislative Analyst’s Office (LAO)
NOTES: The table shows spending approved by fiscal year. It excludes the $660 million dollars for flood investments funded by general obligation bonds and included in the March 2015 drought funding legislation.
*There was a carryover of $7 million from 2013-14 to 2014-15 for food assistance, not counted as part of the 2014-15 funding.
The vast majority (87%) of the funds are intended for projects that will help cities and farms save water and make their water systems more drought-resilient. Most of these funds come from state bonds, and their inclusion in the emergency spending package is intended to speed up disbursement. However, many of the investments will take several years to come on line.
The rest of the state’s response has focused on short-term challenges. Emergency support to address water shortages and provide food, housing, and job training to impacted communities has received about $200 million (7%). California Department of Forestry and Fire Protection (CALFIRE) wildfire suppression efforts have received about $131 million (4%). Emergency funds to the state Department of Fish and Wildlife (DFW) for ecosystem management have totaled $66 million (2%), and are allocated for a variety of actions, including:
Habitat restoration in key areas of the Delta and the San Joaquin River,
Monitoring and rescues of at-risk fish and wildlife populations,
Water efficiency improvements in some of the state’s wildlife areas and ecological reserves,
Investments at various fish hatcheries to support short- and mid-term management of rescued fish, and
Increased funding for law enforcement of fish and wildlife protection laws in the context of drought stress.
PPIC.ORG Technical Appendix What If California’s Drought Continues? 8
Table A2 summarizes the funds that have been made available by the state, but it does not reflect the actual dollars being spent on the ground in local communities and watersheds. Spending the available funding quickly can be challenging, especially when multiple agencies and jurisdictions are involved in planning or permitting. Of the original $687 million allocated for emergency drought relief in early 2014, about half ($340 million) still remained unspent as of June 2015.3 For example, almost a year after being allocated $38 million in the 2014-15 budget, DFW had only directly spent $17.4 million. In that period the department also made over $7 million in grants available for the Fisheries Restoration Grant Program which partners with landowners to improve key habitat.4
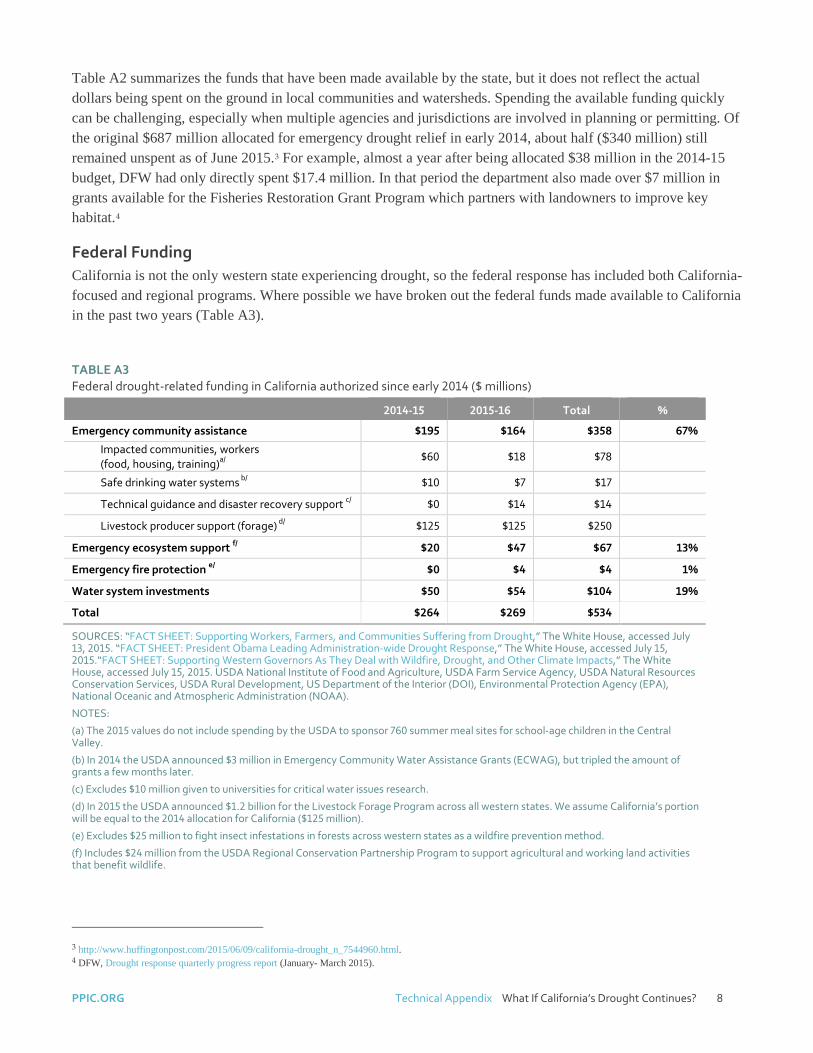
Federal Funding California is not the only western state experiencing drought, so the federal response has included both California-focused and regional programs. Where possible we have broken out the federal funds made available to California in the past two years (Table A3).
TABLE A3 Federal drought-related funding in California authorized since early 2014 ($ millions)
2014-15 2015-16 Total %
Emergency community assistance $195 $164 $358 67%
Impacted communities, workers (food, housing, training)a/
$60 $18 $78
Safe drinking water systems b/ $10 $7 $17
Technical guidance and disaster recovery support c/ $0 $14 $14
Livestock producer support (forage) d/ $125 $125 $250
Emergency ecosystem support f/ $20 $47 $67 13%
Emergency fire protection e/ $0 $4 $4 1%
Water system investments $50 $54 $104 19%
Total $264 $269 $534
SOURCES: “FACT SHEET: Supporting Workers, Farmers, and Communities Suffering from Drought,” The White House, accessed July 13, 2015. “FACT SHEET: President Obama Leading Administration-wide Drought Response,” The White House, accessed July 15, 2015.“FACT SHEET: Supporting Western Governors As They Deal with Wildfire, Drought, and Other Climate Impacts,” The White House, accessed July 15, 2015. USDA National Institute of Food and Agriculture, USDA Farm Service Agency, USDA Natural Resources Conservation Services, USDA Rural Development, US Department of the Interior (DOI), Environmental Protection Agency (EPA), National Oceanic and Atmospheric Administration (NOAA).
NOTES:
(a) The 2015 values do not include spending by the USDA to sponsor 760 summer meal sites for school-age children in the Central Valley.
(b) In 2014 the USDA announced $3 million in Emergency Community Water Assistance Grants (ECWAG), but tripled the amount of grants a few months later.
(c) Excludes $10 million given to universities for critical water issues research.
(d) In 2015 the USDA announced $1.2 billion for the Livestock Forage Program across all western states. We assume California’s portion will be equal to the 2014 allocation for California ($125 million).
(e) Excludes $25 million to fight insect infestations in forests across western states as a wildfire prevention method.
(f) Includes $24 million from the USDA Regional Conservation Partnership Program to support agricultural and working land activities that benefit wildlife.
3 http://www.huffingtonpost.com/2015/06/09/california-drought_n_7544960.html. 4 DFW, Drought response quarterly progress report (January- March 2015).
PPIC.ORG Technical Appendix What If California’s Drought Continues? 9
In contrast to the state’s funding, emergency funds are the main focus of the federal response (67%) and they have been directed to assist impacted communities (job training, food banks, housing support), provide safe drinking water, and support emergency planning and technical support. In addition, the US Department of Agriculture (USDA) has provided funding to compensate livestock producers who have suffered grazing losses due to drought or fire for the added costs of feed.
About $67 million of federal funds (13%) are for actions to address near-term environmental challenges, such as: habitat conservation, ecosystem monitoring, water supply acquisition for wildlife refuges, and fish passages and screens. Funds were also made available for some projects that enhance agricultural or public lands for the benefit of wildlife, for example the expansion of waterbird habitat using rice fields.5 Excluded from Table A3 is funding announced in 2015 for longer-term ecosystem investments in California, such as $130 million from the new “Resilient Lands and Waters Initiative” to conserve and restore important lands and waters and make them more resilient to a changing climate.
Federal funding has also been allocated for longer term investments in water efficiency, conservation, and supply diversification (19%).
Water Transfers Water transfers refer to the temporary or long-term leasing or permanent sale of water from one water-rights-holder to another. Trading is a mechanism for accommodating long-term shifts in the geographic distribution of the population and economic activity, while compensating existing right-holders for the investments they have made based on their water rights. It is also a way to lessen the costs of temporary shortages during droughts, by making it possible to shift water to activities and places where the lack of water will be more costly. Trading often involves the transfer of water from more senior right-holders to those with more junior rights. State and federal policies have promoted trading for both long-term and drought-related purposes in California since the 1980s and especially since the major drought California experienced from 1987 to 1992.6
In California, there are four potential sources of water that can enter the market:
excess water stored in surface reservoirs to which the seller has rights,
other excess amounts of surface water that the seller has the right to use, but does not need and cannot store,
“conserved” surface water that the seller saves by reducing his or her own use, and
groundwater.
Because moving water from one place of use to another can have consequences for other water users and the environment, water trading is subject to an approval process intended to ensure that trades are not causing harm. For instance, if a Sacramento Valley rice grower wants to lease conserved water to an almond farmer in the San Joaquin Valley, he or she can only transfer the water actually consumed by the rice crop, not the total amount of water applied to the field. This ensures that the water not consumed by the rice remains in the river and available for other legal water right-holders. As another example, many rural counties have ordinances to prevent harm to local groundwater users by limiting the export of groundwater.
5 For instance, the Regional Conservation Partnership Program (RCPP) provides up to $24 million to California and partners for several conservation projects including programs that expand waterbird and tricolored blackbird habitat by partnering with farmers in the Central Valley. 6 For more extensive discussion of the history of water marketing in California, the legal and policy context, and more details on trends, see E. Hanak and E. Stryjewski, California’s Water Market, By the Numbers: Update 2012 (PPIC, 2012).
PPIC.ORG Technical Appendix What If California’s Drought Continues? 10
Trading also requires the availability of infrastructure to move water from seller to buyer. This can often be accomplished through a series of exchanges, making it possible to move water between parties that do not themselves have a direct connection, as long as they have connections to other parties willing to help engage in the trade.
The transfer approval process in California is complex, and it varies considerably depending on several factors:
Seniority of surface water rights: Surface rights-holders whose rights were established from 1914 onward need to get the approval of the Water Board; those with pre-1914 rights do not.
Within or outside of the CVP or SWP: Contractors within these projects can generally trade more easily with each other than with those outside the projects. The rules for within-project trades vary between the CVP and SWP, and these trades are approved by the project operating agencies.
Use of CVP or SWP infrastructure to move water: In these cases the project operators have to approve the trade.
Local rules regarding groundwater: As noted above, many rural counties have rules regarding the direct trade of groundwater, and in some cases this extends to trade of surface water if it results in the seller using groundwater as a substitute source on his or her own land.
This complex set of rules results in an approval process that is complicated, often very lengthy, and lacking in transparency. There is no central repository of information on volumes or prices of trades, and no straightforward way for those interested in market transactions to determine conditions under which trading is possible. And while the state initially fostered market growth, it has stepped back from this effort somewhat over the past decade or so. In particular, approvals of the use of SWP infrastructure—including conveyance through the Delta—have become more difficult.
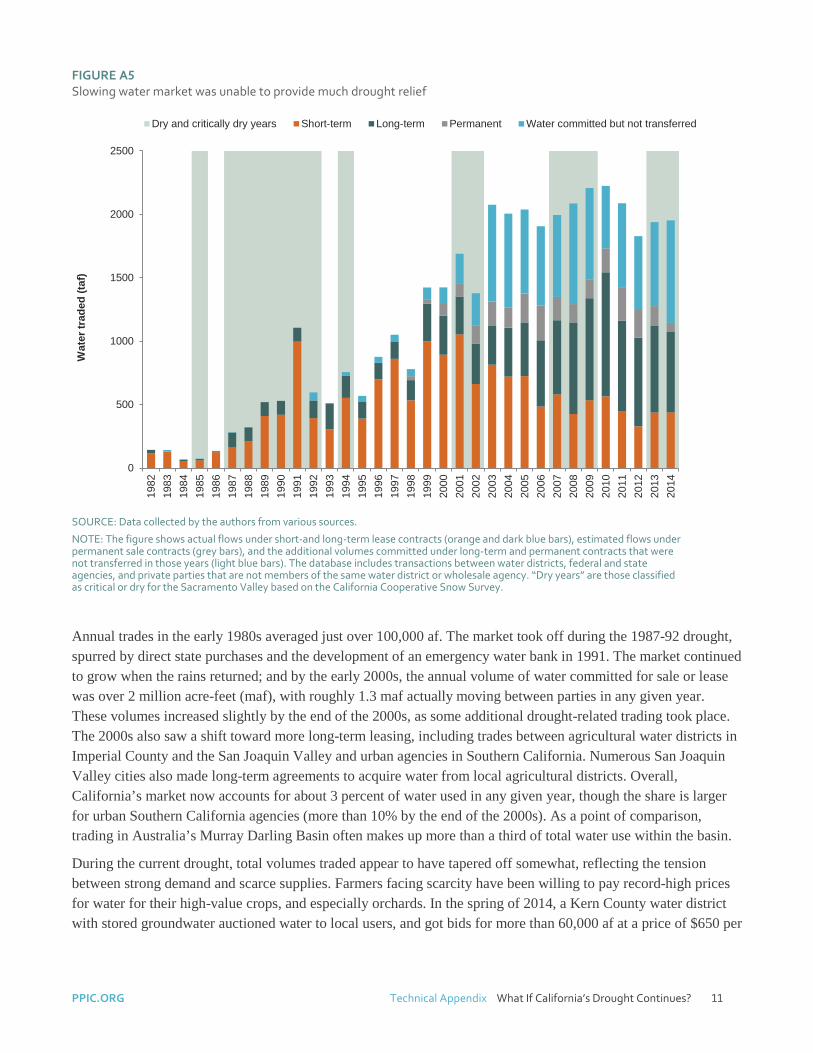
Since the early 2000s, PPIC has compiled data on the volumes traded in California’s water market. Figure A5 presents an update of these estimates through 2014, including the first three years of the current drought. This data principally includes trades between water districts, not trades among farmers within irrigation districts or trades among water right holders within adjudicated basins, some of which have active trading. Figure A5 shows actual flows under short-and long-term lease contracts (orange and dark blue bars), estimated flows under permanent sale contracts (grey bars), and the additional volumes committed under long-term lease and permanent sale contracts that were not transferred in those years (light blue bars).
PPIC.ORG Technical Appendix What If California’s Drought Continues? 11
FIGURE A5 Slowing water market was unable to provide much drought relief
SOURCE: Data collected by the authors from various sources.
NOTE: The figure shows actual flows under short-and long-term lease contracts (orange and dark blue bars), estimated flows under permanent sale contracts (grey bars), and the additional volumes committed under long-term and permanent contracts that were not transferred in those years (light blue bars). The database includes transactions between water districts, federal and state agencies, and private parties that are not members of the same water district or wholesale agency. “Dry years” are those classified as critical or dry for the Sacramento Valley based on the California Cooperative Snow Survey.
Annual trades in the early 1980s averaged just over 100,000 af. The market took off during the 1987-92 drought, spurred by direct state purchases and the development of an emergency water bank in 1991. The market continued to grow when the rains returned; and by the early 2000s, the annual volume of water committed for sale or lease was over 2 million acre-feet (maf), with roughly 1.3 maf actually moving between parties in any given year. These volumes increased slightly by the end of the 2000s, as some additional drought-related trading took place. The 2000s also saw a shift toward more long-term leasing, including trades between agricultural water districts in Imperial County and the San Joaquin Valley and urban agencies in Southern California. Numerous San Joaquin Valley cities also made long-term agreements to acquire water from local agricultural districts. Overall, California’s market now accounts for about 3 percent of water used in any given year, though the share is larger for urban Southern California agencies (more than 10% by the end of the 2000s). As a point of comparison, trading in Australia’s Murray Darling Basin often makes up more than a third of total water use within the basin.
During the current drought, total volumes traded appear to have tapered off somewhat, reflecting the tension between strong demand and scarce supplies. Farmers facing scarcity have been willing to pay record-high prices for water for their high-value crops, and especially orchards. In the spring of 2014, a Kern County water district with stored groundwater auctioned water to local users, and got bids for more than 60,000 af at a price of $650 per
0
500
1000
1500
2000
250019
8219
8319
8419
8519
8619
8719
8819
8919
9019
9119
9219
9319
9419
9519
9619
9719
9819
9920
0020
0120
0220
0320
0420
0520
0620
0720
0820
0920
1020
1120
1220
1320
14
Wat
er tr
aded
(taf
)
Dry and critically dry years Short-term Long-term Permanent Water committed but not transferred
PPIC.ORG Technical Appendix What If California’s Drought Continues? 12
af or more.7 Because senior water-right holders have seen their own allocations cut, they have also been more constrained in making water available. For instance, the Metropolitan Water District of Southern California had planned to purchase around 100,000 af from Sacramento Valley rice growers with senior contracts with the SWP for water from the Feather River, but that deal was contingent on the growers getting a full allocation. When the growers were informed that their allocation would be cut by 50 percent, the deal was significantly scaled back. Trading during the drought has also been helpful in alleviating more localized urban water shortages. For instance, the City of Huron, a small town in Fresno County whose own system was facing a shortage, was able to purchase water from the nearby Fresno Irrigation District.8
If the drought continues, trading will be an essential tool for lessening the costs of scarcity. This will require clarifying and simplifying the institutional review process for transfers, while continuing to prevent harm to the environment and adverse effects for other legal users of the state’s waters. Because routinizing marketing and banking transactions will require some risk-taking, high-level state and federal officials should be involved. One option might be to develop a coordinating committee from relevant agencies, with the authority to facilitate discussions and transactions. Strengthening the information base on water use and availability, as recommended in the main report, will be an essential tool for strengthening California’s water market.
Drought Impacts on Urban Areas
Conservation and Mandatory Water Restrictions In an April 1, 2015 Executive Order, Governor Brown mandated a 25 percent statewide water use reduction in cities and towns across California. In accordance with this order, the Water Board adopted an emergency regulation in May requiring a 25 percent reduction in overall urban water use beginning in June 2015. This regulation used a sliding scale for setting conservation standards based on residential per capita use, so that communities that have already reduced their usage through earlier conservation will have lower targets than those that have not made such improvements. Each urban water supplier was placed in one of eight tiers, requiring water use reductions of 8 to 36 percent over a 2013 baseline. Although tiers were determined based on residential use, the mandate applies to total urban use (including commercial, institutional, and industrial water sales, which on average make up roughly one-third of total sales).
Since mid-2014, the Water Board has required urban water suppliers to provide information on their water use each month. To assess compliance with the mandate, the Water Board will compare usage with the same month in 2013 to determine whether the supplier is on track for meeting its conservation standard.9
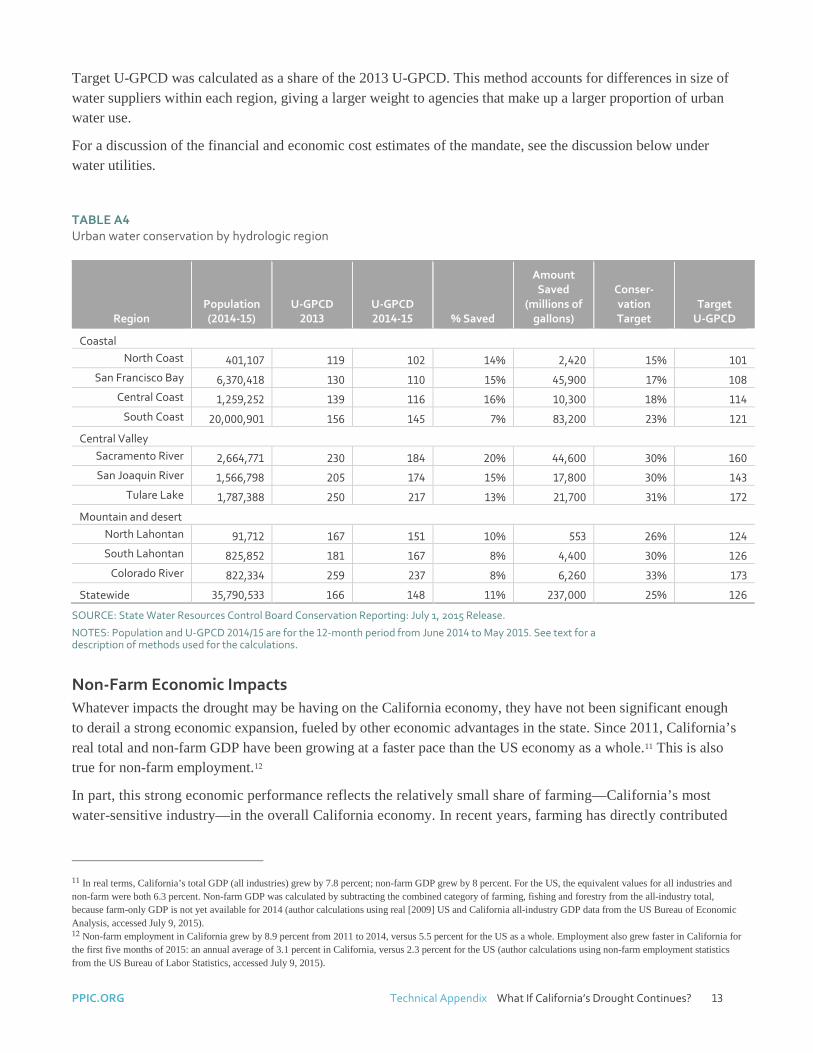
Table A4 presents information related to urban water use and the conservation mandate for California’s 415 urban water suppliers, grouped by hydrologic region, using data from the Water Board’s July 1, 2015 conservation reporting release. To estimate the amount and percentage of water saved so far within each region, we compared urban gallons per capita per day (U-GPCD) for 2013 (the baseline year) with the most recent 12-month period, from June 2014 to May 2015.10 Regional conservation targets were estimated by multiplying the individual water supply agency targets by their total 2013 water sales (“production”), and averaging across total regional water sales. 7 L. Henry, “Thirsty growers bid sky-high for available water,” The Bakersfield Californian, February 5, 2014. All 50 bids, requesting more than 63,000 af of water, came in above the $600 per acre-foot floor, and nearly 20 were $1,000 per acre foot or higher. The Buena Vista Water Storage District made 12,000 af available for sale. 8 For a link to the project description see: http://www.ceqanet.ca.gov/NOEdescription.asp?DocPK=679334. We confirmed in conversation with city officials that the transfer took place. 9 “July 1, 2015 Press Release,” accessed July 1, 2015. 10 Using the Water Board’s recommended computation for residential water use, we calculated urban gallons per capita day (U-GPCD) by dividing total annual water production within the region by total population and the number of days in a year. “Instructions for Estimating Residential Gallons Per Capita Day (R-GPCD) in Completing Monthly Urban Water Supplier Report,” accessed on July 1, 2015.
PPIC.ORG Technical Appendix What If California’s Drought Continues? 13
Target U-GPCD was calculated as a share of the 2013 U-GPCD. This method accounts for differences in size of water suppliers within each region, giving a larger weight to agencies that make up a larger proportion of urban water use.
For a discussion of the financial and economic cost estimates of the mandate, see the discussion below under water utilities.
TABLE A4 Urban water conservation by hydrologic region
Region Population (2014-15)
U-GPCD 2013
U-GPCD 2014-15 % Saved
Amount Saved
(millions of gallons)
Conser-vation Target
Target U-GPCD
Coastal North Coast 401,107 119 102 14% 2,420 15% 101
San Francisco Bay 6,370,418 130 110 15% 45,900 17% 108 Central Coast 1,259,252 139 116 16% 10,300 18% 114
South Coast 20,000,901 156 145 7% 83,200 23% 121
Central Valley Sacramento River 2,664,771 230 184 20% 44,600 30% 160 San Joaquin River 1,566,798 205 174 15% 17,800 30% 143
Tulare Lake 1,787,388 250 217 13% 21,700 31% 172
Mountain and desert North Lahontan 91,712 167 151 10% 553 26% 124 South Lahontan 825,852 181 167 8% 4,400 30% 126
Colorado River 822,334 259 237 8% 6,260 33% 173
Statewide 35,790,533 166 148 11% 237,000 25% 126
SOURCE: State Water Resources Control Board Conservation Reporting: July 1, 2015 Release.
NOTES: Population and U-GPCD 2014/15 are for the 12-month period from June 2014 to May 2015. See text for a description of methods used for the calculations.
Non-Farm Economic Impacts Whatever impacts the drought may be having on the California economy, they have not been significant enough to derail a strong economic expansion, fueled by other economic advantages in the state. Since 2011, California’s real total and non-farm GDP have been growing at a faster pace than the US economy as a whole.11 This is also true for non-farm employment.12
In part, this strong economic performance reflects the relatively small share of farming—California’s most water-sensitive industry—in the overall California economy. In recent years, farming has directly contributed
11 In real terms, California’s total GDP (all industries) grew by 7.8 percent; non-farm GDP grew by 8 percent. For the US, the equivalent values for all industries and non-farm were both 6.3 percent. Non-farm GDP was calculated by subtracting the combined category of farming, fishing and forestry from the all-industry total, because farm-only GDP is not yet available for 2014 (author calculations using real [2009] US and California all-industry GDP data from the US Bureau of Economic Analysis, accessed July 9, 2015). 12 Non-farm employment in California grew by 8.9 percent from 2011 to 2014, versus 5.5 percent for the US as a whole. Employment also grew faster in California for the first five months of 2015: an annual average of 3.1 percent in California, versus 2.3 percent for the US (author calculations using non-farm employment statistics from the US Bureau of Labor Statistics, accessed July 9, 2015).
PPIC.ORG Technical Appendix What If California’s Drought Continues? 14
roughly 1 percent of total state GDP.13 Its share of employment is somewhat higher (roughly 2.5%).14 Farming also has strong linkages to some other activities like food and beverage processing (roughly 1.2% of GDP) that are included in the non-farm GDP and employment statistics reported here.
This strong economic performance also reflects the preparation urban water utilities have made to withstand droughts, as described in the main report. In addition, California now has relatively few non-farm industries that are particularly water-sensitive. For instance, despite the strong growth in the state’s information technology sector, high technology manufacturing began shifting in the 1990s to lower-cost locations outside of California.15
Here, we briefly review information about some other water-sensitive activities. The results suggest mixed effects from the drought, but no issues that raise major concerns for the state’s overall economy.16
Electricity
The reliability of the state’s energy grid is of central importance to overall economic activity. The main water-related vulnerabilities in this sector relate to hydropower production, cooling for thermal (natural gas-fired) power plants, and the potential for wildfires to take out parts of the grid. So far, the costs of the drought appear small for this sector, and new planning efforts are underway to reduce vulnerabilities.
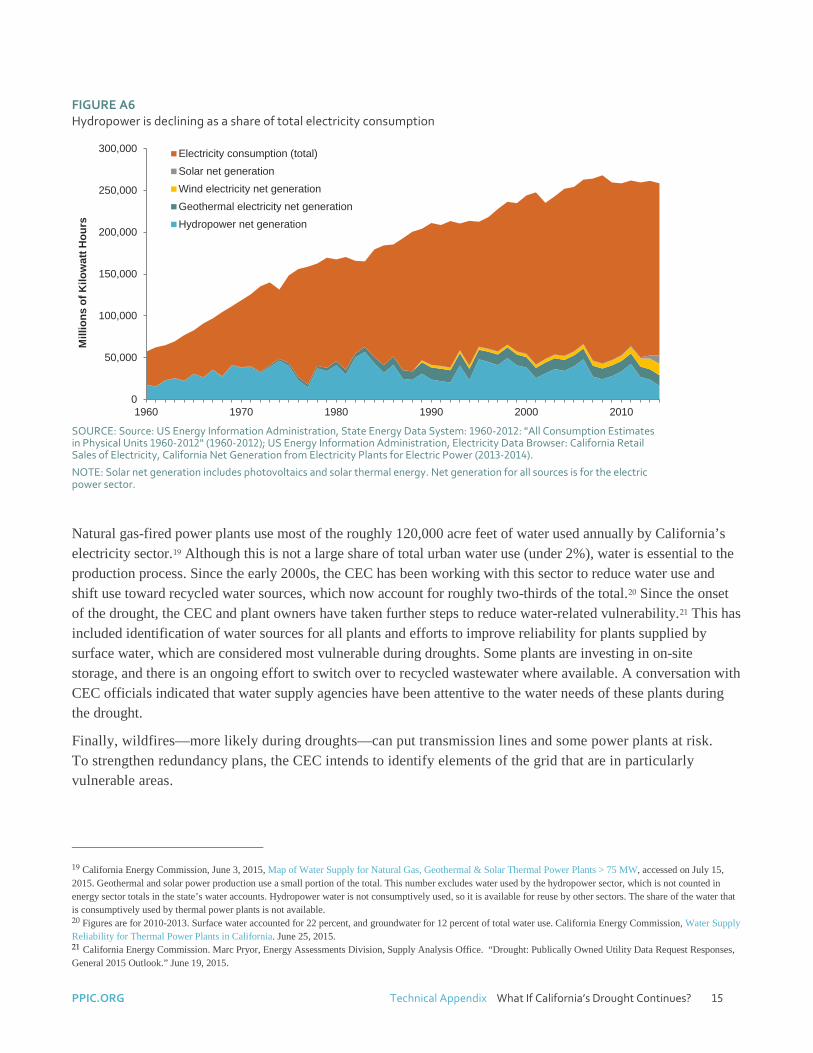
Hydropower production directly depends on availability of surface water flows and water in surface reservoirs, and the drought has slashed production in half relative to the post-2000 average.17 Hydropower is especially valued as a source of peak energy production, and the decline is causing increases in costs for replacement power in some parts of the state, but the economic impacts appear relatively small—on the order of $500 million per year, and requiring bill increases of less than 2 percent.18 These costs are also far less than they would have been in earlier decades, because the state’s power grid has become more diversified. In-state hydropower contributed an average of 32 percent of total electricity consumed in California throughout the 1960s, but its share has been decreasing over time, averaging just 12 percent between 2000 and 2014 (Figure A6). (In 2014, the share was 6 percent.) The alternative to hydropower for peak energy production in California has traditionally been thermal production from natural gas-fired plants. But according to the California Energy Commission (CEC), many areas facing reduced hydropower have primarily been expanding use of renewable energy sources (especially solar and wind), production of which has tripled in recent years as part of the state’s plan to reduce greenhouse gas emissions.
13 The share varies somewhat by data source. The average share of farm GDP in total real state GDP from 2005 to 2013 using real (2009) all-industry GDP data from the US Bureau of Economic Analysis is 0.8%, the same value reported for 2013. The share of value added (a measure similar to GDP) reported by IMPLAN for direct farming activities was 1.4% in 2013. This number was reported in Moody’s Investors Service’s “Frequently Asked Questions about the Drought in California,” presented by Michael Wertz, July 21, 2015. 14 In 2013, average annual direct farm employment was 407,000 (2.6%), roughly equally split between direct farm employment and contract labor (support activities). (Author calculations using California Regional Economies Employment data, accessed on July 21, 2015). 15 E. Hanak et al., Water and the California Economy (Public Policy Institute of California, 2012). 16 On the overall economic impacts and outlook related to the drought, see also a new study “Frequently Asked Questions about the Drought in California” from the bond-rating agency Moody’s Investor Service. Findings were recently presented by Michael Wertz on July 21, 2015. 17 US Energy Information Administration. Electricity Data Browser: Net Generation of Conventional Hydroelectric power in California. In 2014, conventional hydroelectric generation dropped to 16,405,000 megawatt hours, relative to a 2001-2013 average of 32,365,000 megawatt hours. 18 In late 2014, the CEC estimated the total annual cost of replacing hydropower for two major investor-owned utilities, PG&E and Southern California Edison, at $420 million. Assuming a small additional decline in hydropower production in 2015, this was projected to potentially raise customer electricity bills in 2015 by roughly 2 percent. The third large IOU, San Diego Electric, is not reliant on hydropower. (California Energy Commission, Memo to Drought Working Group, Power Sector. Michele Kito, CPUC Energy Division, November 17, 2014). Cost increases for publicly owned utilities were projected to reach $70 to $100 million per year. (California Energy Commission. Marc Pryor, Energy Assessments Division, Supply Analysis Office. “Drought: Publically Owned Utility Data Request Responses, General 2015 Outlook.” June 19, 2015.)
PPIC.ORG Technical Appendix What If California’s Drought Continues? 15
FIGURE A6 Hydropower is declining as a share of total electricity consumption
SOURCE: Source: US Energy Information Administration, State Energy Data System: 1960-2012: "All Consumption Estimates in Physical Units 1960-2012" (1960-2012); US Energy Information Administration, Electricity Data Browser: California Retail Sales of Electricity, California Net Generation from Electricity Plants for Electric Power (2013-2014).
NOTE: Solar net generation includes photovoltaics and solar thermal energy. Net generation for all sources is for the electric power sector.
Natural gas-fired power plants use most of the roughly 120,000 acre feet of water used annually by California’s electricity sector.19 Although this is not a large share of total urban water use (under 2%), water is essential to the production process. Since the early 2000s, the CEC has been working with this sector to reduce water use and shift use toward recycled water sources, which now account for roughly two-thirds of the total.20 Since the onset of the drought, the CEC and plant owners have taken further steps to reduce water-related vulnerability.21 This has included identification of water sources for all plants and efforts to improve reliability for plants supplied by surface water, which are considered most vulnerable during droughts. Some plants are investing in on-site storage, and there is an ongoing effort to switch over to recycled wastewater where available. A conversation with CEC officials indicated that water supply agencies have been attentive to the water needs of these plants during the drought.
Finally, wildfires—more likely during droughts—can put transmission lines and some power plants at risk. To strengthen redundancy plans, the CEC intends to identify elements of the grid that are in particularly vulnerable areas.
19 California Energy Commission, June 3, 2015, Map of Water Supply for Natural Gas, Geothermal & Solar Thermal Power Plants > 75 MW, accessed on July 15, 2015. Geothermal and solar power production use a small portion of the total. This number excludes water used by the hydropower sector, which is not counted in energy sector totals in the state’s water accounts. Hydropower water is not consumptively used, so it is available for reuse by other sectors. The share of the water that is consumptively used by thermal power plants is not available. 20 Figures are for 2010-2013. Surface water accounted for 22 percent, and groundwater for 12 percent of total water use. California Energy Commission, Water Supply Reliability for Thermal Power Plants in California. June 25, 2015. 21 California Energy Commission. Marc Pryor, Energy Assessments Division, Supply Analysis Office. “Drought: Publically Owned Utility Data Request Responses, General 2015 Outlook.” June 19, 2015.
0
50,000
100,000
150,000
200,000
250,000
300,000
1960 1970 1980 1990 2000 2010
Mill
ions
of K
ilow
att H
ours
Electricity consumption (total)Solar net generationWind electricity net generationGeothermal electricity net generationHydropower net generation
PPIC.ORG Technical Appendix What If California’s Drought Continues? 16
Water Utilities
Local water supply utilities deliver water to most of the state’s residents and non-farm businesses. They cover most of the costs for their operations and infrastructure investments with local revenues, principally from water sales.22 Borrowing for infrastructure projects is generally also backed by sales revenues. Utilities’ finances are inherently vulnerable to reductions in water sales that accompany droughts.
Volumetric water rates—which charge customers based on the amount they use—can help water utilities meet conservation goals, but they can also pose fiscal challenges. This is because short-term costs for water utilities are mostly fixed—i.e., not dependent on the amount of water sold—whereas the majority of revenues come from the volume sold.23 A 2015 economic impact analysis commissioned by the Water Board estimated the costs to utilities and customers of implementing the statewide urban conservation mandate. Counting only the additional savings required by the mandate (and not the savings already achieved through voluntary measures), the study estimated $500 to $600 million in net revenue losses, or $14 to $17 per person.24 This represents roughly 4 percent of total annual utility revenues.25
Utilities will ultimately need to recoup the revenue losses from implementing the mandate—along with losses from the voluntary cuts already achieved—through customer bill increases. Some utilities already have rate structures in place that can accommodate these increases. In particular, the large investor-owned utilities, whose rates are regulated by the California Public Utilities Commission, have provisions in their rate structures for “decoupling,” which allows them to recover net revenue losses from conservation in bills in subsequent years. In contrast, it appears that few publicly-owned utilities—which serve roughly 85 percent of all California customers—have built-in mechanisms to handle these revenue losses. A handful of utilities have a drought surcharge, which allows them to increase rates in years when they expect to sell less because of drought conditions. But many utilities appear to be relying principally on spending down fiscal reserves to make up the shortfall, at best a temporary strategy.26
Raising rates is not always a straightforward process for publicly-owned utilities in California, which are subject to a number of procedural and substantive requirements on water rate-setting under Proposition 218.27 In particular, tiered rates—used by over half of California utilities28 to encourage conservation by charging higher per-gallon prices for higher levels of water use—have been subject to legal challenges for failing to meet
22 E. Hanak et al. Paying for Water in California (Public Policy Institute of California, 2014) found that local water agencies provided nearly 88 percent of the funds spent annually on water supply provision in California between 2008 and 2011 (Table 1). On average, 83 percent of local revenues came from water sales and service fees (Technical Appendix B, Table B3). 23 Utility managers in California often cite 70 to 80 percent fixed costs, similar to the typical volumetric portion of the water bill. For a general discussion, see E. Hanak et al., Paying for Water in California (Public Policy Institute of California, 2014) and UNC Environmental Finance Center, “Working water efficiency into the utility business model.” June 2010. 24 These are costs for 800,000 acre-feet of savings, or roughly 15 percent of 2013 water use. M.Cubed, Executive Order B-29-15 State of Emergency Due to Severe Drought Conditions Economic Impact Analysis, May 2015. 25 Author estimates using information on losses from the M.Cubed 2015 report cited above (note 24) and information on revenues for public water supply agencies from E. Hanak et al., Paying for Water in California (PPIC, 2014), Technical Appendix B, Table B3. We assume the share of revenue losses is similar for privately owned water utilities and mutual water companies. 26 In the summer of 2014, a Water Board survey found that only 7 percent of urban utilities had drought pricing structures. 27 Rate increases must be publicly noticed and subject to a protest vote, and charges must be proportional to the costs of service to properties. See E. Hanak et al., Paying for Water in California (PPIC, 2014) for more details. 28 M. Stevens, “In blow to water conservation, court rejects San Juan Capistrano's tiered rates,” The Los Angeles Times, April 20, 2015 reported that 66 to 80 percent of California water agencies use tiered pricing. Using data from a 2003 survey from Black and Veatch, Hanak estimated that roughly half of the population was served by utilities with tiered rate structures at that time (E. Hanak, “Is Water Policy Limiting Residential Growth? Evidence from California,” Land Economics, 2008, Vol. 84(1): 31-50.
PPIC.ORG Technical Appendix What If California’s Drought Continues? 17
Proposition 218’s strict cost proportionality requirement.29 Utilities that opt to raise the fixed portion of the monthly bill may face fewer legal hurdles, but this can have adverse implications from an equity perspective.30
It is important to note that raising rates to make up the revenue losses from reduced sales does not translate to a net increase in customer costs: utilities have to do this because water sales (and customer bills) have gone down. This is in contrast to the energy sector impacts described above, where a loss in hydropower has meant an increase in total costs to cover the higher-cost energy alternatives. If the drought also pushes water utilities to invest in higher-cost water supplies, this can similarly be expected to increase customer bills. This would continue a trend observed since the early 2000s, with monthly costs to customers rising faster than the rate of inflation to cover the costs of infrastructure upgrades and new supplies.31
It also bears noting that conservation measures can create direct costs for water both residential and business customers, for instance by requiring them to make additional investments (e.g., water-saving technology or landscapes) or forgoing activities they would otherwise enjoy if more water were available. For business customers, conservation can also lead to declines in demand for their goods and services, for instance if lower outdoor water use reduces the demand for lawn maintenance services (though as described below, it can also generate new demands, such as for replacement of turf with low-water landscapes). The Water Board-commissioned study of the economic impacts of the conservation mandate provided a rough overall estimate of these costs to businesses and households, on the order of $500 to $700 million, or $14 to $19 per person—similar in magnitude to the net financial losses to utilities noted above.32 Only some of these costs will be reflected in economic indicators.
Landscaping
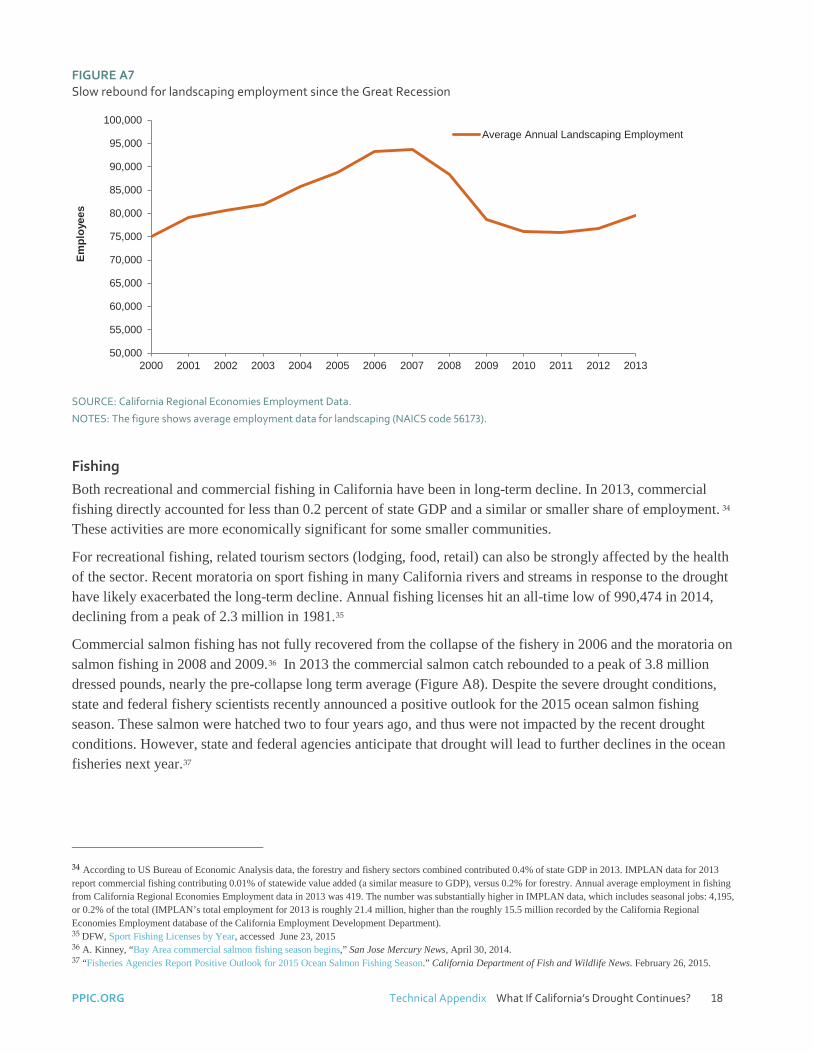
Outdoor water use by households, businesses, and other institutions like parks, cemeteries and schools, makes up roughly half of total urban use, and much of this use involves the landscaping industry. In 2013, the sector employed an average of nearly 80,000 workers (0.5% of total employment), lower than the pre-recession peak of nearly 94,000 jobs in 2007 (Figure A7). In response to the drought, many households and businesses are cutting back on watering their landscapes, and some are now replacing thirsty lawns with low-water landscaping and low-flow irrigation technologies. Some small landscaping services whose business consists primarily of turf maintenance may be facing reduced demand. On the other hand, landscaping services that specialize in low-water landscaping techniques are in high demand.33 Landscaping services that invest in educating employees about drought-resistant landscaping practices can take advantage of these new trends.
29 A recent appellate court ruling in a case regarding rates in the City of San Juan Capistrano represents a successful challenge of tiered conservation rates under the cost proportionality requirement of Proposition 218. Capistrano Taxpayers Association Inc. v. City of San Juan Capistrano, Slip. Op. G048969, April 20, 2015. 30 E. Hanak, “The High Cost of Drought for Low-Income Californians” (PPIC blog, June 18, 2015). 31 E. Hanak et al., Paying for Water in California (PPIC, 2014), Figure 4. 32 This is the loss of “consumer surplus” to commercial and non-commercial customers. See M. Cubed 2015 report cited above (note 24). 33 A. Orlowski, “Shifting Ground: As drought-conscious OC removes lawns, workers are forced to adapt,” Orange County Register, May 23, 2015.
PPIC.ORG Technical Appendix What If California’s Drought Continues? 18
FIGURE A7 Slow rebound for landscaping employment since the Great Recession
SOURCE: California Regional Economies Employment Data.
NOTES: The figure shows average employment data for landscaping (NAICS code 56173).
Fishing
Both recreational and commercial fishing in California have been in long-term decline. In 2013, commercial fishing directly accounted for less than 0.2 percent of state GDP and a similar or smaller share of employment. 34 These activities are more economically significant for some smaller communities.
For recreational fishing, related tourism sectors (lodging, food, retail) can also be strongly affected by the health of the sector. Recent moratoria on sport fishing in many California rivers and streams in response to the drought have likely exacerbated the long-term decline. Annual fishing licenses hit an all-time low of 990,474 in 2014, declining from a peak of 2.3 million in 1981.35
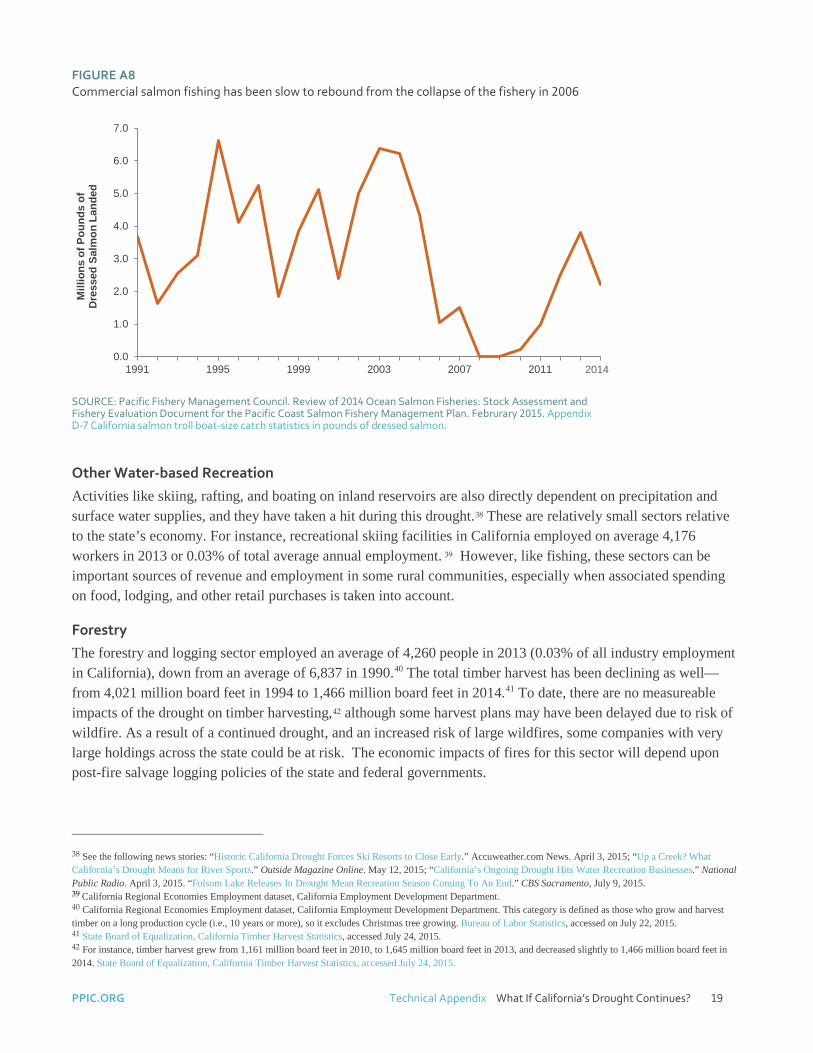
Commercial salmon fishing has not fully recovered from the collapse of the fishery in 2006 and the moratoria on salmon fishing in 2008 and 2009.36 In 2013 the commercial salmon catch rebounded to a peak of 3.8 million dressed pounds, nearly the pre-collapse long term average (Figure A8). Despite the severe drought conditions, state and federal fishery scientists recently announced a positive outlook for the 2015 ocean salmon fishing season. These salmon were hatched two to four years ago, and thus were not impacted by the recent drought conditions. However, state and federal agencies anticipate that drought will lead to further declines in the ocean fisheries next year.37
34 According to US Bureau of Economic Analysis data, the forestry and fishery sectors combined contributed 0.4% of state GDP in 2013. IMPLAN data for 2013 report commercial fishing contributing 0.01% of statewide value added (a similar measure to GDP), versus 0.2% for forestry. Annual average employment in fishing from California Regional Economies Employment data in 2013 was 419. The number was substantially higher in IMPLAN data, which includes seasonal jobs: 4,195, or 0.2% of the total (IMPLAN’s total employment for 2013 is roughly 21.4 million, higher than the roughly 15.5 million recorded by the California Regional Economies Employment database of the California Employment Development Department). 35 DFW, Sport Fishing Licenses by Year, accessed June 23, 2015 36 A. Kinney, “Bay Area commercial salmon fishing season begins,” San Jose Mercury News, April 30, 2014. 37 “Fisheries Agencies Report Positive Outlook for 2015 Ocean Salmon Fishing Season.” California Department of Fish and Wildlife News. February 26, 2015.
50,000
55,000
60,000
65,000
70,000
75,000
80,000
85,000
90,000
95,000
100,000
2000 2001 2002 2003 2004 2005 2006 2007 2008 2009 2010 2011 2012 2013
Empl
oyee
s
Average Annual Landscaping Employment
PPIC.ORG Technical Appendix What If California’s Drought Continues? 19
FIGURE A8 Commercial salmon fishing has been slow to rebound from the collapse of the fishery in 2006
SOURCE: Pacific Fishery Management Council. Review of 2014 Ocean Salmon Fisheries: Stock Assessment and Fishery Evaluation Document for the Pacific Coast Salmon Fishery Management Plan. Februrary 2015. Appendix D-7 California salmon troll boat-size catch statistics in pounds of dressed salmon.
Other Water-based Recreation
Activities like skiing, rafting, and boating on inland reservoirs are also directly dependent on precipitation and surface water supplies, and they have taken a hit during this drought.38 These are relatively small sectors relative to the state’s economy. For instance, recreational skiing facilities in California employed on average 4,176 workers in 2013 or 0.03% of total average annual employment. 39 However, like fishing, these sectors can be important sources of revenue and employment in some rural communities, especially when associated spending on food, lodging, and other retail purchases is taken into account.
Forestry
The forestry and logging sector employed an average of 4,260 people in 2013 (0.03% of all industry employment in California), down from an average of 6,837 in 1990.40 The total timber harvest has been declining as well—from 4,021 million board feet in 1994 to 1,466 million board feet in 2014.41 To date, there are no measureable impacts of the drought on timber harvesting,42 although some harvest plans may have been delayed due to risk of wildfire. As a result of a continued drought, and an increased risk of large wildfires, some companies with very large holdings across the state could be at risk. The economic impacts of fires for this sector will depend upon post-fire salvage logging policies of the state and federal governments.
38 See the following news stories: “Historic California Drought Forces Ski Resorts to Close Early.” Accuweather.com News. April 3, 2015; “Up a Creek? What California’s Drought Means for River Sports.” Outside Magazine Online. May 12, 2015; “California’s Ongoing Drought Hits Water Recreation Businesses.” National Public Radio. April 3, 2015. “Folsom Lake Releases In Drought Mean Recreation Season Coming To An End.” CBS Sacramento, July 9, 2015. 39 California Regional Economies Employment dataset, California Employment Development Department. 40 California Regional Economies Employment dataset, California Employment Development Department. This category is defined as those who grow and harvest timber on a long production cycle (i.e., 10 years or more), so it excludes Christmas tree growing. Bureau of Labor Statistics, accessed on July 22, 2015. 41 State Board of Equalization, California Timber Harvest Statistics, accessed July 24, 2015. 42 For instance, timber harvest grew from 1,161 million board feet in 2010, to 1,645 million board feet in 2013, and decreased slightly to 1,466 million board feet in 2014. State Board of Equalization, California Timber Harvest Statistics, accessed July 24, 2015.
0.0
1.0
2.0
3.0
4.0
5.0
6.0
7.0
1991 1995 1999 2003 2007 2011
Mill
ions
of P
ound
s of
D
ress
ed S
alm
on L
ande
d
2014
PPIC.ORG Technical Appendix What If California’s Drought Continues? 20
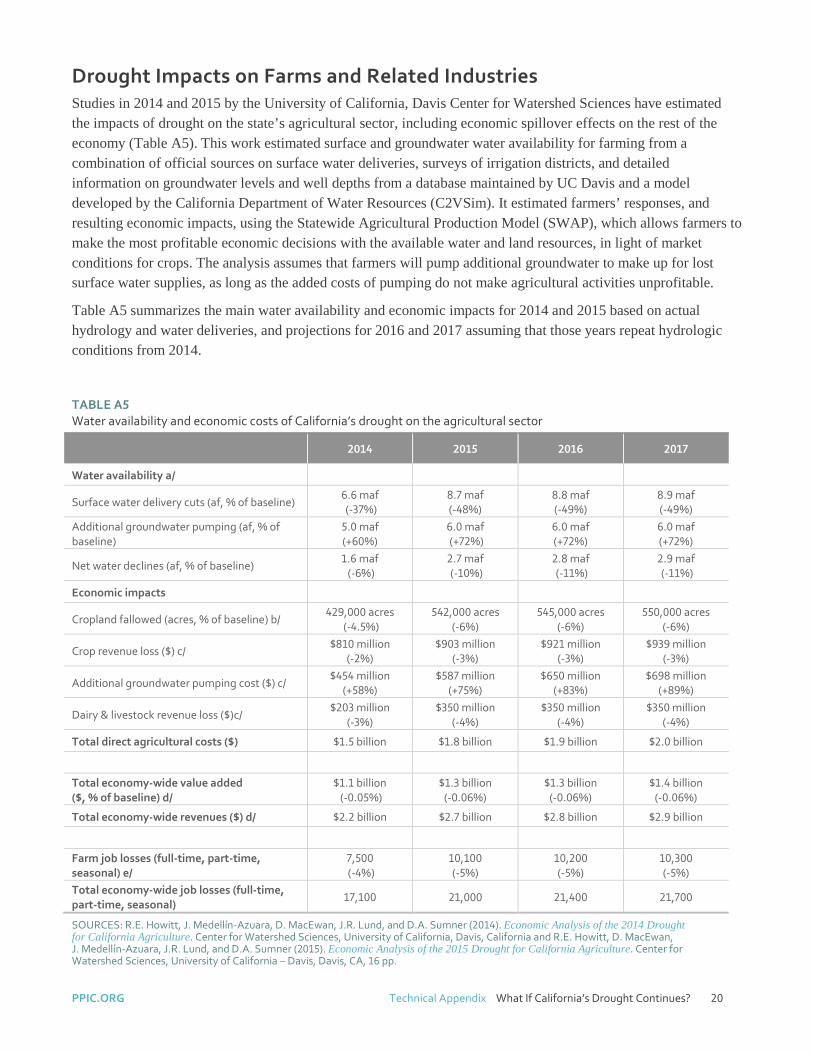
Drought Impacts on Farms and Related Industries Studies in 2014 and 2015 by the University of California, Davis Center for Watershed Sciences have estimated the impacts of drought on the state’s agricultural sector, including economic spillover effects on the rest of the economy (Table A5). This work estimated surface and groundwater water availability for farming from a combination of official sources on surface water deliveries, surveys of irrigation districts, and detailed information on groundwater levels and well depths from a database maintained by UC Davis and a model developed by the California Department of Water Resources (C2VSim). It estimated farmers’ responses, and resulting economic impacts, using the Statewide Agricultural Production Model (SWAP), which allows farmers to make the most profitable economic decisions with the available water and land resources, in light of market conditions for crops. The analysis assumes that farmers will pump additional groundwater to make up for lost surface water supplies, as long as the added costs of pumping do not make agricultural activities unprofitable.
Table A5 summarizes the main water availability and economic impacts for 2014 and 2015 based on actual hydrology and water deliveries, and projections for 2016 and 2017 assuming that those years repeat hydrologic conditions from 2014.
TABLE A5 Water availability and economic costs of California’s drought on the agricultural sector
2014 2015 2016 2017
Water availability a/
Surface water delivery cuts (af, % of baseline) 6.6 maf (-37%)
8.7 maf (-48%)
8.8 maf (-49%)
8.9 maf (-49%)
Additional groundwater pumping (af, % of baseline)
5.0 maf (+60%)
6.0 maf (+72%)
6.0 maf (+72%)
6.0 maf (+72%)
Net water declines (af, % of baseline) 1.6 maf (-6%)
2.7 maf (-10%)
2.8 maf (-11%)
2.9 maf (-11%)
Economic impacts
Cropland fallowed (acres, % of baseline) b/ 429,000 acres
(-4.5%) 542,000 acres
(-6%) 545,000 acres
(-6%) 550,000 acres
(-6%)
Crop revenue loss ($) c/ $810 million
(-2%) $903 million
(-3%) $921 million
(-3%) $939 million
(-3%)
Additional groundwater pumping cost ($) c/ $454 million
(+58%) $587 million
(+75%) $650 million
(+83%) $698 million
(+89%)
Dairy & livestock revenue loss ($)c/ $203 million
(-3%) $350 million
(-4%) $350 million
(-4%) $350 million
(-4%)
Total direct agricultural costs ($) $1.5 billion $1.8 billion $1.9 billion $2.0 billion
Total economy-wide value added ($, % of baseline) d/
$1.1 billion (-0.05%)
$1.3 billion (-0.06%)
$1.3 billion (-0.06%)
$1.4 billion (-0.06%)
Total economy-wide revenues ($) d/ $2.2 billion $2.7 billion $2.8 billion $2.9 billion
Farm job losses (full-time, part-time, seasonal) e/
7,500 (-4%)
10,100 (-5%)
10,200 (-5%)
10,300 (-5%)
Total economy-wide job losses (full-time, part-time, seasonal)
17,100 21,000 21,400 21,700
SOURCES: R.E. Howitt, J. Medellín-Azuara, D. MacEwan, J.R. Lund, and D.A. Sumner (2014). Economic Analysis of the 2014 Drought for California Agriculture. Center for Watershed Sciences, University of California, Davis, California and R.E. Howitt, D. MacEwan, J. Medellín-Azuara, J.R. Lund, and D.A. Sumner (2015). Economic Analysis of the 2015 Drought for California Agriculture. Center for Watershed Sciences, University of California – Davis, Davis, CA, 16 pp.
PPIC.ORG Technical Appendix What If California’s Drought Continues? 21
NOTES: The percentage of changes in water availability, crop fallowing, and economic indicators in the table provide an approximate indication of the scale of change, relative to baseline conditions in normal years.
a/ Water availability estimates for normal years are from the SWAP model baseline: 18 maf of surface water, 8.4 maf of groundwater, and 26.4 maf water use overall.
b/ The share of fallowing is estimated relative to an estimated 9.4 million acres of irrigated cropland (DWR statistics for 2010).
c/ Baseline crop revenues are estimated at $35 billion and dairy and livestock revenues at $12.4 billion. Baseline groundwater pumping costs are estimated at $780 million.
d/ Value added is a measure similar to gross domestic product, or GDP, i.e., the sum of labor income, business profits, and tax receipts . The percentage decline is in relation to California’s total value added, now approximately $2.2 billion. Economy-wide revenues is a measure of the total value of goods and services sold. It is larger than value added, which excludes the cost of non-labor inputs.
e/ Farm job losses are expressed as a share of 2013 direct farm employment in crop production of 200,000 in 2013 from the California Employment Development Department. Total average monthly employment in agriculture in that year (including direct employment in animal production and contract and support services for crop and animal production) was 412,000
Statewide, farmers fallowed approximately 5 percent of cropland in 2014—mostly more flexible and lower-revenue field crops like rice—and that share is likely to increase slightly in 2015. The costs of fallowing and extra groundwater pumping—including the spillover effects on the rest of the economy—were on the order of $2.2 billion in 2014, and $2.7 billion in 2015. Direct costs for farmers were 3 to 4 percent of the roughly $47 billion in annual farm revenues. For the statewide economy, this represents a decline of less than 0.1 percent of value added, or GDP.
Fallowing land also has both on- and off-farm effects on employment. Total farm employment has actually been increasing slightly despite the drought, because the higher-revenue crops farmers are focusing on generally employ more people than the lower-revenue field crops that farmers are scaling back.43 But with normal water supplies, California would have had an additional full-, part-time, or seasonal 7,500 farm jobs in 2014, and an additional 10,100 this year.44 When taking into account spillover effects on the rest of the economy, the potential added jobs economy-wide would have been 17,100 jobs in 2014; and 21,000 jobs this year.
If the drought continues into 2016 and 2017, with similar hydrologic conditions to 2014, farmers will likely continue to replace much of the lost surface water with additional groundwater pumping, but losses will be somewhat greater along all the dimensions reported here. By 2017, the costs of additional groundwater pumping will increase to $700 million (up 19% from 2015 levels), land fallowing will increase to 550,000 acres, statewide agricultural costs will rise to $2.0 billion, and direct farm employment will decline by 10,300 full-,part-time, and seasonal jobs.
Agriculture-related Industries
Table A5’s economy-wide measures capture economic spillovers of fallowing on closely related economic activities, including “upstream” activities such as bank lending and sales of farm inputs. For this study, we also spoke with representatives from the agricultural lending and food processing sectors to gauge their thinking about potential impacts of continued drought.
Nineteen banks in California have over 10 percent of their loan portfolio with agricultural clients, and the drought has made credit analysts increasingly vigilant in evaluating farmers’ credit worthiness as a function of future access to water. 45 Lenders we spoke with reported that the strong commodity prices for most California crops were bolstering the sector—and preventing loan defaults—despite higher costs associated with the drought.
43 J. Medellín-Azuara et al., “California Drought Killing Farm Jobs Even as They Grow.” Californiawaterblog.com, June 8, 2015. 44 The numbers reported here are from the IMPLAN model results, reported in Table A5. California Employment Development Department data on farm employment also suggest that 2014 levels were about 8,000 below trend growth. 45 K. Dobbs, SNL Financial “Could drought scorch California banks?” April 15, 2015.
PPIC.ORG Technical Appendix What If California’s Drought Continues? 22
However, lenders are taking more caution in extending short-term lending, requiring closer scrutiny of farmers’ water supply contingency plans. They are also shifting their approach regarding long-term loans in response to the enactment of the 2014 Sustainable Groundwater Management Act, by requiring farmers to demonstrate access to more than one water source. This should dampen the trend toward establishing new orchards on previously unirrigated lands, for which farmers have typically been relying solely on new wells. In this regard, the banking sector may be contributing to more sustainable basin management over the long term.
As noted above, California’s food and beverage processing sector makes up an equal or slightly larger share of economic activity than farming. Not all of this activity depends on California agriculture. For instance, soft drink and beer manufacturing is often located in the vicinity of end markets to reduce transportation costs. But activities like vegetable processing are tied to local output. Discussions with both lenders and food processing industry representatives suggest that the drought has had limited impact on this sector to date, beyond reducing sales of crops for which output has gone down, like rice. However, some processors have begun to express concerns about long-term water reliability for crops like tomatoes, which need to be grown near processing plants. High water prices—such as those some farmers are now facing on the water market, which can range from more than $500/acre-foot to sometimes even $1,000/acre-foot—can make California’s output of crops like these less competitive. However, industry representatives also noted the importance of other confounding factors such as exchange rates. The recent rise of the dollar will lower California’s (and other US states’) competitiveness for products like processed tomatoes in international markets.
Drought Impacts on Rural Communities Rural communities within farming regions are among the first impacted by agricultural employment losses associated with land fallowing, such as those reported above in Table A5. Declines in water-based recreation can also create disproportionate economic losses in some more rural parts of the state, especially in the foothill and mountainous areas.
Some rural communities are also disproportionately facing other problems related to the drought, most notably drinking water shortages in homes. In addition, these communities are often at higher risk of exposure to other public health issues that may be aggravated by drought, such as asthma and other chronic respiratory diseases.
Drinking Water Shortages Water supply problems are occurring both for small community water systems and for homes served by domestic wells. Here we provide available information on the extent of the problem to date in both categories.
Emergency Projects for Community Water Systems
State agencies have oversight responsibilities for community water systems, including quite small ones, and they began reporting—and attempting to mitigate—drought-related problems in early 2014.46 Small systems are more vulnerable than larger systems, because they tend to rely on a single source of water (often relatively shallow wells), and they have generally benefitted less from the wave of investments to improve drought resilience that have taken place over the past two decades by urban agencies, including interconnections among different water systems with different supply sources.
Table A6 shows a breakdown of community water systems facing emergency supply issues by region, based on information on projects tracked by the Water Board and some additional projects appearing in the California
46 J. Mount, “Size Matters in a Drought” (PPIC blog, Feb. 11, 2014) describes the initial reports about some small communities at risk of running out of water.
PPIC.ORG Technical Appendix What If California’s Drought Continues? 23
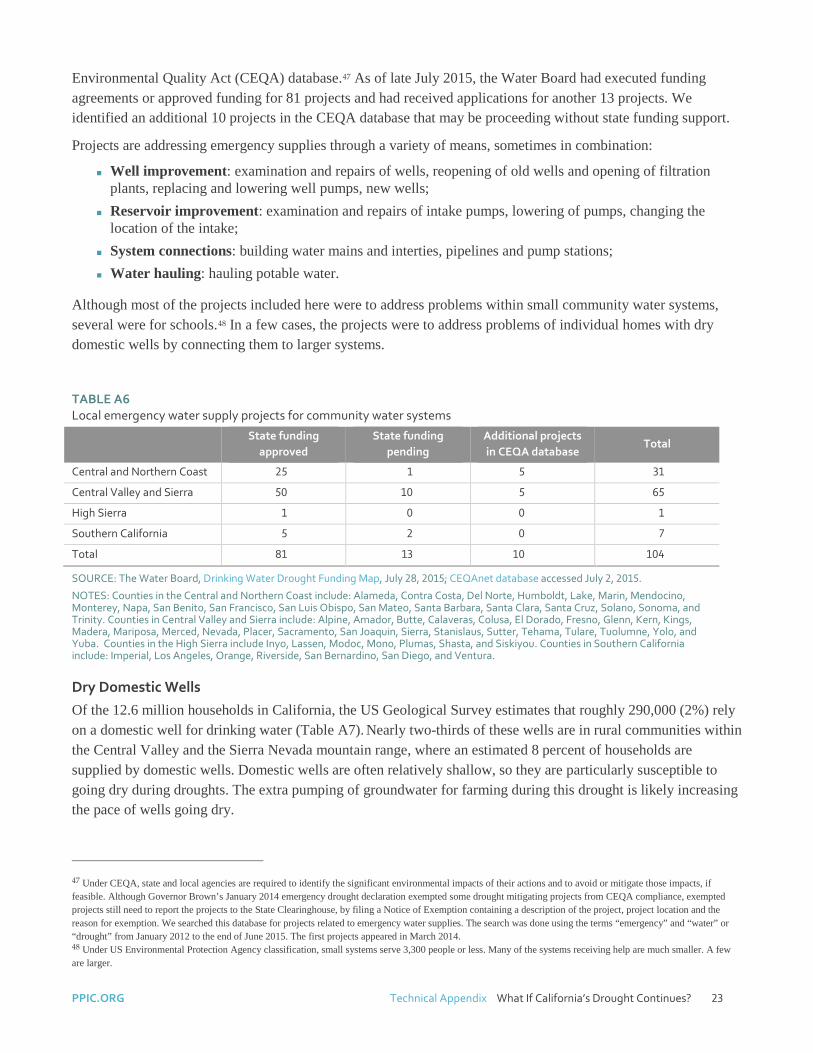
Environmental Quality Act (CEQA) database.47 As of late July 2015, the Water Board had executed funding agreements or approved funding for 81 projects and had received applications for another 13 projects. We identified an additional 10 projects in the CEQA database that may be proceeding without state funding support.
Projects are addressing emergency supplies through a variety of means, sometimes in combination:
Well improvement: examination and repairs of wells, reopening of old wells and opening of filtration plants, replacing and lowering well pumps, new wells;
Reservoir improvement: examination and repairs of intake pumps, lowering of pumps, changing the location of the intake;
System connections: building water mains and interties, pipelines and pump stations;
Water hauling: hauling potable water.
Although most of the projects included here were to address problems within small community water systems, several were for schools.48 In a few cases, the projects were to address problems of individual homes with dry domestic wells by connecting them to larger systems.
TABLE A6 Local emergency water supply projects for community water systems
State funding
approved State funding
pending Additional projects in CEQA database
Total
Central and Northern Coast 25 1 5 31
Central Valley and Sierra 50 10 5 65
High Sierra 1 0 0 1
Southern California 5 2 0 7
Total 81 13 10 104
SOURCE: The Water Board, Drinking Water Drought Funding Map, July 28, 2015; CEQAnet database accessed July 2, 2015.
NOTES: Counties in the Central and Northern Coast include: Alameda, Contra Costa, Del Norte, Humboldt, Lake, Marin, Mendocino, Monterey, Napa, San Benito, San Francisco, San Luis Obispo, San Mateo, Santa Barbara, Santa Clara, Santa Cruz, Solano, Sonoma, and Trinity. Counties in Central Valley and Sierra include: Alpine, Amador, Butte, Calaveras, Colusa, El Dorado, Fresno, Glenn, Kern, Kings, Madera, Mariposa, Merced, Nevada, Placer, Sacramento, San Joaquin, Sierra, Stanislaus, Sutter, Tehama, Tulare, Tuolumne, Yolo, and Yuba. Counties in the High Sierra include Inyo, Lassen, Modoc, Mono, Plumas, Shasta, and Siskiyou. Counties in Southern California include: Imperial, Los Angeles, Orange, Riverside, San Bernardino, San Diego, and Ventura.
Dry Domestic Wells
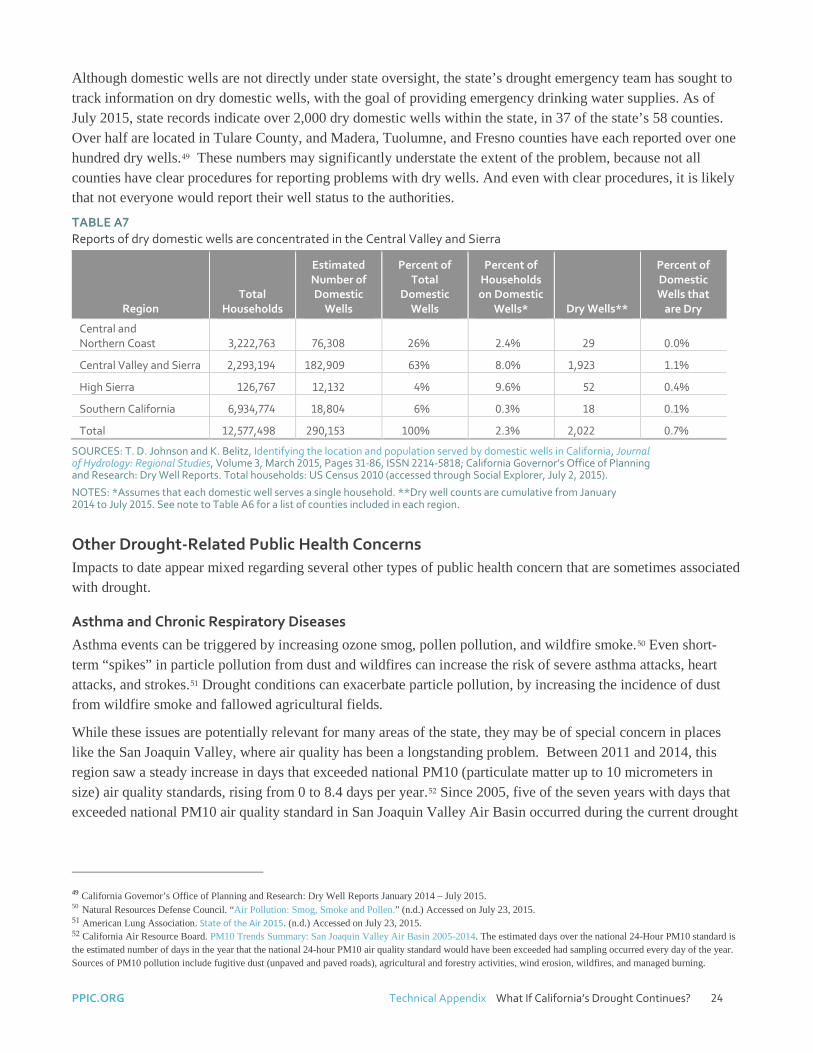
Of the 12.6 million households in California, the US Geological Survey estimates that roughly 290,000 (2%) rely on a domestic well for drinking water (Table A7). Nearly two-thirds of these wells are in rural communities within the Central Valley and the Sierra Nevada mountain range, where an estimated 8 percent of households are supplied by domestic wells. Domestic wells are often relatively shallow, so they are particularly susceptible to going dry during droughts. The extra pumping of groundwater for farming during this drought is likely increasing the pace of wells going dry.
47 Under CEQA, state and local agencies are required to identify the significant environmental impacts of their actions and to avoid or mitigate those impacts, if feasible. Although Governor Brown’s January 2014 emergency drought declaration exempted some drought mitigating projects from CEQA compliance, exempted projects still need to report the projects to the State Clearinghouse, by filing a Notice of Exemption containing a description of the project, project location and the reason for exemption. We searched this database for projects related to emergency water supplies. The search was done using the terms “emergency” and “water” or “drought” from January 2012 to the end of June 2015. The first projects appeared in March 2014. 48 Under US Environmental Protection Agency classification, small systems serve 3,300 people or less. Many of the systems receiving help are much smaller. A few are larger.
PPIC.ORG Technical Appendix What If California’s Drought Continues? 24
Although domestic wells are not directly under state oversight, the state’s drought emergency team has sought to track information on dry domestic wells, with the goal of providing emergency drinking water supplies. As of July 2015, state records indicate over 2,000 dry domestic wells within the state, in 37 of the state’s 58 counties. Over half are located in Tulare County, and Madera, Tuolumne, and Fresno counties have each reported over one hundred dry wells.49 These numbers may significantly understate the extent of the problem, because not all counties have clear procedures for reporting problems with dry wells. And even with clear procedures, it is likely that not everyone would report their well status to the authorities.
TABLE A7 Reports of dry domestic wells are concentrated in the Central Valley and Sierra
Region Total
Households
Estimated Number of Domestic
Wells
Percent of Total
Domestic Wells
Percent of Households on Domestic
Wells* Dry Wells**
Percent of Domestic Wells that
are Dry
Central and Northern Coast 3,222,763 76,308 26% 2.4% 29 0.0%
Central Valley and Sierra 2,293,194 182,909 63% 8.0% 1,923 1.1%
High Sierra 126,767 12,132 4% 9.6% 52 0.4%
Southern California 6,934,774 18,804 6% 0.3% 18 0.1%
Total 12,577,498 290,153 100% 2.3% 2,022 0.7%
SOURCES: T. D. Johnson and K. Belitz, Identifying the location and population served by domestic wells in California, Journal of Hydrology: Regional Studies, Volume 3, March 2015, Pages 31-86, ISSN 2214-5818; California Governor’s Office of Planning and Research: Dry Well Reports. Total households: US Census 2010 (accessed through Social Explorer, July 2, 2015).
NOTES: *Assumes that each domestic well serves a single household. **Dry well counts are cumulative from January 2014 to July 2015. See note to Table A6 for a list of counties included in each region.
Other Drought-Related Public Health Concerns Impacts to date appear mixed regarding several other types of public health concern that are sometimes associated with drought.
Asthma and Chronic Respiratory Diseases
Asthma events can be triggered by increasing ozone smog, pollen pollution, and wildfire smoke.50 Even short-term “spikes” in particle pollution from dust and wildfires can increase the risk of severe asthma attacks, heart attacks, and strokes.51 Drought conditions can exacerbate particle pollution, by increasing the incidence of dust from wildfire smoke and fallowed agricultural fields.
While these issues are potentially relevant for many areas of the state, they may be of special concern in places like the San Joaquin Valley, where air quality has been a longstanding problem. Between 2011 and 2014, this region saw a steady increase in days that exceeded national PM10 (particulate matter up to 10 micrometers in size) air quality standards, rising from 0 to 8.4 days per year.52 Since 2005, five of the seven years with days that exceeded national PM10 air quality standard in San Joaquin Valley Air Basin occurred during the current drought
49 California Governor’s Office of Planning and Research: Dry Well Reports January 2014 – July 2015. 50 Natural Resources Defense Council. “Air Pollution: Smog, Smoke and Pollen.” (n.d.) Accessed on July 23, 2015. 51 American Lung Association. State of the Air 2015. (n.d.) Accessed on July 23, 2015. 52 California Air Resource Board. PM10 Trends Summary: San Joaquin Valley Air Basin 2005-2014. The estimated days over the national 24-Hour PM10 standard is the estimated number of days in the year that the national 24-hour PM10 air quality standard would have been exceeded had sampling occurred every day of the year. Sources of PM10 pollution include fugitive dust (unpaved and paved roads), agricultural and forestry activities, wind erosion, wildfires, and managed burning.
PPIC.ORG Technical Appendix What If California’s Drought Continues? 25
or the last one (2007-09), though the problem then was less severe.53 Continued drought may see further deterioration in air quality as a result of additional wildfires and dust from agricultural land fallowing.
The California Department of Public Health (DPH) does not yet have evidence of whether these air quality incidents are increasing rates of morbidity or mortality. Rates of asthma-induced emergency department visits were increasing prior to this drought in several San Joaquin Valley counties, possibly related to changes in health insurance coverage as well as underlying changes in health conditions.54 But lag times in data reporting mean there is not enough information to discern the effect of current drought conditions.
West Nile Virus
West Nile Virus (WNV) is a disease that attacks the central nervous system, resulting in symptoms including high fever, disorientation, coma, and paralysis, and in a minority of cases, permanent nervous system damage or death.55 WNV is a reportable disease, meaning that health workers are required to report cases to authorities. The state also tracks the spread of the disease vector, which passes from birds to mosquitos to humans.
DPH recently announced that statewide levels of WNV activity are on the rise. Despite the lack of human cases of WNV this year so far, other indicators like WNV-positive dead birds and mosquito samples are pointing to increased WNV activity. The incidence of WNV in dead birds has increased nearly six-fold from 2010 levels, while in mosquito samples the incidence has increased over three-fold from 2009 levels.56 As of July 2015, 31 counties had reported WNV activity, 10 more than the same time last year and above the five-year average of 18.57 The reasons for the increase are uncertain. Suspected links to drought include increases in stagnant surface water in areas that normally have more flows, which may be creating more breeding opportunities for certain types of mosquitoes. Diminishing surface water sources also bring birds and mosquitoes into closer contact, which may accelerate the lifecycle of WNV.58
Valley Fever
Valley Fever (Coccidioidomycosis) is also a reportable disease. It is caused by a fungus in the soil of San Joaquin Valley and other parts of the southwest United States. When the fungus is inhaled, it can infect the lungs and cause flu-like symptoms or pneumonia.59 Newcomers to regions where the disease is found are more susceptible than longtime residents, many of whom develop immunity. Some observers have expressed concern that an increase in farmland fallowing could increase incidence of the disease during this drought, and one study from Arizona linked drought with a higher incidence of the disease.60 However, the drought so far does not appear to be an aggravating factor: cases of Valley Fever in California have actually declined between 2011 and 2014.61
53 The maximum number of annual air quality standard exceedance days during the 2007-09 period was just 4.8, roughly half the number of 2014. 54 DPH: Environmental Health Tracking Program. Asthma Data Query Tool: Emergency Department Visits (Age Adjusted Rate Per 10,000) 2005-2012. For more information about statewide trends in Emergency Department visits and hospitalizations, see S. McConville, “Emergency Room Use and the Affordable Care Act,” (PPIC blog, July 27, 2015). 55 California West Nile Virus Website, a collaboration of the DPH, UC Davis Center for Vectorborne Diseases, Mosquito and Vector Control Association of California and California Department of Food and Agriculture. 56 California Department of Public Health, UC Davis Center for Vectorborne Diseases, Mosquito and Vector Control Association of California, California Department of Food and Agriculture. westnile.ca.gov. West Nile Virus Activity by County 2007-2014. 57 DPH. “West Nile Virus Activity Increases throughout California.” July 8, 2015. 58 Center for Disease Control and Prevention, US Environmental Protection Agency, National Oceanic and Atmospheric Agency, and American Water Works Association. 2010. When every drop count: protection public health during drought condition—a guide for public health professionals. Atlanta: U.S. Department of Health and Human Services. 59 DPH. Coccidioidomycosis (Valley Fever). 60 B.J. Park et al., “An Epidemic of Coccidioidomycosis in Arizona Associated with Climatic Changes, 1998–2001,” Journal of Infectious Diseases, 2005, Vol. 191(11): 1981-1987. 61 DPH. Yearly Summaries of Selected General Communicable Diseases in California, 2011-14: Coccidioidomycosis.
PPIC.ORG Technical Appendix What If California’s Drought Continues? 26
Drought Impacts on the Environment The main report focuses on several areas where the drought is causing severe environmental stress: waterbirds of the Pacific Flyway, native fish populations, and forests. Drought-related impacts on other animal and plant species are also being observed. Here, we provide supporting information on several topics: species rescue and stressor monitoring programs by the DFW for fish and other species; native fish at high risk of extinction if the drought continues; and forestry conditions and wildfire risk.
Species Rescues and Stressor Monitoring The warm, dry conditions throughout the state have reduced the quality of habitat for many native animals. DFW has undertaken steps to mitigate these problems where possible, including through species rescues. DFW also has the responsibility to respond to human-animal encounters, which have increased during the drought as species such as bears moving into suburban areas looking for food.
Monitoring and Rescues for Fish, Amphibians, and Reptiles
Since 2013, rivers and streams throughout the state have been at record or near-record lows (Figure A4), with many waterways that would normally flow all year round becoming a series of disconnected pools or drying up. The warm temperatures of this drought have increased stress on various fishes, notably salmon and trout, as well as some amphibians and reptiles. DFW has been conducting rescue operations and drought stressor monitoring in parts of the state. As of this writing (July 2015), DFW had documented drought response rescues involving capture and temporary or permanent relocation of seven species of fish and one turtle. In many other locations, the department is monitoring drought stressors to assess the need for management activities, including rescues. Table A8 summarizes these actions, most of which occurred in 2014; with several exceptions, the reporting has not been updated for this year.
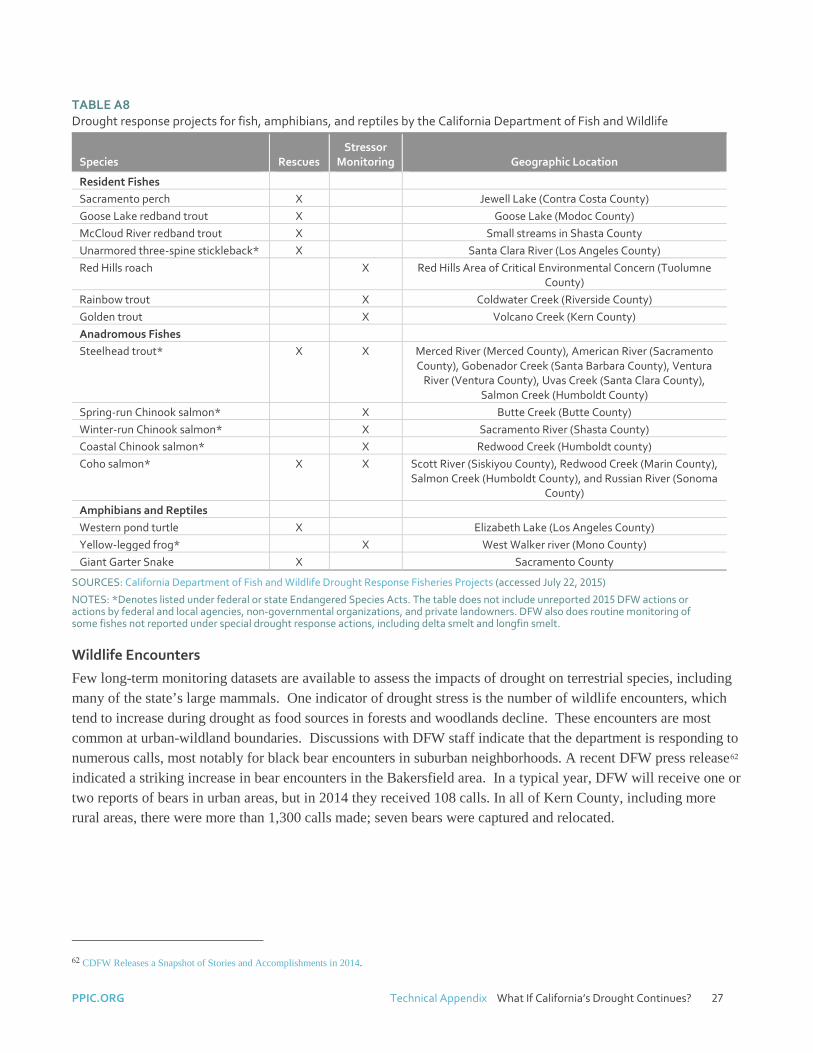
PPIC.ORG Technical Appendix What If California’s Drought Continues? 27
TABLE A8 Drought response projects for fish, amphibians, and reptiles by the California Department of Fish and Wildlife
Species Rescues Stressor
Monitoring Geographic Location
Resident Fishes Sacramento perch X Jewell Lake (Contra Costa County) Goose Lake redband trout X Goose Lake (Modoc County) McCloud River redband trout X Small streams in Shasta County Unarmored three-spine stickleback* X Santa Clara River (Los Angeles County) Red Hills roach X Red Hills Area of Critical Environmental Concern (Tuolumne
County) Rainbow trout X Coldwater Creek (Riverside County) Golden trout X Volcano Creek (Kern County) Anadromous Fishes Steelhead trout* X X Merced River (Merced County), American River (Sacramento
County), Gobenador Creek (Santa Barbara County), Ventura River (Ventura County), Uvas Creek (Santa Clara County),
Salmon Creek (Humboldt County) Spring-run Chinook salmon* X Butte Creek (Butte County) Winter-run Chinook salmon* X Sacramento River (Shasta County) Coastal Chinook salmon* X Redwood Creek (Humboldt county) Coho salmon* X X Scott River (Siskiyou County), Redwood Creek (Marin County),
Salmon Creek (Humboldt County), and Russian River (Sonoma County)
Amphibians and Reptiles Western pond turtle X Elizabeth Lake (Los Angeles County) Yellow-legged frog* X West Walker river (Mono County) Giant Garter Snake X Sacramento County
SOURCES: California Department of Fish and Wildlife Drought Response Fisheries Projects (accessed July 22, 2015)
NOTES: *Denotes listed under federal or state Endangered Species Acts. The table does not include unreported 2015 DFW actions or actions by federal and local agencies, non-governmental organizations, and private landowners. DFW also does routine monitoring of some fishes not reported under special drought response actions, including delta smelt and longfin smelt.
Wildlife Encounters
Few long-term monitoring datasets are available to assess the impacts of drought on terrestrial species, including many of the state’s large mammals. One indicator of drought stress is the number of wildlife encounters, which tend to increase during drought as food sources in forests and woodlands decline. These encounters are most common at urban-wildland boundaries. Discussions with DFW staff indicate that the department is responding to numerous calls, most notably for black bear encounters in suburban neighborhoods. A recent DFW press release62 indicated a striking increase in bear encounters in the Bakersfield area. In a typical year, DFW will receive one or two reports of bears in urban areas, but in 2014 they received 108 calls. In all of Kern County, including more rural areas, there were more than 1,300 calls made; seven bears were captured and relocated.
62 CDFW Releases a Snapshot of Stories and Accomplishments in 2014.
PPIC.ORG Technical Appendix What If California’s Drought Continues? 28
Extinction Risks for Native Fishes Recent work by Peter Moyle and colleagues (Moyle et al. 2013 and 2015)63 assessed the vulnerability of California’s native fishes to a changing climate through the end of the 21st century. In particular, Moyle et al. (2013) systematically evaluated the status of each species using 20 metrics. Using this database, we evaluated the potential for significant impacts on native fish species from continuing drought. Climate-related vulnerability factors included low flows and higher air and water temperatures—both characteristics of this drought. We therefore assumed that fish highly vulnerable to climate change would also be most vulnerable to changes caused by continuing drought. After making this initial cut, we looked at vulnerability in the wild to drought based on: species condition accounts in Moyle et al. (2008)64 and Moyle et al. (2015); field studies conducted by the Moyle laboratory during the summer of 2014 throughout northern California; DFW website reports on their drought actions; consultations with experts on local fishes; and recent news reports.
We used this information to identify 18 species with a high risk of extinction in the wild from two or more years of continued drought (Table A9). We simplified the impacts of a continued drought into five main categories: (1) loss of rearing habitat due to reduced flows, (2) loss of spawning habitat due to reduced flows, (3) increased water temperatures, (4) increased stress from invasive species (a problem for some resident fishes), and (5) increased negative influence on wild populations from hatchery populations (a problem for some runs of salmon).
The last two categories are aggravating factors, above and beyond the direct effects on fish habitat of low flows and high temperatures. The drought is also favoring conditions for invasive fish and other species that either compete with or prey on natives. Non-native plants, zooplankton and insects also reduce the quality of habitat during drought. And for some salmon runs, the release of large numbers of hatchery-bred fishes just prior to or during droughts can harm drought-stressed wild fish through competition, predation, or interbreeding that reduces the fitness of their offspring.
Table A9 also indicates whether these fish have captive populations or populations established outside their native range. Although this would not affect the probability of extinction in the wild within the fishes’ native range, it could reduce the threat of extinction as a species. This information is relevant in considering emergency measures and management actions. For instance, the use of conservation hatcheries to preserve biodiversity will be more difficult for fish at high risk of extinction that do not already have captive populations or populations that live outside of their native range.
Finally, Table A9 lists management actions that could reduce the likelihood of extinction if the drought continues. Depending on the species, actions range from the restoration of habitat and reduction of water diversions to the creation of conservation facilities to breed captive populations, should the species go extinct in the wild.
A key action for all of these species is monitoring. Every species on this list and its critical habitat should be monitored, preferably on a monthly basis, as long as the drought persists. If a population is close to being lost, emergency rescue plans and operations should be implemented (see the above discussion on rescue operations in 2014). The ability to rely on a conservation facility to maintain populations in an emergency situation will vary greatly among these species. Some species are already kept in captivity with the goal of preventing extinction (such as delta smelt, Central Coast coho salmon, McCloud River redband trout, and Central Valley winter-run Chinook salmon). Others have populations in hatcheries not oriented toward conservation of biodiversity (such as
63 Moyle, P.B., J. D. Kiernan, P. K. Crain, and R. M. Quiñones. 2013. Climate change vulnerability of native and alien freshwater fishes of California: a systematic assessment approach. PLoS One. Moyle, P.B., R. M. Quinones, J.V.E. Katz, and Jeff Weaver. 2015 (in press). Fish Species of Special Concern in California. Sacramento: DFW. 64 Moyle, P.B., J.A. Israel, and S. E. Purdy. 2008. Salmon, steelhead, and trout in California: status of an emblematic fauna. UC Davis Center for Watershed Sciences. 316 pp.
PPIC.ORG Technical Appendix What If California’s Drought Continues? 29
the Southern Oregon Northern California Coast coho salmon) and will require a change in production hatchery practices (which support fisheries) to those of a conservation hatchery, in order to avoid extinction. Finally, many species have no captive breeding programs at all and will require the development of facilities in order to maintain populations.
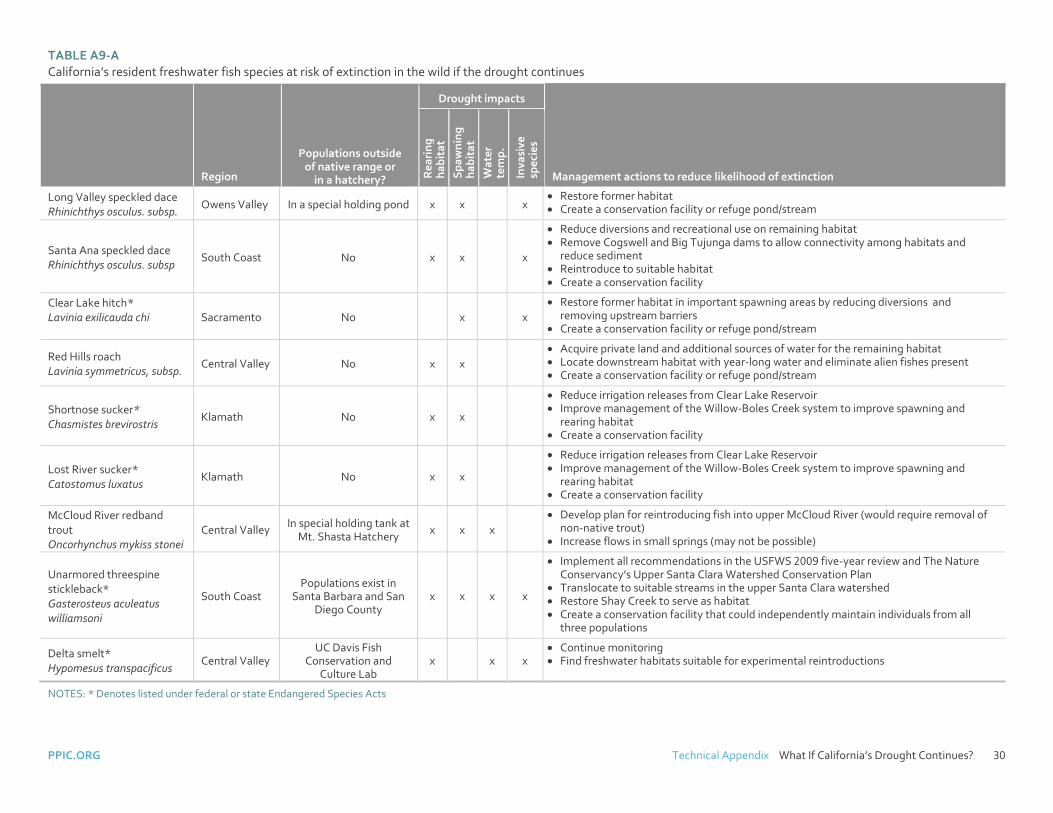
PPIC.ORG Technical Appendix What If California’s Drought Continues? 30
TABLE A9-A California’s resident freshwater fish species at risk of extinction in the wild if the drought continues
Region
Populations outside of native range or
in a hatchery?
Drought impacts
Management actions to reduce likelihood of extinction Rea
ring
ha
bita
t Sp
awni
ng
habi
tat
Wat
er
tem
p.
Inva
sive
sp
ecie
s
Long Valley speckled dace Rhinichthys osculus. subsp.
Owens Valley In a special holding pond x x x • Restore former habitat • Create a conservation facility or refuge pond/stream
Santa Ana speckled dace Rhinichthys osculus. subsp
South Coast No x x x
• Reduce diversions and recreational use on remaining habitat • Remove Cogswell and Big Tujunga dams to allow connectivity among habitats and
reduce sediment • Reintroduce to suitable habitat • Create a conservation facility
Clear Lake hitch* Lavinia exilicauda chi
Sacramento No x x • Restore former habitat in important spawning areas by reducing diversions and
removing upstream barriers • Create a conservation facility or refuge pond/stream
Red Hills roach Lavinia symmetricus, subsp.
Central Valley No x x • Acquire private land and additional sources of water for the remaining habitat • Locate downstream habitat with year-long water and eliminate alien fishes present • Create a conservation facility or refuge pond/stream
Shortnose sucker* Chasmistes brevirostris
Klamath No x x
• Reduce irrigation releases from Clear Lake Reservoir • Improve management of the Willow-Boles Creek system to improve spawning and
rearing habitat • Create a conservation facility
Lost River sucker* Catostomus luxatus
Klamath No x x
• Reduce irrigation releases from Clear Lake Reservoir • Improve management of the Willow-Boles Creek system to improve spawning and
rearing habitat • Create a conservation facility
McCloud River redband trout Oncorhynchus mykiss stonei
Central Valley In special holding tank at Mt. Shasta Hatchery x x x
• Develop plan for reintroducing fish into upper McCloud River (would require removal of non-native trout)
• Increase flows in small springs (may not be possible)
Unarmored threespine stickleback* Gasterosteus aculeatus williamsoni
South Coast Populations exist in
Santa Barbara and San Diego County
x x x x
• Implement all recommendations in the USFWS 2009 five-year review and The Nature Conservancy’s Upper Santa Clara Watershed Conservation Plan
• Translocate to suitable streams in the upper Santa Clara watershed • Restore Shay Creek to serve as habitat • Create a conservation facility that could independently maintain individuals from all
three populations
Delta smelt* Hypomesus transpacificus
Central Valley UC Davis Fish
Conservation and Culture Lab
x x x • Continue monitoring • Find freshwater habitats suitable for experimental reintroductions
NOTES: * Denotes listed under federal or state Endangered Species Acts
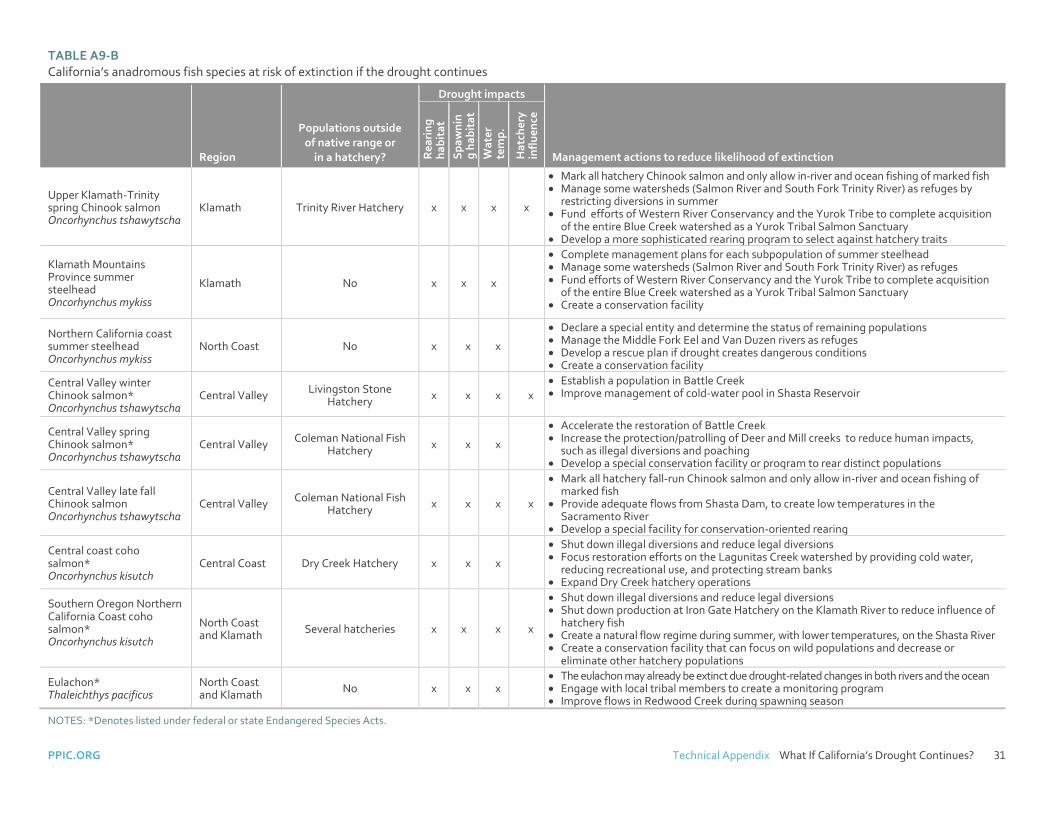
PPIC.ORG Technical Appendix What If California’s Drought Continues? 31
TABLE A9-B California’s anadromous fish species at risk of extinction if the drought continues
Region
Populations outside of native range or
in a hatchery?
Drought impacts
Management actions to reduce likelihood of extinction Rea
ring
ha
bita
t Sp
awni
ng
habi
tat
Wat
er
tem
p.
Hat
cher
y in
fluen
ce
Upper Klamath-Trinity spring Chinook salmon Oncorhynchus tshawytscha
Klamath Trinity River Hatchery x x x x
• Mark all hatchery Chinook salmon and only allow in-river and ocean fishing of marked fish • Manage some watersheds (Salmon River and South Fork Trinity River) as refuges by
restricting diversions in summer • Fund efforts of Western River Conservancy and the Yurok Tribe to complete acquisition
of the entire Blue Creek watershed as a Yurok Tribal Salmon Sanctuary • Develop a more sophisticated rearing program to select against hatchery traits
Klamath Mountains Province summer steelhead Oncorhynchus mykiss
Klamath No x x x
• Complete management plans for each subpopulation of summer steelhead • Manage some watersheds (Salmon River and South Fork Trinity River) as refuges • Fund efforts of Western River Conservancy and the Yurok Tribe to complete acquisition
of the entire Blue Creek watershed as a Yurok Tribal Salmon Sanctuary • Create a conservation facility
Northern California coast summer steelhead Oncorhynchus mykiss
North Coast No x x x
• Declare a special entity and determine the status of remaining populations • Manage the Middle Fork Eel and Van Duzen rivers as refuges • Develop a rescue plan if drought creates dangerous conditions • Create a conservation facility
Central Valley winter Chinook salmon* Oncorhynchus tshawytscha
Central Valley Livingston Stone Hatchery x x x x
• Establish a population in Battle Creek • Improve management of cold-water pool in Shasta Reservoir
Central Valley spring Chinook salmon* Oncorhynchus tshawytscha
Central Valley Coleman National Fish Hatchery x x x
• Accelerate the restoration of Battle Creek • Increase the protection/patrolling of Deer and Mill creeks to reduce human impacts,
such as illegal diversions and poaching • Develop a special conservation facility or program to rear distinct populations
Central Valley late fall Chinook salmon Oncorhynchus tshawytscha
Central Valley Coleman National Fish Hatchery x x x x
• Mark all hatchery fall-run Chinook salmon and only allow in-river and ocean fishing of marked fish
• Provide adequate flows from Shasta Dam, to create low temperatures in the Sacramento River
• Develop a special facility for conservation-oriented rearing
Central coast coho salmon* Oncorhynchus kisutch
Central Coast Dry Creek Hatchery x x x
• Shut down illegal diversions and reduce legal diversions • Focus restoration efforts on the Lagunitas Creek watershed by providing cold water,
reducing recreational use, and protecting stream banks • Expand Dry Creek hatchery operations
Southern Oregon Northern California Coast coho salmon* Oncorhynchus kisutch
North Coast and Klamath Several hatcheries x x x x
• Shut down illegal diversions and reduce legal diversions • Shut down production at Iron Gate Hatchery on the Klamath River to reduce influence of
hatchery fish • Create a natural flow regime during summer, with lower temperatures, on the Shasta River • Create a conservation facility that can focus on wild populations and decrease or
eliminate other hatchery populations
Eulachon* Thaleichthys pacificus
North Coast and Klamath No x x x
• The eulachon may already be extinct due drought-related changes in both rivers and the ocean • Engage with local tribal members to create a monitoring program • Improve flows in Redwood Creek during spawning season
NOTES: *Denotes listed under federal or state Endangered Species Acts.
PPIC.ORG Technical Appendix What If California’s Drought Continues? 32
Forest Mortality and Wildfires The drought is increasing forest mortality. Coupled with long-term forest management practices that have led to increases in forest density, this is increasing the risk of severe wildfires.
Forest Mortality
To determine forest health, the US Forest Service (USFS) completes an annual aerial detection survey of around 45 million acres of public and private lands in California, including all 32 million acres of California’s forests and woodlands.65 Between 2013 and 2014, acres with elevated forest mortality (at least one dead tree per acre) nearly doubled, from 483,000 to 909,000.66 By the end of 2014, nearly 3 percent of California’s forests exhibited elevated mortality.67
Special aerial detection surveys completed in April and June 2015 provide an early indication that 2015 elevated mortality levels will substantially exceed 2014 levels.68 Surveys in southern California, the southern Sierra Nevada range, and the greater San Francisco Bay Area (covering only 29% of the typical statewide survey area) measured over 1 million acres of elevated forest mortality—12 percent of the surveyed area.69 A clearer picture of the total increase in acres with elevated mortality will emerge when USFS completes their 2015 aerial detection survey this fall.
Wildfires
The elevated mortality levels in California forests—in conjunction with management practices that have increased forest density—have increased fuel loads. High fuel loads make wildfires more powerful and difficult to contain. Although the total number of wildfires in California decreased over the past 28 years (Figure A9), the severity of damage from large fires is increasing. For instance, in terms of acres burned, the 2007-09 drought included five of the 20 most destructive wildfires in recorded California history. Three fires on this top-20 list, including two of the top three, occurred since the onset of the current drought in 2012.70
65 US Forest Service. Aerial Detection Monitoring Program. Total forest acreage (31,620,000) includes all hardwood and conifer forest and woodland in the state. California Department of Forestry and Fire Protection, Fire Resource Assessment Program: 2010 Assessment. 66 US Forest Service. Aerial Detection Monitoring Program. 2006-2014 Aerial Survey Results: California. 67 Figure estimated by calculating the percentage of total forest acres that exhibited elevated mortality in 2014.Total forest acres (31,620,000) estimate is from California Department of Forestry and Fire Protection: Fire and Resource Assessment Program, 2010 Assessment. Elevated mortality acres (909,000) estimate is from USFS Aerial Detection Monitoring Program Survey Results. 68 Conversation with Jeffrey Moore, USFS Forest Health Monitoring Program, July 3, 2015. 69 US Forest Service. Aerial Detection Monitoring Program. 2015 Aerial Survey Results: California. 70 This includes the Rush Fire (Lassen, August 2012) and the Rim Fire (Tuolumne, August 2013), and the Happy Camp Complex Fire (Siskiyou, August 2014). California Department of Forestry and Fire Protection. Top 20 Largest California Wildfires.
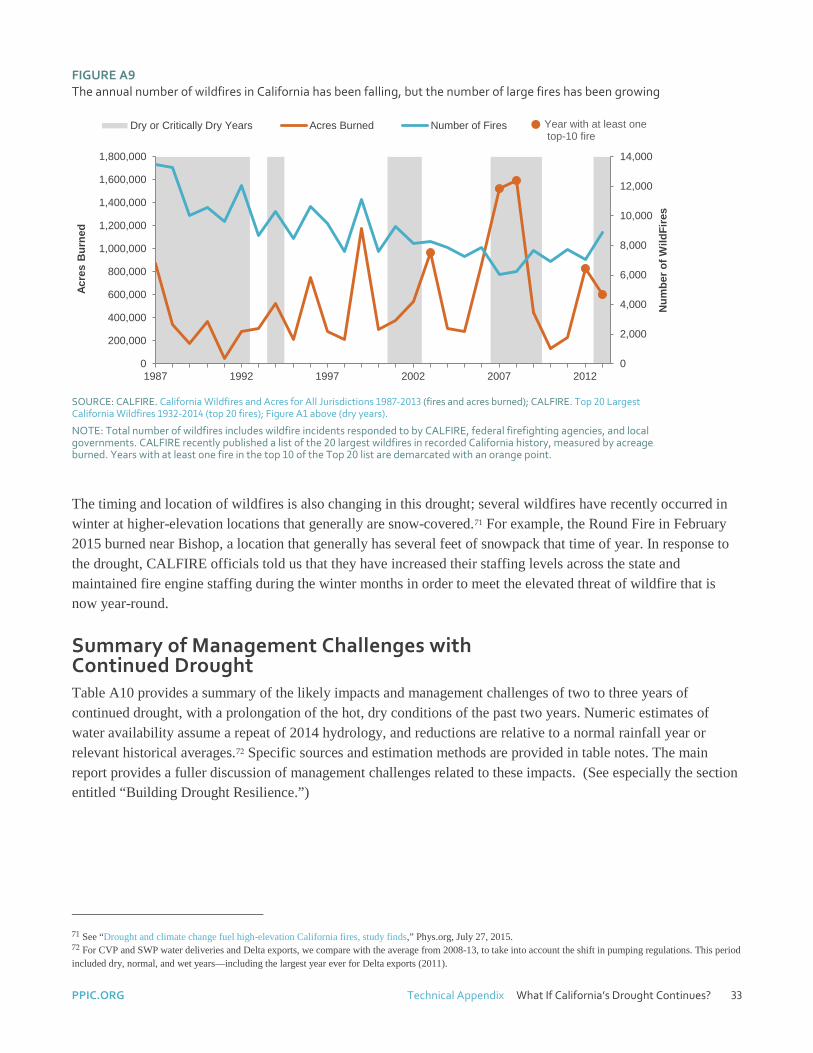
PPIC.ORG Technical Appendix What If California’s Drought Continues? 33
FIGURE A9 The annual number of wildfires in California has been falling, but the number of large fires has been growing
SOURCE: CALFIRE. California Wildfires and Acres for All Jurisdictions 1987-2013 (fires and acres burned); CALFIRE. Top 20 Largest California Wildfires 1932-2014 (top 20 fires); Figure A1 above (dry years).
NOTE: Total number of wildfires includes wildfire incidents responded to by CALFIRE, federal firefighting agencies, and local governments. CALFIRE recently published a list of the 20 largest wildfires in recorded California history, measured by acreage burned. Years with at least one fire in the top 10 of the Top 20 list are demarcated with an orange point.
The timing and location of wildfires is also changing in this drought; several wildfires have recently occurred in winter at higher-elevation locations that generally are snow-covered.71 For example, the Round Fire in February 2015 burned near Bishop, a location that generally has several feet of snowpack that time of year. In response to the drought, CALFIRE officials told us that they have increased their staffing levels across the state and maintained fire engine staffing during the winter months in order to meet the elevated threat of wildfire that is now year-round.
Summary of Management Challenges with Continued Drought Table A10 provides a summary of the likely impacts and management challenges of two to three years of continued drought, with a prolongation of the hot, dry conditions of the past two years. Numeric estimates of water availability assume a repeat of 2014 hydrology, and reductions are relative to a normal rainfall year or relevant historical averages.72 Specific sources and estimation methods are provided in table notes. The main report provides a fuller discussion of management challenges related to these impacts. (See especially the section entitled “Building Drought Resilience.”)
71 See “Drought and climate change fuel high-elevation California fires, study finds,” Phys.org, July 27, 2015. 72 For CVP and SWP water deliveries and Delta exports, we compare with the average from 2008-13, to take into account the shift in pumping regulations. This period included dry, normal, and wet years—including the largest year ever for Delta exports (2011).
0
2,000
4,000
6,000
8,000
10,000
12,000
14,000
0
200,000
400,000
600,000
800,000
1,000,000
1,200,000
1,400,000
1,600,000
1,800,000
1987 1992 1997 2002 2007 2012
Num
ber o
f Wild
Fire
s
Acre
s B
urne
d
Dry or Critically Dry Years Acres Burned Number of Fires Year with at least one top-10 fire
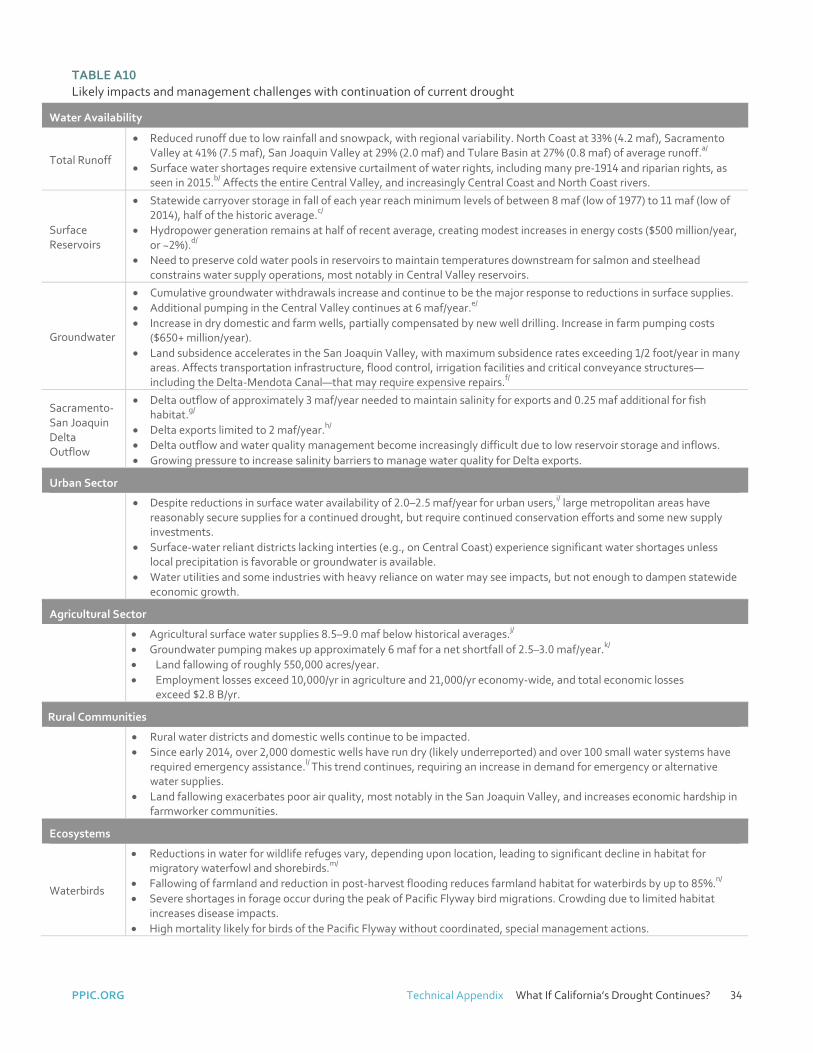
PPIC.ORG Technical Appendix What If California’s Drought Continues? 34
TABLE A10 Likely impacts and management challenges with continuation of current drought
Water Availability
Total Runoff
• Reduced runoff due to low rainfall and snowpack, with regional variability. North Coast at 33% (4.2 maf), Sacramento Valley at 41% (7.5 maf), San Joaquin Valley at 29% (2.0 maf) and Tulare Basin at 27% (0.8 maf) of average runoff.a/
• Surface water shortages require extensive curtailment of water rights, including many pre-1914 and riparian rights, as seen in 2015.b/ Affects the entire Central Valley, and increasingly Central Coast and North Coast rivers.
Surface Reservoirs
• Statewide carryover storage in fall of each year reach minimum levels of between 8 maf (low of 1977) to 11 maf (low of 2014), half of the historic average.c/
• Hydropower generation remains at half of recent average, creating modest increases in energy costs ($500 million/year, or ~2%).d/
• Need to preserve cold water pools in reservoirs to maintain temperatures downstream for salmon and steelhead constrains water supply operations, most notably in Central Valley reservoirs.
Groundwater
• Cumulative groundwater withdrawals increase and continue to be the major response to reductions in surface supplies. • Additional pumping in the Central Valley continues at 6 maf/year.e/ • Increase in dry domestic and farm wells, partially compensated by new well drilling. Increase in farm pumping costs
($650+ million/year). • Land subsidence accelerates in the San Joaquin Valley, with maximum subsidence rates exceeding 1/2 foot/year in many
areas. Affects transportation infrastructure, flood control, irrigation facilities and critical conveyance structures—including the Delta-Mendota Canal—that may require expensive repairs.f/
Sacramento-San Joaquin Delta Outflow
• Delta outflow of approximately 3 maf/year needed to maintain salinity for exports and 0.25 maf additional for fish habitat.g/
• Delta exports limited to 2 maf/year.h/ • Delta outflow and water quality management become increasingly difficult due to low reservoir storage and inflows. • Growing pressure to increase salinity barriers to manage water quality for Delta exports.
Urban Sector
• Despite reductions in surface water availability of 2.0–2.5 maf/year for urban users,i/ large metropolitan areas have reasonably secure supplies for a continued drought, but require continued conservation efforts and some new supply investments.
• Surface-water reliant districts lacking interties (e.g., on Central Coast) experience significant water shortages unless local precipitation is favorable or groundwater is available.
• Water utilities and some industries with heavy reliance on water may see impacts, but not enough to dampen statewide economic growth.
Agricultural Sector
• Agricultural surface water supplies 8.5–9.0 maf below historical averages.j/ • Groundwater pumping makes up approximately 6 maf for a net shortfall of 2.5–3.0 maf/year.k/ • Land fallowing of roughly 550,000 acres/year. • Employment losses exceed 10,000/yr in agriculture and 21,000/yr economy-wide, and total economic losses
exceed $2.8 B/yr.
Rural Communities
• Rural water districts and domestic wells continue to be impacted. • Since early 2014, over 2,000 domestic wells have run dry (likely underreported) and over 100 small water systems have
required emergency assistance.l/ This trend continues, requiring an increase in demand for emergency or alternative water supplies.
• Land fallowing exacerbates poor air quality, most notably in the San Joaquin Valley, and increases economic hardship in farmworker communities.
Ecosystems
Waterbirds
• Reductions in water for wildlife refuges vary, depending upon location, leading to significant decline in habitat for migratory waterfowl and shorebirds.m/
• Fallowing of farmland and reduction in post-harvest flooding reduces farmland habitat for waterbirds by up to 85%.n/ • Severe shortages in forage occur during the peak of Pacific Flyway bird migrations. Crowding due to limited habitat
increases disease impacts. • High mortality likely for birds of the Pacific Flyway without coordinated, special management actions.
PPIC.ORG Technical Appendix What If California’s Drought Continues? 35
TABLE A10 , CONTINUED
Native Fishes
• Low flows and high air temperatures lead to widespread increase in water temperatures, decreases in dissolved oxygenand high levels of nutrients, pathogens, toxic algae, and contaminants in some waterbodies.
• Potential for extinction of as many as 18 fish species, including delta smelt, most salmon runs, and several species oftrout, from low flows, high water temperatures.o/
• Comprehensive set of actions, including reservoir reoperation, rescues, and conservation hatcheries, needed to prevent extinctions and to recover fish populations at the end of the drought.
• Economic losses for commercial and recreational fisheries.
Wildfires
• High tree mortality due to disease and drought stress.• Tree mortality and forest density due to historic management practices lead to extreme wildfire hazard.• One or more severe wildfires (comparable to the 2013 Rim Fire) occur in the Sierra Nevada and mountains of Southern
California.p/
• Near-term negative impacts on air and water quality; long-term harm to wildlife and forest recovery.
SOURCES and NOTES:
(a) Percentages are relative to 50-year averages (1961-2010). Volume is assumed to be the same as total runoff for 2014 water year, using data from California Department of Water Resources Unimpaired Flow reports. (b) See summary of surface water curtailments by State Water Resources Control Board. (c) Estimate based on a statewide summary by the California Department of Water Resources. See Figure 2 in main report for recent and 1977 reservoir levels. The average for each reservoir in the dataset is based on entire historical record since the reservoir began operating. Four reservoirs—New Melones, Spicer Meadows, Warm Springs and Los Vaqueros—have been added since 1977. (d) See discussion of electricity sector above, including Figure A6. (e) See discussion of agricultural impacts above, including Table A5. (f) For a general overview, see California Department of Water Resources, 2014, Summary of Recent, Historical, and Estimated Potential for Future Land Subsidence in California. During the drought of the late 2000s, the US Geological Survey found land sinking, or subsidence, rates ranging from 1 to 21 inches over a three-year period. These rates are likely to be accelerating with the pumping now occurring.(Sneed et al., Land Subsidence along the Delta-Mendota Canal in the Northern Part of the San Joaquin Valley, California, 2003-2010: US Geological Survey Scientific Investigations Report 2013-5142.) For a discussion of impacts to Sack Dam, where continued subsidence will cost local farmers $10 million to move water, see California Farmers Dig Deeper for Water, Sipping their Neighbors Dry. Subsidence-related damage to a bridge over a canal in Fresno County will cost $2.5 million to repair. Groundwater Pumping Causing Central Valley Bridges to Sink. As of this writing, no cost estimates have been reported for subsidence-related repairs for either the Delta Mendota Canal or the California Aqueduct. (g) Based on Water Board staff estimates of 2014 outflow at May 20, 2015 public workshop presentation by S. Ligare. (h) During the period 2008-2013 exports from the Delta averaged 4.7 maf/year (based on DWR DAYFLOW records). (i) Estimate based on difference between surface water deliveries in the period 2008-13 and 2015. This includes reductions in deliveries from CVP and SWP to urban contractors, declines in availability for SFPUC and EBMUD, and decline in Los Angeles Aqueduct supplies. This assumes that CVP allocations remain at 25 percent for urban contractors, as compared to 86 percent from 2008-2013, and SWP contract deliveries range between 5 and 20 percent, as compared to 50 percent for 2008-13. (j) See Table A5 and related discussion. (k) Based on 2015 allocations, CVP settlement and exchange contractors will receive 55-75 percent of their contract allotments, while SWP Feather River Settlement Agreement Holders will receive 50 percent. In 2008-13 all groups received close to 100 percent. CVP agricultural contractors will receive zero percent of their allocation, while SWP contractors will receive between 5 and 20 percent. During 2008-13 CVP and SWP agricultural contractors averaged 50 percent. (l) See Tables A6 and A7 and related discussion. (m) Based on 2015, CVP allocations for wildlife refuges will be 75 percent or less, with significant reductions south of the Delta. During 2008-13 allocations were 100 percent. There will be significant reductions in water available for private wetlands as well. (n) Unpublished simulations and estimates prepared by Central Valley Joint Venture (J. Ziegler, personal communication, July 2015) (o) See Table A9 and related discussion. (p) See Figure A9 and related discussion.
The Public Policy Institute of California is dedicated to informing and improving public policy in California through independent, objective, nonpartisan research.
Public Policy Institute of California 500 Washington Street, Suite 600 San Francisco, CA 94111 T: 415.291.4400 F: 415.291.4401 PPIC.ORG/WATER
PPIC Sacramento Center Senator Office Building 1121 L Street, Suite 801 Sacramento, CA 95814 T: 916.440.1120 F: 916.440.1121
Recommended