Global Education Dialogues The Power of Consortia: how can universities solve the global grand research challenges?
British Council in partnership with the Republic of Indonesia Department for Higher Education (Dikti) and the Vice Rector Forum for International Collaboration
20-21 November 2014, JW Marriott Hotel, Medan, North Sumatra
Syahrul [email protected]
Managing International Collaborative Working and Raising Excellence
“Responsibilities From R&D Domestic Industry to SupportThe Great Indonesia”
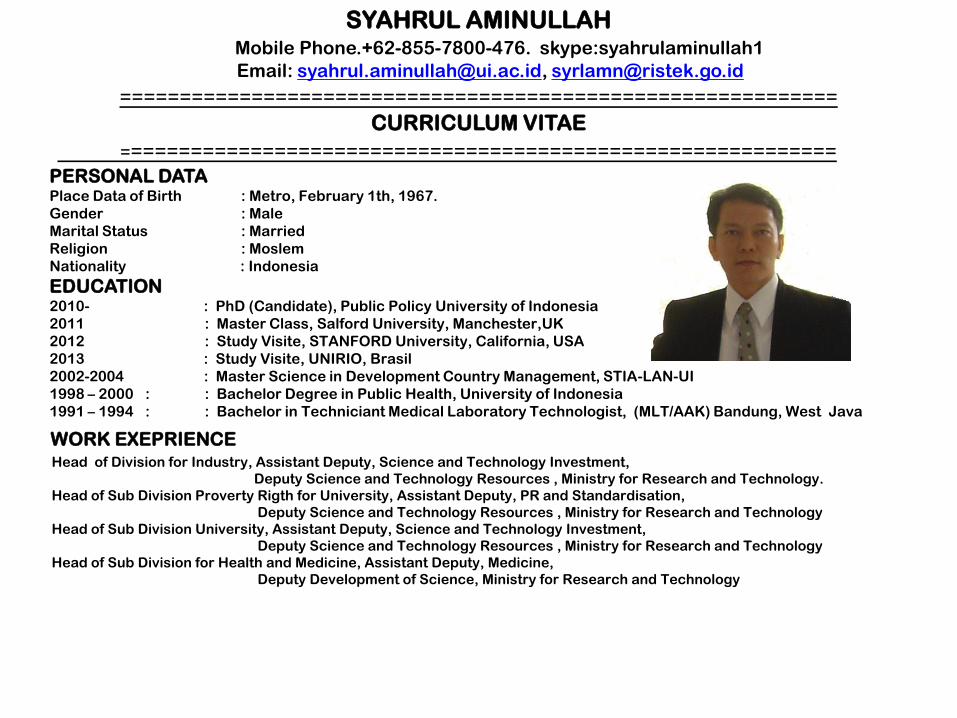
SYAHRUL AMINULLAHMobile Phone.+62-855-7800-476. skype:syahrulaminullah1
Email: [email protected], [email protected]
============================================================CURRICULUM VITAE
============================================================PERSONAL DATAPlace Data of Birth : Metro, February 1th, 1967.
Gender : Male
Marital Status : Married
Religion : Moslem
Nationality : Indonesia
EDUCATION2010- : PhD (Candidate), Public Policy University of Indonesia
2011 : Master Class, Salford University, Manchester,UK
2012 : Study Visite, STANFORD University, California, USA
2013 : Study Visite, UNIRIO, Brasil
2002-2004 : Master Science in Development Country Management, STIA-LAN-UI
1998 – 2000 : : Bachelor Degree in Public Health, University of Indonesia
1991 – 1994 : : Bachelor in Techniciant Medical Laboratory Technologist, (MLT/AAK) Bandung, West Java
WORK EXEPRIENCEHead of Division for Industry, Assistant Deputy, Science and Technology Investment,
Deputy Science and Technology Resources , Ministry for Research and Technology.
Head of Sub Division Proverty Rigth for University, Assistant Deputy, PR and Standardisation,
Deputy Science and Technology Resources , Ministry for Research and Technology
Head of Sub Division University, Assistant Deputy, Science and Technology Investment,
Deputy Science and Technology Resources , Ministry for Research and Technology
Head of Sub Division for Health and Medicine, Assistant Deputy, Medicine,
Deputy Development of Science, Ministry for Research and Technology
Outline
• Introduction
• Economic Profiles
• National R&D’s Expenditure
• Resources of Science and Technology
• Actors commitment on R&D expenditures
• Nawa Cita and R&D
• Conclusion
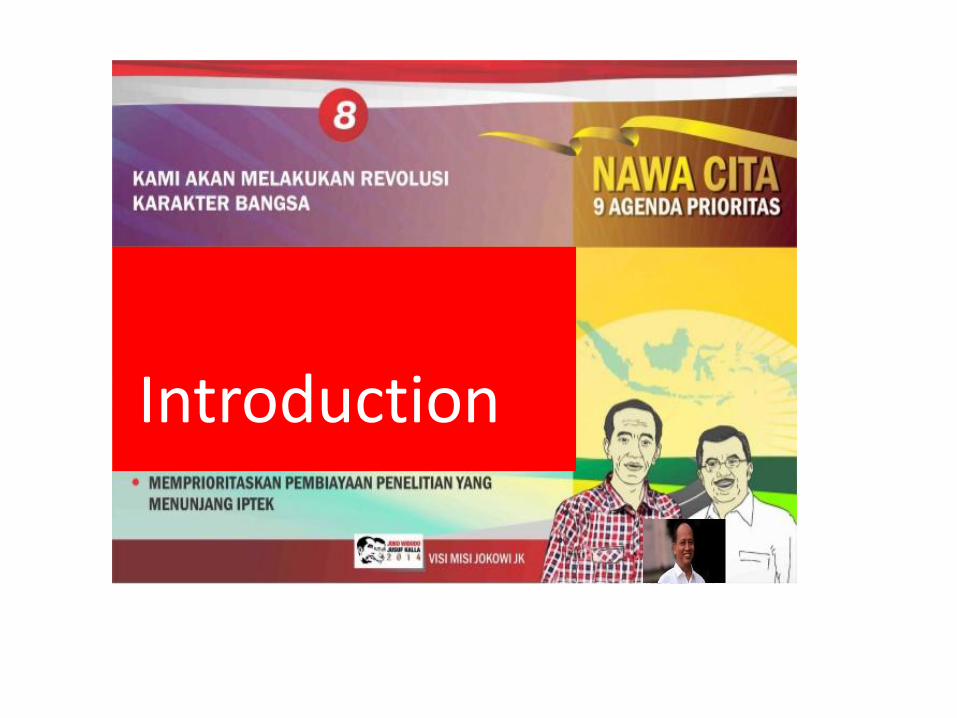
Introduction
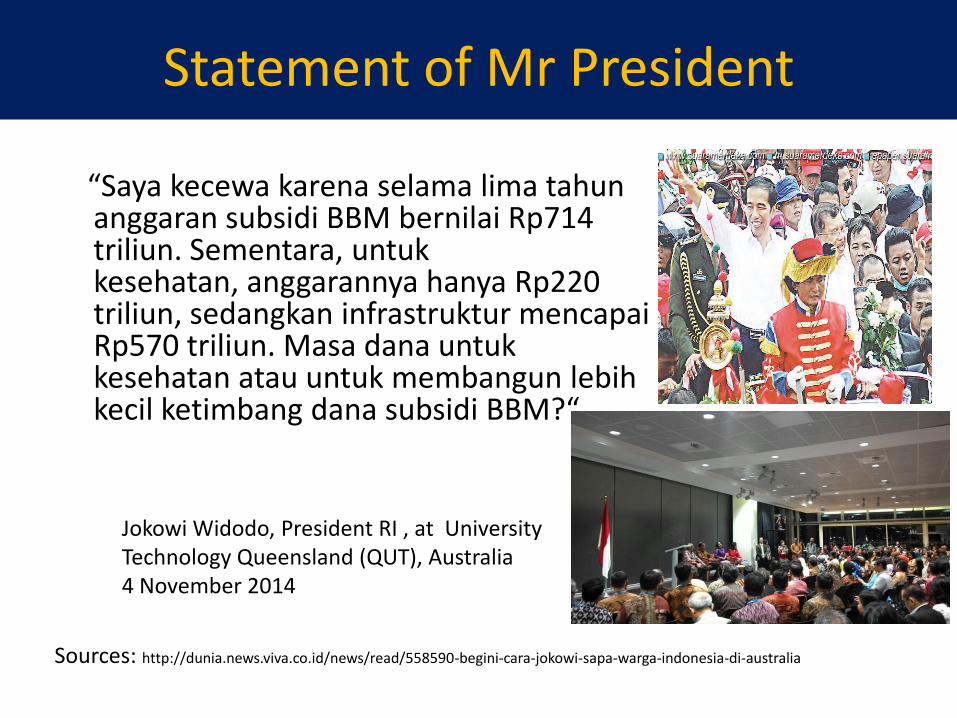
Statement of Mr President
“Saya kecewa karena selama lima tahun anggaran subsidi BBM bernilai Rp714 triliun. Sementara, untuk kesehatan, anggarannya hanya Rp220 triliun, sedangkan infrastruktur mencapai Rp570 triliun. Masa dana untuk kesehatan atau untuk membangun lebih kecil ketimbang dana subsidi BBM?“
Sources: http://dunia.news.viva.co.id/news/read/558590-begini-cara-jokowi-sapa-warga-indonesia-di-australia
Jokowi Widodo, President RI , at University Technology Queensland (QUT), Australia 4 November 2014
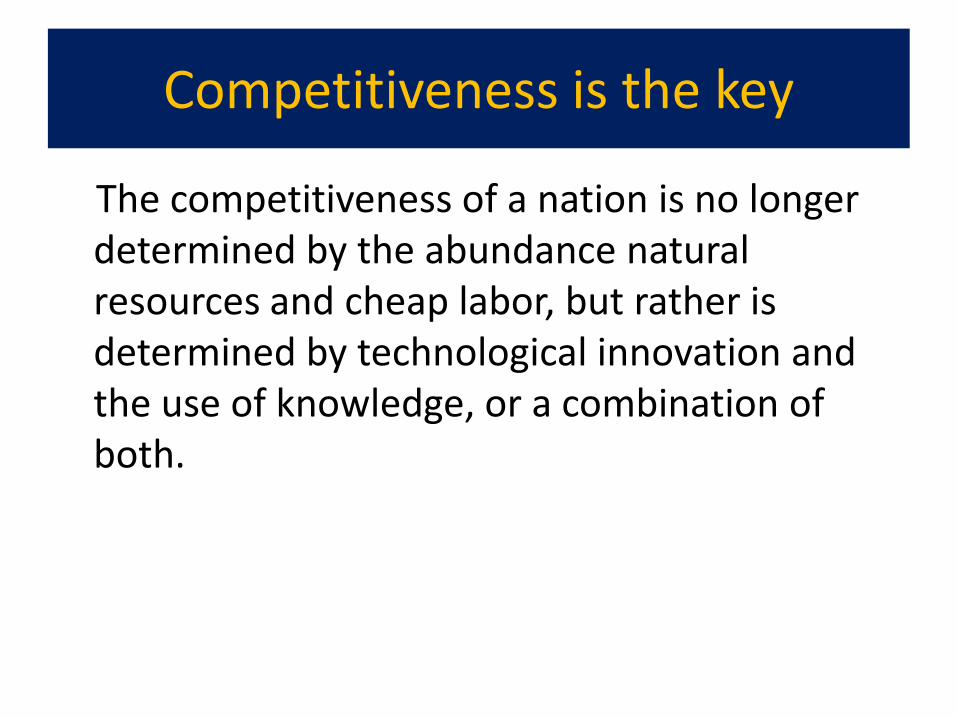
Competitiveness is the key
The competitiveness of a nation is no longer determined by the abundance natural resources and cheap labor, but rather is determined by technological innovation and the use of knowledge, or a combination of both.
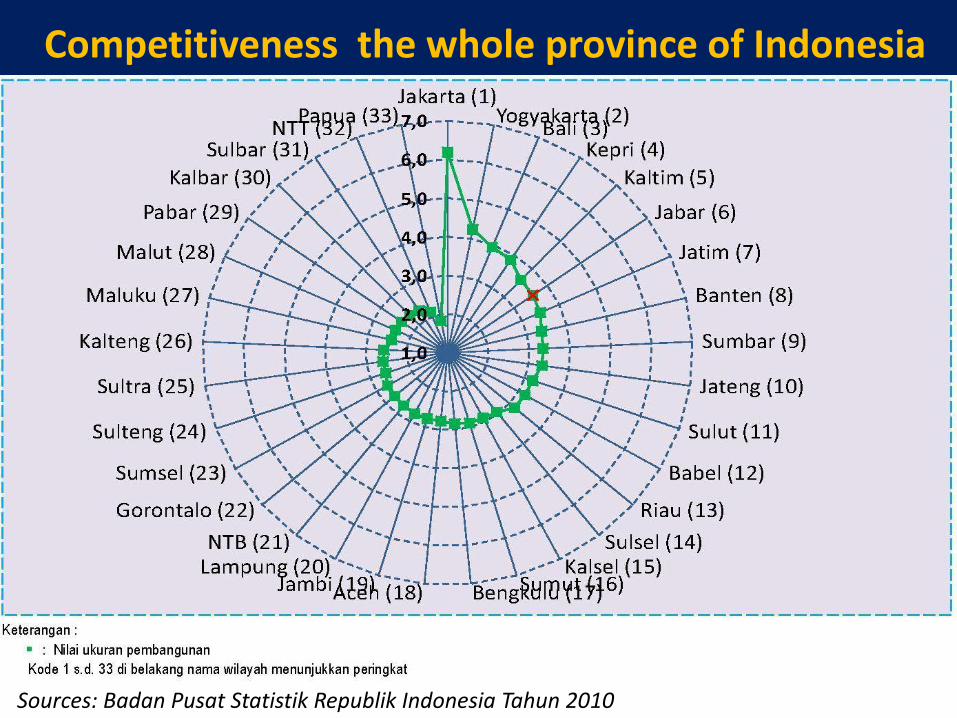
Competitiveness the whole province of Indonesia
Sources: Badan Pusat Statistik Republik Indonesia Tahun 2010
Ministry of Finance
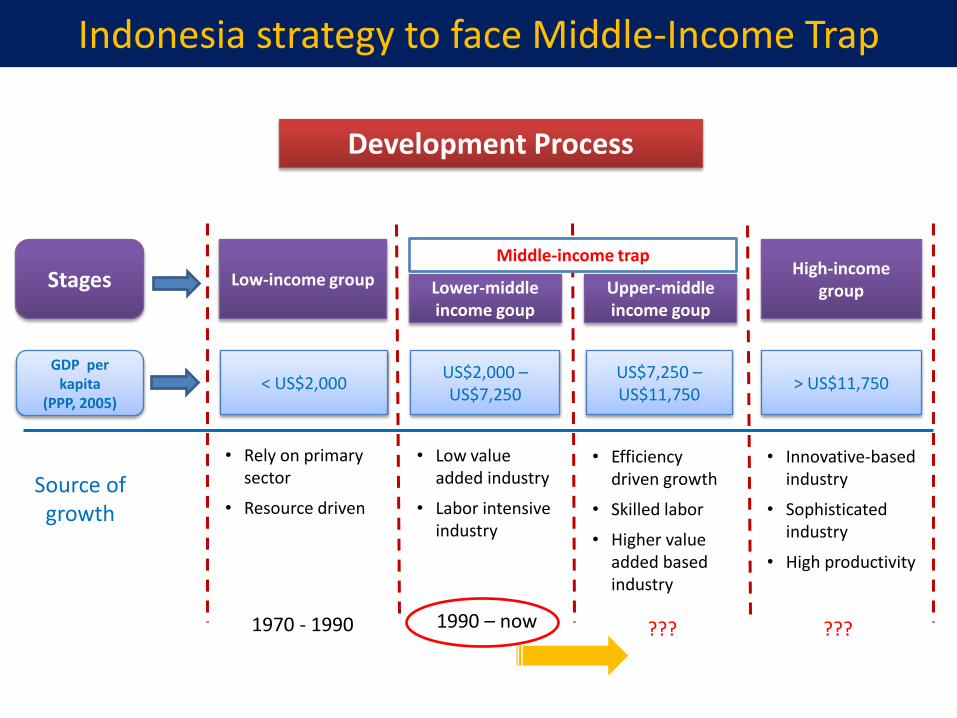
Development Process
Stages Low-income groupHigh-income
group
Middle-income trap
Lower-middle income goup
Upper-middle income goup
GDP per kapita
(PPP, 2005)< US$2,000
US$2,000 –US$7,250
US$7,250 –US$11,750
> US$11,750
Source of growth
• Rely on primary sector
• Resource driven
• Low value added industry
• Labor intensive industry
• Efficiency driven growth
• Skilled labor
• Higher value added based industry
• Innovative-basedindustry
• Sophisticated industry
• High productivity
1970 - 1990 1990 – now ??? ???
8
Indonesia strategy to face Middle-Income Trap
1. Industri pengolahan ikan
2. Industri pengolahan susu
3. Industri pengolahan minyak nabati
4. Industri pengolahan buah-buahan dan sayuran
5. Industri Minuman.
6. Industri tepung.
7. Industri gula berbasis tebu.
8. Industri Bahan Penyegar, meliputi Industri Pengolahan Kakao, danIndustri Pengolahan Kopi
Food Industry
1. Industri benang dan kain, 2. Produk tekstil/garmen, 3. produk alas kaki, serta 4. produk plastik dan karet untuk
keperluan rumah tangga5. Industri pengolahan
kayu, Industri pengolahan rotan, Industri furnitur, industri kertas
Textiles Industries1. Industri Kendaraan bermotor
roda 2, 2. Kendaraan bermotor roda 4, 3. kapal nelayan, 4. kereta api, 5. komponen pesawat, dan 6. roket peluncur
Transportation
Industry
1. industri Alat transmisi telekomunikasi darat,
2. Konten telematika, 3. Komponen elektronika, serta 4. komponen solar cell
ICT and Electronics
Industry
1. industri Pembangkit Listrik Sel Surya,
2. Industri Biodiesel, 3. Industri Pembangkit Listrik
Tenaga Nuklir, 4. Industri Pembangkit Listrik
Tenaga Uap/Batubara, serta5. Industri Pembangkit Listrik
Tenaga Uap/Gas
Power Plant Industry
Leading Industry
1. Farmasi, jamu dan kosmetik.
2. Alat Uji dan Kedokteran.
Pharmaceutical, Health
and Cosmestics Industry
9
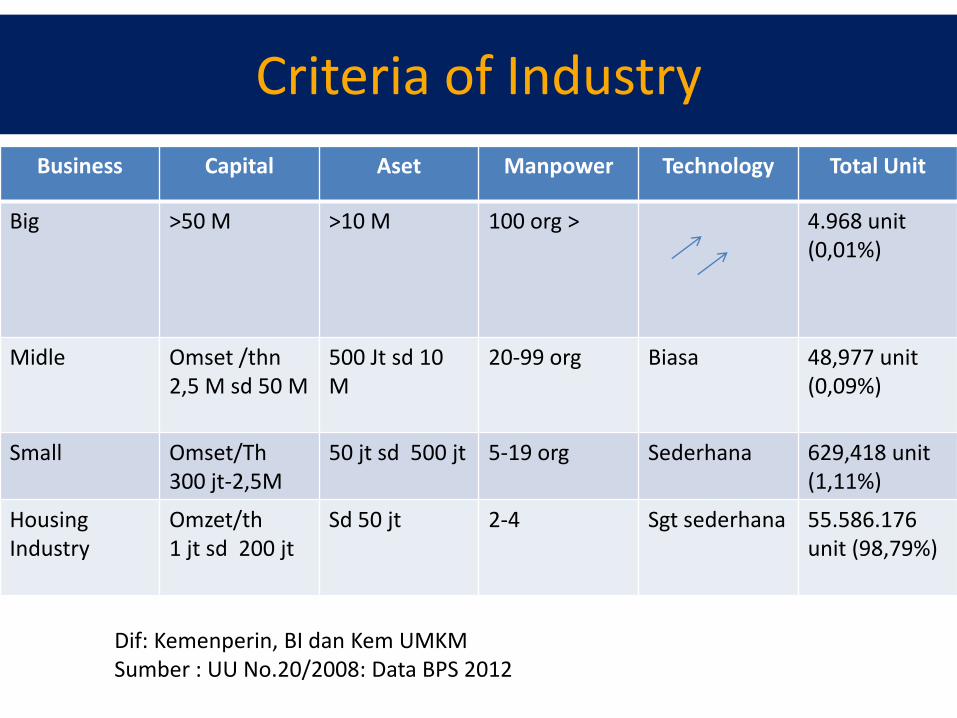
Criteria of Industry
Business Capital Aset Manpower Technology Total Unit
Big >50 M >10 M 100 org > 4.968 unit(0,01%)
Midle Omset /thn 2,5 M sd 50 M
500 Jt sd 10 M
20-99 org Biasa 48,977 unit (0,09%)
Small Omset/Th300 jt-2,5M
50 jt sd 500 jt 5-19 org Sederhana 629,418 unit (1,11%)
HousingIndustry
Omzet/th1 jt sd 200 jt
Sd 50 jt 2-4 Sgt sederhana 55.586.176 unit (98,79%)
Dif: Kemenperin, BI dan Kem UMKMSumber : UU No.20/2008: Data BPS 2012
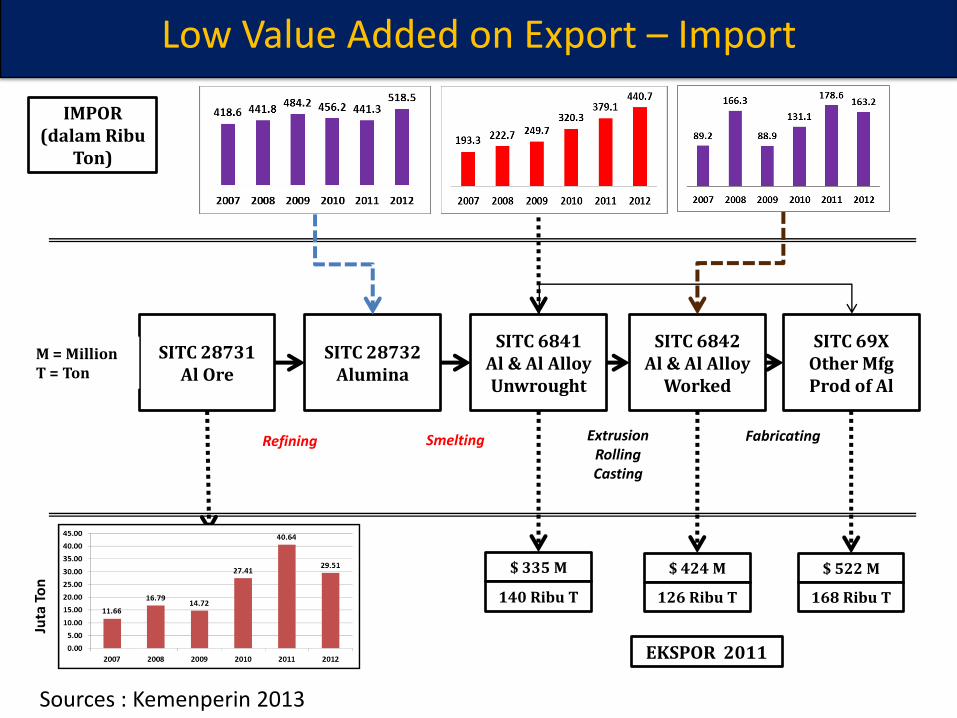
Low Value Added on Export – Import
$ 190 M
441 Ribu T
$ 956 M
379 Ribu T
$ 424 M
126 Ribu T
$ 335 M
140 Ribu T
SITC 28731 Al Ore
SITC 28732 Alumina
SITC 6841 Al & Al Alloy Unwrought
IMPOR (dalam Ribu
Ton)
EKSPOR 2011
M = MillionT = Ton
SITC 6842 Al & Al Alloy
Worked
SITC 69X Other Mfg Prod of Al
$ 522 M
168 Ribu T
Refining Smelting ExtrusionRollingCasting
Fabricating
Juta
To
n
Sources : Kemenperin 2013
Economic Profile
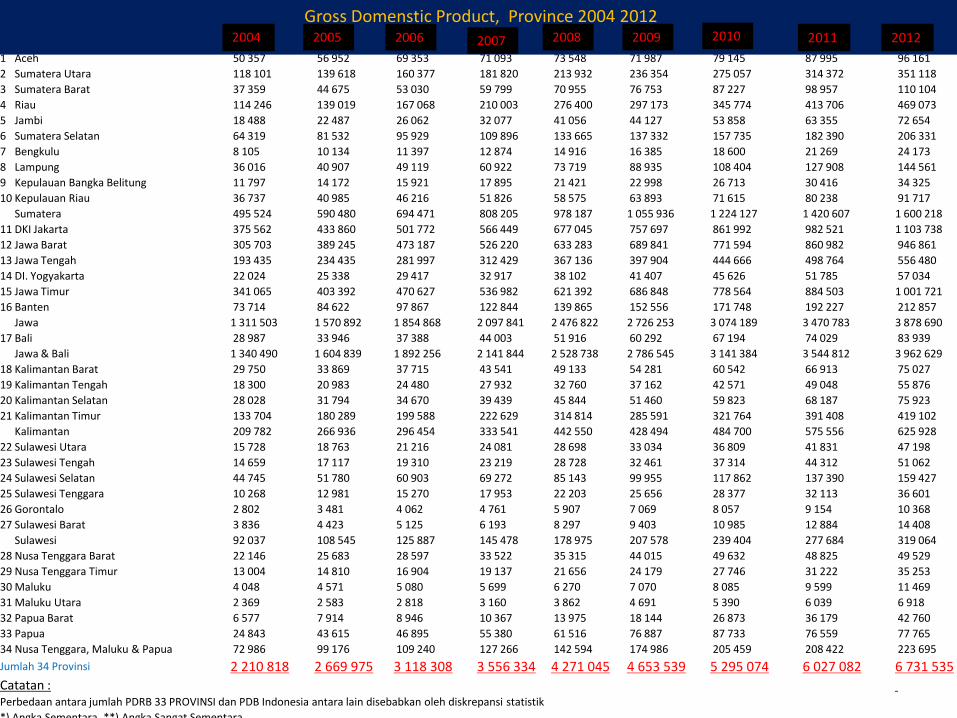
Provinsi 2004 2005 2006 2007 2008 2009 2010 2011*) 2012**)
1 Aceh 50 357 56 952 69 353 71 093 73 548 71 987 79 145 87 995 96 161
2 Sumatera Utara 118 101 139 618 160 377 181 820 213 932 236 354 275 057 314 372 351 118
3 Sumatera Barat 37 359 44 675 53 030 59 799 70 955 76 753 87 227 98 957 110 104
4 Riau 114 246 139 019 167 068 210 003 276 400 297 173 345 774 413 706 469 073
5 Jambi 18 488 22 487 26 062 32 077 41 056 44 127 53 858 63 355 72 654
6 Sumatera Selatan 64 319 81 532 95 929 109 896 133 665 137 332 157 735 182 390 206 331
7 Bengkulu 8 105 10 134 11 397 12 874 14 916 16 385 18 600 21 269 24 173
8 Lampung 36 016 40 907 49 119 60 922 73 719 88 935 108 404 127 908 144 561
9 Kepulauan Bangka Belitung 11 797 14 172 15 921 17 895 21 421 22 998 26 713 30 416 34 325
10 Kepulauan Riau 36 737 40 985 46 216 51 826 58 575 63 893 71 615 80 238 91 717
Sumatera 495 524 590 480 694 471 808 205 978 187 1 055 936 1 224 127 1 420 607 1 600 218
11 DKI Jakarta 375 562 433 860 501 772 566 449 677 045 757 697 861 992 982 521 1 103 738
12 Jawa Barat 305 703 389 245 473 187 526 220 633 283 689 841 771 594 860 982 946 861
13 Jawa Tengah 193 435 234 435 281 997 312 429 367 136 397 904 444 666 498 764 556 480
14 DI. Yogyakarta 22 024 25 338 29 417 32 917 38 102 41 407 45 626 51 785 57 034
15 Jawa Timur 341 065 403 392 470 627 536 982 621 392 686 848 778 564 884 503 1 001 721
16 Banten 73 714 84 622 97 867 122 844 139 865 152 556 171 748 192 227 212 857
Jawa 1 311 503 1 570 892 1 854 868 2 097 841 2 476 822 2 726 253 3 074 189 3 470 783 3 878 690
17 Bali 28 987 33 946 37 388 44 003 51 916 60 292 67 194 74 029 83 939
Jawa & Bali 1 340 490 1 604 839 1 892 256 2 141 844 2 528 738 2 786 545 3 141 384 3 544 812 3 962 629
18 Kalimantan Barat 29 750 33 869 37 715 43 541 49 133 54 281 60 542 66 913 75 027
19 Kalimantan Tengah 18 300 20 983 24 480 27 932 32 760 37 162 42 571 49 048 55 876
20 Kalimantan Selatan 28 028 31 794 34 670 39 439 45 844 51 460 59 823 68 187 75 923
21 Kalimantan Timur 133 704 180 289 199 588 222 629 314 814 285 591 321 764 391 408 419 102
Kalimantan 209 782 266 936 296 454 333 541 442 550 428 494 484 700 575 556 625 928
22 Sulawesi Utara 15 728 18 763 21 216 24 081 28 698 33 034 36 809 41 831 47 198
23 Sulawesi Tengah 14 659 17 117 19 310 23 219 28 728 32 461 37 314 44 312 51 062
24 Sulawesi Selatan 44 745 51 780 60 903 69 272 85 143 99 955 117 862 137 390 159 427
25 Sulawesi Tenggara 10 268 12 981 15 270 17 953 22 203 25 656 28 377 32 113 36 601
26 Gorontalo 2 802 3 481 4 062 4 761 5 907 7 069 8 057 9 154 10 368
27 Sulawesi Barat 3 836 4 423 5 125 6 193 8 297 9 403 10 985 12 884 14 408
Sulawesi 92 037 108 545 125 887 145 478 178 975 207 578 239 404 277 684 319 064
28 Nusa Tenggara Barat 22 146 25 683 28 597 33 522 35 315 44 015 49 632 48 825 49 529
29 Nusa Tenggara Timur 13 004 14 810 16 904 19 137 21 656 24 179 27 746 31 222 35 253
30 Maluku 4 048 4 571 5 080 5 699 6 270 7 070 8 085 9 599 11 469
31 Maluku Utara 2 369 2 583 2 818 3 160 3 862 4 691 5 390 6 039 6 918
32 Papua Barat 6 577 7 914 8 946 10 367 13 975 18 144 26 873 36 179 42 760
33 Papua 24 843 43 615 46 895 55 380 61 516 76 887 87 733 76 559 77 765
34 Nusa Tenggara, Maluku & Papua 72 986 99 176 109 240 127 266 142 594 174 986 205 459 208 422 223 695
Jumlah 34 Provinsi 2 210 818 2 669 975 3 118 308 3 556 334 4 271 045 4 653 539 5 295 074 6 027 082 6 731 535
Catatan :Perbedaan antara jumlah PDRB 33 PROVINSI dan PDB Indonesia antara lain disebabkan oleh diskrepansi statistik
*) Angka Sementara, **) Angka Sangat Sementara
Gross Domenstic Product, Province 2004 20122005 201220112004 2006 2007 2008 2009 2010
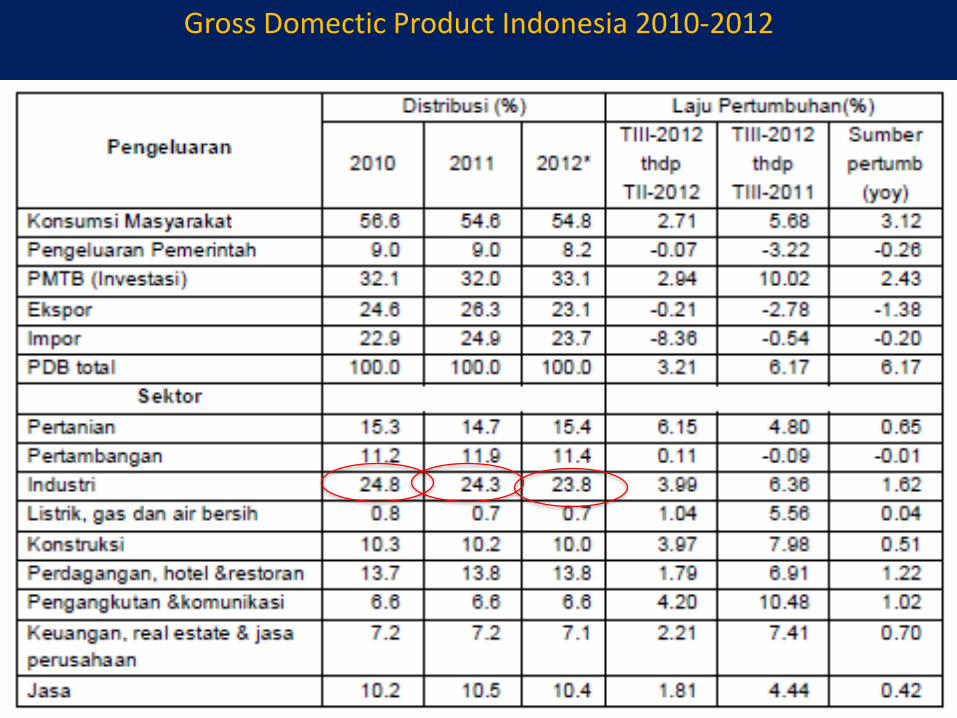
Gross Domectic Product Indonesia 2010-2012
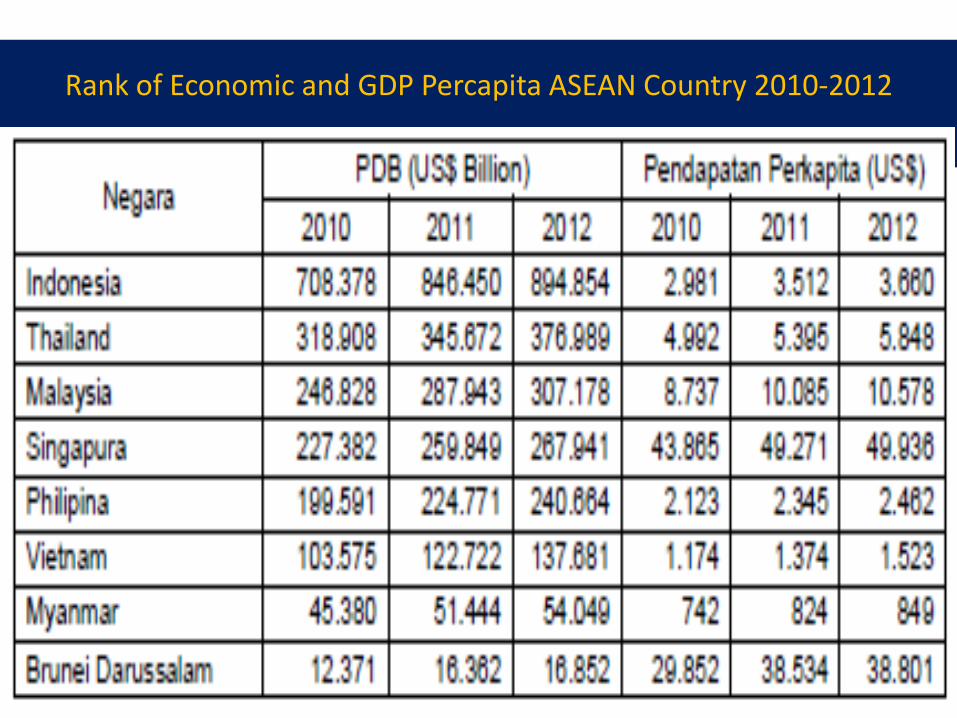
Rank of Economic and GDP Percapita ASEAN Country 2010-2012
National R&D’s Expenditure
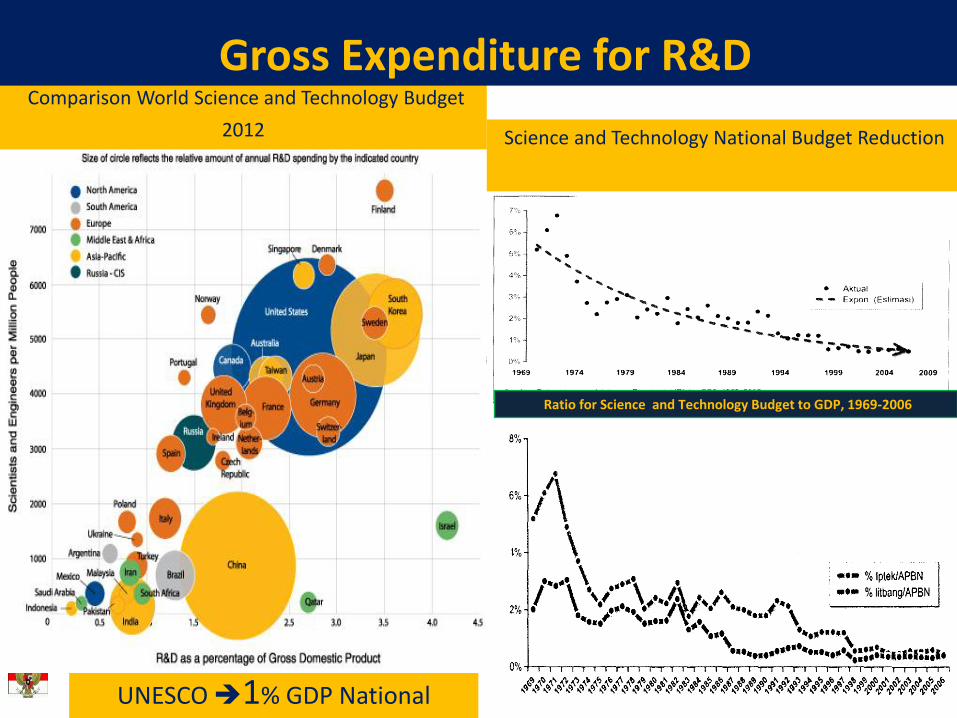
Comparison World Science and Technology Budget
2012
UNESCO 1% GDP National
Gross Expenditure for R&D
Science and Technology National Budget Reduction
Ratio for Science and Technology Budget to GDP, 1969-2006
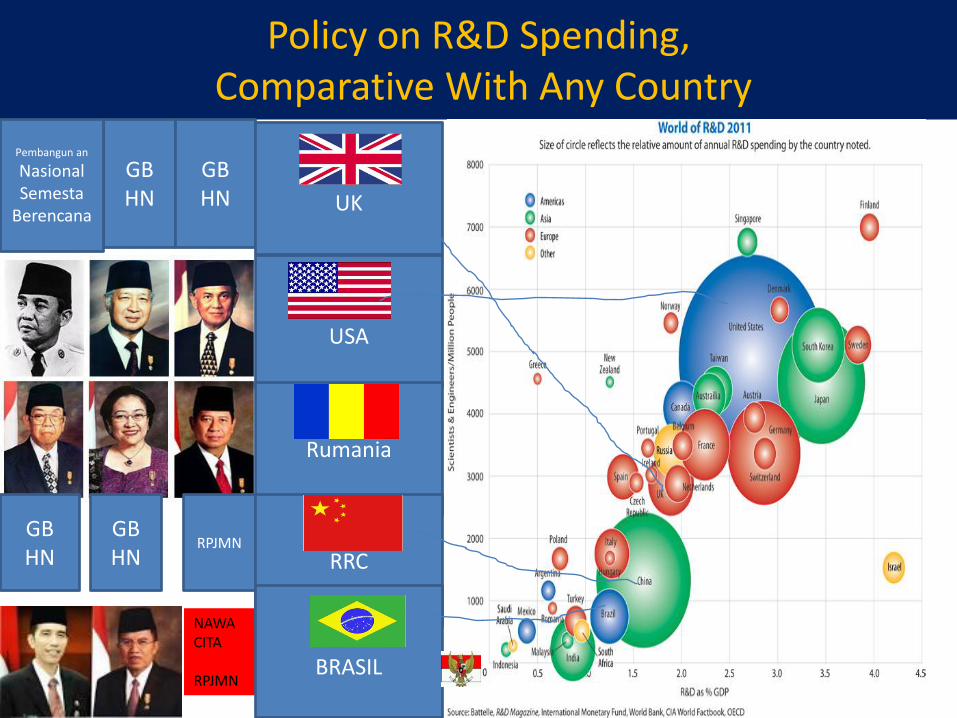
Policy on R&D Spending, Comparative With Any Country
GBHN
GBHN
GBHN
Pembangun an
Nasional Semesta
Berencana
RPJMNGBHN
NAWACITA
RPJMN
UK
USA
Rumania
RRC
BRASIL
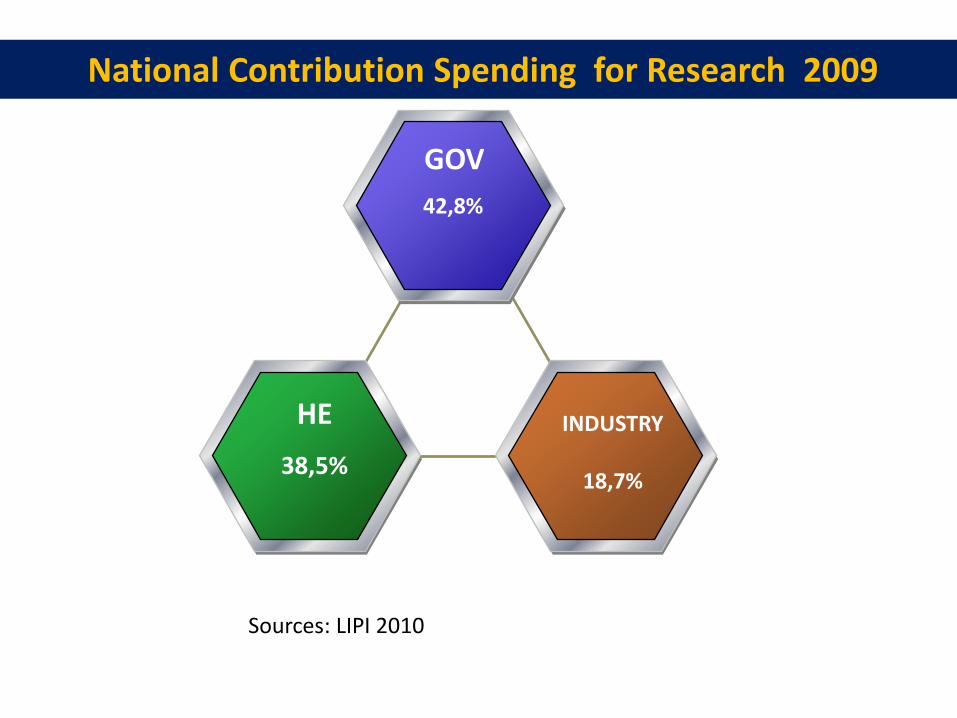
National Contribution Spending for Research 2009
42,8%
GOV
HE
38,5%
INDUSTRY
18,7%
Sources: LIPI 2010
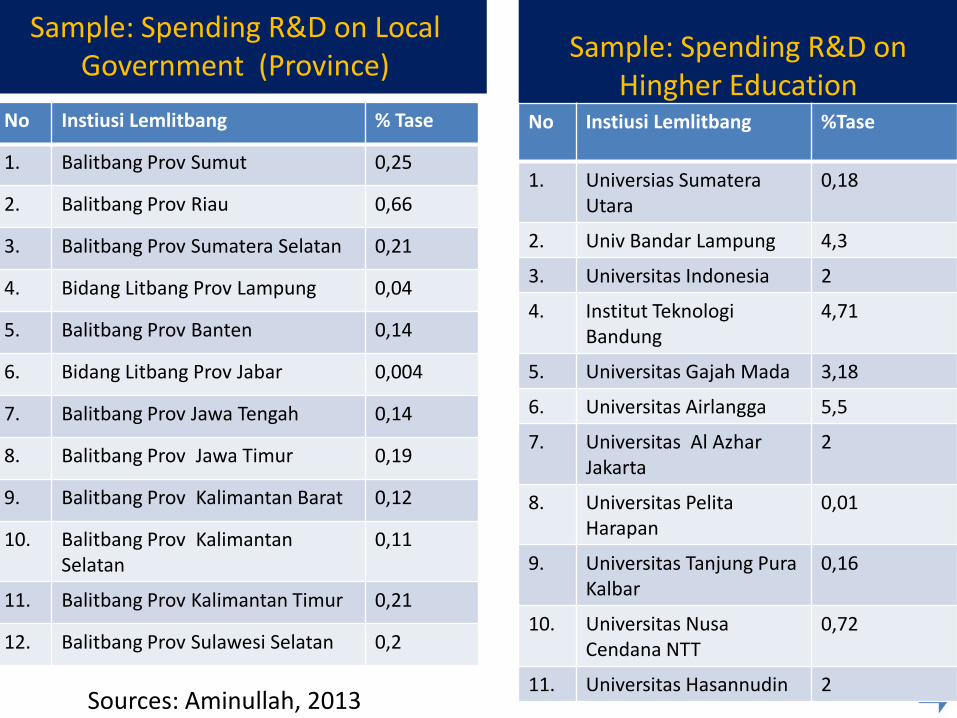
Sample: Spending R&D on Local Government (Province)
No Instiusi Lemlitbang % Tase
1. Balitbang Prov Sumut 0,25
2. Balitbang Prov Riau 0,66
3. Balitbang Prov Sumatera Selatan 0,21
4. Bidang Litbang Prov Lampung 0,04
5. Balitbang Prov Banten 0,14
6. Bidang Litbang Prov Jabar 0,004
7. Balitbang Prov Jawa Tengah 0,14
8. Balitbang Prov Jawa Timur 0,19
9. Balitbang Prov Kalimantan Barat 0,12
10. Balitbang Prov Kalimantan Selatan
0,11
11. Balitbang Prov Kalimantan Timur 0,21
12. Balitbang Prov Sulawesi Selatan 0,2
Sources: Aminullah, 2013
Sample: Spending R&D on Hingher Education
No Instiusi Lemlitbang %Tase
1. Universias Sumatera Utara
0,18
2. Univ Bandar Lampung 4,3
3. Universitas Indonesia 2
4. Institut Teknologi Bandung
4,71
5. Universitas Gajah Mada 3,18
6. Universitas Airlangga 5,5
7. Universitas Al Azhar Jakarta
2
8. Universitas Pelita Harapan
0,01
9. Universitas Tanjung Pura Kalbar
0,16
10. Universitas Nusa Cendana NTT
0,72
11. Universitas Hasannudin 2

Resources of Science and Technology
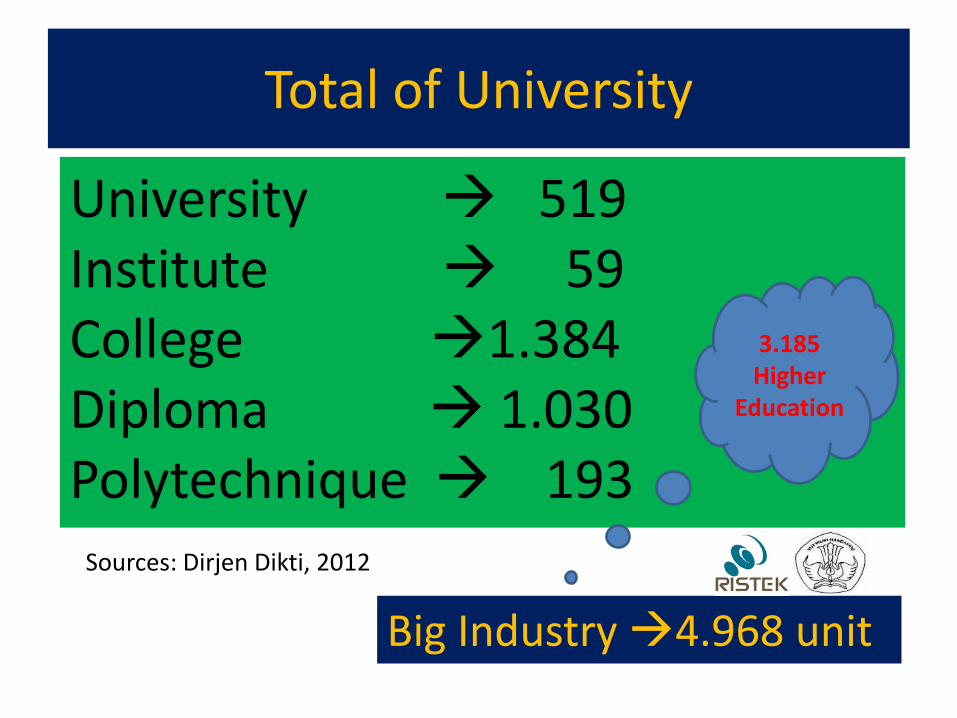
Total of University
University 519Institute 59College 1.384Diploma 1.030Polytechnique 193
Sources: Dirjen Dikti, 2012
Big Industry 4.968 unit
3.185 Higher
Education
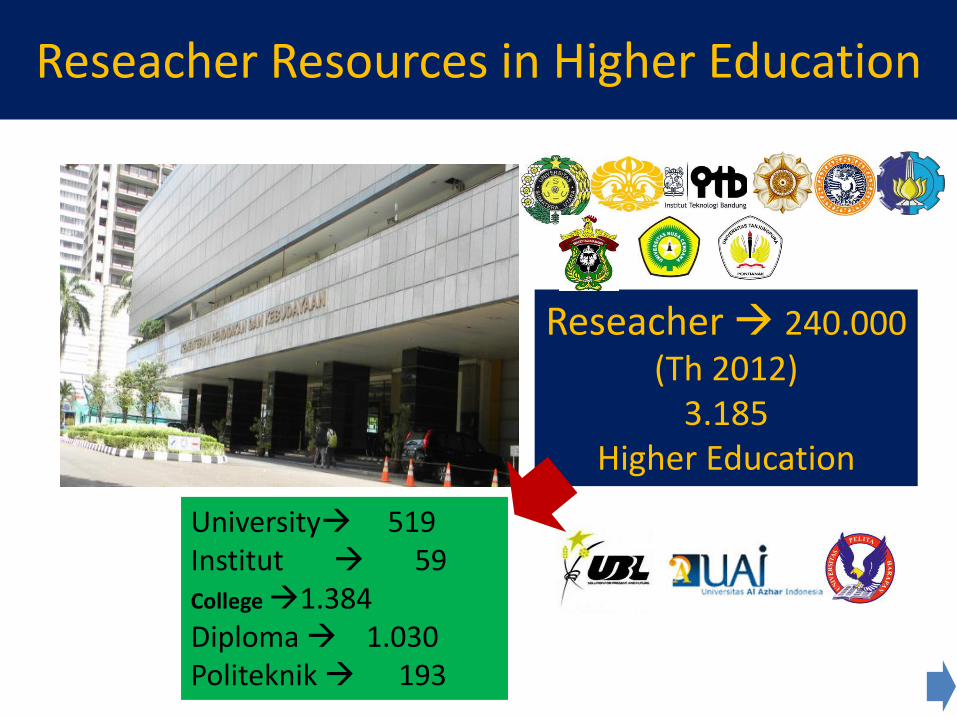
Reseacher Resources in Higher Education
Reseacher 240.000(Th 2012)
3.185 Higher Education
University 519Institut 59College 1.384Diploma 1.030Politeknik 193
Actors commitment on R&D expenditures
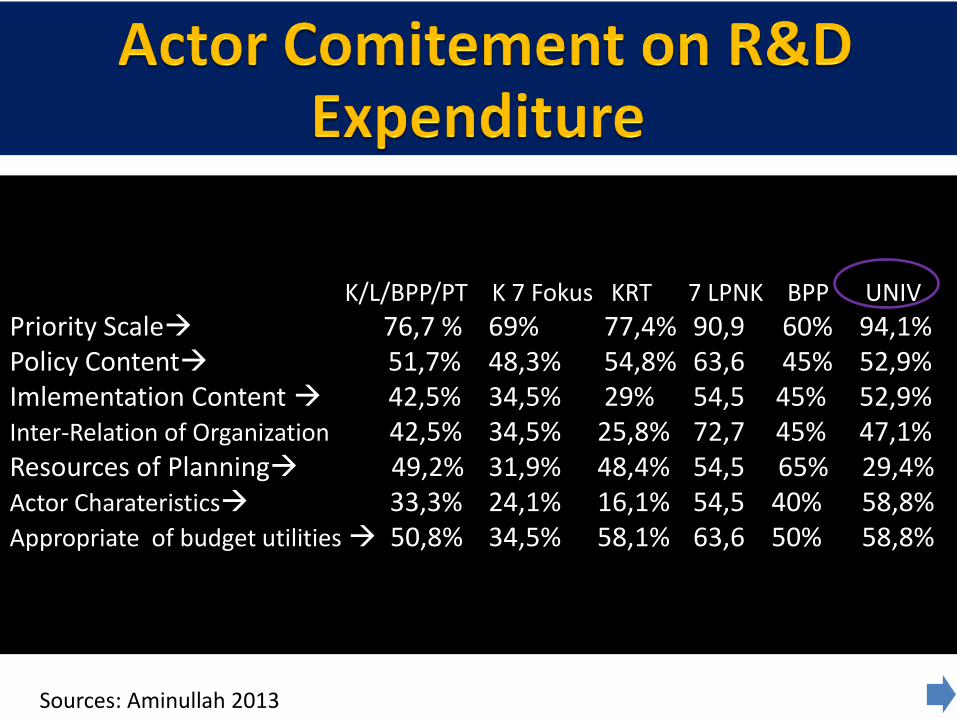
K/L/BPP/PT K 7 Fokus KRT 7 LPNK BPP UNIV
Priority Scale 76,7 % 69% 77,4% 90,9 60% 94,1%Policy Content 51,7% 48,3% 54,8% 63,6 45% 52,9%Imlementation Content 42,5% 34,5% 29% 54,5 45% 52,9%Inter-Relation of Organization 42,5% 34,5% 25,8% 72,7 45% 47,1%Resources of Planning 49,2% 31,9% 48,4% 54,5 65% 29,4%Actor Charateristics 33,3% 24,1% 16,1% 54,5 40% 58,8%Appropriate of budget utilities 50,8% 34,5% 58,1% 63,6 50% 58,8%
Sources: Aminullah 2013
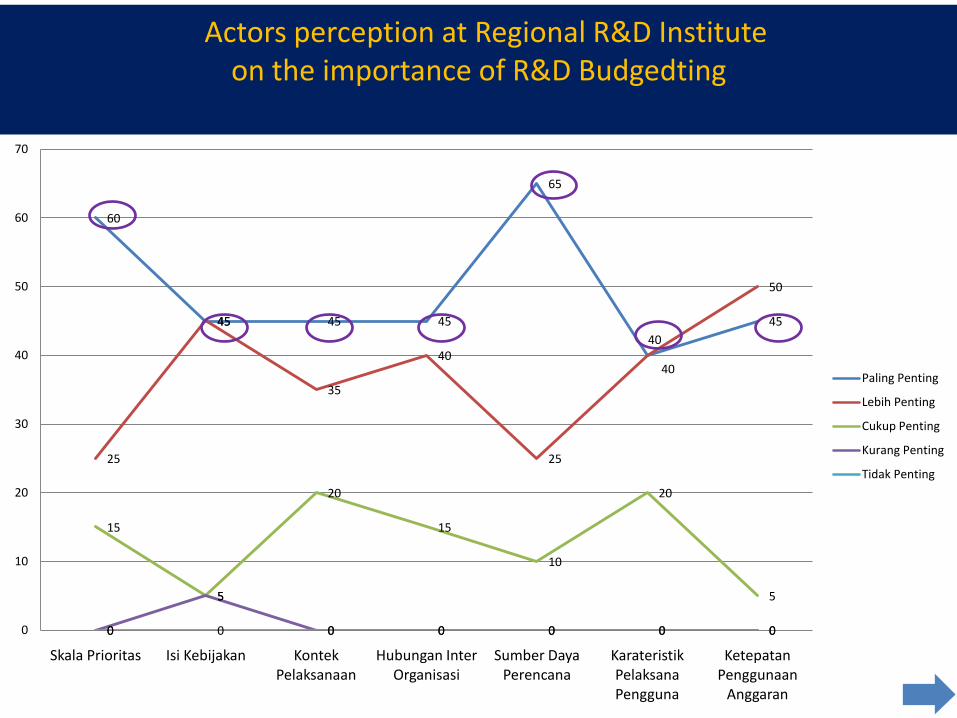
Actors perception at Regional R&D Institute on the importance of R&D Budgedting
60
45 45 45
65
40
45
25
45
35
40
25
40
50
15
5
20
15
10
20
5
0
5
0 0 0 0 00 0 0 0 0 0 00
10
20
30
40
50
60
70
Skala Prioritas Isi Kebijakan Kontek Pelaksanaan
Hubungan Inter Organisasi
Sumber Daya Perencana
Karateristik Pelaksana Pengguna
Ketepatan Penggunaan
Anggaran
Paling Penting
Lebih Penting
Cukup Penting
Kurang Penting
Tidak Penting
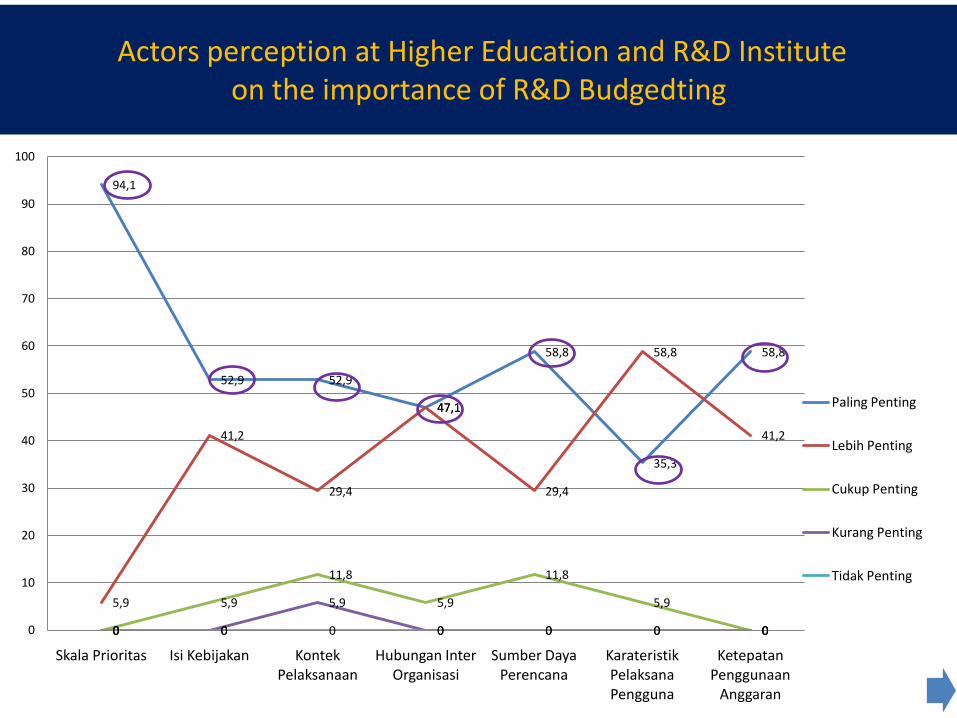
Actors perception at Higher Education and R&D Institute on the importance of R&D Budgedting
94,1
52,9 52,9
47,1
58,8
35,3
58,8
5,9
41,2
29,4
47,1
29,4
58,8
41,2
0
5,9
11,8
5,9
11,8
5,9
00 0
5,9
0 0 0 00 0 0 0 0 0 00
10
20
30
40
50
60
70
80
90
100
Skala Prioritas Isi Kebijakan Kontek Pelaksanaan
Hubungan Inter Organisasi
Sumber Daya Perencana
Karateristik Pelaksana Pengguna
Ketepatan Penggunaan
Anggaran
Paling Penting
Lebih Penting
Cukup Penting
Kurang Penting
Tidak Penting
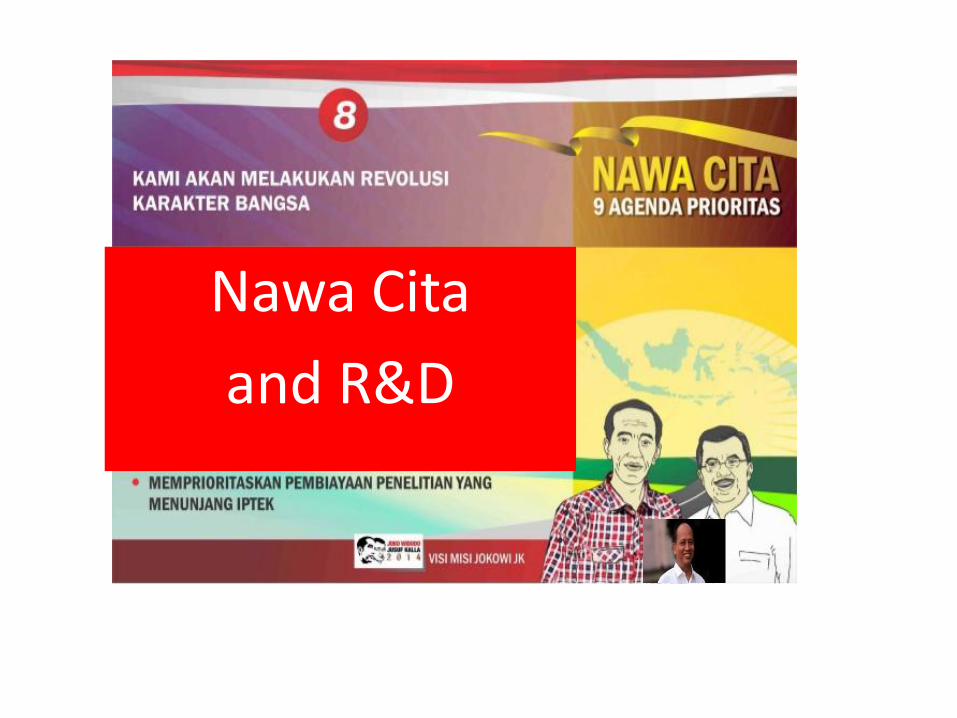
Nawa Cita
and R&D
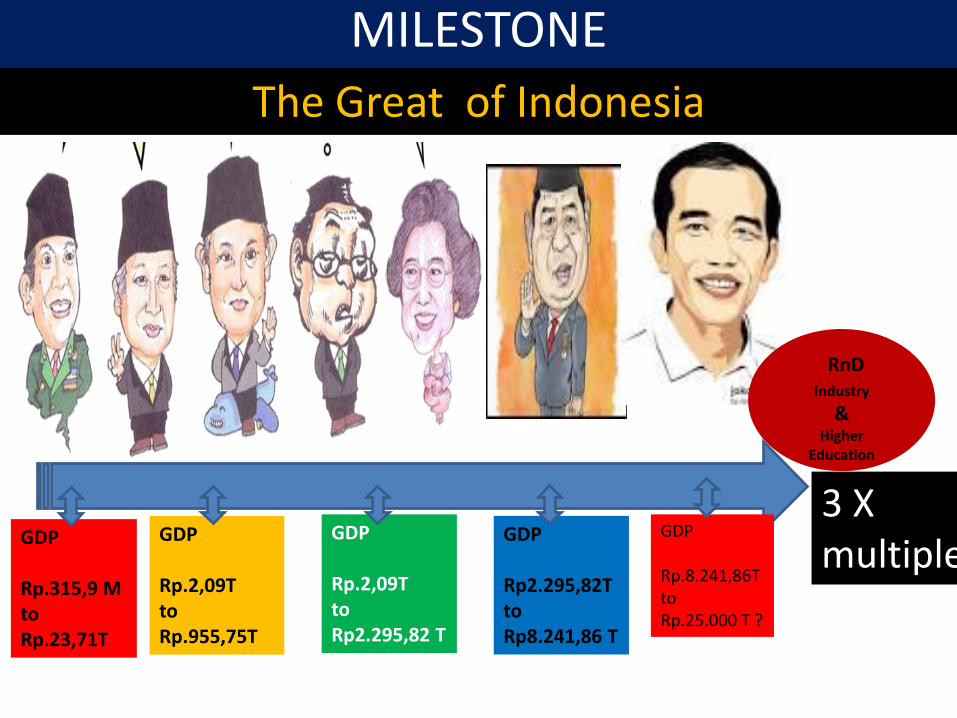
The Great of Indonesia
3 X multiple
GDP
Rp.315,9 MtoRp.23,71T
MILESTONE
GDP
Rp.2,09TtoRp.955,75T
GDP
Rp.2,09TtoRp2.295,82 T
GDP
Rp2.295,82TtoRp8.241,86 T
GDP
Rp.8.241,86TtoRp.25.000 T ?
RnDIndustry
& Higher
Education
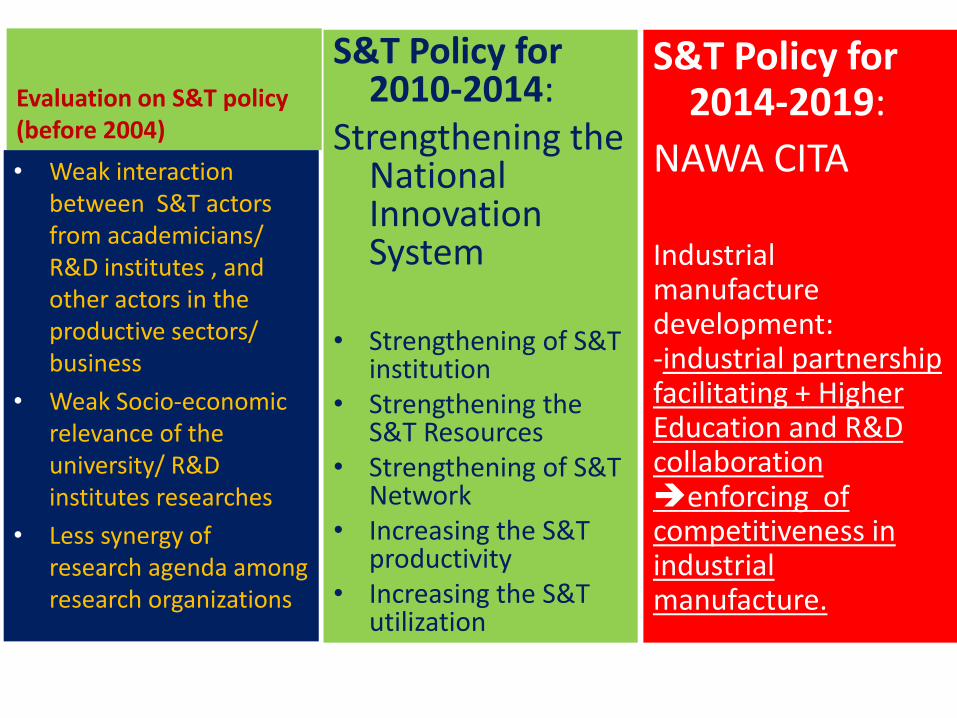
Evaluation on S&T policy (before 2004)
• Weak interaction between S&T actors from academicians/ R&D institutes , and other actors in the productive sectors/ business
• Weak Socio-economic relevance of the university/ R&D institutes researches
• Less synergy of research agenda among research organizations
S&T Policy for 2010-2014:
Strengthening the National Innovation System
• Strengthening of S&T institution
• Strengthening the S&T Resources
• Strengthening of S&T Network
• Increasing the S&T productivity
• Increasing the S&T utilization
S&T Policy for 2014-2019:
NAWA CITA
Industrial manufacture development:-industrial partnership facilitating + Higher Education and R&D collaboration enforcing of competitiveness in industrial manufacture.
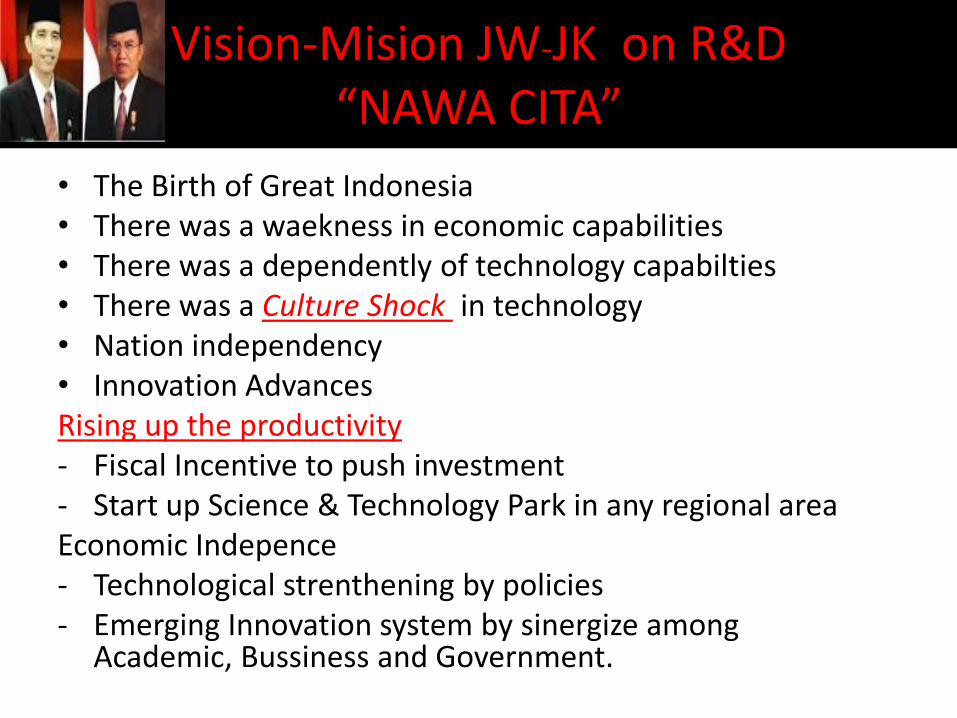
• The Birth of Great Indonesia • There was a waekness in economic capabilities• There was a dependently of technology capabilties• There was a Culture Shock in technology• Nation independency• Innovation AdvancesRising up the productivity- Fiscal Incentive to push investment- Start up Science & Technology Park in any regional areaEconomic Indepence- Technological strenthening by policies- Emerging Innovation system by sinergize among
Academic, Bussiness and Government.
Vision-Mision JW-JK on R&D“NAWA CITA”
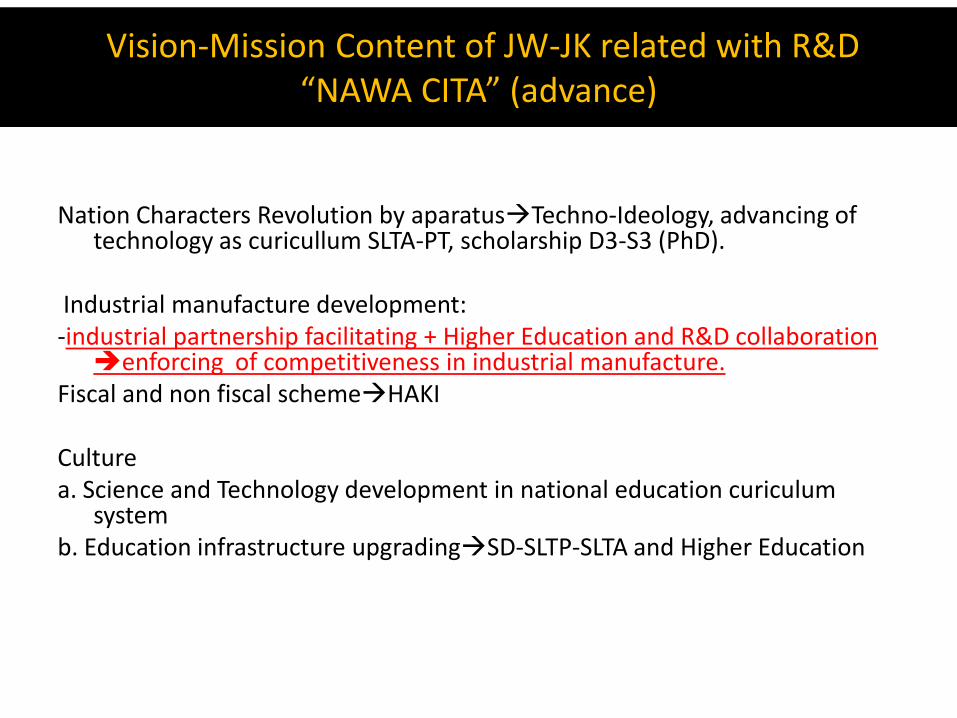
Vision-Mission Content of JW-JK related with R&D“NAWA CITA” (advance)
Nation Characters Revolution by aparatusTechno-Ideology, advancing of technology as curicullum SLTA-PT, scholarship D3-S3 (PhD).
Industrial manufacture development:-industrial partnership facilitating + Higher Education and R&D collaboration enforcing of competitiveness in industrial manufacture.
Fiscal and non fiscal schemeHAKI
Culturea. Science and Technology development in national education curiculum
systemb. Education infrastructure upgradingSD-SLTP-SLTA and Higher Education
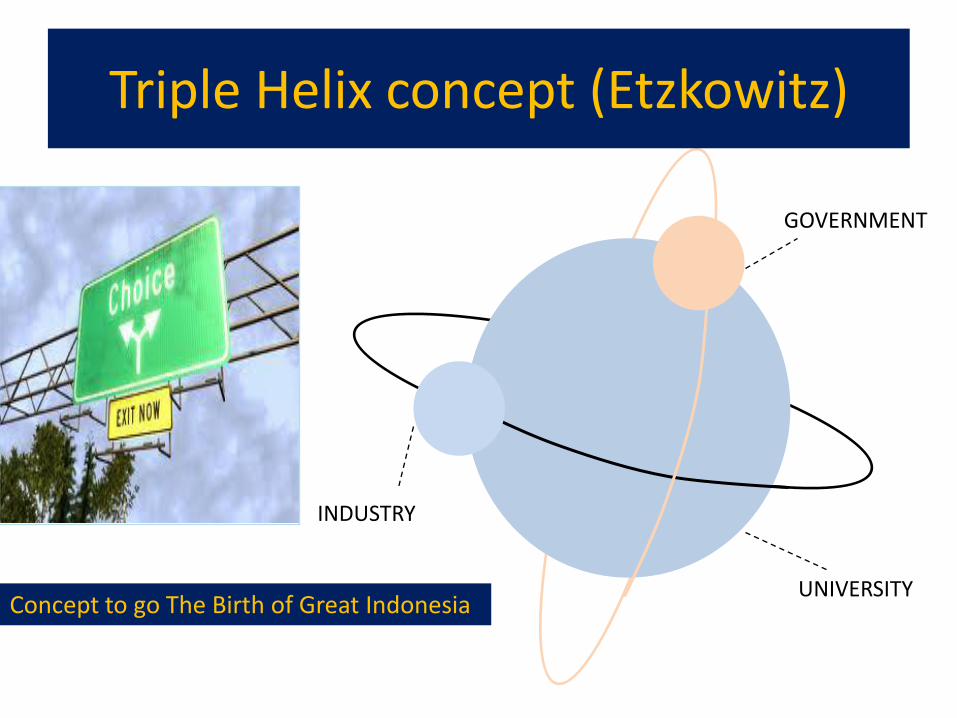
Triple Helix concept (Etzkowitz)
UNIVERSITY
INDUSTRY
GOVERNMENT
Concept to go The Birth of Great Indonesia
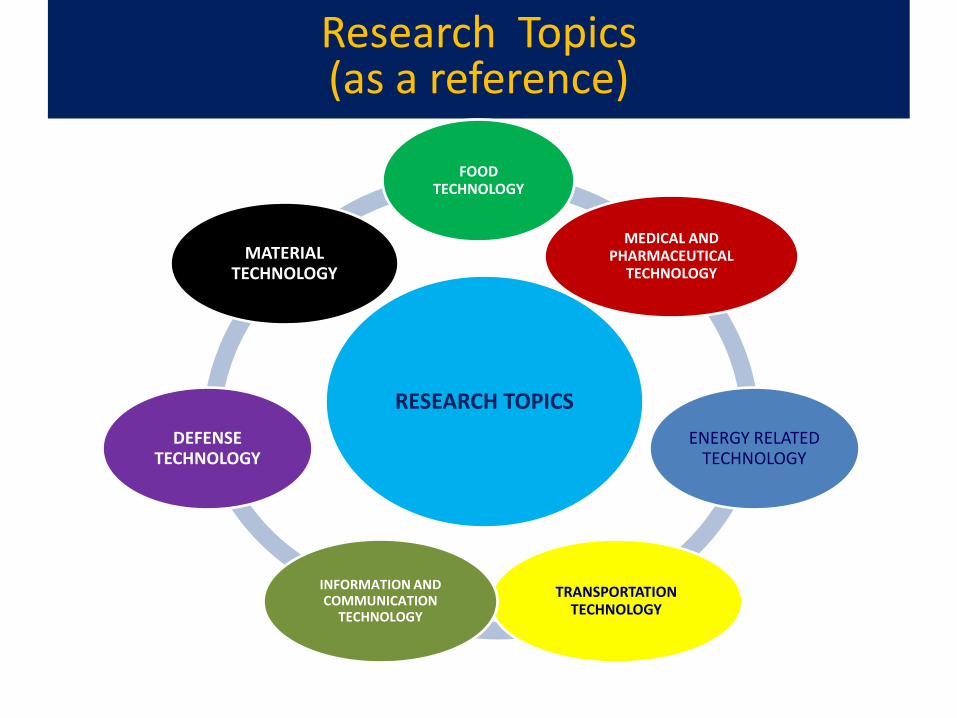
Research Topics(as a reference)
RESEARCH TOPICS
FOOD TECHNOLOGY
MEDICAL AND PHARMACEUTICAL
TECHNOLOGY
ENERGY RELATED TECHNOLOGY
TRANSPORTATION TECHNOLOGY
INFORMATION AND COMMUNICATION
TECHNOLOGY
DEFENSE TECHNOLOGY
MATERIAL TECHNOLOGY
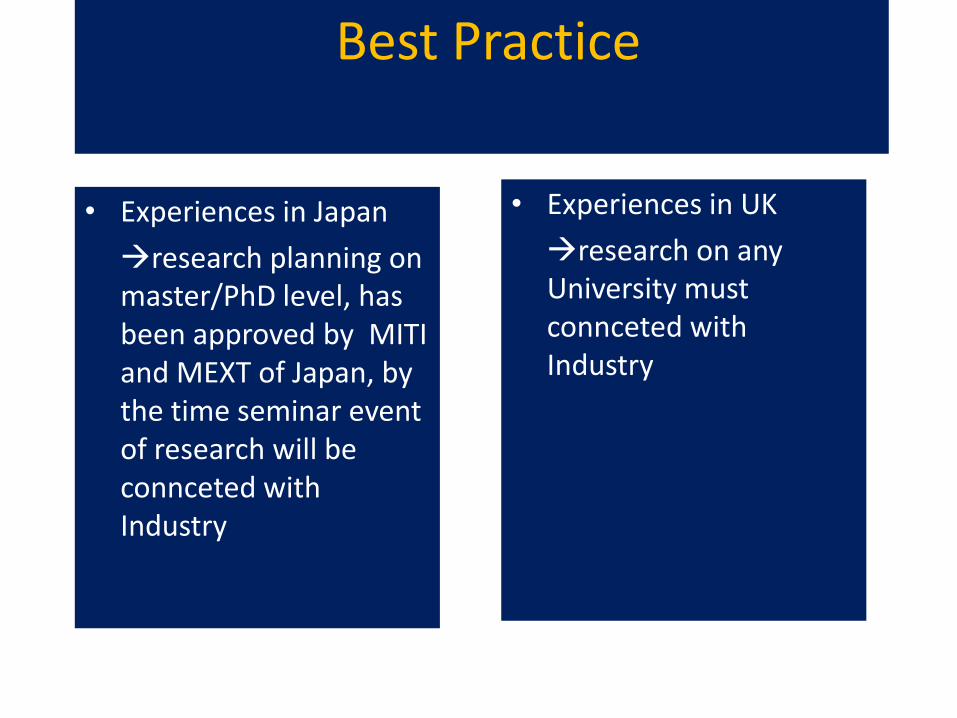
Best Practice
• Experiences in Japan
research planning on master/PhD level, has been approved by MITI and MEXT of Japan, by the time seminar event of research will be connceted with Industry
• Experiences in UK
research on any University must connceted with Industry
Conclusion
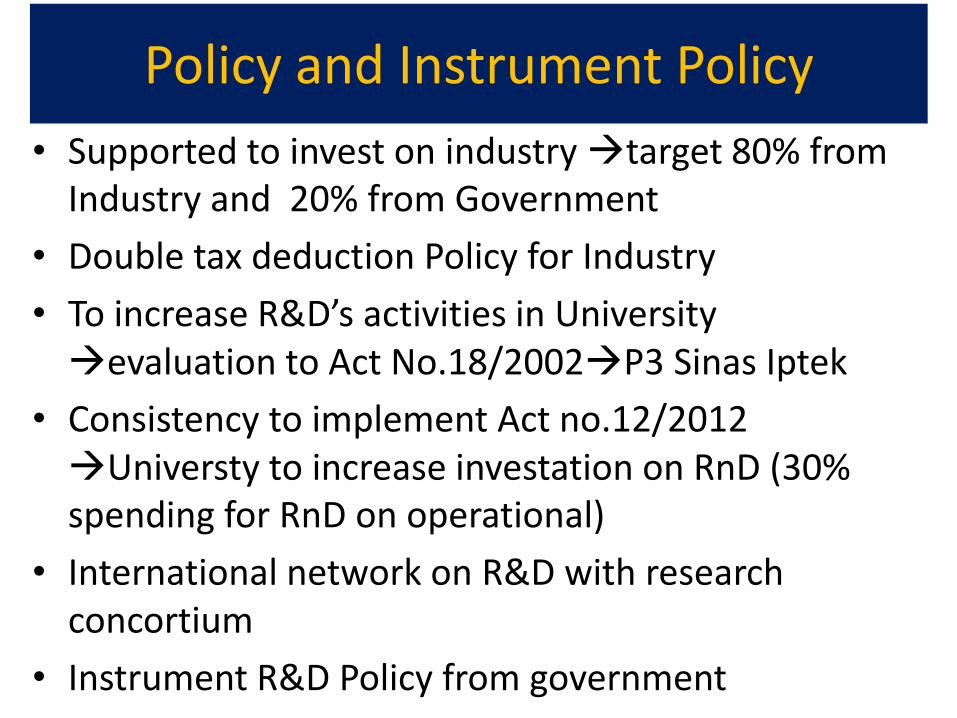
Policy and Instrument Policy
• Supported to invest on industry target 80% from Industry and 20% from Government
• Double tax deduction Policy for Industry
• To increase R&D’s activities in University evaluation to Act No.18/2002P3 Sinas Iptek
• Consistency to implement Act no.12/2012 Universty to increase investation on RnD (30% spending for RnD on operational)
• International network on R&D with research concortium
• Instrument R&D Policy from government
Recommended