8152019 Surfer 8 Geology Tutorial
httpslidepdfcomreaderfullsurfer-8-geology-tutorial 122
Surfer 804
The most common application of Surfer is to create a grid-based map from an XYZ data file TheGrid | Data command uses an XYZ data file to produce a grid file The grid file is then used by moof the Map menu commands to produce maps Post maps and base maps do not use grid files
The flow chart to the right illustrates the relationship between XYZ data files grid files contourmaps and wireframes
Lesson 1 - Creating an XYZ Data File
An XYZ data file is a file containing at least three columns of data values The first two columns arthe X and Y coordinates for the data points The third column is the Z value assigned to the XYpoint Although it is not required entering the X coordinate in Column A the Y coordinate inColumn B and the Z value in Column C is a good idea Surfer looks for these coordinates in thescolumns by default
8152019 Surfer 8 Geology Tutorial
httpslidepdfcomreaderfullsurfer-8-geology-tutorial 222
Opening an Existing Data File
To look at an example of an XYZ data file you can open TUTORWS2DAT into a worksheetwindow
1 Choose the File | Open command or click the button to select the XYZ data file
2 Double-click on the SAMPLES folder In the list of files click TUTORWS2DAT and then click thOpen button to display the file in the worksheet window
3 Notice that the X coordinate (Easting) is in Column A the Y coordinate (Northing) is in ColumnB and the Z value (Elevation) is in Column C Although it is not required the header text (the tein row 1) is helpful in identifying the type of data in the column and this information is used indialog boxes when selecting worksheet columns
Creating a New Data File
The Surfer worksheet can also be used to create a data file To open a worksheet window andbegin entering data
1 Choose the File | New command or click the button
2 Click the Worksheet option in the New dialog and then click OK to display a new emptyworksheet window
8152019 Surfer 8 Geology Tutorial
httpslidepdfcomreaderfullsurfer-8-geology-tutorial 322
3 The active cell is selected by clicking on the cell or by using the arrow keys to move betweencells The active cell is indicated by a heavy border and the contents of the active cell aredisplayed in the active cell edit box
4 When a cell is active enter a value or text and the information is displayed in both the active ceand the active cell edit box
5 The BACKSPACE and DELETE keys can be used to edit data as you type
6 Press the ENTER key and the data are entered into the cell
7 To preserve the typed data in the active cell move to a new cell Move to a new cell by clickingnew cell with the pointer pressing one of the arrow keys or pressing ENTER
Saving the Data File
When you have completed entering all of the data
1 Choose the File | Save command or click the button The Save As dialog is displayed ifyou have not previously saved the data file
2 In the Save as type list choose the Golden Software Data (DAT) option
3 Type the name of the file into the File name box
4 Click Save and a GSI Data Export Options dialog opens
5 Accept the defaults in the GSI Data Export Options dialog by clicking the OK button
The file is saved in the Golden Software Data [DAT] format with the file name you specified Thename of the data file appears at the top of the worksheet window
Lesson 2 - Creating a Grid File
Grid files are required to produce a grid-based map Grid-based maps include contour mapsimage maps shaded relief maps 1-grid vector maps 2-grid vector maps wireframes and
surfaces Grid files are created using the Grid | Data command The Data command requires datain three columns one column containing X data one column containing Y data and one columncontaining Z data We have included a sample XYZ data file (TUTORWSDAT) with Surfer for youto see how to produce a grid file After completing the tutorial if you need to produce an XYZ datafile of your data for your work see Lesson 1 - Creating an XYZ Data File
To produce a grid file from TUTORWSDAT
1 If you have the worksheet window open click on the Window menu and choose Plot1 Alternatively you can create a new plot window with File | New (select Plot Document and thenclick OK)
8152019 Surfer 8 Geology Tutorial
httpslidepdfcomreaderfullsurfer-8-geology-tutorial 422
2 Choose the Grid | Data command
3 In the Open dialog click the file TUTORWSDAT (located in Surfers SAMPLES folder) Thename appears in the File name box below the list of data files
4 Click Open and the Grid Data dialog is displayed Alternatively you can double-click the data finame to display the Grid Data dialog
5 The Grid Data dialog allows you to control the gridding parameters Take a moment to look ovethe various options in the dialog Do not make changes at this time as the default parameterscreate an acceptable grid file
o The Data Columns group is used to specify the columns containing the X and Ycoordinates and the Z values in the data file
o The Grid Line Geometry group is used to specify the XY grid limits grid spacing andnumber of grid lines (also referred to as rows and columns) in the grid file
o The Gridding Method group is used to specify the interpolation method andinterpolation options
o The Output Grid File group is used to specify the path and file name for the grid fileo The Grid Report option is used to specify whether to create a statistical report for the
data
6 Click OK In the status bar at the bottom of the window a display indicates the progress of thegridding procedure By accepting the defaults the grid file uses the same path and file name asthe data file but the grid file has a [GRD] extension
7 By default a message appears after gridding the data Click OK in the grid file has been createmessage box
8 If Grid Report is checked a report is displayed You can minimize or close this report
Lesson 3 - Creating a Contour Map
The Map | Contour Map command creates a contour map based on a grid file
To create a contour map of the TUTORWSGRD file created in the previous lesson
1 Choose the Map | Contour Map | New Contour Map command or click the button
2 The Open Grid dialog is displayed The grid file you just created (TUTORWSGRD) isautomatically entered in the File name box If the file does not appear in the File name boxselect it from the file list
3 Click the Open button to create a contour map
4 The map is created using the default contour map properties
8152019 Surfer 8 Geology Tutorial
httpslidepdfcomreaderfullsurfer-8-geology-tutorial 522
5 If you want the contour map to fill the window choose the View | Fit to Window command
Opening Map Properties
After creating a map you can change the map properties There are several ways to open anobjects properties The most common method is to double-click on the object Refer to Propertiesfor alternative methods of opening properties
Changing Contour Levels
After you create a contour map you can easily modify any of the map features For example youmight want to change the contour levels displayed on the map
To change the contour levels of the map you just created
1 Place the pointer inside the limits of the contour map and double-click to display the contour maproperties dialog
2 In the contour map properties dialog click the Levels page to display the contour levels andcontour line properties for the map In this example the contour levels begin at Z = 20 Click onthe scroll bar at the right to scroll to the bottom You can see that the maximum contour level is Z= 105 for this map and that the contour interval is 5
3 To change the contour range and interval click the Level button and the Contour Levels dialogis displayed This shows the Minimum and Maximum contour level for the map and the contourInterval
4 Double-click in the Interval box and type the value 10 Click the OK button and the Levels page
is updated to reflect the change
5 Click OK in the contour map properties dialog and the map is redrawn with the new contourlevels
8152019 Surfer 8 Geology Tutorial
httpslidepdfcomreaderfullsurfer-8-geology-tutorial 622
Changing Contour Line Properties
You can double-click any of the elements in the list on the Levels page to modify the individualelement For example you can double-click an individual Z value in the list to change the Z valuefor that particular contour level You can also double-click the line style for an individual level tomodify the line properties for the selected level This provides a way to emphasize individualcontour levels on the map
To change contour line properties
1 Double-click the contour map to open the map properties
2 On the Levels page double-click the line sample for the contour level at Z = 70 to open the Lin
Properties dialog
3 You can select the line color style or width for the selected line in the Line Properties dialog the Width box click the up arrow and change the width value to 0030 in (A width of 0000 in isequivalent to one pixel width)
4 Click OK in the Line Properties dialog and the Levels page is updated to reflect the change
5 Click OK in the map properties dialog and the map is redrawn The contour line at Z = 70 isdrawn with a thicker line
8152019 Surfer 8 Geology Tutorial
httpslidepdfcomreaderfullsurfer-8-geology-tutorial 722
Adding Color Fill between Contour Lines
Color fill can be assigned to individual levels in the same way as line properties Alternatively youcan assign colors based on a gradational spectrum between two colors
The Levels page in the contour map properties dialog shows a correspondence between a level(under the Level button) and a color (under the Fill button) The colors are used to fill in the spacebetween the corresponding level and the next higher level For example if the contour levels are20 30 40 etc then the color corresponding to level 20 is used to fill in the space between thelevel 20 contour and the level 30 contour
To change color fill
1 Double-click the contour map to open the contour map properties dialog
2 Click the Fill Contours check box on the General page
3 On the Levels page click the Fill button to open the Fill dialog
4 Click the Foreground Color button to open the Color Spectrum dialog This dialog allows you to
select colors to assign to specific Z values Click on the left anchor point button above thespectrum click on the color blue in the color palette and then click OK The Foreground Color button is now displayed as a gradation from blue to white in the Fill dialog
5 Click OK and the fill colors on the Levels page are updated to reflect the change
6 Click OK and the contour map is redrawn with color fill between the contours
8152019 Surfer 8 Geology Tutorial
httpslidepdfcomreaderfullsurfer-8-geology-tutorial 822
Add Delete and Move Contour Labels
Contour label locations can be changed on an individual basis Labels can be added deleted ormoved
To add delete and move contour labels
1 Right-click on the contour map and choose the Edit Contour Labels option You can also editlabels of a selected contour map using the Map | Contour Map | Edit Labels command The
pointer changes to a black arrowhead to indicate that you are in edit mode
2 To delete a label click on the label and press the DELETE key on the keyboard For exampleclick on a 70 label and then click the DELETE key on your keyboard
3 To add a label press and hold the CTRL key on the keyboard and click on the location on thecontour line where you want the new label located Add a 60 contour label to the lower leftportion of the map
4 To move a contour label click on the label hold down the left mouse button and drag the labelMove the 70 contour label on the right portion of the map to the north
5 To exit the Edit Contour Labels mode press the ESC key
Modifying an Axis
Every contour map is created with four axes the bottom right top and left axes You can controlthe display of each axis independently of the other axes on the map In this example well changethe contour spacing and add an axis label
To modify an axis
8152019 Surfer 8 Geology Tutorial
httpslidepdfcomreaderfullsurfer-8-geology-tutorial 922
1 Move the pointer over one of the axis tick labels on the bottom X axis and left-click the mouseIn the status bar at the bottom of the plot window the words Map Bottom Axis are displayedThis indicates that you have selected the bottom axis of the contour map Additionally hollowhandles appear at each end of the axis and solid green handles appear surrounding the entiremap This indicates that the axis is a sub-object of the entire map
2 Double-click on the bottom axis to display the bottom axis properties dialog
3 In the Title box on the General page type Bottom Axis and then click the Apply button Thisplaces a title on the selected axis
4 If you cannot see the axis title select View | Zoom | Selected Notice that you do not have toclose the properties dialog to select menu commands toolbar buttons or objects in the plotwindow
5 Click on the Scaling page to display the axis scaling options In the Major Interval box type thevalue 15 and then click the Apply button This changes the spacing between major ticks alongthe selected axis
6 Click on the General page and then click the Label Format button The Label Format dialog isdisplayed
7 In the Label Format dialog select the Fixed option in the Type group Click on the down arrowon the Decimal Digits box and change the value to 1 This indicates that only one digit follows thdecimal point for the axis tick labels
8 Click OK to return to the axis properties dialog
9 Click OK in the axis properties dialog and the map is redrawn The axis tick spacing and labels
are changed and the axis title is placed below the map
8152019 Surfer 8 Geology Tutorial
httpslidepdfcomreaderfullsurfer-8-geology-tutorial 1022
Saving a Map
When you have completed the map or drawing in the plot window you can save the map to aSurfer file [SRF] containing all the information necessary to reproduce the map When you save amap all the scaling formatting and map properties are preserved in the file
To save a map
1 Choose the File | Save command or click the button The Save As dialog is displayedbecause the map has not been previously saved
2 In the File name box type TUTORWS
3 Click Save and the file is saved to the current directory with an [SRF] extension The saved maremains open and the title bar changes to reflect the name change
If you are using the demo version of Surfer you will not be able to save the map Please proceed
to Lesson 4
Exporting 3D Contours
When you have completed a contour map in the plot window you can export the contour lines witassociated Z values to an AutoCAD DXF file
To export contour lines
1 Select the map by clicking on the map in the plot window or by clicking on the word Contours the Object Manager
2 Choose Map | Contour Map | Export Contours
3 In the Save As dialog type TUTORWS into the File name box
8152019 Surfer 8 Geology Tutorial
httpslidepdfcomreaderfullsurfer-8-geology-tutorial 1122
4 Click Save and the file is exported to the current directory This creates a file titledTUTORWSDXF which can be opened in any program with an AutoCAD DXF import option
If you are using the demo version of Surfer you will not be able to export contours Please proceeto Lesson 4
Lesson 4 - Creating a Wireframe
Wireframes are three-dimensional representations of a grid file Wireframes are block diagrams generated
by drawing lines representing the grid X and Y lines (the grid columns and rows) At each intersection of a
column and row (ie at each grid node) the height of the surface is proportional to the grid Z value at that point The number of columns and rows in the grid file determines the number of X and Y lines drawn on th
wireframe
Creating a New Wireframe
To create a new wireframe
1 Select the File | New command or click the button
2 SelectPlot Document
in theNew
dialog and click OK A new empty plot window is displayed
3 Select the Map | Wireframe command or click the button
4 Choose the grid file TUTORWSGRD from the list of files in the Open Grid dialog click Openand the map is created (TUTORWSGRD created in Lesson 2 - Creating a Grid File is locatedin Surfers SAMPLES folder)
8152019 Surfer 8 Geology Tutorial
httpslidepdfcomreaderfullsurfer-8-geology-tutorial 1222
Changing the Orientation of a Wireframe
Although this example uses a wireframe to illustrate rotation and tilt you can perform this operatioon most map types in Surfer
To change rotation and tilt
1 Click on the map once to select it
2 Click the Map | Trackball command or click the button
3 Click the left mouse button and hold it while moving the mouse to the left and right This changethe rotation of the wireframe The rotation is listed in the status bar
4 Click the left mouse button and hold it while moving the mouse up and down This changes thetilt of the map The tilt is listed in the status bar
5 Once you have rotated and tilted the map click the ESC key on your keyboard to end trackballmode
Changing the rotation tilt field of view and projection can also be accomplished by double clickinthe wireframe and using the options on the View page
8152019 Surfer 8 Geology Tutorial
httpslidepdfcomreaderfullsurfer-8-geology-tutorial 1322
Changing the Scaling of a Wireframe
You can change the scaling of wireframes and surfaces in three dimensions In this example thescaling is changed and the wireframe becomes somewhat exaggerated in the Z dimension
To change the Z scaling
1 Double-click the wireframe to open the map properties
2 Click the Scale page You can set scaling by entering the number of map units per inch or byentering the length for the map in page coordinates
3 In the Length box of the Z Scale group change the value to 3 by scrolling to 3 or by highlightingthe existing value and typing 3 The Map units value changes to reflect the change you made
4 Click OK and the wireframe is redrawn exaggerated in the Z dimension
Adding Color Zones to a Wireframe
You can change the line colors of any wireframe by applying color zones In this example we willchange color zones gradationally and individually
To add a color zone to a wireframe
1 Double-click on the wireframe and the wireframe properties dialog is displayed
2 Click on the Color Zones page
3 Click on the Line button to display the Line Spectrum dialog
8152019 Surfer 8 Geology Tutorial
httpslidepdfcomreaderfullsurfer-8-geology-tutorial 1422
8152019 Surfer 8 Geology Tutorial
httpslidepdfcomreaderfullsurfer-8-geology-tutorial 1522
Lesson 5 - Posting Data Points and Working with Overlays
Post maps are created by placing points on a map and labeling the points Posting data points ona map can be useful in determining the distribution of data points as well as placing data or textinformation at specific points on the map Data files contain the XY coordinates used to position thpoints on the map Data files can also contain the labels associated with each point
Creating Post Maps
When a new post map is created it is independent of any other maps in the current plot windowWhen the two maps are displayed notice that two sets of axes are also displayed one set for eacmap When you use the Map | Overlay Maps command the two maps are combined into a singlemap overlay with one set of axes
To create a post map
1 Choose File | Open to display the Open dialog Choose TUTORIALSRF in the SAMPLES
directory and then click the Open button TUTORIALSRF opens and contains a contour map
2 Select the Map | Post Map | New Post Map command or click the button
3 Choose TUTORWSDAT from the list of files in the Open dialog (TUTORWSDAT is located inSurfers SAMPLES folder)
4 Click Open and the post map is created using the default properties
The contour map and post map are two separate maps on the page If you look closely at the Xaxis you will notice the two sets of axis tick labels for the two maps Also there are two map
frames and axes sets listed in the Object Manager We will line up the maps with the Overlay command after changing the post map properties
Changing the Post Map Properties
To change the post map properties
1 Open the Object Manager if it is not already open The Object Manager is open if there is acheck mark displayed next to the words Object Manager in the View menu If there is no checkmark click on the command once
2 Right click on the word Post in the Object Manager
3 Select Properties from the context menu
4 In the post map properties dialog General page click the symbol button to open the SymbolProperties dialog
5 Choose the filled circle symbol from the palette and click OK The selected symbol appears inthe symbol button
6 Click the Apply button and the symbol appears at the posted data points on the map
8152019 Surfer 8 Geology Tutorial
httpslidepdfcomreaderfullsurfer-8-geology-tutorial 1622
7 In the Fixed Size box (Symbol Size group) specify a size of 009 in
8 Click OK and the post map is drawn with the new symbol size
Overlaying Maps ndash Tutorial
To overlay maps
1 To see the two separate maps place the mouse pointer in the center of the maps and clickPress and hold the left mouse button and move the pointer slightly in any direction Release thebutton and the two maps are offset
2 Click Edit | Select All to select both maps
3 Choose the Map | Overlay Maps command to combine the two maps into a single compositemap
8152019 Surfer 8 Geology Tutorial
httpslidepdfcomreaderfullsurfer-8-geology-tutorial 1722
Selecting an Overlay and Assigning an Object ID
After creating a composite map you can still modify the individual overlays in the map
Selecting Maps
An individual overlay can be selected in the composite map by clicking on the overlay in the plotwindow or clicking on the overlay in the Object Manager
The easiest way to select an overlay in a composite map is to click on the overlay name in theObject Manager However you can also select the overlay in the plot window with the mouseWhenever two or more objects occupy the same position in the plot window use the CTRL key anthe left mouse button to select the desired object The CTRL key allows you to cycle through theselection of overlapping objects For example if you want to select a text block behind a rectanglehold down the CTRL key and click until the text is selected You can use the status bar to help you to
determine which object is selected
Renaming the Post Map
To select an overlay and assign an ID
1 Make sure the Object Manager is open If the Object Manager is not open click View | ObjecManager
2 Click the overlay name in the Object Manager In this case click the word Post The status bshould now report Map Post
3 Choose Edit | Object ID
4 In the Object ID dialog type the name Tutorial Post Map and click OK The status bar ObjecManager and properties dialog title reflect the name change
8152019 Surfer 8 Geology Tutorial
httpslidepdfcomreaderfullsurfer-8-geology-tutorial 1822
If you double-click on Tutorial Post Map in the Object Manager notice that the properties dialogtitle changes to Map Tutorial Post Map Properties When you rename an object in Surfer 8 theobjects properties dialog reflects the name change making it easier for you to keep track of theobject you are editing For example if you have eight post maps in the plot window it is beneficialto change the post map names to something meaningful to save time when trying to edit themThis is especially important because the properties dialog can stay open when changing selection
Adding Labels to the Post Map
You can add labels to the data points on post maps The post map can be selected by a fewdifferent methods though only the Object Manager method is discussed here
To add labels
1 Right-click on Tutorial Post Map in the Object Manager and choose Properties
2 Click on the Labels page In the Worksheet Column for Labels group click the drop-down arrowand a list of columns in TUTORWSDAT is displayed
3 Select Column C Elevation from the list
4 Click the Format button to open the Label Format dialog
5 Change the Type to Fixed and the Decimal Digits value to zero
6 Click OK to return to the post map properties dialog
7 Click OK and the overlay is redrawn with labels on each of the data points
8152019 Surfer 8 Geology Tutorial
httpslidepdfcomreaderfullsurfer-8-geology-tutorial 1922
Lesson 6 - Introducing Surfaces
Surfaces are new to Surfer 8 They are similar to wireframes except that surfaces are three-dimensional shaded renderings of a grid file Surfaces provide an impressive visual interpretationof data Surfaces can be overlaid with other surfaces so that the surfaces will intersect with eachother Surfaces can also have overlays of other map types excluding wireframes
Creating a Surface
To create a surface
1 Select the File | New command or click the button
2 Select Plot Document in the New dialog and click OK A new empty plot window is displayed
3 Select the Map | Surface command or click the button
4 Choose the grid file TUTORWSGRD from the list of files in the Open Grid dialog click Openand the surface is created using the default settings (TUTORWSGRD created in Lesson 2 -Creating a Grid File is located in Surfers SAMPLES folder)
Adding an Overlay
You can overlay base contour post image shaded relief 1-grid vector maps and 2-grid vector
maps on surfaces All overlays except other surfaces are converted into a type of bitmap knownas a texture map This texture map is then applied to the surface by stretching it and shrinking it anecessary When these maps are overlaid you have a choice on how to treat the texture map Yocan use the colors from overlays only from the surface only or blend colors from the overlays andsurface For example you could create a color filled contour map overlay the contour map andsurface and then use the colors from the contour map only
When multiple surfaces of differing elevations are overlaid the surfaces can intersect and overlapeach other If the surfaces are adjacent to each other in the X or Y direction the surfaces aredrawn side-by-side after using Map | Overlay Maps In this example we will overlay a plane withthe surface you just created
8152019 Surfer 8 Geology Tutorial
httpslidepdfcomreaderfullsurfer-8-geology-tutorial 2022
2
First create the surface plane
1 Select the Map | Surface command or click the button
2 In the Open Grid dialog open Surfers SAMPLES folder and select TUTORPLGRD
3 Click Open and the surface is created using the default settings
4 Right click on the upper 3D Surface in the Object Manager choose Object ID and add the textTUTORPLGRD to the end of the 3D Surface label to make it easier to distinguish the twosurfaces in the Object Manager list
Adding a Mesh
Mesh lines can be applied to surfaces
To add a mesh
1 Double-click on the surface to open the surface properties
2 Click the Mesh page
8152019 Surfer 8 Geology Tutorial
httpslidepdfcomreaderfullsurfer-8-geology-tutorial 2122
2
3 Check the X and Y boxes
4 Change the Frequency to 5 for the X and Y lines
5 Click the OK or Apply button to add a mesh to the selected surface
Notice that the mesh is applied to the selected surface within the composite map not to both
surfaces With all map types you can only change the map-specific properties of one map at atime Properties that apply to all overlays in the composite map include View Scale Limits andBackground
Changing Colors
Changing color schemes on surfaces is similar to changing colors on other map types such asimage maps or contour maps The Color Spectrum dialog is used to load previously defined colorschemes and it is also used to create your own color schemes
Before experimenting with color lets create a new surface map in a new plot window
1 Click File | New or click the button
2 In the New dialog select Plot Document and then click OK
3 Select the Map | Surface command or click the button
4 In the Open Grid dialog open Surfers SAMPLES folder and select any grid file [GRD]HELENS2GRD is a good choice for experimenting with color
5 Click Open and the surface is created using the default settings
To change the surface material color
1 Double-click on the surface to open the surface properties
2 There is a Material Color group on the General page Click the Upper button
3 Click the Load button in the Color Spectrum dialog
8152019 Surfer 8 Geology Tutorial
httpslidepdfcomreaderfullsurfer-8-geology-tutorial 2222
2
4 The color schemes are stored in color spectrum files containing a [CLR] extension Bydefault Surfer opens in the SAMPLES folder which contains many predefined color spectrums(Browse to the SAMPLES folder if it is not open) Click on one of the [CLR] files to select it andthen click the Open button
5 Notice that the colors and anchor node positions have changed in the Color Spectrum dialog Click OK in the Color Spectrum dialog to return to the surface map properties dialog
6 Click the Apply button in the surface map properties dialog to see your color changes Drag thesurface map properties off to the side if you cannot see the map
You can continue to experiment with the colors by clicking the Upper button and loading other colospectrum files This is the end of the tutorial If you still have questions try looking for answers inthe online help and users guide If you find you still have questions do not hesitate to contactGolden Softwarersquos technical support

8152019 Surfer 8 Geology Tutorial
httpslidepdfcomreaderfullsurfer-8-geology-tutorial 322
3 The active cell is selected by clicking on the cell or by using the arrow keys to move betweencells The active cell is indicated by a heavy border and the contents of the active cell aredisplayed in the active cell edit box
4 When a cell is active enter a value or text and the information is displayed in both the active ceand the active cell edit box
5 The BACKSPACE and DELETE keys can be used to edit data as you type
6 Press the ENTER key and the data are entered into the cell
7 To preserve the typed data in the active cell move to a new cell Move to a new cell by clickingnew cell with the pointer pressing one of the arrow keys or pressing ENTER
Saving the Data File
When you have completed entering all of the data
1 Choose the File | Save command or click the button The Save As dialog is displayed ifyou have not previously saved the data file
2 In the Save as type list choose the Golden Software Data (DAT) option
3 Type the name of the file into the File name box
4 Click Save and a GSI Data Export Options dialog opens
5 Accept the defaults in the GSI Data Export Options dialog by clicking the OK button
The file is saved in the Golden Software Data [DAT] format with the file name you specified Thename of the data file appears at the top of the worksheet window
Lesson 2 - Creating a Grid File
Grid files are required to produce a grid-based map Grid-based maps include contour mapsimage maps shaded relief maps 1-grid vector maps 2-grid vector maps wireframes and
surfaces Grid files are created using the Grid | Data command The Data command requires datain three columns one column containing X data one column containing Y data and one columncontaining Z data We have included a sample XYZ data file (TUTORWSDAT) with Surfer for youto see how to produce a grid file After completing the tutorial if you need to produce an XYZ datafile of your data for your work see Lesson 1 - Creating an XYZ Data File
To produce a grid file from TUTORWSDAT
1 If you have the worksheet window open click on the Window menu and choose Plot1 Alternatively you can create a new plot window with File | New (select Plot Document and thenclick OK)
8152019 Surfer 8 Geology Tutorial
httpslidepdfcomreaderfullsurfer-8-geology-tutorial 422
2 Choose the Grid | Data command
3 In the Open dialog click the file TUTORWSDAT (located in Surfers SAMPLES folder) Thename appears in the File name box below the list of data files
4 Click Open and the Grid Data dialog is displayed Alternatively you can double-click the data finame to display the Grid Data dialog
5 The Grid Data dialog allows you to control the gridding parameters Take a moment to look ovethe various options in the dialog Do not make changes at this time as the default parameterscreate an acceptable grid file
o The Data Columns group is used to specify the columns containing the X and Ycoordinates and the Z values in the data file
o The Grid Line Geometry group is used to specify the XY grid limits grid spacing andnumber of grid lines (also referred to as rows and columns) in the grid file
o The Gridding Method group is used to specify the interpolation method andinterpolation options
o The Output Grid File group is used to specify the path and file name for the grid fileo The Grid Report option is used to specify whether to create a statistical report for the
data
6 Click OK In the status bar at the bottom of the window a display indicates the progress of thegridding procedure By accepting the defaults the grid file uses the same path and file name asthe data file but the grid file has a [GRD] extension
7 By default a message appears after gridding the data Click OK in the grid file has been createmessage box
8 If Grid Report is checked a report is displayed You can minimize or close this report
Lesson 3 - Creating a Contour Map
The Map | Contour Map command creates a contour map based on a grid file
To create a contour map of the TUTORWSGRD file created in the previous lesson
1 Choose the Map | Contour Map | New Contour Map command or click the button
2 The Open Grid dialog is displayed The grid file you just created (TUTORWSGRD) isautomatically entered in the File name box If the file does not appear in the File name boxselect it from the file list
3 Click the Open button to create a contour map
4 The map is created using the default contour map properties
8152019 Surfer 8 Geology Tutorial
httpslidepdfcomreaderfullsurfer-8-geology-tutorial 522
5 If you want the contour map to fill the window choose the View | Fit to Window command
Opening Map Properties
After creating a map you can change the map properties There are several ways to open anobjects properties The most common method is to double-click on the object Refer to Propertiesfor alternative methods of opening properties
Changing Contour Levels
After you create a contour map you can easily modify any of the map features For example youmight want to change the contour levels displayed on the map
To change the contour levels of the map you just created
1 Place the pointer inside the limits of the contour map and double-click to display the contour maproperties dialog
2 In the contour map properties dialog click the Levels page to display the contour levels andcontour line properties for the map In this example the contour levels begin at Z = 20 Click onthe scroll bar at the right to scroll to the bottom You can see that the maximum contour level is Z= 105 for this map and that the contour interval is 5
3 To change the contour range and interval click the Level button and the Contour Levels dialogis displayed This shows the Minimum and Maximum contour level for the map and the contourInterval
4 Double-click in the Interval box and type the value 10 Click the OK button and the Levels page
is updated to reflect the change
5 Click OK in the contour map properties dialog and the map is redrawn with the new contourlevels
8152019 Surfer 8 Geology Tutorial
httpslidepdfcomreaderfullsurfer-8-geology-tutorial 622
Changing Contour Line Properties
You can double-click any of the elements in the list on the Levels page to modify the individualelement For example you can double-click an individual Z value in the list to change the Z valuefor that particular contour level You can also double-click the line style for an individual level tomodify the line properties for the selected level This provides a way to emphasize individualcontour levels on the map
To change contour line properties
1 Double-click the contour map to open the map properties
2 On the Levels page double-click the line sample for the contour level at Z = 70 to open the Lin
Properties dialog
3 You can select the line color style or width for the selected line in the Line Properties dialog the Width box click the up arrow and change the width value to 0030 in (A width of 0000 in isequivalent to one pixel width)
4 Click OK in the Line Properties dialog and the Levels page is updated to reflect the change
5 Click OK in the map properties dialog and the map is redrawn The contour line at Z = 70 isdrawn with a thicker line
8152019 Surfer 8 Geology Tutorial
httpslidepdfcomreaderfullsurfer-8-geology-tutorial 722
Adding Color Fill between Contour Lines
Color fill can be assigned to individual levels in the same way as line properties Alternatively youcan assign colors based on a gradational spectrum between two colors
The Levels page in the contour map properties dialog shows a correspondence between a level(under the Level button) and a color (under the Fill button) The colors are used to fill in the spacebetween the corresponding level and the next higher level For example if the contour levels are20 30 40 etc then the color corresponding to level 20 is used to fill in the space between thelevel 20 contour and the level 30 contour
To change color fill
1 Double-click the contour map to open the contour map properties dialog
2 Click the Fill Contours check box on the General page
3 On the Levels page click the Fill button to open the Fill dialog
4 Click the Foreground Color button to open the Color Spectrum dialog This dialog allows you to
select colors to assign to specific Z values Click on the left anchor point button above thespectrum click on the color blue in the color palette and then click OK The Foreground Color button is now displayed as a gradation from blue to white in the Fill dialog
5 Click OK and the fill colors on the Levels page are updated to reflect the change
6 Click OK and the contour map is redrawn with color fill between the contours
8152019 Surfer 8 Geology Tutorial
httpslidepdfcomreaderfullsurfer-8-geology-tutorial 822
Add Delete and Move Contour Labels
Contour label locations can be changed on an individual basis Labels can be added deleted ormoved
To add delete and move contour labels
1 Right-click on the contour map and choose the Edit Contour Labels option You can also editlabels of a selected contour map using the Map | Contour Map | Edit Labels command The
pointer changes to a black arrowhead to indicate that you are in edit mode
2 To delete a label click on the label and press the DELETE key on the keyboard For exampleclick on a 70 label and then click the DELETE key on your keyboard
3 To add a label press and hold the CTRL key on the keyboard and click on the location on thecontour line where you want the new label located Add a 60 contour label to the lower leftportion of the map
4 To move a contour label click on the label hold down the left mouse button and drag the labelMove the 70 contour label on the right portion of the map to the north
5 To exit the Edit Contour Labels mode press the ESC key
Modifying an Axis
Every contour map is created with four axes the bottom right top and left axes You can controlthe display of each axis independently of the other axes on the map In this example well changethe contour spacing and add an axis label
To modify an axis
8152019 Surfer 8 Geology Tutorial
httpslidepdfcomreaderfullsurfer-8-geology-tutorial 922
1 Move the pointer over one of the axis tick labels on the bottom X axis and left-click the mouseIn the status bar at the bottom of the plot window the words Map Bottom Axis are displayedThis indicates that you have selected the bottom axis of the contour map Additionally hollowhandles appear at each end of the axis and solid green handles appear surrounding the entiremap This indicates that the axis is a sub-object of the entire map
2 Double-click on the bottom axis to display the bottom axis properties dialog
3 In the Title box on the General page type Bottom Axis and then click the Apply button Thisplaces a title on the selected axis
4 If you cannot see the axis title select View | Zoom | Selected Notice that you do not have toclose the properties dialog to select menu commands toolbar buttons or objects in the plotwindow
5 Click on the Scaling page to display the axis scaling options In the Major Interval box type thevalue 15 and then click the Apply button This changes the spacing between major ticks alongthe selected axis
6 Click on the General page and then click the Label Format button The Label Format dialog isdisplayed
7 In the Label Format dialog select the Fixed option in the Type group Click on the down arrowon the Decimal Digits box and change the value to 1 This indicates that only one digit follows thdecimal point for the axis tick labels
8 Click OK to return to the axis properties dialog
9 Click OK in the axis properties dialog and the map is redrawn The axis tick spacing and labels
are changed and the axis title is placed below the map
8152019 Surfer 8 Geology Tutorial
httpslidepdfcomreaderfullsurfer-8-geology-tutorial 1022
Saving a Map
When you have completed the map or drawing in the plot window you can save the map to aSurfer file [SRF] containing all the information necessary to reproduce the map When you save amap all the scaling formatting and map properties are preserved in the file
To save a map
1 Choose the File | Save command or click the button The Save As dialog is displayedbecause the map has not been previously saved
2 In the File name box type TUTORWS
3 Click Save and the file is saved to the current directory with an [SRF] extension The saved maremains open and the title bar changes to reflect the name change
If you are using the demo version of Surfer you will not be able to save the map Please proceed
to Lesson 4
Exporting 3D Contours
When you have completed a contour map in the plot window you can export the contour lines witassociated Z values to an AutoCAD DXF file
To export contour lines
1 Select the map by clicking on the map in the plot window or by clicking on the word Contours the Object Manager
2 Choose Map | Contour Map | Export Contours
3 In the Save As dialog type TUTORWS into the File name box
8152019 Surfer 8 Geology Tutorial
httpslidepdfcomreaderfullsurfer-8-geology-tutorial 1122
4 Click Save and the file is exported to the current directory This creates a file titledTUTORWSDXF which can be opened in any program with an AutoCAD DXF import option
If you are using the demo version of Surfer you will not be able to export contours Please proceeto Lesson 4
Lesson 4 - Creating a Wireframe
Wireframes are three-dimensional representations of a grid file Wireframes are block diagrams generated
by drawing lines representing the grid X and Y lines (the grid columns and rows) At each intersection of a
column and row (ie at each grid node) the height of the surface is proportional to the grid Z value at that point The number of columns and rows in the grid file determines the number of X and Y lines drawn on th
wireframe
Creating a New Wireframe
To create a new wireframe
1 Select the File | New command or click the button
2 SelectPlot Document
in theNew
dialog and click OK A new empty plot window is displayed
3 Select the Map | Wireframe command or click the button
4 Choose the grid file TUTORWSGRD from the list of files in the Open Grid dialog click Openand the map is created (TUTORWSGRD created in Lesson 2 - Creating a Grid File is locatedin Surfers SAMPLES folder)
8152019 Surfer 8 Geology Tutorial
httpslidepdfcomreaderfullsurfer-8-geology-tutorial 1222
Changing the Orientation of a Wireframe
Although this example uses a wireframe to illustrate rotation and tilt you can perform this operatioon most map types in Surfer
To change rotation and tilt
1 Click on the map once to select it
2 Click the Map | Trackball command or click the button
3 Click the left mouse button and hold it while moving the mouse to the left and right This changethe rotation of the wireframe The rotation is listed in the status bar
4 Click the left mouse button and hold it while moving the mouse up and down This changes thetilt of the map The tilt is listed in the status bar
5 Once you have rotated and tilted the map click the ESC key on your keyboard to end trackballmode
Changing the rotation tilt field of view and projection can also be accomplished by double clickinthe wireframe and using the options on the View page
8152019 Surfer 8 Geology Tutorial
httpslidepdfcomreaderfullsurfer-8-geology-tutorial 1322
Changing the Scaling of a Wireframe
You can change the scaling of wireframes and surfaces in three dimensions In this example thescaling is changed and the wireframe becomes somewhat exaggerated in the Z dimension
To change the Z scaling
1 Double-click the wireframe to open the map properties
2 Click the Scale page You can set scaling by entering the number of map units per inch or byentering the length for the map in page coordinates
3 In the Length box of the Z Scale group change the value to 3 by scrolling to 3 or by highlightingthe existing value and typing 3 The Map units value changes to reflect the change you made
4 Click OK and the wireframe is redrawn exaggerated in the Z dimension
Adding Color Zones to a Wireframe
You can change the line colors of any wireframe by applying color zones In this example we willchange color zones gradationally and individually
To add a color zone to a wireframe
1 Double-click on the wireframe and the wireframe properties dialog is displayed
2 Click on the Color Zones page
3 Click on the Line button to display the Line Spectrum dialog
8152019 Surfer 8 Geology Tutorial
httpslidepdfcomreaderfullsurfer-8-geology-tutorial 1422
8152019 Surfer 8 Geology Tutorial
httpslidepdfcomreaderfullsurfer-8-geology-tutorial 1522
Lesson 5 - Posting Data Points and Working with Overlays
Post maps are created by placing points on a map and labeling the points Posting data points ona map can be useful in determining the distribution of data points as well as placing data or textinformation at specific points on the map Data files contain the XY coordinates used to position thpoints on the map Data files can also contain the labels associated with each point
Creating Post Maps
When a new post map is created it is independent of any other maps in the current plot windowWhen the two maps are displayed notice that two sets of axes are also displayed one set for eacmap When you use the Map | Overlay Maps command the two maps are combined into a singlemap overlay with one set of axes
To create a post map
1 Choose File | Open to display the Open dialog Choose TUTORIALSRF in the SAMPLES
directory and then click the Open button TUTORIALSRF opens and contains a contour map
2 Select the Map | Post Map | New Post Map command or click the button
3 Choose TUTORWSDAT from the list of files in the Open dialog (TUTORWSDAT is located inSurfers SAMPLES folder)
4 Click Open and the post map is created using the default properties
The contour map and post map are two separate maps on the page If you look closely at the Xaxis you will notice the two sets of axis tick labels for the two maps Also there are two map
frames and axes sets listed in the Object Manager We will line up the maps with the Overlay command after changing the post map properties
Changing the Post Map Properties
To change the post map properties
1 Open the Object Manager if it is not already open The Object Manager is open if there is acheck mark displayed next to the words Object Manager in the View menu If there is no checkmark click on the command once
2 Right click on the word Post in the Object Manager
3 Select Properties from the context menu
4 In the post map properties dialog General page click the symbol button to open the SymbolProperties dialog
5 Choose the filled circle symbol from the palette and click OK The selected symbol appears inthe symbol button
6 Click the Apply button and the symbol appears at the posted data points on the map
8152019 Surfer 8 Geology Tutorial
httpslidepdfcomreaderfullsurfer-8-geology-tutorial 1622
7 In the Fixed Size box (Symbol Size group) specify a size of 009 in
8 Click OK and the post map is drawn with the new symbol size
Overlaying Maps ndash Tutorial
To overlay maps
1 To see the two separate maps place the mouse pointer in the center of the maps and clickPress and hold the left mouse button and move the pointer slightly in any direction Release thebutton and the two maps are offset
2 Click Edit | Select All to select both maps
3 Choose the Map | Overlay Maps command to combine the two maps into a single compositemap
8152019 Surfer 8 Geology Tutorial
httpslidepdfcomreaderfullsurfer-8-geology-tutorial 1722
Selecting an Overlay and Assigning an Object ID
After creating a composite map you can still modify the individual overlays in the map
Selecting Maps
An individual overlay can be selected in the composite map by clicking on the overlay in the plotwindow or clicking on the overlay in the Object Manager
The easiest way to select an overlay in a composite map is to click on the overlay name in theObject Manager However you can also select the overlay in the plot window with the mouseWhenever two or more objects occupy the same position in the plot window use the CTRL key anthe left mouse button to select the desired object The CTRL key allows you to cycle through theselection of overlapping objects For example if you want to select a text block behind a rectanglehold down the CTRL key and click until the text is selected You can use the status bar to help you to
determine which object is selected
Renaming the Post Map
To select an overlay and assign an ID
1 Make sure the Object Manager is open If the Object Manager is not open click View | ObjecManager
2 Click the overlay name in the Object Manager In this case click the word Post The status bshould now report Map Post
3 Choose Edit | Object ID
4 In the Object ID dialog type the name Tutorial Post Map and click OK The status bar ObjecManager and properties dialog title reflect the name change
8152019 Surfer 8 Geology Tutorial
httpslidepdfcomreaderfullsurfer-8-geology-tutorial 1822
If you double-click on Tutorial Post Map in the Object Manager notice that the properties dialogtitle changes to Map Tutorial Post Map Properties When you rename an object in Surfer 8 theobjects properties dialog reflects the name change making it easier for you to keep track of theobject you are editing For example if you have eight post maps in the plot window it is beneficialto change the post map names to something meaningful to save time when trying to edit themThis is especially important because the properties dialog can stay open when changing selection
Adding Labels to the Post Map
You can add labels to the data points on post maps The post map can be selected by a fewdifferent methods though only the Object Manager method is discussed here
To add labels
1 Right-click on Tutorial Post Map in the Object Manager and choose Properties
2 Click on the Labels page In the Worksheet Column for Labels group click the drop-down arrowand a list of columns in TUTORWSDAT is displayed
3 Select Column C Elevation from the list
4 Click the Format button to open the Label Format dialog
5 Change the Type to Fixed and the Decimal Digits value to zero
6 Click OK to return to the post map properties dialog
7 Click OK and the overlay is redrawn with labels on each of the data points
8152019 Surfer 8 Geology Tutorial
httpslidepdfcomreaderfullsurfer-8-geology-tutorial 1922
Lesson 6 - Introducing Surfaces
Surfaces are new to Surfer 8 They are similar to wireframes except that surfaces are three-dimensional shaded renderings of a grid file Surfaces provide an impressive visual interpretationof data Surfaces can be overlaid with other surfaces so that the surfaces will intersect with eachother Surfaces can also have overlays of other map types excluding wireframes
Creating a Surface
To create a surface
1 Select the File | New command or click the button
2 Select Plot Document in the New dialog and click OK A new empty plot window is displayed
3 Select the Map | Surface command or click the button
4 Choose the grid file TUTORWSGRD from the list of files in the Open Grid dialog click Openand the surface is created using the default settings (TUTORWSGRD created in Lesson 2 -Creating a Grid File is located in Surfers SAMPLES folder)
Adding an Overlay
You can overlay base contour post image shaded relief 1-grid vector maps and 2-grid vector
maps on surfaces All overlays except other surfaces are converted into a type of bitmap knownas a texture map This texture map is then applied to the surface by stretching it and shrinking it anecessary When these maps are overlaid you have a choice on how to treat the texture map Yocan use the colors from overlays only from the surface only or blend colors from the overlays andsurface For example you could create a color filled contour map overlay the contour map andsurface and then use the colors from the contour map only
When multiple surfaces of differing elevations are overlaid the surfaces can intersect and overlapeach other If the surfaces are adjacent to each other in the X or Y direction the surfaces aredrawn side-by-side after using Map | Overlay Maps In this example we will overlay a plane withthe surface you just created
8152019 Surfer 8 Geology Tutorial
httpslidepdfcomreaderfullsurfer-8-geology-tutorial 2022
2
First create the surface plane
1 Select the Map | Surface command or click the button
2 In the Open Grid dialog open Surfers SAMPLES folder and select TUTORPLGRD
3 Click Open and the surface is created using the default settings
4 Right click on the upper 3D Surface in the Object Manager choose Object ID and add the textTUTORPLGRD to the end of the 3D Surface label to make it easier to distinguish the twosurfaces in the Object Manager list
Adding a Mesh
Mesh lines can be applied to surfaces
To add a mesh
1 Double-click on the surface to open the surface properties
2 Click the Mesh page
8152019 Surfer 8 Geology Tutorial
httpslidepdfcomreaderfullsurfer-8-geology-tutorial 2122
2
3 Check the X and Y boxes
4 Change the Frequency to 5 for the X and Y lines
5 Click the OK or Apply button to add a mesh to the selected surface
Notice that the mesh is applied to the selected surface within the composite map not to both
surfaces With all map types you can only change the map-specific properties of one map at atime Properties that apply to all overlays in the composite map include View Scale Limits andBackground
Changing Colors
Changing color schemes on surfaces is similar to changing colors on other map types such asimage maps or contour maps The Color Spectrum dialog is used to load previously defined colorschemes and it is also used to create your own color schemes
Before experimenting with color lets create a new surface map in a new plot window
1 Click File | New or click the button
2 In the New dialog select Plot Document and then click OK
3 Select the Map | Surface command or click the button
4 In the Open Grid dialog open Surfers SAMPLES folder and select any grid file [GRD]HELENS2GRD is a good choice for experimenting with color
5 Click Open and the surface is created using the default settings
To change the surface material color
1 Double-click on the surface to open the surface properties
2 There is a Material Color group on the General page Click the Upper button
3 Click the Load button in the Color Spectrum dialog
8152019 Surfer 8 Geology Tutorial
httpslidepdfcomreaderfullsurfer-8-geology-tutorial 2222
2
4 The color schemes are stored in color spectrum files containing a [CLR] extension Bydefault Surfer opens in the SAMPLES folder which contains many predefined color spectrums(Browse to the SAMPLES folder if it is not open) Click on one of the [CLR] files to select it andthen click the Open button
5 Notice that the colors and anchor node positions have changed in the Color Spectrum dialog Click OK in the Color Spectrum dialog to return to the surface map properties dialog
6 Click the Apply button in the surface map properties dialog to see your color changes Drag thesurface map properties off to the side if you cannot see the map
You can continue to experiment with the colors by clicking the Upper button and loading other colospectrum files This is the end of the tutorial If you still have questions try looking for answers inthe online help and users guide If you find you still have questions do not hesitate to contactGolden Softwarersquos technical support
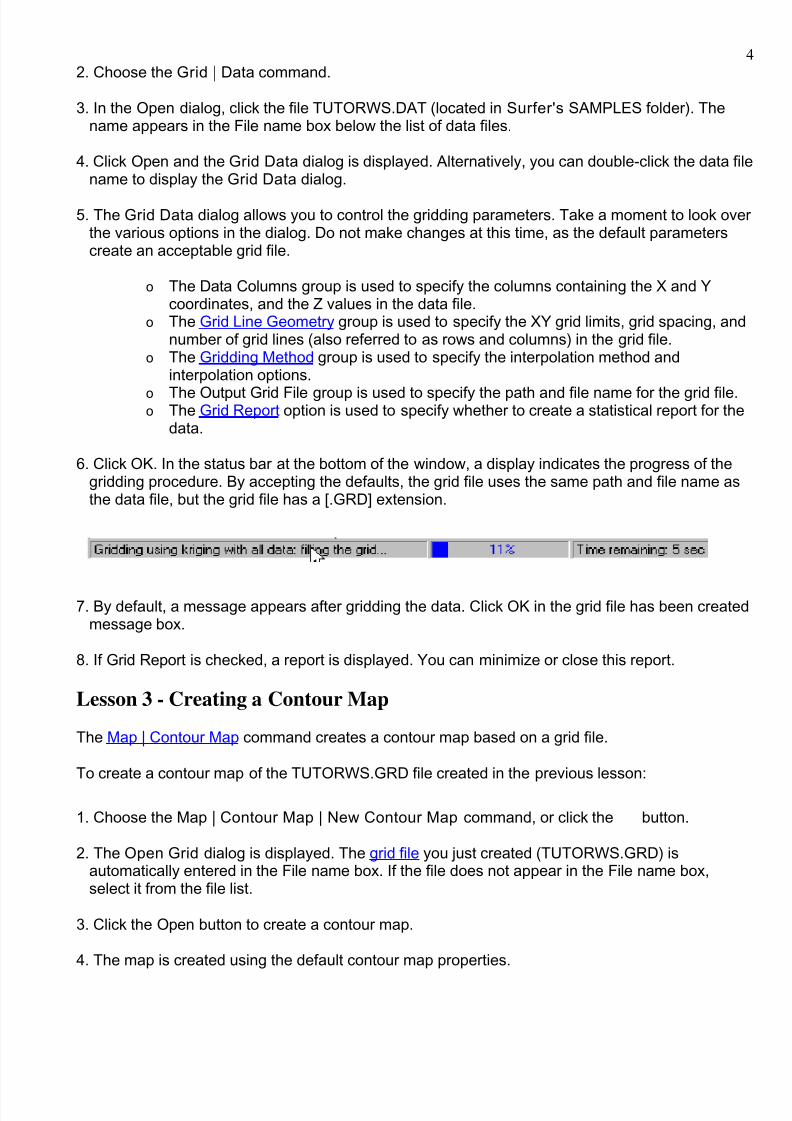
8152019 Surfer 8 Geology Tutorial
httpslidepdfcomreaderfullsurfer-8-geology-tutorial 422
2 Choose the Grid | Data command
3 In the Open dialog click the file TUTORWSDAT (located in Surfers SAMPLES folder) Thename appears in the File name box below the list of data files
4 Click Open and the Grid Data dialog is displayed Alternatively you can double-click the data finame to display the Grid Data dialog
5 The Grid Data dialog allows you to control the gridding parameters Take a moment to look ovethe various options in the dialog Do not make changes at this time as the default parameterscreate an acceptable grid file
o The Data Columns group is used to specify the columns containing the X and Ycoordinates and the Z values in the data file
o The Grid Line Geometry group is used to specify the XY grid limits grid spacing andnumber of grid lines (also referred to as rows and columns) in the grid file
o The Gridding Method group is used to specify the interpolation method andinterpolation options
o The Output Grid File group is used to specify the path and file name for the grid fileo The Grid Report option is used to specify whether to create a statistical report for the
data
6 Click OK In the status bar at the bottom of the window a display indicates the progress of thegridding procedure By accepting the defaults the grid file uses the same path and file name asthe data file but the grid file has a [GRD] extension
7 By default a message appears after gridding the data Click OK in the grid file has been createmessage box
8 If Grid Report is checked a report is displayed You can minimize or close this report
Lesson 3 - Creating a Contour Map
The Map | Contour Map command creates a contour map based on a grid file
To create a contour map of the TUTORWSGRD file created in the previous lesson
1 Choose the Map | Contour Map | New Contour Map command or click the button
2 The Open Grid dialog is displayed The grid file you just created (TUTORWSGRD) isautomatically entered in the File name box If the file does not appear in the File name boxselect it from the file list
3 Click the Open button to create a contour map
4 The map is created using the default contour map properties
8152019 Surfer 8 Geology Tutorial
httpslidepdfcomreaderfullsurfer-8-geology-tutorial 522
5 If you want the contour map to fill the window choose the View | Fit to Window command
Opening Map Properties
After creating a map you can change the map properties There are several ways to open anobjects properties The most common method is to double-click on the object Refer to Propertiesfor alternative methods of opening properties
Changing Contour Levels
After you create a contour map you can easily modify any of the map features For example youmight want to change the contour levels displayed on the map
To change the contour levels of the map you just created
1 Place the pointer inside the limits of the contour map and double-click to display the contour maproperties dialog
2 In the contour map properties dialog click the Levels page to display the contour levels andcontour line properties for the map In this example the contour levels begin at Z = 20 Click onthe scroll bar at the right to scroll to the bottom You can see that the maximum contour level is Z= 105 for this map and that the contour interval is 5
3 To change the contour range and interval click the Level button and the Contour Levels dialogis displayed This shows the Minimum and Maximum contour level for the map and the contourInterval
4 Double-click in the Interval box and type the value 10 Click the OK button and the Levels page
is updated to reflect the change
5 Click OK in the contour map properties dialog and the map is redrawn with the new contourlevels
8152019 Surfer 8 Geology Tutorial
httpslidepdfcomreaderfullsurfer-8-geology-tutorial 622
Changing Contour Line Properties
You can double-click any of the elements in the list on the Levels page to modify the individualelement For example you can double-click an individual Z value in the list to change the Z valuefor that particular contour level You can also double-click the line style for an individual level tomodify the line properties for the selected level This provides a way to emphasize individualcontour levels on the map
To change contour line properties
1 Double-click the contour map to open the map properties
2 On the Levels page double-click the line sample for the contour level at Z = 70 to open the Lin
Properties dialog
3 You can select the line color style or width for the selected line in the Line Properties dialog the Width box click the up arrow and change the width value to 0030 in (A width of 0000 in isequivalent to one pixel width)
4 Click OK in the Line Properties dialog and the Levels page is updated to reflect the change
5 Click OK in the map properties dialog and the map is redrawn The contour line at Z = 70 isdrawn with a thicker line
8152019 Surfer 8 Geology Tutorial
httpslidepdfcomreaderfullsurfer-8-geology-tutorial 722
Adding Color Fill between Contour Lines
Color fill can be assigned to individual levels in the same way as line properties Alternatively youcan assign colors based on a gradational spectrum between two colors
The Levels page in the contour map properties dialog shows a correspondence between a level(under the Level button) and a color (under the Fill button) The colors are used to fill in the spacebetween the corresponding level and the next higher level For example if the contour levels are20 30 40 etc then the color corresponding to level 20 is used to fill in the space between thelevel 20 contour and the level 30 contour
To change color fill
1 Double-click the contour map to open the contour map properties dialog
2 Click the Fill Contours check box on the General page
3 On the Levels page click the Fill button to open the Fill dialog
4 Click the Foreground Color button to open the Color Spectrum dialog This dialog allows you to
select colors to assign to specific Z values Click on the left anchor point button above thespectrum click on the color blue in the color palette and then click OK The Foreground Color button is now displayed as a gradation from blue to white in the Fill dialog
5 Click OK and the fill colors on the Levels page are updated to reflect the change
6 Click OK and the contour map is redrawn with color fill between the contours
8152019 Surfer 8 Geology Tutorial
httpslidepdfcomreaderfullsurfer-8-geology-tutorial 822
Add Delete and Move Contour Labels
Contour label locations can be changed on an individual basis Labels can be added deleted ormoved
To add delete and move contour labels
1 Right-click on the contour map and choose the Edit Contour Labels option You can also editlabels of a selected contour map using the Map | Contour Map | Edit Labels command The
pointer changes to a black arrowhead to indicate that you are in edit mode
2 To delete a label click on the label and press the DELETE key on the keyboard For exampleclick on a 70 label and then click the DELETE key on your keyboard
3 To add a label press and hold the CTRL key on the keyboard and click on the location on thecontour line where you want the new label located Add a 60 contour label to the lower leftportion of the map
4 To move a contour label click on the label hold down the left mouse button and drag the labelMove the 70 contour label on the right portion of the map to the north
5 To exit the Edit Contour Labels mode press the ESC key
Modifying an Axis
Every contour map is created with four axes the bottom right top and left axes You can controlthe display of each axis independently of the other axes on the map In this example well changethe contour spacing and add an axis label
To modify an axis
8152019 Surfer 8 Geology Tutorial
httpslidepdfcomreaderfullsurfer-8-geology-tutorial 922
1 Move the pointer over one of the axis tick labels on the bottom X axis and left-click the mouseIn the status bar at the bottom of the plot window the words Map Bottom Axis are displayedThis indicates that you have selected the bottom axis of the contour map Additionally hollowhandles appear at each end of the axis and solid green handles appear surrounding the entiremap This indicates that the axis is a sub-object of the entire map
2 Double-click on the bottom axis to display the bottom axis properties dialog
3 In the Title box on the General page type Bottom Axis and then click the Apply button Thisplaces a title on the selected axis
4 If you cannot see the axis title select View | Zoom | Selected Notice that you do not have toclose the properties dialog to select menu commands toolbar buttons or objects in the plotwindow
5 Click on the Scaling page to display the axis scaling options In the Major Interval box type thevalue 15 and then click the Apply button This changes the spacing between major ticks alongthe selected axis
6 Click on the General page and then click the Label Format button The Label Format dialog isdisplayed
7 In the Label Format dialog select the Fixed option in the Type group Click on the down arrowon the Decimal Digits box and change the value to 1 This indicates that only one digit follows thdecimal point for the axis tick labels
8 Click OK to return to the axis properties dialog
9 Click OK in the axis properties dialog and the map is redrawn The axis tick spacing and labels
are changed and the axis title is placed below the map
8152019 Surfer 8 Geology Tutorial
httpslidepdfcomreaderfullsurfer-8-geology-tutorial 1022
Saving a Map
When you have completed the map or drawing in the plot window you can save the map to aSurfer file [SRF] containing all the information necessary to reproduce the map When you save amap all the scaling formatting and map properties are preserved in the file
To save a map
1 Choose the File | Save command or click the button The Save As dialog is displayedbecause the map has not been previously saved
2 In the File name box type TUTORWS
3 Click Save and the file is saved to the current directory with an [SRF] extension The saved maremains open and the title bar changes to reflect the name change
If you are using the demo version of Surfer you will not be able to save the map Please proceed
to Lesson 4
Exporting 3D Contours
When you have completed a contour map in the plot window you can export the contour lines witassociated Z values to an AutoCAD DXF file
To export contour lines
1 Select the map by clicking on the map in the plot window or by clicking on the word Contours the Object Manager
2 Choose Map | Contour Map | Export Contours
3 In the Save As dialog type TUTORWS into the File name box
8152019 Surfer 8 Geology Tutorial
httpslidepdfcomreaderfullsurfer-8-geology-tutorial 1122
4 Click Save and the file is exported to the current directory This creates a file titledTUTORWSDXF which can be opened in any program with an AutoCAD DXF import option
If you are using the demo version of Surfer you will not be able to export contours Please proceeto Lesson 4
Lesson 4 - Creating a Wireframe
Wireframes are three-dimensional representations of a grid file Wireframes are block diagrams generated
by drawing lines representing the grid X and Y lines (the grid columns and rows) At each intersection of a
column and row (ie at each grid node) the height of the surface is proportional to the grid Z value at that point The number of columns and rows in the grid file determines the number of X and Y lines drawn on th
wireframe
Creating a New Wireframe
To create a new wireframe
1 Select the File | New command or click the button
2 SelectPlot Document
in theNew
dialog and click OK A new empty plot window is displayed
3 Select the Map | Wireframe command or click the button
4 Choose the grid file TUTORWSGRD from the list of files in the Open Grid dialog click Openand the map is created (TUTORWSGRD created in Lesson 2 - Creating a Grid File is locatedin Surfers SAMPLES folder)
8152019 Surfer 8 Geology Tutorial
httpslidepdfcomreaderfullsurfer-8-geology-tutorial 1222
Changing the Orientation of a Wireframe
Although this example uses a wireframe to illustrate rotation and tilt you can perform this operatioon most map types in Surfer
To change rotation and tilt
1 Click on the map once to select it
2 Click the Map | Trackball command or click the button
3 Click the left mouse button and hold it while moving the mouse to the left and right This changethe rotation of the wireframe The rotation is listed in the status bar
4 Click the left mouse button and hold it while moving the mouse up and down This changes thetilt of the map The tilt is listed in the status bar
5 Once you have rotated and tilted the map click the ESC key on your keyboard to end trackballmode
Changing the rotation tilt field of view and projection can also be accomplished by double clickinthe wireframe and using the options on the View page
8152019 Surfer 8 Geology Tutorial
httpslidepdfcomreaderfullsurfer-8-geology-tutorial 1322
Changing the Scaling of a Wireframe
You can change the scaling of wireframes and surfaces in three dimensions In this example thescaling is changed and the wireframe becomes somewhat exaggerated in the Z dimension
To change the Z scaling
1 Double-click the wireframe to open the map properties
2 Click the Scale page You can set scaling by entering the number of map units per inch or byentering the length for the map in page coordinates
3 In the Length box of the Z Scale group change the value to 3 by scrolling to 3 or by highlightingthe existing value and typing 3 The Map units value changes to reflect the change you made
4 Click OK and the wireframe is redrawn exaggerated in the Z dimension
Adding Color Zones to a Wireframe
You can change the line colors of any wireframe by applying color zones In this example we willchange color zones gradationally and individually
To add a color zone to a wireframe
1 Double-click on the wireframe and the wireframe properties dialog is displayed
2 Click on the Color Zones page
3 Click on the Line button to display the Line Spectrum dialog
8152019 Surfer 8 Geology Tutorial
httpslidepdfcomreaderfullsurfer-8-geology-tutorial 1422
8152019 Surfer 8 Geology Tutorial
httpslidepdfcomreaderfullsurfer-8-geology-tutorial 1522
Lesson 5 - Posting Data Points and Working with Overlays
Post maps are created by placing points on a map and labeling the points Posting data points ona map can be useful in determining the distribution of data points as well as placing data or textinformation at specific points on the map Data files contain the XY coordinates used to position thpoints on the map Data files can also contain the labels associated with each point
Creating Post Maps
When a new post map is created it is independent of any other maps in the current plot windowWhen the two maps are displayed notice that two sets of axes are also displayed one set for eacmap When you use the Map | Overlay Maps command the two maps are combined into a singlemap overlay with one set of axes
To create a post map
1 Choose File | Open to display the Open dialog Choose TUTORIALSRF in the SAMPLES
directory and then click the Open button TUTORIALSRF opens and contains a contour map
2 Select the Map | Post Map | New Post Map command or click the button
3 Choose TUTORWSDAT from the list of files in the Open dialog (TUTORWSDAT is located inSurfers SAMPLES folder)
4 Click Open and the post map is created using the default properties
The contour map and post map are two separate maps on the page If you look closely at the Xaxis you will notice the two sets of axis tick labels for the two maps Also there are two map
frames and axes sets listed in the Object Manager We will line up the maps with the Overlay command after changing the post map properties
Changing the Post Map Properties
To change the post map properties
1 Open the Object Manager if it is not already open The Object Manager is open if there is acheck mark displayed next to the words Object Manager in the View menu If there is no checkmark click on the command once
2 Right click on the word Post in the Object Manager
3 Select Properties from the context menu
4 In the post map properties dialog General page click the symbol button to open the SymbolProperties dialog
5 Choose the filled circle symbol from the palette and click OK The selected symbol appears inthe symbol button
6 Click the Apply button and the symbol appears at the posted data points on the map
8152019 Surfer 8 Geology Tutorial
httpslidepdfcomreaderfullsurfer-8-geology-tutorial 1622
7 In the Fixed Size box (Symbol Size group) specify a size of 009 in
8 Click OK and the post map is drawn with the new symbol size
Overlaying Maps ndash Tutorial
To overlay maps
1 To see the two separate maps place the mouse pointer in the center of the maps and clickPress and hold the left mouse button and move the pointer slightly in any direction Release thebutton and the two maps are offset
2 Click Edit | Select All to select both maps
3 Choose the Map | Overlay Maps command to combine the two maps into a single compositemap
8152019 Surfer 8 Geology Tutorial
httpslidepdfcomreaderfullsurfer-8-geology-tutorial 1722
Selecting an Overlay and Assigning an Object ID
After creating a composite map you can still modify the individual overlays in the map
Selecting Maps
An individual overlay can be selected in the composite map by clicking on the overlay in the plotwindow or clicking on the overlay in the Object Manager
The easiest way to select an overlay in a composite map is to click on the overlay name in theObject Manager However you can also select the overlay in the plot window with the mouseWhenever two or more objects occupy the same position in the plot window use the CTRL key anthe left mouse button to select the desired object The CTRL key allows you to cycle through theselection of overlapping objects For example if you want to select a text block behind a rectanglehold down the CTRL key and click until the text is selected You can use the status bar to help you to
determine which object is selected
Renaming the Post Map
To select an overlay and assign an ID
1 Make sure the Object Manager is open If the Object Manager is not open click View | ObjecManager
2 Click the overlay name in the Object Manager In this case click the word Post The status bshould now report Map Post
3 Choose Edit | Object ID
4 In the Object ID dialog type the name Tutorial Post Map and click OK The status bar ObjecManager and properties dialog title reflect the name change
8152019 Surfer 8 Geology Tutorial
httpslidepdfcomreaderfullsurfer-8-geology-tutorial 1822
If you double-click on Tutorial Post Map in the Object Manager notice that the properties dialogtitle changes to Map Tutorial Post Map Properties When you rename an object in Surfer 8 theobjects properties dialog reflects the name change making it easier for you to keep track of theobject you are editing For example if you have eight post maps in the plot window it is beneficialto change the post map names to something meaningful to save time when trying to edit themThis is especially important because the properties dialog can stay open when changing selection
Adding Labels to the Post Map
You can add labels to the data points on post maps The post map can be selected by a fewdifferent methods though only the Object Manager method is discussed here
To add labels
1 Right-click on Tutorial Post Map in the Object Manager and choose Properties
2 Click on the Labels page In the Worksheet Column for Labels group click the drop-down arrowand a list of columns in TUTORWSDAT is displayed
3 Select Column C Elevation from the list
4 Click the Format button to open the Label Format dialog
5 Change the Type to Fixed and the Decimal Digits value to zero
6 Click OK to return to the post map properties dialog
7 Click OK and the overlay is redrawn with labels on each of the data points
8152019 Surfer 8 Geology Tutorial
httpslidepdfcomreaderfullsurfer-8-geology-tutorial 1922
Lesson 6 - Introducing Surfaces
Surfaces are new to Surfer 8 They are similar to wireframes except that surfaces are three-dimensional shaded renderings of a grid file Surfaces provide an impressive visual interpretationof data Surfaces can be overlaid with other surfaces so that the surfaces will intersect with eachother Surfaces can also have overlays of other map types excluding wireframes
Creating a Surface
To create a surface
1 Select the File | New command or click the button
2 Select Plot Document in the New dialog and click OK A new empty plot window is displayed
3 Select the Map | Surface command or click the button
4 Choose the grid file TUTORWSGRD from the list of files in the Open Grid dialog click Openand the surface is created using the default settings (TUTORWSGRD created in Lesson 2 -Creating a Grid File is located in Surfers SAMPLES folder)
Adding an Overlay
You can overlay base contour post image shaded relief 1-grid vector maps and 2-grid vector
maps on surfaces All overlays except other surfaces are converted into a type of bitmap knownas a texture map This texture map is then applied to the surface by stretching it and shrinking it anecessary When these maps are overlaid you have a choice on how to treat the texture map Yocan use the colors from overlays only from the surface only or blend colors from the overlays andsurface For example you could create a color filled contour map overlay the contour map andsurface and then use the colors from the contour map only
When multiple surfaces of differing elevations are overlaid the surfaces can intersect and overlapeach other If the surfaces are adjacent to each other in the X or Y direction the surfaces aredrawn side-by-side after using Map | Overlay Maps In this example we will overlay a plane withthe surface you just created
8152019 Surfer 8 Geology Tutorial
httpslidepdfcomreaderfullsurfer-8-geology-tutorial 2022
2
First create the surface plane
1 Select the Map | Surface command or click the button
2 In the Open Grid dialog open Surfers SAMPLES folder and select TUTORPLGRD
3 Click Open and the surface is created using the default settings
4 Right click on the upper 3D Surface in the Object Manager choose Object ID and add the textTUTORPLGRD to the end of the 3D Surface label to make it easier to distinguish the twosurfaces in the Object Manager list
Adding a Mesh
Mesh lines can be applied to surfaces
To add a mesh
1 Double-click on the surface to open the surface properties
2 Click the Mesh page
8152019 Surfer 8 Geology Tutorial
httpslidepdfcomreaderfullsurfer-8-geology-tutorial 2122
2
3 Check the X and Y boxes
4 Change the Frequency to 5 for the X and Y lines
5 Click the OK or Apply button to add a mesh to the selected surface
Notice that the mesh is applied to the selected surface within the composite map not to both
surfaces With all map types you can only change the map-specific properties of one map at atime Properties that apply to all overlays in the composite map include View Scale Limits andBackground
Changing Colors
Changing color schemes on surfaces is similar to changing colors on other map types such asimage maps or contour maps The Color Spectrum dialog is used to load previously defined colorschemes and it is also used to create your own color schemes
Before experimenting with color lets create a new surface map in a new plot window
1 Click File | New or click the button
2 In the New dialog select Plot Document and then click OK
3 Select the Map | Surface command or click the button
4 In the Open Grid dialog open Surfers SAMPLES folder and select any grid file [GRD]HELENS2GRD is a good choice for experimenting with color
5 Click Open and the surface is created using the default settings
To change the surface material color
1 Double-click on the surface to open the surface properties
2 There is a Material Color group on the General page Click the Upper button
3 Click the Load button in the Color Spectrum dialog
8152019 Surfer 8 Geology Tutorial
httpslidepdfcomreaderfullsurfer-8-geology-tutorial 2222
2
4 The color schemes are stored in color spectrum files containing a [CLR] extension Bydefault Surfer opens in the SAMPLES folder which contains many predefined color spectrums(Browse to the SAMPLES folder if it is not open) Click on one of the [CLR] files to select it andthen click the Open button
5 Notice that the colors and anchor node positions have changed in the Color Spectrum dialog Click OK in the Color Spectrum dialog to return to the surface map properties dialog
6 Click the Apply button in the surface map properties dialog to see your color changes Drag thesurface map properties off to the side if you cannot see the map
You can continue to experiment with the colors by clicking the Upper button and loading other colospectrum files This is the end of the tutorial If you still have questions try looking for answers inthe online help and users guide If you find you still have questions do not hesitate to contactGolden Softwarersquos technical support
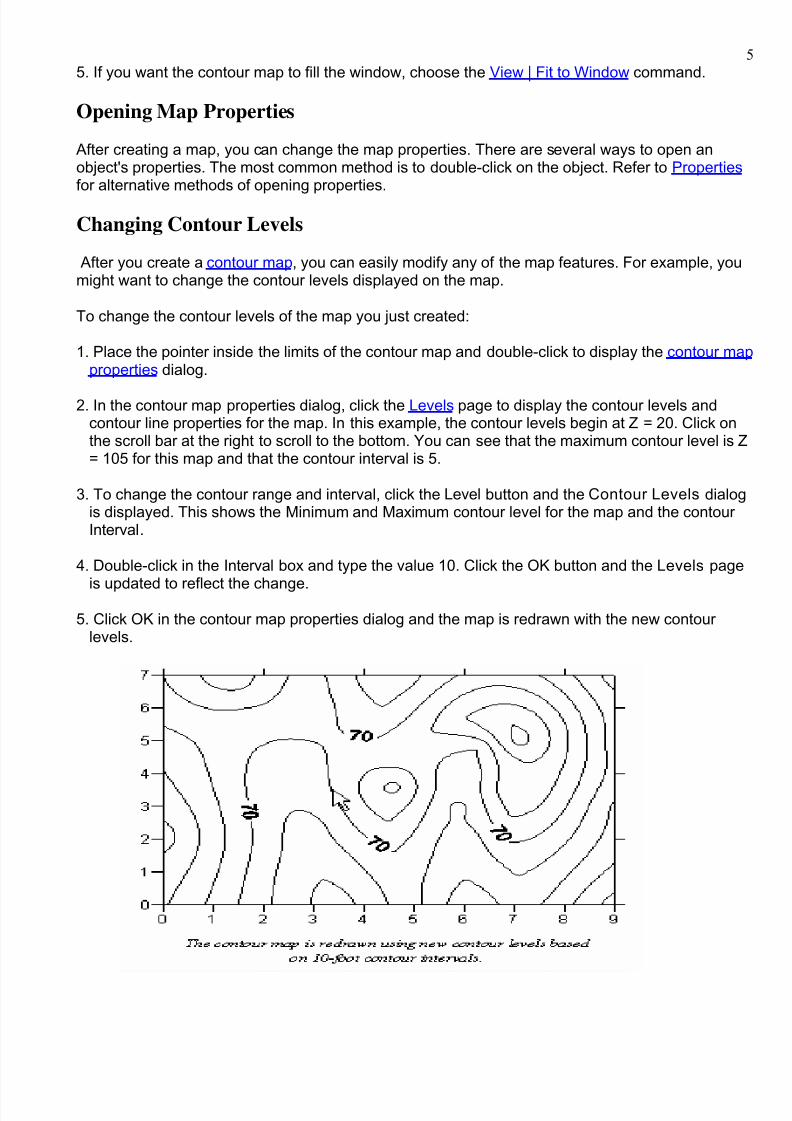
8152019 Surfer 8 Geology Tutorial
httpslidepdfcomreaderfullsurfer-8-geology-tutorial 622
Changing Contour Line Properties
You can double-click any of the elements in the list on the Levels page to modify the individualelement For example you can double-click an individual Z value in the list to change the Z valuefor that particular contour level You can also double-click the line style for an individual level tomodify the line properties for the selected level This provides a way to emphasize individualcontour levels on the map
To change contour line properties
1 Double-click the contour map to open the map properties
2 On the Levels page double-click the line sample for the contour level at Z = 70 to open the Lin
Properties dialog
3 You can select the line color style or width for the selected line in the Line Properties dialog the Width box click the up arrow and change the width value to 0030 in (A width of 0000 in isequivalent to one pixel width)
4 Click OK in the Line Properties dialog and the Levels page is updated to reflect the change
5 Click OK in the map properties dialog and the map is redrawn The contour line at Z = 70 isdrawn with a thicker line
8152019 Surfer 8 Geology Tutorial
httpslidepdfcomreaderfullsurfer-8-geology-tutorial 722
Adding Color Fill between Contour Lines
Color fill can be assigned to individual levels in the same way as line properties Alternatively youcan assign colors based on a gradational spectrum between two colors
The Levels page in the contour map properties dialog shows a correspondence between a level(under the Level button) and a color (under the Fill button) The colors are used to fill in the spacebetween the corresponding level and the next higher level For example if the contour levels are20 30 40 etc then the color corresponding to level 20 is used to fill in the space between thelevel 20 contour and the level 30 contour
To change color fill
1 Double-click the contour map to open the contour map properties dialog
2 Click the Fill Contours check box on the General page
3 On the Levels page click the Fill button to open the Fill dialog
4 Click the Foreground Color button to open the Color Spectrum dialog This dialog allows you to
select colors to assign to specific Z values Click on the left anchor point button above thespectrum click on the color blue in the color palette and then click OK The Foreground Color button is now displayed as a gradation from blue to white in the Fill dialog
5 Click OK and the fill colors on the Levels page are updated to reflect the change
6 Click OK and the contour map is redrawn with color fill between the contours
8152019 Surfer 8 Geology Tutorial
httpslidepdfcomreaderfullsurfer-8-geology-tutorial 822
Add Delete and Move Contour Labels
Contour label locations can be changed on an individual basis Labels can be added deleted ormoved
To add delete and move contour labels
1 Right-click on the contour map and choose the Edit Contour Labels option You can also editlabels of a selected contour map using the Map | Contour Map | Edit Labels command The
pointer changes to a black arrowhead to indicate that you are in edit mode
2 To delete a label click on the label and press the DELETE key on the keyboard For exampleclick on a 70 label and then click the DELETE key on your keyboard
3 To add a label press and hold the CTRL key on the keyboard and click on the location on thecontour line where you want the new label located Add a 60 contour label to the lower leftportion of the map
4 To move a contour label click on the label hold down the left mouse button and drag the labelMove the 70 contour label on the right portion of the map to the north
5 To exit the Edit Contour Labels mode press the ESC key
Modifying an Axis
Every contour map is created with four axes the bottom right top and left axes You can controlthe display of each axis independently of the other axes on the map In this example well changethe contour spacing and add an axis label
To modify an axis
8152019 Surfer 8 Geology Tutorial
httpslidepdfcomreaderfullsurfer-8-geology-tutorial 922
1 Move the pointer over one of the axis tick labels on the bottom X axis and left-click the mouseIn the status bar at the bottom of the plot window the words Map Bottom Axis are displayedThis indicates that you have selected the bottom axis of the contour map Additionally hollowhandles appear at each end of the axis and solid green handles appear surrounding the entiremap This indicates that the axis is a sub-object of the entire map
2 Double-click on the bottom axis to display the bottom axis properties dialog
3 In the Title box on the General page type Bottom Axis and then click the Apply button Thisplaces a title on the selected axis
4 If you cannot see the axis title select View | Zoom | Selected Notice that you do not have toclose the properties dialog to select menu commands toolbar buttons or objects in the plotwindow
5 Click on the Scaling page to display the axis scaling options In the Major Interval box type thevalue 15 and then click the Apply button This changes the spacing between major ticks alongthe selected axis
6 Click on the General page and then click the Label Format button The Label Format dialog isdisplayed
7 In the Label Format dialog select the Fixed option in the Type group Click on the down arrowon the Decimal Digits box and change the value to 1 This indicates that only one digit follows thdecimal point for the axis tick labels
8 Click OK to return to the axis properties dialog
9 Click OK in the axis properties dialog and the map is redrawn The axis tick spacing and labels
are changed and the axis title is placed below the map
8152019 Surfer 8 Geology Tutorial
httpslidepdfcomreaderfullsurfer-8-geology-tutorial 1022
Saving a Map
When you have completed the map or drawing in the plot window you can save the map to aSurfer file [SRF] containing all the information necessary to reproduce the map When you save amap all the scaling formatting and map properties are preserved in the file
To save a map
1 Choose the File | Save command or click the button The Save As dialog is displayedbecause the map has not been previously saved
2 In the File name box type TUTORWS
3 Click Save and the file is saved to the current directory with an [SRF] extension The saved maremains open and the title bar changes to reflect the name change
If you are using the demo version of Surfer you will not be able to save the map Please proceed
to Lesson 4
Exporting 3D Contours
When you have completed a contour map in the plot window you can export the contour lines witassociated Z values to an AutoCAD DXF file
To export contour lines
1 Select the map by clicking on the map in the plot window or by clicking on the word Contours the Object Manager
2 Choose Map | Contour Map | Export Contours
3 In the Save As dialog type TUTORWS into the File name box
8152019 Surfer 8 Geology Tutorial
httpslidepdfcomreaderfullsurfer-8-geology-tutorial 1122
4 Click Save and the file is exported to the current directory This creates a file titledTUTORWSDXF which can be opened in any program with an AutoCAD DXF import option
If you are using the demo version of Surfer you will not be able to export contours Please proceeto Lesson 4
Lesson 4 - Creating a Wireframe
Wireframes are three-dimensional representations of a grid file Wireframes are block diagrams generated
by drawing lines representing the grid X and Y lines (the grid columns and rows) At each intersection of a
column and row (ie at each grid node) the height of the surface is proportional to the grid Z value at that point The number of columns and rows in the grid file determines the number of X and Y lines drawn on th
wireframe
Creating a New Wireframe
To create a new wireframe
1 Select the File | New command or click the button
2 SelectPlot Document
in theNew
dialog and click OK A new empty plot window is displayed
3 Select the Map | Wireframe command or click the button
4 Choose the grid file TUTORWSGRD from the list of files in the Open Grid dialog click Openand the map is created (TUTORWSGRD created in Lesson 2 - Creating a Grid File is locatedin Surfers SAMPLES folder)
8152019 Surfer 8 Geology Tutorial
httpslidepdfcomreaderfullsurfer-8-geology-tutorial 1222
Changing the Orientation of a Wireframe
Although this example uses a wireframe to illustrate rotation and tilt you can perform this operatioon most map types in Surfer
To change rotation and tilt
1 Click on the map once to select it
2 Click the Map | Trackball command or click the button
3 Click the left mouse button and hold it while moving the mouse to the left and right This changethe rotation of the wireframe The rotation is listed in the status bar
4 Click the left mouse button and hold it while moving the mouse up and down This changes thetilt of the map The tilt is listed in the status bar
5 Once you have rotated and tilted the map click the ESC key on your keyboard to end trackballmode
Changing the rotation tilt field of view and projection can also be accomplished by double clickinthe wireframe and using the options on the View page
8152019 Surfer 8 Geology Tutorial
httpslidepdfcomreaderfullsurfer-8-geology-tutorial 1322
Changing the Scaling of a Wireframe
You can change the scaling of wireframes and surfaces in three dimensions In this example thescaling is changed and the wireframe becomes somewhat exaggerated in the Z dimension
To change the Z scaling
1 Double-click the wireframe to open the map properties
2 Click the Scale page You can set scaling by entering the number of map units per inch or byentering the length for the map in page coordinates
3 In the Length box of the Z Scale group change the value to 3 by scrolling to 3 or by highlightingthe existing value and typing 3 The Map units value changes to reflect the change you made
4 Click OK and the wireframe is redrawn exaggerated in the Z dimension
Adding Color Zones to a Wireframe
You can change the line colors of any wireframe by applying color zones In this example we willchange color zones gradationally and individually
To add a color zone to a wireframe
1 Double-click on the wireframe and the wireframe properties dialog is displayed
2 Click on the Color Zones page
3 Click on the Line button to display the Line Spectrum dialog
8152019 Surfer 8 Geology Tutorial
httpslidepdfcomreaderfullsurfer-8-geology-tutorial 1422
8152019 Surfer 8 Geology Tutorial
httpslidepdfcomreaderfullsurfer-8-geology-tutorial 1522
Lesson 5 - Posting Data Points and Working with Overlays
Post maps are created by placing points on a map and labeling the points Posting data points ona map can be useful in determining the distribution of data points as well as placing data or textinformation at specific points on the map Data files contain the XY coordinates used to position thpoints on the map Data files can also contain the labels associated with each point
Creating Post Maps
When a new post map is created it is independent of any other maps in the current plot windowWhen the two maps are displayed notice that two sets of axes are also displayed one set for eacmap When you use the Map | Overlay Maps command the two maps are combined into a singlemap overlay with one set of axes
To create a post map
1 Choose File | Open to display the Open dialog Choose TUTORIALSRF in the SAMPLES
directory and then click the Open button TUTORIALSRF opens and contains a contour map
2 Select the Map | Post Map | New Post Map command or click the button
3 Choose TUTORWSDAT from the list of files in the Open dialog (TUTORWSDAT is located inSurfers SAMPLES folder)
4 Click Open and the post map is created using the default properties
The contour map and post map are two separate maps on the page If you look closely at the Xaxis you will notice the two sets of axis tick labels for the two maps Also there are two map
frames and axes sets listed in the Object Manager We will line up the maps with the Overlay command after changing the post map properties
Changing the Post Map Properties
To change the post map properties
1 Open the Object Manager if it is not already open The Object Manager is open if there is acheck mark displayed next to the words Object Manager in the View menu If there is no checkmark click on the command once
2 Right click on the word Post in the Object Manager
3 Select Properties from the context menu
4 In the post map properties dialog General page click the symbol button to open the SymbolProperties dialog
5 Choose the filled circle symbol from the palette and click OK The selected symbol appears inthe symbol button
6 Click the Apply button and the symbol appears at the posted data points on the map
8152019 Surfer 8 Geology Tutorial
httpslidepdfcomreaderfullsurfer-8-geology-tutorial 1622
7 In the Fixed Size box (Symbol Size group) specify a size of 009 in
8 Click OK and the post map is drawn with the new symbol size
Overlaying Maps ndash Tutorial
To overlay maps
1 To see the two separate maps place the mouse pointer in the center of the maps and clickPress and hold the left mouse button and move the pointer slightly in any direction Release thebutton and the two maps are offset
2 Click Edit | Select All to select both maps
3 Choose the Map | Overlay Maps command to combine the two maps into a single compositemap
8152019 Surfer 8 Geology Tutorial
httpslidepdfcomreaderfullsurfer-8-geology-tutorial 1722
Selecting an Overlay and Assigning an Object ID
After creating a composite map you can still modify the individual overlays in the map
Selecting Maps
An individual overlay can be selected in the composite map by clicking on the overlay in the plotwindow or clicking on the overlay in the Object Manager
The easiest way to select an overlay in a composite map is to click on the overlay name in theObject Manager However you can also select the overlay in the plot window with the mouseWhenever two or more objects occupy the same position in the plot window use the CTRL key anthe left mouse button to select the desired object The CTRL key allows you to cycle through theselection of overlapping objects For example if you want to select a text block behind a rectanglehold down the CTRL key and click until the text is selected You can use the status bar to help you to
determine which object is selected
Renaming the Post Map
To select an overlay and assign an ID
1 Make sure the Object Manager is open If the Object Manager is not open click View | ObjecManager
2 Click the overlay name in the Object Manager In this case click the word Post The status bshould now report Map Post
3 Choose Edit | Object ID
4 In the Object ID dialog type the name Tutorial Post Map and click OK The status bar ObjecManager and properties dialog title reflect the name change
8152019 Surfer 8 Geology Tutorial
httpslidepdfcomreaderfullsurfer-8-geology-tutorial 1822
If you double-click on Tutorial Post Map in the Object Manager notice that the properties dialogtitle changes to Map Tutorial Post Map Properties When you rename an object in Surfer 8 theobjects properties dialog reflects the name change making it easier for you to keep track of theobject you are editing For example if you have eight post maps in the plot window it is beneficialto change the post map names to something meaningful to save time when trying to edit themThis is especially important because the properties dialog can stay open when changing selection
Adding Labels to the Post Map
You can add labels to the data points on post maps The post map can be selected by a fewdifferent methods though only the Object Manager method is discussed here
To add labels
1 Right-click on Tutorial Post Map in the Object Manager and choose Properties
2 Click on the Labels page In the Worksheet Column for Labels group click the drop-down arrowand a list of columns in TUTORWSDAT is displayed
3 Select Column C Elevation from the list
4 Click the Format button to open the Label Format dialog
5 Change the Type to Fixed and the Decimal Digits value to zero
6 Click OK to return to the post map properties dialog
7 Click OK and the overlay is redrawn with labels on each of the data points
8152019 Surfer 8 Geology Tutorial
httpslidepdfcomreaderfullsurfer-8-geology-tutorial 1922
Lesson 6 - Introducing Surfaces
Surfaces are new to Surfer 8 They are similar to wireframes except that surfaces are three-dimensional shaded renderings of a grid file Surfaces provide an impressive visual interpretationof data Surfaces can be overlaid with other surfaces so that the surfaces will intersect with eachother Surfaces can also have overlays of other map types excluding wireframes
Creating a Surface
To create a surface
1 Select the File | New command or click the button
2 Select Plot Document in the New dialog and click OK A new empty plot window is displayed
3 Select the Map | Surface command or click the button
4 Choose the grid file TUTORWSGRD from the list of files in the Open Grid dialog click Openand the surface is created using the default settings (TUTORWSGRD created in Lesson 2 -Creating a Grid File is located in Surfers SAMPLES folder)
Adding an Overlay
You can overlay base contour post image shaded relief 1-grid vector maps and 2-grid vector
maps on surfaces All overlays except other surfaces are converted into a type of bitmap knownas a texture map This texture map is then applied to the surface by stretching it and shrinking it anecessary When these maps are overlaid you have a choice on how to treat the texture map Yocan use the colors from overlays only from the surface only or blend colors from the overlays andsurface For example you could create a color filled contour map overlay the contour map andsurface and then use the colors from the contour map only
When multiple surfaces of differing elevations are overlaid the surfaces can intersect and overlapeach other If the surfaces are adjacent to each other in the X or Y direction the surfaces aredrawn side-by-side after using Map | Overlay Maps In this example we will overlay a plane withthe surface you just created
8152019 Surfer 8 Geology Tutorial
httpslidepdfcomreaderfullsurfer-8-geology-tutorial 2022
2
First create the surface plane
1 Select the Map | Surface command or click the button
2 In the Open Grid dialog open Surfers SAMPLES folder and select TUTORPLGRD
3 Click Open and the surface is created using the default settings
4 Right click on the upper 3D Surface in the Object Manager choose Object ID and add the textTUTORPLGRD to the end of the 3D Surface label to make it easier to distinguish the twosurfaces in the Object Manager list
Adding a Mesh
Mesh lines can be applied to surfaces
To add a mesh
1 Double-click on the surface to open the surface properties
2 Click the Mesh page
8152019 Surfer 8 Geology Tutorial
httpslidepdfcomreaderfullsurfer-8-geology-tutorial 2122
2
3 Check the X and Y boxes
4 Change the Frequency to 5 for the X and Y lines
5 Click the OK or Apply button to add a mesh to the selected surface
Notice that the mesh is applied to the selected surface within the composite map not to both
surfaces With all map types you can only change the map-specific properties of one map at atime Properties that apply to all overlays in the composite map include View Scale Limits andBackground
Changing Colors
Changing color schemes on surfaces is similar to changing colors on other map types such asimage maps or contour maps The Color Spectrum dialog is used to load previously defined colorschemes and it is also used to create your own color schemes
Before experimenting with color lets create a new surface map in a new plot window
1 Click File | New or click the button
2 In the New dialog select Plot Document and then click OK
3 Select the Map | Surface command or click the button
4 In the Open Grid dialog open Surfers SAMPLES folder and select any grid file [GRD]HELENS2GRD is a good choice for experimenting with color
5 Click Open and the surface is created using the default settings
To change the surface material color
1 Double-click on the surface to open the surface properties
2 There is a Material Color group on the General page Click the Upper button
3 Click the Load button in the Color Spectrum dialog
8152019 Surfer 8 Geology Tutorial
httpslidepdfcomreaderfullsurfer-8-geology-tutorial 2222
2
4 The color schemes are stored in color spectrum files containing a [CLR] extension Bydefault Surfer opens in the SAMPLES folder which contains many predefined color spectrums(Browse to the SAMPLES folder if it is not open) Click on one of the [CLR] files to select it andthen click the Open button
5 Notice that the colors and anchor node positions have changed in the Color Spectrum dialog Click OK in the Color Spectrum dialog to return to the surface map properties dialog
6 Click the Apply button in the surface map properties dialog to see your color changes Drag thesurface map properties off to the side if you cannot see the map
You can continue to experiment with the colors by clicking the Upper button and loading other colospectrum files This is the end of the tutorial If you still have questions try looking for answers inthe online help and users guide If you find you still have questions do not hesitate to contactGolden Softwarersquos technical support
8152019 Surfer 8 Geology Tutorial
httpslidepdfcomreaderfullsurfer-8-geology-tutorial 722
Adding Color Fill between Contour Lines
Color fill can be assigned to individual levels in the same way as line properties Alternatively youcan assign colors based on a gradational spectrum between two colors
The Levels page in the contour map properties dialog shows a correspondence between a level(under the Level button) and a color (under the Fill button) The colors are used to fill in the spacebetween the corresponding level and the next higher level For example if the contour levels are20 30 40 etc then the color corresponding to level 20 is used to fill in the space between thelevel 20 contour and the level 30 contour
To change color fill
1 Double-click the contour map to open the contour map properties dialog
2 Click the Fill Contours check box on the General page
3 On the Levels page click the Fill button to open the Fill dialog
4 Click the Foreground Color button to open the Color Spectrum dialog This dialog allows you to
select colors to assign to specific Z values Click on the left anchor point button above thespectrum click on the color blue in the color palette and then click OK The Foreground Color button is now displayed as a gradation from blue to white in the Fill dialog
5 Click OK and the fill colors on the Levels page are updated to reflect the change
6 Click OK and the contour map is redrawn with color fill between the contours
8152019 Surfer 8 Geology Tutorial
httpslidepdfcomreaderfullsurfer-8-geology-tutorial 822
Add Delete and Move Contour Labels
Contour label locations can be changed on an individual basis Labels can be added deleted ormoved
To add delete and move contour labels
1 Right-click on the contour map and choose the Edit Contour Labels option You can also editlabels of a selected contour map using the Map | Contour Map | Edit Labels command The
pointer changes to a black arrowhead to indicate that you are in edit mode
2 To delete a label click on the label and press the DELETE key on the keyboard For exampleclick on a 70 label and then click the DELETE key on your keyboard
3 To add a label press and hold the CTRL key on the keyboard and click on the location on thecontour line where you want the new label located Add a 60 contour label to the lower leftportion of the map
4 To move a contour label click on the label hold down the left mouse button and drag the labelMove the 70 contour label on the right portion of the map to the north
5 To exit the Edit Contour Labels mode press the ESC key
Modifying an Axis
Every contour map is created with four axes the bottom right top and left axes You can controlthe display of each axis independently of the other axes on the map In this example well changethe contour spacing and add an axis label
To modify an axis
8152019 Surfer 8 Geology Tutorial
httpslidepdfcomreaderfullsurfer-8-geology-tutorial 922
1 Move the pointer over one of the axis tick labels on the bottom X axis and left-click the mouseIn the status bar at the bottom of the plot window the words Map Bottom Axis are displayedThis indicates that you have selected the bottom axis of the contour map Additionally hollowhandles appear at each end of the axis and solid green handles appear surrounding the entiremap This indicates that the axis is a sub-object of the entire map
2 Double-click on the bottom axis to display the bottom axis properties dialog
3 In the Title box on the General page type Bottom Axis and then click the Apply button Thisplaces a title on the selected axis
4 If you cannot see the axis title select View | Zoom | Selected Notice that you do not have toclose the properties dialog to select menu commands toolbar buttons or objects in the plotwindow
5 Click on the Scaling page to display the axis scaling options In the Major Interval box type thevalue 15 and then click the Apply button This changes the spacing between major ticks alongthe selected axis
6 Click on the General page and then click the Label Format button The Label Format dialog isdisplayed
7 In the Label Format dialog select the Fixed option in the Type group Click on the down arrowon the Decimal Digits box and change the value to 1 This indicates that only one digit follows thdecimal point for the axis tick labels
8 Click OK to return to the axis properties dialog
9 Click OK in the axis properties dialog and the map is redrawn The axis tick spacing and labels
are changed and the axis title is placed below the map
8152019 Surfer 8 Geology Tutorial
httpslidepdfcomreaderfullsurfer-8-geology-tutorial 1022
Saving a Map
When you have completed the map or drawing in the plot window you can save the map to aSurfer file [SRF] containing all the information necessary to reproduce the map When you save amap all the scaling formatting and map properties are preserved in the file
To save a map
1 Choose the File | Save command or click the button The Save As dialog is displayedbecause the map has not been previously saved
2 In the File name box type TUTORWS
3 Click Save and the file is saved to the current directory with an [SRF] extension The saved maremains open and the title bar changes to reflect the name change
If you are using the demo version of Surfer you will not be able to save the map Please proceed
to Lesson 4
Exporting 3D Contours
When you have completed a contour map in the plot window you can export the contour lines witassociated Z values to an AutoCAD DXF file
To export contour lines
1 Select the map by clicking on the map in the plot window or by clicking on the word Contours the Object Manager
2 Choose Map | Contour Map | Export Contours
3 In the Save As dialog type TUTORWS into the File name box
8152019 Surfer 8 Geology Tutorial
httpslidepdfcomreaderfullsurfer-8-geology-tutorial 1122
4 Click Save and the file is exported to the current directory This creates a file titledTUTORWSDXF which can be opened in any program with an AutoCAD DXF import option
If you are using the demo version of Surfer you will not be able to export contours Please proceeto Lesson 4
Lesson 4 - Creating a Wireframe
Wireframes are three-dimensional representations of a grid file Wireframes are block diagrams generated
by drawing lines representing the grid X and Y lines (the grid columns and rows) At each intersection of a
column and row (ie at each grid node) the height of the surface is proportional to the grid Z value at that point The number of columns and rows in the grid file determines the number of X and Y lines drawn on th
wireframe
Creating a New Wireframe
To create a new wireframe
1 Select the File | New command or click the button
2 SelectPlot Document
in theNew
dialog and click OK A new empty plot window is displayed
3 Select the Map | Wireframe command or click the button
4 Choose the grid file TUTORWSGRD from the list of files in the Open Grid dialog click Openand the map is created (TUTORWSGRD created in Lesson 2 - Creating a Grid File is locatedin Surfers SAMPLES folder)
8152019 Surfer 8 Geology Tutorial
httpslidepdfcomreaderfullsurfer-8-geology-tutorial 1222
Changing the Orientation of a Wireframe
Although this example uses a wireframe to illustrate rotation and tilt you can perform this operatioon most map types in Surfer
To change rotation and tilt
1 Click on the map once to select it
2 Click the Map | Trackball command or click the button
3 Click the left mouse button and hold it while moving the mouse to the left and right This changethe rotation of the wireframe The rotation is listed in the status bar
4 Click the left mouse button and hold it while moving the mouse up and down This changes thetilt of the map The tilt is listed in the status bar
5 Once you have rotated and tilted the map click the ESC key on your keyboard to end trackballmode
Changing the rotation tilt field of view and projection can also be accomplished by double clickinthe wireframe and using the options on the View page
8152019 Surfer 8 Geology Tutorial
httpslidepdfcomreaderfullsurfer-8-geology-tutorial 1322
Changing the Scaling of a Wireframe
You can change the scaling of wireframes and surfaces in three dimensions In this example thescaling is changed and the wireframe becomes somewhat exaggerated in the Z dimension
To change the Z scaling
1 Double-click the wireframe to open the map properties
2 Click the Scale page You can set scaling by entering the number of map units per inch or byentering the length for the map in page coordinates
3 In the Length box of the Z Scale group change the value to 3 by scrolling to 3 or by highlightingthe existing value and typing 3 The Map units value changes to reflect the change you made
4 Click OK and the wireframe is redrawn exaggerated in the Z dimension
Adding Color Zones to a Wireframe
You can change the line colors of any wireframe by applying color zones In this example we willchange color zones gradationally and individually
To add a color zone to a wireframe
1 Double-click on the wireframe and the wireframe properties dialog is displayed
2 Click on the Color Zones page
3 Click on the Line button to display the Line Spectrum dialog
8152019 Surfer 8 Geology Tutorial
httpslidepdfcomreaderfullsurfer-8-geology-tutorial 1422
8152019 Surfer 8 Geology Tutorial
httpslidepdfcomreaderfullsurfer-8-geology-tutorial 1522
Lesson 5 - Posting Data Points and Working with Overlays
Post maps are created by placing points on a map and labeling the points Posting data points ona map can be useful in determining the distribution of data points as well as placing data or textinformation at specific points on the map Data files contain the XY coordinates used to position thpoints on the map Data files can also contain the labels associated with each point
Creating Post Maps
When a new post map is created it is independent of any other maps in the current plot windowWhen the two maps are displayed notice that two sets of axes are also displayed one set for eacmap When you use the Map | Overlay Maps command the two maps are combined into a singlemap overlay with one set of axes
To create a post map
1 Choose File | Open to display the Open dialog Choose TUTORIALSRF in the SAMPLES
directory and then click the Open button TUTORIALSRF opens and contains a contour map
2 Select the Map | Post Map | New Post Map command or click the button
3 Choose TUTORWSDAT from the list of files in the Open dialog (TUTORWSDAT is located inSurfers SAMPLES folder)
4 Click Open and the post map is created using the default properties
The contour map and post map are two separate maps on the page If you look closely at the Xaxis you will notice the two sets of axis tick labels for the two maps Also there are two map
frames and axes sets listed in the Object Manager We will line up the maps with the Overlay command after changing the post map properties
Changing the Post Map Properties
To change the post map properties
1 Open the Object Manager if it is not already open The Object Manager is open if there is acheck mark displayed next to the words Object Manager in the View menu If there is no checkmark click on the command once
2 Right click on the word Post in the Object Manager
3 Select Properties from the context menu
4 In the post map properties dialog General page click the symbol button to open the SymbolProperties dialog
5 Choose the filled circle symbol from the palette and click OK The selected symbol appears inthe symbol button
6 Click the Apply button and the symbol appears at the posted data points on the map
8152019 Surfer 8 Geology Tutorial
httpslidepdfcomreaderfullsurfer-8-geology-tutorial 1622
7 In the Fixed Size box (Symbol Size group) specify a size of 009 in
8 Click OK and the post map is drawn with the new symbol size
Overlaying Maps ndash Tutorial
To overlay maps
1 To see the two separate maps place the mouse pointer in the center of the maps and clickPress and hold the left mouse button and move the pointer slightly in any direction Release thebutton and the two maps are offset
2 Click Edit | Select All to select both maps
3 Choose the Map | Overlay Maps command to combine the two maps into a single compositemap
8152019 Surfer 8 Geology Tutorial
httpslidepdfcomreaderfullsurfer-8-geology-tutorial 1722
Selecting an Overlay and Assigning an Object ID
After creating a composite map you can still modify the individual overlays in the map
Selecting Maps
An individual overlay can be selected in the composite map by clicking on the overlay in the plotwindow or clicking on the overlay in the Object Manager
The easiest way to select an overlay in a composite map is to click on the overlay name in theObject Manager However you can also select the overlay in the plot window with the mouseWhenever two or more objects occupy the same position in the plot window use the CTRL key anthe left mouse button to select the desired object The CTRL key allows you to cycle through theselection of overlapping objects For example if you want to select a text block behind a rectanglehold down the CTRL key and click until the text is selected You can use the status bar to help you to
determine which object is selected
Renaming the Post Map
To select an overlay and assign an ID
1 Make sure the Object Manager is open If the Object Manager is not open click View | ObjecManager
2 Click the overlay name in the Object Manager In this case click the word Post The status bshould now report Map Post
3 Choose Edit | Object ID
4 In the Object ID dialog type the name Tutorial Post Map and click OK The status bar ObjecManager and properties dialog title reflect the name change
8152019 Surfer 8 Geology Tutorial
httpslidepdfcomreaderfullsurfer-8-geology-tutorial 1822
If you double-click on Tutorial Post Map in the Object Manager notice that the properties dialogtitle changes to Map Tutorial Post Map Properties When you rename an object in Surfer 8 theobjects properties dialog reflects the name change making it easier for you to keep track of theobject you are editing For example if you have eight post maps in the plot window it is beneficialto change the post map names to something meaningful to save time when trying to edit themThis is especially important because the properties dialog can stay open when changing selection
Adding Labels to the Post Map
You can add labels to the data points on post maps The post map can be selected by a fewdifferent methods though only the Object Manager method is discussed here
To add labels
1 Right-click on Tutorial Post Map in the Object Manager and choose Properties
2 Click on the Labels page In the Worksheet Column for Labels group click the drop-down arrowand a list of columns in TUTORWSDAT is displayed
3 Select Column C Elevation from the list
4 Click the Format button to open the Label Format dialog
5 Change the Type to Fixed and the Decimal Digits value to zero
6 Click OK to return to the post map properties dialog
7 Click OK and the overlay is redrawn with labels on each of the data points
8152019 Surfer 8 Geology Tutorial
httpslidepdfcomreaderfullsurfer-8-geology-tutorial 1922
Lesson 6 - Introducing Surfaces
Surfaces are new to Surfer 8 They are similar to wireframes except that surfaces are three-dimensional shaded renderings of a grid file Surfaces provide an impressive visual interpretationof data Surfaces can be overlaid with other surfaces so that the surfaces will intersect with eachother Surfaces can also have overlays of other map types excluding wireframes
Creating a Surface
To create a surface
1 Select the File | New command or click the button
2 Select Plot Document in the New dialog and click OK A new empty plot window is displayed
3 Select the Map | Surface command or click the button
4 Choose the grid file TUTORWSGRD from the list of files in the Open Grid dialog click Openand the surface is created using the default settings (TUTORWSGRD created in Lesson 2 -Creating a Grid File is located in Surfers SAMPLES folder)
Adding an Overlay
You can overlay base contour post image shaded relief 1-grid vector maps and 2-grid vector
maps on surfaces All overlays except other surfaces are converted into a type of bitmap knownas a texture map This texture map is then applied to the surface by stretching it and shrinking it anecessary When these maps are overlaid you have a choice on how to treat the texture map Yocan use the colors from overlays only from the surface only or blend colors from the overlays andsurface For example you could create a color filled contour map overlay the contour map andsurface and then use the colors from the contour map only
When multiple surfaces of differing elevations are overlaid the surfaces can intersect and overlapeach other If the surfaces are adjacent to each other in the X or Y direction the surfaces aredrawn side-by-side after using Map | Overlay Maps In this example we will overlay a plane withthe surface you just created
8152019 Surfer 8 Geology Tutorial
httpslidepdfcomreaderfullsurfer-8-geology-tutorial 2022
2
First create the surface plane
1 Select the Map | Surface command or click the button
2 In the Open Grid dialog open Surfers SAMPLES folder and select TUTORPLGRD
3 Click Open and the surface is created using the default settings
4 Right click on the upper 3D Surface in the Object Manager choose Object ID and add the textTUTORPLGRD to the end of the 3D Surface label to make it easier to distinguish the twosurfaces in the Object Manager list
Adding a Mesh
Mesh lines can be applied to surfaces
To add a mesh
1 Double-click on the surface to open the surface properties
2 Click the Mesh page
8152019 Surfer 8 Geology Tutorial
httpslidepdfcomreaderfullsurfer-8-geology-tutorial 2122
2
3 Check the X and Y boxes
4 Change the Frequency to 5 for the X and Y lines
5 Click the OK or Apply button to add a mesh to the selected surface
Notice that the mesh is applied to the selected surface within the composite map not to both
surfaces With all map types you can only change the map-specific properties of one map at atime Properties that apply to all overlays in the composite map include View Scale Limits andBackground
Changing Colors
Changing color schemes on surfaces is similar to changing colors on other map types such asimage maps or contour maps The Color Spectrum dialog is used to load previously defined colorschemes and it is also used to create your own color schemes
Before experimenting with color lets create a new surface map in a new plot window
1 Click File | New or click the button
2 In the New dialog select Plot Document and then click OK
3 Select the Map | Surface command or click the button
4 In the Open Grid dialog open Surfers SAMPLES folder and select any grid file [GRD]HELENS2GRD is a good choice for experimenting with color
5 Click Open and the surface is created using the default settings
To change the surface material color
1 Double-click on the surface to open the surface properties
2 There is a Material Color group on the General page Click the Upper button
3 Click the Load button in the Color Spectrum dialog
8152019 Surfer 8 Geology Tutorial
httpslidepdfcomreaderfullsurfer-8-geology-tutorial 2222
2
4 The color schemes are stored in color spectrum files containing a [CLR] extension Bydefault Surfer opens in the SAMPLES folder which contains many predefined color spectrums(Browse to the SAMPLES folder if it is not open) Click on one of the [CLR] files to select it andthen click the Open button
5 Notice that the colors and anchor node positions have changed in the Color Spectrum dialog Click OK in the Color Spectrum dialog to return to the surface map properties dialog
6 Click the Apply button in the surface map properties dialog to see your color changes Drag thesurface map properties off to the side if you cannot see the map
You can continue to experiment with the colors by clicking the Upper button and loading other colospectrum files This is the end of the tutorial If you still have questions try looking for answers inthe online help and users guide If you find you still have questions do not hesitate to contactGolden Softwarersquos technical support

8152019 Surfer 8 Geology Tutorial
httpslidepdfcomreaderfullsurfer-8-geology-tutorial 822
Add Delete and Move Contour Labels
Contour label locations can be changed on an individual basis Labels can be added deleted ormoved
To add delete and move contour labels
1 Right-click on the contour map and choose the Edit Contour Labels option You can also editlabels of a selected contour map using the Map | Contour Map | Edit Labels command The
pointer changes to a black arrowhead to indicate that you are in edit mode
2 To delete a label click on the label and press the DELETE key on the keyboard For exampleclick on a 70 label and then click the DELETE key on your keyboard
3 To add a label press and hold the CTRL key on the keyboard and click on the location on thecontour line where you want the new label located Add a 60 contour label to the lower leftportion of the map
4 To move a contour label click on the label hold down the left mouse button and drag the labelMove the 70 contour label on the right portion of the map to the north
5 To exit the Edit Contour Labels mode press the ESC key
Modifying an Axis
Every contour map is created with four axes the bottom right top and left axes You can controlthe display of each axis independently of the other axes on the map In this example well changethe contour spacing and add an axis label
To modify an axis
8152019 Surfer 8 Geology Tutorial
httpslidepdfcomreaderfullsurfer-8-geology-tutorial 922
1 Move the pointer over one of the axis tick labels on the bottom X axis and left-click the mouseIn the status bar at the bottom of the plot window the words Map Bottom Axis are displayedThis indicates that you have selected the bottom axis of the contour map Additionally hollowhandles appear at each end of the axis and solid green handles appear surrounding the entiremap This indicates that the axis is a sub-object of the entire map
2 Double-click on the bottom axis to display the bottom axis properties dialog
3 In the Title box on the General page type Bottom Axis and then click the Apply button Thisplaces a title on the selected axis
4 If you cannot see the axis title select View | Zoom | Selected Notice that you do not have toclose the properties dialog to select menu commands toolbar buttons or objects in the plotwindow
5 Click on the Scaling page to display the axis scaling options In the Major Interval box type thevalue 15 and then click the Apply button This changes the spacing between major ticks alongthe selected axis
6 Click on the General page and then click the Label Format button The Label Format dialog isdisplayed
7 In the Label Format dialog select the Fixed option in the Type group Click on the down arrowon the Decimal Digits box and change the value to 1 This indicates that only one digit follows thdecimal point for the axis tick labels
8 Click OK to return to the axis properties dialog
9 Click OK in the axis properties dialog and the map is redrawn The axis tick spacing and labels
are changed and the axis title is placed below the map
8152019 Surfer 8 Geology Tutorial
httpslidepdfcomreaderfullsurfer-8-geology-tutorial 1022
Saving a Map
When you have completed the map or drawing in the plot window you can save the map to aSurfer file [SRF] containing all the information necessary to reproduce the map When you save amap all the scaling formatting and map properties are preserved in the file
To save a map
1 Choose the File | Save command or click the button The Save As dialog is displayedbecause the map has not been previously saved
2 In the File name box type TUTORWS
3 Click Save and the file is saved to the current directory with an [SRF] extension The saved maremains open and the title bar changes to reflect the name change
If you are using the demo version of Surfer you will not be able to save the map Please proceed
to Lesson 4
Exporting 3D Contours
When you have completed a contour map in the plot window you can export the contour lines witassociated Z values to an AutoCAD DXF file
To export contour lines
1 Select the map by clicking on the map in the plot window or by clicking on the word Contours the Object Manager
2 Choose Map | Contour Map | Export Contours
3 In the Save As dialog type TUTORWS into the File name box
8152019 Surfer 8 Geology Tutorial
httpslidepdfcomreaderfullsurfer-8-geology-tutorial 1122
4 Click Save and the file is exported to the current directory This creates a file titledTUTORWSDXF which can be opened in any program with an AutoCAD DXF import option
If you are using the demo version of Surfer you will not be able to export contours Please proceeto Lesson 4
Lesson 4 - Creating a Wireframe
Wireframes are three-dimensional representations of a grid file Wireframes are block diagrams generated
by drawing lines representing the grid X and Y lines (the grid columns and rows) At each intersection of a
column and row (ie at each grid node) the height of the surface is proportional to the grid Z value at that point The number of columns and rows in the grid file determines the number of X and Y lines drawn on th
wireframe
Creating a New Wireframe
To create a new wireframe
1 Select the File | New command or click the button
2 SelectPlot Document
in theNew
dialog and click OK A new empty plot window is displayed
3 Select the Map | Wireframe command or click the button
4 Choose the grid file TUTORWSGRD from the list of files in the Open Grid dialog click Openand the map is created (TUTORWSGRD created in Lesson 2 - Creating a Grid File is locatedin Surfers SAMPLES folder)
8152019 Surfer 8 Geology Tutorial
httpslidepdfcomreaderfullsurfer-8-geology-tutorial 1222
Changing the Orientation of a Wireframe
Although this example uses a wireframe to illustrate rotation and tilt you can perform this operatioon most map types in Surfer
To change rotation and tilt
1 Click on the map once to select it
2 Click the Map | Trackball command or click the button
3 Click the left mouse button and hold it while moving the mouse to the left and right This changethe rotation of the wireframe The rotation is listed in the status bar
4 Click the left mouse button and hold it while moving the mouse up and down This changes thetilt of the map The tilt is listed in the status bar
5 Once you have rotated and tilted the map click the ESC key on your keyboard to end trackballmode
Changing the rotation tilt field of view and projection can also be accomplished by double clickinthe wireframe and using the options on the View page
8152019 Surfer 8 Geology Tutorial
httpslidepdfcomreaderfullsurfer-8-geology-tutorial 1322
Changing the Scaling of a Wireframe
You can change the scaling of wireframes and surfaces in three dimensions In this example thescaling is changed and the wireframe becomes somewhat exaggerated in the Z dimension
To change the Z scaling
1 Double-click the wireframe to open the map properties
2 Click the Scale page You can set scaling by entering the number of map units per inch or byentering the length for the map in page coordinates
3 In the Length box of the Z Scale group change the value to 3 by scrolling to 3 or by highlightingthe existing value and typing 3 The Map units value changes to reflect the change you made
4 Click OK and the wireframe is redrawn exaggerated in the Z dimension
Adding Color Zones to a Wireframe
You can change the line colors of any wireframe by applying color zones In this example we willchange color zones gradationally and individually
To add a color zone to a wireframe
1 Double-click on the wireframe and the wireframe properties dialog is displayed
2 Click on the Color Zones page
3 Click on the Line button to display the Line Spectrum dialog
8152019 Surfer 8 Geology Tutorial
httpslidepdfcomreaderfullsurfer-8-geology-tutorial 1422
8152019 Surfer 8 Geology Tutorial
httpslidepdfcomreaderfullsurfer-8-geology-tutorial 1522
Lesson 5 - Posting Data Points and Working with Overlays
Post maps are created by placing points on a map and labeling the points Posting data points ona map can be useful in determining the distribution of data points as well as placing data or textinformation at specific points on the map Data files contain the XY coordinates used to position thpoints on the map Data files can also contain the labels associated with each point
Creating Post Maps
When a new post map is created it is independent of any other maps in the current plot windowWhen the two maps are displayed notice that two sets of axes are also displayed one set for eacmap When you use the Map | Overlay Maps command the two maps are combined into a singlemap overlay with one set of axes
To create a post map
1 Choose File | Open to display the Open dialog Choose TUTORIALSRF in the SAMPLES
directory and then click the Open button TUTORIALSRF opens and contains a contour map
2 Select the Map | Post Map | New Post Map command or click the button
3 Choose TUTORWSDAT from the list of files in the Open dialog (TUTORWSDAT is located inSurfers SAMPLES folder)
4 Click Open and the post map is created using the default properties
The contour map and post map are two separate maps on the page If you look closely at the Xaxis you will notice the two sets of axis tick labels for the two maps Also there are two map
frames and axes sets listed in the Object Manager We will line up the maps with the Overlay command after changing the post map properties
Changing the Post Map Properties
To change the post map properties
1 Open the Object Manager if it is not already open The Object Manager is open if there is acheck mark displayed next to the words Object Manager in the View menu If there is no checkmark click on the command once
2 Right click on the word Post in the Object Manager
3 Select Properties from the context menu
4 In the post map properties dialog General page click the symbol button to open the SymbolProperties dialog
5 Choose the filled circle symbol from the palette and click OK The selected symbol appears inthe symbol button
6 Click the Apply button and the symbol appears at the posted data points on the map
8152019 Surfer 8 Geology Tutorial
httpslidepdfcomreaderfullsurfer-8-geology-tutorial 1622
7 In the Fixed Size box (Symbol Size group) specify a size of 009 in
8 Click OK and the post map is drawn with the new symbol size
Overlaying Maps ndash Tutorial
To overlay maps
1 To see the two separate maps place the mouse pointer in the center of the maps and clickPress and hold the left mouse button and move the pointer slightly in any direction Release thebutton and the two maps are offset
2 Click Edit | Select All to select both maps
3 Choose the Map | Overlay Maps command to combine the two maps into a single compositemap
8152019 Surfer 8 Geology Tutorial
httpslidepdfcomreaderfullsurfer-8-geology-tutorial 1722
Selecting an Overlay and Assigning an Object ID
After creating a composite map you can still modify the individual overlays in the map
Selecting Maps
An individual overlay can be selected in the composite map by clicking on the overlay in the plotwindow or clicking on the overlay in the Object Manager
The easiest way to select an overlay in a composite map is to click on the overlay name in theObject Manager However you can also select the overlay in the plot window with the mouseWhenever two or more objects occupy the same position in the plot window use the CTRL key anthe left mouse button to select the desired object The CTRL key allows you to cycle through theselection of overlapping objects For example if you want to select a text block behind a rectanglehold down the CTRL key and click until the text is selected You can use the status bar to help you to
determine which object is selected
Renaming the Post Map
To select an overlay and assign an ID
1 Make sure the Object Manager is open If the Object Manager is not open click View | ObjecManager
2 Click the overlay name in the Object Manager In this case click the word Post The status bshould now report Map Post
3 Choose Edit | Object ID
4 In the Object ID dialog type the name Tutorial Post Map and click OK The status bar ObjecManager and properties dialog title reflect the name change
8152019 Surfer 8 Geology Tutorial
httpslidepdfcomreaderfullsurfer-8-geology-tutorial 1822
If you double-click on Tutorial Post Map in the Object Manager notice that the properties dialogtitle changes to Map Tutorial Post Map Properties When you rename an object in Surfer 8 theobjects properties dialog reflects the name change making it easier for you to keep track of theobject you are editing For example if you have eight post maps in the plot window it is beneficialto change the post map names to something meaningful to save time when trying to edit themThis is especially important because the properties dialog can stay open when changing selection
Adding Labels to the Post Map
You can add labels to the data points on post maps The post map can be selected by a fewdifferent methods though only the Object Manager method is discussed here
To add labels
1 Right-click on Tutorial Post Map in the Object Manager and choose Properties
2 Click on the Labels page In the Worksheet Column for Labels group click the drop-down arrowand a list of columns in TUTORWSDAT is displayed
3 Select Column C Elevation from the list
4 Click the Format button to open the Label Format dialog
5 Change the Type to Fixed and the Decimal Digits value to zero
6 Click OK to return to the post map properties dialog
7 Click OK and the overlay is redrawn with labels on each of the data points
8152019 Surfer 8 Geology Tutorial
httpslidepdfcomreaderfullsurfer-8-geology-tutorial 1922
Lesson 6 - Introducing Surfaces
Surfaces are new to Surfer 8 They are similar to wireframes except that surfaces are three-dimensional shaded renderings of a grid file Surfaces provide an impressive visual interpretationof data Surfaces can be overlaid with other surfaces so that the surfaces will intersect with eachother Surfaces can also have overlays of other map types excluding wireframes
Creating a Surface
To create a surface
1 Select the File | New command or click the button
2 Select Plot Document in the New dialog and click OK A new empty plot window is displayed
3 Select the Map | Surface command or click the button
4 Choose the grid file TUTORWSGRD from the list of files in the Open Grid dialog click Openand the surface is created using the default settings (TUTORWSGRD created in Lesson 2 -Creating a Grid File is located in Surfers SAMPLES folder)
Adding an Overlay
You can overlay base contour post image shaded relief 1-grid vector maps and 2-grid vector
maps on surfaces All overlays except other surfaces are converted into a type of bitmap knownas a texture map This texture map is then applied to the surface by stretching it and shrinking it anecessary When these maps are overlaid you have a choice on how to treat the texture map Yocan use the colors from overlays only from the surface only or blend colors from the overlays andsurface For example you could create a color filled contour map overlay the contour map andsurface and then use the colors from the contour map only
When multiple surfaces of differing elevations are overlaid the surfaces can intersect and overlapeach other If the surfaces are adjacent to each other in the X or Y direction the surfaces aredrawn side-by-side after using Map | Overlay Maps In this example we will overlay a plane withthe surface you just created
8152019 Surfer 8 Geology Tutorial
httpslidepdfcomreaderfullsurfer-8-geology-tutorial 2022
2
First create the surface plane
1 Select the Map | Surface command or click the button
2 In the Open Grid dialog open Surfers SAMPLES folder and select TUTORPLGRD
3 Click Open and the surface is created using the default settings
4 Right click on the upper 3D Surface in the Object Manager choose Object ID and add the textTUTORPLGRD to the end of the 3D Surface label to make it easier to distinguish the twosurfaces in the Object Manager list
Adding a Mesh
Mesh lines can be applied to surfaces
To add a mesh
1 Double-click on the surface to open the surface properties
2 Click the Mesh page
8152019 Surfer 8 Geology Tutorial
httpslidepdfcomreaderfullsurfer-8-geology-tutorial 2122
2
3 Check the X and Y boxes
4 Change the Frequency to 5 for the X and Y lines
5 Click the OK or Apply button to add a mesh to the selected surface
Notice that the mesh is applied to the selected surface within the composite map not to both
surfaces With all map types you can only change the map-specific properties of one map at atime Properties that apply to all overlays in the composite map include View Scale Limits andBackground
Changing Colors
Changing color schemes on surfaces is similar to changing colors on other map types such asimage maps or contour maps The Color Spectrum dialog is used to load previously defined colorschemes and it is also used to create your own color schemes
Before experimenting with color lets create a new surface map in a new plot window
1 Click File | New or click the button
2 In the New dialog select Plot Document and then click OK
3 Select the Map | Surface command or click the button
4 In the Open Grid dialog open Surfers SAMPLES folder and select any grid file [GRD]HELENS2GRD is a good choice for experimenting with color
5 Click Open and the surface is created using the default settings
To change the surface material color
1 Double-click on the surface to open the surface properties
2 There is a Material Color group on the General page Click the Upper button
3 Click the Load button in the Color Spectrum dialog
8152019 Surfer 8 Geology Tutorial
httpslidepdfcomreaderfullsurfer-8-geology-tutorial 2222
2
4 The color schemes are stored in color spectrum files containing a [CLR] extension Bydefault Surfer opens in the SAMPLES folder which contains many predefined color spectrums(Browse to the SAMPLES folder if it is not open) Click on one of the [CLR] files to select it andthen click the Open button
5 Notice that the colors and anchor node positions have changed in the Color Spectrum dialog Click OK in the Color Spectrum dialog to return to the surface map properties dialog
6 Click the Apply button in the surface map properties dialog to see your color changes Drag thesurface map properties off to the side if you cannot see the map
You can continue to experiment with the colors by clicking the Upper button and loading other colospectrum files This is the end of the tutorial If you still have questions try looking for answers inthe online help and users guide If you find you still have questions do not hesitate to contactGolden Softwarersquos technical support
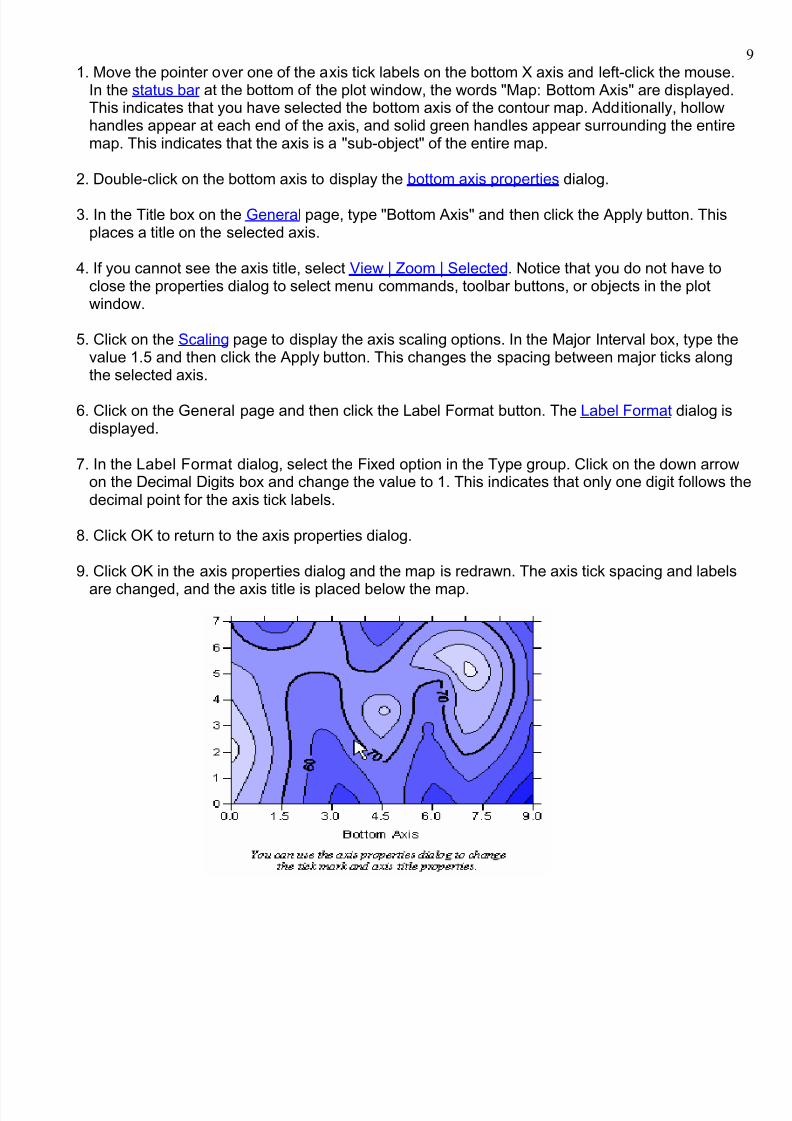
8152019 Surfer 8 Geology Tutorial
httpslidepdfcomreaderfullsurfer-8-geology-tutorial 922
1 Move the pointer over one of the axis tick labels on the bottom X axis and left-click the mouseIn the status bar at the bottom of the plot window the words Map Bottom Axis are displayedThis indicates that you have selected the bottom axis of the contour map Additionally hollowhandles appear at each end of the axis and solid green handles appear surrounding the entiremap This indicates that the axis is a sub-object of the entire map
2 Double-click on the bottom axis to display the bottom axis properties dialog
3 In the Title box on the General page type Bottom Axis and then click the Apply button Thisplaces a title on the selected axis
4 If you cannot see the axis title select View | Zoom | Selected Notice that you do not have toclose the properties dialog to select menu commands toolbar buttons or objects in the plotwindow
5 Click on the Scaling page to display the axis scaling options In the Major Interval box type thevalue 15 and then click the Apply button This changes the spacing between major ticks alongthe selected axis
6 Click on the General page and then click the Label Format button The Label Format dialog isdisplayed
7 In the Label Format dialog select the Fixed option in the Type group Click on the down arrowon the Decimal Digits box and change the value to 1 This indicates that only one digit follows thdecimal point for the axis tick labels
8 Click OK to return to the axis properties dialog
9 Click OK in the axis properties dialog and the map is redrawn The axis tick spacing and labels
are changed and the axis title is placed below the map
8152019 Surfer 8 Geology Tutorial
httpslidepdfcomreaderfullsurfer-8-geology-tutorial 1022
Saving a Map
When you have completed the map or drawing in the plot window you can save the map to aSurfer file [SRF] containing all the information necessary to reproduce the map When you save amap all the scaling formatting and map properties are preserved in the file
To save a map
1 Choose the File | Save command or click the button The Save As dialog is displayedbecause the map has not been previously saved
2 In the File name box type TUTORWS
3 Click Save and the file is saved to the current directory with an [SRF] extension The saved maremains open and the title bar changes to reflect the name change
If you are using the demo version of Surfer you will not be able to save the map Please proceed
to Lesson 4
Exporting 3D Contours
When you have completed a contour map in the plot window you can export the contour lines witassociated Z values to an AutoCAD DXF file
To export contour lines
1 Select the map by clicking on the map in the plot window or by clicking on the word Contours the Object Manager
2 Choose Map | Contour Map | Export Contours
3 In the Save As dialog type TUTORWS into the File name box
8152019 Surfer 8 Geology Tutorial
httpslidepdfcomreaderfullsurfer-8-geology-tutorial 1122
4 Click Save and the file is exported to the current directory This creates a file titledTUTORWSDXF which can be opened in any program with an AutoCAD DXF import option
If you are using the demo version of Surfer you will not be able to export contours Please proceeto Lesson 4
Lesson 4 - Creating a Wireframe
Wireframes are three-dimensional representations of a grid file Wireframes are block diagrams generated
by drawing lines representing the grid X and Y lines (the grid columns and rows) At each intersection of a
column and row (ie at each grid node) the height of the surface is proportional to the grid Z value at that point The number of columns and rows in the grid file determines the number of X and Y lines drawn on th
wireframe
Creating a New Wireframe
To create a new wireframe
1 Select the File | New command or click the button
2 SelectPlot Document
in theNew
dialog and click OK A new empty plot window is displayed
3 Select the Map | Wireframe command or click the button
4 Choose the grid file TUTORWSGRD from the list of files in the Open Grid dialog click Openand the map is created (TUTORWSGRD created in Lesson 2 - Creating a Grid File is locatedin Surfers SAMPLES folder)
8152019 Surfer 8 Geology Tutorial
httpslidepdfcomreaderfullsurfer-8-geology-tutorial 1222
Changing the Orientation of a Wireframe
Although this example uses a wireframe to illustrate rotation and tilt you can perform this operatioon most map types in Surfer
To change rotation and tilt
1 Click on the map once to select it
2 Click the Map | Trackball command or click the button
3 Click the left mouse button and hold it while moving the mouse to the left and right This changethe rotation of the wireframe The rotation is listed in the status bar
4 Click the left mouse button and hold it while moving the mouse up and down This changes thetilt of the map The tilt is listed in the status bar
5 Once you have rotated and tilted the map click the ESC key on your keyboard to end trackballmode
Changing the rotation tilt field of view and projection can also be accomplished by double clickinthe wireframe and using the options on the View page
8152019 Surfer 8 Geology Tutorial
httpslidepdfcomreaderfullsurfer-8-geology-tutorial 1322
Changing the Scaling of a Wireframe
You can change the scaling of wireframes and surfaces in three dimensions In this example thescaling is changed and the wireframe becomes somewhat exaggerated in the Z dimension
To change the Z scaling
1 Double-click the wireframe to open the map properties
2 Click the Scale page You can set scaling by entering the number of map units per inch or byentering the length for the map in page coordinates
3 In the Length box of the Z Scale group change the value to 3 by scrolling to 3 or by highlightingthe existing value and typing 3 The Map units value changes to reflect the change you made
4 Click OK and the wireframe is redrawn exaggerated in the Z dimension
Adding Color Zones to a Wireframe
You can change the line colors of any wireframe by applying color zones In this example we willchange color zones gradationally and individually
To add a color zone to a wireframe
1 Double-click on the wireframe and the wireframe properties dialog is displayed
2 Click on the Color Zones page
3 Click on the Line button to display the Line Spectrum dialog
8152019 Surfer 8 Geology Tutorial
httpslidepdfcomreaderfullsurfer-8-geology-tutorial 1422
8152019 Surfer 8 Geology Tutorial
httpslidepdfcomreaderfullsurfer-8-geology-tutorial 1522
Lesson 5 - Posting Data Points and Working with Overlays
Post maps are created by placing points on a map and labeling the points Posting data points ona map can be useful in determining the distribution of data points as well as placing data or textinformation at specific points on the map Data files contain the XY coordinates used to position thpoints on the map Data files can also contain the labels associated with each point
Creating Post Maps
When a new post map is created it is independent of any other maps in the current plot windowWhen the two maps are displayed notice that two sets of axes are also displayed one set for eacmap When you use the Map | Overlay Maps command the two maps are combined into a singlemap overlay with one set of axes
To create a post map
1 Choose File | Open to display the Open dialog Choose TUTORIALSRF in the SAMPLES
directory and then click the Open button TUTORIALSRF opens and contains a contour map
2 Select the Map | Post Map | New Post Map command or click the button
3 Choose TUTORWSDAT from the list of files in the Open dialog (TUTORWSDAT is located inSurfers SAMPLES folder)
4 Click Open and the post map is created using the default properties
The contour map and post map are two separate maps on the page If you look closely at the Xaxis you will notice the two sets of axis tick labels for the two maps Also there are two map
frames and axes sets listed in the Object Manager We will line up the maps with the Overlay command after changing the post map properties
Changing the Post Map Properties
To change the post map properties
1 Open the Object Manager if it is not already open The Object Manager is open if there is acheck mark displayed next to the words Object Manager in the View menu If there is no checkmark click on the command once
2 Right click on the word Post in the Object Manager
3 Select Properties from the context menu
4 In the post map properties dialog General page click the symbol button to open the SymbolProperties dialog
5 Choose the filled circle symbol from the palette and click OK The selected symbol appears inthe symbol button
6 Click the Apply button and the symbol appears at the posted data points on the map
8152019 Surfer 8 Geology Tutorial
httpslidepdfcomreaderfullsurfer-8-geology-tutorial 1622
7 In the Fixed Size box (Symbol Size group) specify a size of 009 in
8 Click OK and the post map is drawn with the new symbol size
Overlaying Maps ndash Tutorial
To overlay maps
1 To see the two separate maps place the mouse pointer in the center of the maps and clickPress and hold the left mouse button and move the pointer slightly in any direction Release thebutton and the two maps are offset
2 Click Edit | Select All to select both maps
3 Choose the Map | Overlay Maps command to combine the two maps into a single compositemap
8152019 Surfer 8 Geology Tutorial
httpslidepdfcomreaderfullsurfer-8-geology-tutorial 1722
Selecting an Overlay and Assigning an Object ID
After creating a composite map you can still modify the individual overlays in the map
Selecting Maps
An individual overlay can be selected in the composite map by clicking on the overlay in the plotwindow or clicking on the overlay in the Object Manager
The easiest way to select an overlay in a composite map is to click on the overlay name in theObject Manager However you can also select the overlay in the plot window with the mouseWhenever two or more objects occupy the same position in the plot window use the CTRL key anthe left mouse button to select the desired object The CTRL key allows you to cycle through theselection of overlapping objects For example if you want to select a text block behind a rectanglehold down the CTRL key and click until the text is selected You can use the status bar to help you to
determine which object is selected
Renaming the Post Map
To select an overlay and assign an ID
1 Make sure the Object Manager is open If the Object Manager is not open click View | ObjecManager
2 Click the overlay name in the Object Manager In this case click the word Post The status bshould now report Map Post
3 Choose Edit | Object ID
4 In the Object ID dialog type the name Tutorial Post Map and click OK The status bar ObjecManager and properties dialog title reflect the name change
8152019 Surfer 8 Geology Tutorial
httpslidepdfcomreaderfullsurfer-8-geology-tutorial 1822
If you double-click on Tutorial Post Map in the Object Manager notice that the properties dialogtitle changes to Map Tutorial Post Map Properties When you rename an object in Surfer 8 theobjects properties dialog reflects the name change making it easier for you to keep track of theobject you are editing For example if you have eight post maps in the plot window it is beneficialto change the post map names to something meaningful to save time when trying to edit themThis is especially important because the properties dialog can stay open when changing selection
Adding Labels to the Post Map
You can add labels to the data points on post maps The post map can be selected by a fewdifferent methods though only the Object Manager method is discussed here
To add labels
1 Right-click on Tutorial Post Map in the Object Manager and choose Properties
2 Click on the Labels page In the Worksheet Column for Labels group click the drop-down arrowand a list of columns in TUTORWSDAT is displayed
3 Select Column C Elevation from the list
4 Click the Format button to open the Label Format dialog
5 Change the Type to Fixed and the Decimal Digits value to zero
6 Click OK to return to the post map properties dialog
7 Click OK and the overlay is redrawn with labels on each of the data points
8152019 Surfer 8 Geology Tutorial
httpslidepdfcomreaderfullsurfer-8-geology-tutorial 1922
Lesson 6 - Introducing Surfaces
Surfaces are new to Surfer 8 They are similar to wireframes except that surfaces are three-dimensional shaded renderings of a grid file Surfaces provide an impressive visual interpretationof data Surfaces can be overlaid with other surfaces so that the surfaces will intersect with eachother Surfaces can also have overlays of other map types excluding wireframes
Creating a Surface
To create a surface
1 Select the File | New command or click the button
2 Select Plot Document in the New dialog and click OK A new empty plot window is displayed
3 Select the Map | Surface command or click the button
4 Choose the grid file TUTORWSGRD from the list of files in the Open Grid dialog click Openand the surface is created using the default settings (TUTORWSGRD created in Lesson 2 -Creating a Grid File is located in Surfers SAMPLES folder)
Adding an Overlay
You can overlay base contour post image shaded relief 1-grid vector maps and 2-grid vector
maps on surfaces All overlays except other surfaces are converted into a type of bitmap knownas a texture map This texture map is then applied to the surface by stretching it and shrinking it anecessary When these maps are overlaid you have a choice on how to treat the texture map Yocan use the colors from overlays only from the surface only or blend colors from the overlays andsurface For example you could create a color filled contour map overlay the contour map andsurface and then use the colors from the contour map only
When multiple surfaces of differing elevations are overlaid the surfaces can intersect and overlapeach other If the surfaces are adjacent to each other in the X or Y direction the surfaces aredrawn side-by-side after using Map | Overlay Maps In this example we will overlay a plane withthe surface you just created
8152019 Surfer 8 Geology Tutorial
httpslidepdfcomreaderfullsurfer-8-geology-tutorial 2022
2
First create the surface plane
1 Select the Map | Surface command or click the button
2 In the Open Grid dialog open Surfers SAMPLES folder and select TUTORPLGRD
3 Click Open and the surface is created using the default settings
4 Right click on the upper 3D Surface in the Object Manager choose Object ID and add the textTUTORPLGRD to the end of the 3D Surface label to make it easier to distinguish the twosurfaces in the Object Manager list
Adding a Mesh
Mesh lines can be applied to surfaces
To add a mesh
1 Double-click on the surface to open the surface properties
2 Click the Mesh page
8152019 Surfer 8 Geology Tutorial
httpslidepdfcomreaderfullsurfer-8-geology-tutorial 2122
2
3 Check the X and Y boxes
4 Change the Frequency to 5 for the X and Y lines
5 Click the OK or Apply button to add a mesh to the selected surface
Notice that the mesh is applied to the selected surface within the composite map not to both
surfaces With all map types you can only change the map-specific properties of one map at atime Properties that apply to all overlays in the composite map include View Scale Limits andBackground
Changing Colors
Changing color schemes on surfaces is similar to changing colors on other map types such asimage maps or contour maps The Color Spectrum dialog is used to load previously defined colorschemes and it is also used to create your own color schemes
Before experimenting with color lets create a new surface map in a new plot window
1 Click File | New or click the button
2 In the New dialog select Plot Document and then click OK
3 Select the Map | Surface command or click the button
4 In the Open Grid dialog open Surfers SAMPLES folder and select any grid file [GRD]HELENS2GRD is a good choice for experimenting with color
5 Click Open and the surface is created using the default settings
To change the surface material color
1 Double-click on the surface to open the surface properties
2 There is a Material Color group on the General page Click the Upper button
3 Click the Load button in the Color Spectrum dialog
8152019 Surfer 8 Geology Tutorial
httpslidepdfcomreaderfullsurfer-8-geology-tutorial 2222
2
4 The color schemes are stored in color spectrum files containing a [CLR] extension Bydefault Surfer opens in the SAMPLES folder which contains many predefined color spectrums(Browse to the SAMPLES folder if it is not open) Click on one of the [CLR] files to select it andthen click the Open button
5 Notice that the colors and anchor node positions have changed in the Color Spectrum dialog Click OK in the Color Spectrum dialog to return to the surface map properties dialog
6 Click the Apply button in the surface map properties dialog to see your color changes Drag thesurface map properties off to the side if you cannot see the map
You can continue to experiment with the colors by clicking the Upper button and loading other colospectrum files This is the end of the tutorial If you still have questions try looking for answers inthe online help and users guide If you find you still have questions do not hesitate to contactGolden Softwarersquos technical support
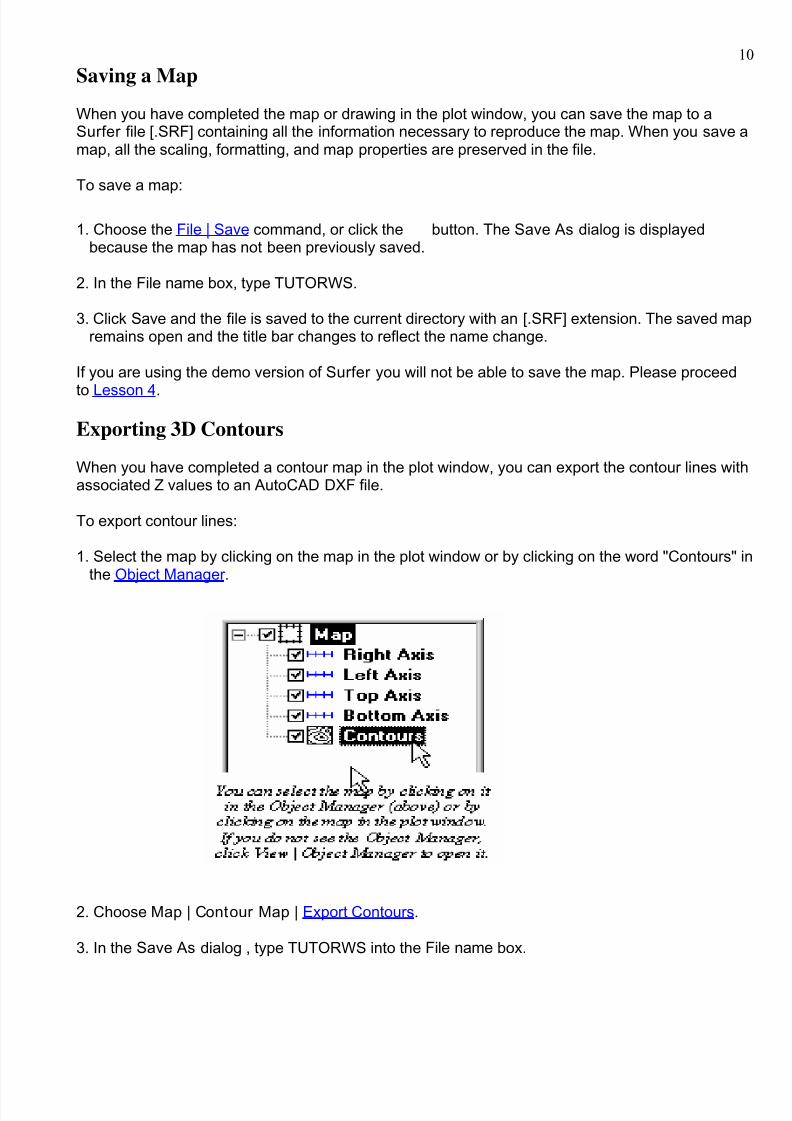
8152019 Surfer 8 Geology Tutorial
httpslidepdfcomreaderfullsurfer-8-geology-tutorial 1022
Saving a Map
When you have completed the map or drawing in the plot window you can save the map to aSurfer file [SRF] containing all the information necessary to reproduce the map When you save amap all the scaling formatting and map properties are preserved in the file
To save a map
1 Choose the File | Save command or click the button The Save As dialog is displayedbecause the map has not been previously saved
2 In the File name box type TUTORWS
3 Click Save and the file is saved to the current directory with an [SRF] extension The saved maremains open and the title bar changes to reflect the name change
If you are using the demo version of Surfer you will not be able to save the map Please proceed
to Lesson 4
Exporting 3D Contours
When you have completed a contour map in the plot window you can export the contour lines witassociated Z values to an AutoCAD DXF file
To export contour lines
1 Select the map by clicking on the map in the plot window or by clicking on the word Contours the Object Manager
2 Choose Map | Contour Map | Export Contours
3 In the Save As dialog type TUTORWS into the File name box
8152019 Surfer 8 Geology Tutorial
httpslidepdfcomreaderfullsurfer-8-geology-tutorial 1122
4 Click Save and the file is exported to the current directory This creates a file titledTUTORWSDXF which can be opened in any program with an AutoCAD DXF import option
If you are using the demo version of Surfer you will not be able to export contours Please proceeto Lesson 4
Lesson 4 - Creating a Wireframe
Wireframes are three-dimensional representations of a grid file Wireframes are block diagrams generated
by drawing lines representing the grid X and Y lines (the grid columns and rows) At each intersection of a
column and row (ie at each grid node) the height of the surface is proportional to the grid Z value at that point The number of columns and rows in the grid file determines the number of X and Y lines drawn on th
wireframe
Creating a New Wireframe
To create a new wireframe
1 Select the File | New command or click the button
2 SelectPlot Document
in theNew
dialog and click OK A new empty plot window is displayed
3 Select the Map | Wireframe command or click the button
4 Choose the grid file TUTORWSGRD from the list of files in the Open Grid dialog click Openand the map is created (TUTORWSGRD created in Lesson 2 - Creating a Grid File is locatedin Surfers SAMPLES folder)
8152019 Surfer 8 Geology Tutorial
httpslidepdfcomreaderfullsurfer-8-geology-tutorial 1222
Changing the Orientation of a Wireframe
Although this example uses a wireframe to illustrate rotation and tilt you can perform this operatioon most map types in Surfer
To change rotation and tilt
1 Click on the map once to select it
2 Click the Map | Trackball command or click the button
3 Click the left mouse button and hold it while moving the mouse to the left and right This changethe rotation of the wireframe The rotation is listed in the status bar
4 Click the left mouse button and hold it while moving the mouse up and down This changes thetilt of the map The tilt is listed in the status bar
5 Once you have rotated and tilted the map click the ESC key on your keyboard to end trackballmode
Changing the rotation tilt field of view and projection can also be accomplished by double clickinthe wireframe and using the options on the View page
8152019 Surfer 8 Geology Tutorial
httpslidepdfcomreaderfullsurfer-8-geology-tutorial 1322
Changing the Scaling of a Wireframe
You can change the scaling of wireframes and surfaces in three dimensions In this example thescaling is changed and the wireframe becomes somewhat exaggerated in the Z dimension
To change the Z scaling
1 Double-click the wireframe to open the map properties
2 Click the Scale page You can set scaling by entering the number of map units per inch or byentering the length for the map in page coordinates
3 In the Length box of the Z Scale group change the value to 3 by scrolling to 3 or by highlightingthe existing value and typing 3 The Map units value changes to reflect the change you made
4 Click OK and the wireframe is redrawn exaggerated in the Z dimension
Adding Color Zones to a Wireframe
You can change the line colors of any wireframe by applying color zones In this example we willchange color zones gradationally and individually
To add a color zone to a wireframe
1 Double-click on the wireframe and the wireframe properties dialog is displayed
2 Click on the Color Zones page
3 Click on the Line button to display the Line Spectrum dialog
8152019 Surfer 8 Geology Tutorial
httpslidepdfcomreaderfullsurfer-8-geology-tutorial 1422
8152019 Surfer 8 Geology Tutorial
httpslidepdfcomreaderfullsurfer-8-geology-tutorial 1522
Lesson 5 - Posting Data Points and Working with Overlays
Post maps are created by placing points on a map and labeling the points Posting data points ona map can be useful in determining the distribution of data points as well as placing data or textinformation at specific points on the map Data files contain the XY coordinates used to position thpoints on the map Data files can also contain the labels associated with each point
Creating Post Maps
When a new post map is created it is independent of any other maps in the current plot windowWhen the two maps are displayed notice that two sets of axes are also displayed one set for eacmap When you use the Map | Overlay Maps command the two maps are combined into a singlemap overlay with one set of axes
To create a post map
1 Choose File | Open to display the Open dialog Choose TUTORIALSRF in the SAMPLES
directory and then click the Open button TUTORIALSRF opens and contains a contour map
2 Select the Map | Post Map | New Post Map command or click the button
3 Choose TUTORWSDAT from the list of files in the Open dialog (TUTORWSDAT is located inSurfers SAMPLES folder)
4 Click Open and the post map is created using the default properties
The contour map and post map are two separate maps on the page If you look closely at the Xaxis you will notice the two sets of axis tick labels for the two maps Also there are two map
frames and axes sets listed in the Object Manager We will line up the maps with the Overlay command after changing the post map properties
Changing the Post Map Properties
To change the post map properties
1 Open the Object Manager if it is not already open The Object Manager is open if there is acheck mark displayed next to the words Object Manager in the View menu If there is no checkmark click on the command once
2 Right click on the word Post in the Object Manager
3 Select Properties from the context menu
4 In the post map properties dialog General page click the symbol button to open the SymbolProperties dialog
5 Choose the filled circle symbol from the palette and click OK The selected symbol appears inthe symbol button
6 Click the Apply button and the symbol appears at the posted data points on the map
8152019 Surfer 8 Geology Tutorial
httpslidepdfcomreaderfullsurfer-8-geology-tutorial 1622
7 In the Fixed Size box (Symbol Size group) specify a size of 009 in
8 Click OK and the post map is drawn with the new symbol size
Overlaying Maps ndash Tutorial
To overlay maps
1 To see the two separate maps place the mouse pointer in the center of the maps and clickPress and hold the left mouse button and move the pointer slightly in any direction Release thebutton and the two maps are offset
2 Click Edit | Select All to select both maps
3 Choose the Map | Overlay Maps command to combine the two maps into a single compositemap
8152019 Surfer 8 Geology Tutorial
httpslidepdfcomreaderfullsurfer-8-geology-tutorial 1722
Selecting an Overlay and Assigning an Object ID
After creating a composite map you can still modify the individual overlays in the map
Selecting Maps
An individual overlay can be selected in the composite map by clicking on the overlay in the plotwindow or clicking on the overlay in the Object Manager
The easiest way to select an overlay in a composite map is to click on the overlay name in theObject Manager However you can also select the overlay in the plot window with the mouseWhenever two or more objects occupy the same position in the plot window use the CTRL key anthe left mouse button to select the desired object The CTRL key allows you to cycle through theselection of overlapping objects For example if you want to select a text block behind a rectanglehold down the CTRL key and click until the text is selected You can use the status bar to help you to
determine which object is selected
Renaming the Post Map
To select an overlay and assign an ID
1 Make sure the Object Manager is open If the Object Manager is not open click View | ObjecManager
2 Click the overlay name in the Object Manager In this case click the word Post The status bshould now report Map Post
3 Choose Edit | Object ID
4 In the Object ID dialog type the name Tutorial Post Map and click OK The status bar ObjecManager and properties dialog title reflect the name change
8152019 Surfer 8 Geology Tutorial
httpslidepdfcomreaderfullsurfer-8-geology-tutorial 1822
If you double-click on Tutorial Post Map in the Object Manager notice that the properties dialogtitle changes to Map Tutorial Post Map Properties When you rename an object in Surfer 8 theobjects properties dialog reflects the name change making it easier for you to keep track of theobject you are editing For example if you have eight post maps in the plot window it is beneficialto change the post map names to something meaningful to save time when trying to edit themThis is especially important because the properties dialog can stay open when changing selection
Adding Labels to the Post Map
You can add labels to the data points on post maps The post map can be selected by a fewdifferent methods though only the Object Manager method is discussed here
To add labels
1 Right-click on Tutorial Post Map in the Object Manager and choose Properties
2 Click on the Labels page In the Worksheet Column for Labels group click the drop-down arrowand a list of columns in TUTORWSDAT is displayed
3 Select Column C Elevation from the list
4 Click the Format button to open the Label Format dialog
5 Change the Type to Fixed and the Decimal Digits value to zero
6 Click OK to return to the post map properties dialog
7 Click OK and the overlay is redrawn with labels on each of the data points
8152019 Surfer 8 Geology Tutorial
httpslidepdfcomreaderfullsurfer-8-geology-tutorial 1922
Lesson 6 - Introducing Surfaces
Surfaces are new to Surfer 8 They are similar to wireframes except that surfaces are three-dimensional shaded renderings of a grid file Surfaces provide an impressive visual interpretationof data Surfaces can be overlaid with other surfaces so that the surfaces will intersect with eachother Surfaces can also have overlays of other map types excluding wireframes
Creating a Surface
To create a surface
1 Select the File | New command or click the button
2 Select Plot Document in the New dialog and click OK A new empty plot window is displayed
3 Select the Map | Surface command or click the button
4 Choose the grid file TUTORWSGRD from the list of files in the Open Grid dialog click Openand the surface is created using the default settings (TUTORWSGRD created in Lesson 2 -Creating a Grid File is located in Surfers SAMPLES folder)
Adding an Overlay
You can overlay base contour post image shaded relief 1-grid vector maps and 2-grid vector
maps on surfaces All overlays except other surfaces are converted into a type of bitmap knownas a texture map This texture map is then applied to the surface by stretching it and shrinking it anecessary When these maps are overlaid you have a choice on how to treat the texture map Yocan use the colors from overlays only from the surface only or blend colors from the overlays andsurface For example you could create a color filled contour map overlay the contour map andsurface and then use the colors from the contour map only
When multiple surfaces of differing elevations are overlaid the surfaces can intersect and overlapeach other If the surfaces are adjacent to each other in the X or Y direction the surfaces aredrawn side-by-side after using Map | Overlay Maps In this example we will overlay a plane withthe surface you just created
8152019 Surfer 8 Geology Tutorial
httpslidepdfcomreaderfullsurfer-8-geology-tutorial 2022
2
First create the surface plane
1 Select the Map | Surface command or click the button
2 In the Open Grid dialog open Surfers SAMPLES folder and select TUTORPLGRD
3 Click Open and the surface is created using the default settings
4 Right click on the upper 3D Surface in the Object Manager choose Object ID and add the textTUTORPLGRD to the end of the 3D Surface label to make it easier to distinguish the twosurfaces in the Object Manager list
Adding a Mesh
Mesh lines can be applied to surfaces
To add a mesh
1 Double-click on the surface to open the surface properties
2 Click the Mesh page
8152019 Surfer 8 Geology Tutorial
httpslidepdfcomreaderfullsurfer-8-geology-tutorial 2122
2
3 Check the X and Y boxes
4 Change the Frequency to 5 for the X and Y lines
5 Click the OK or Apply button to add a mesh to the selected surface
Notice that the mesh is applied to the selected surface within the composite map not to both
surfaces With all map types you can only change the map-specific properties of one map at atime Properties that apply to all overlays in the composite map include View Scale Limits andBackground
Changing Colors
Changing color schemes on surfaces is similar to changing colors on other map types such asimage maps or contour maps The Color Spectrum dialog is used to load previously defined colorschemes and it is also used to create your own color schemes
Before experimenting with color lets create a new surface map in a new plot window
1 Click File | New or click the button
2 In the New dialog select Plot Document and then click OK
3 Select the Map | Surface command or click the button
4 In the Open Grid dialog open Surfers SAMPLES folder and select any grid file [GRD]HELENS2GRD is a good choice for experimenting with color
5 Click Open and the surface is created using the default settings
To change the surface material color
1 Double-click on the surface to open the surface properties
2 There is a Material Color group on the General page Click the Upper button
3 Click the Load button in the Color Spectrum dialog
8152019 Surfer 8 Geology Tutorial
httpslidepdfcomreaderfullsurfer-8-geology-tutorial 2222
2
4 The color schemes are stored in color spectrum files containing a [CLR] extension Bydefault Surfer opens in the SAMPLES folder which contains many predefined color spectrums(Browse to the SAMPLES folder if it is not open) Click on one of the [CLR] files to select it andthen click the Open button
5 Notice that the colors and anchor node positions have changed in the Color Spectrum dialog Click OK in the Color Spectrum dialog to return to the surface map properties dialog
6 Click the Apply button in the surface map properties dialog to see your color changes Drag thesurface map properties off to the side if you cannot see the map
You can continue to experiment with the colors by clicking the Upper button and loading other colospectrum files This is the end of the tutorial If you still have questions try looking for answers inthe online help and users guide If you find you still have questions do not hesitate to contactGolden Softwarersquos technical support
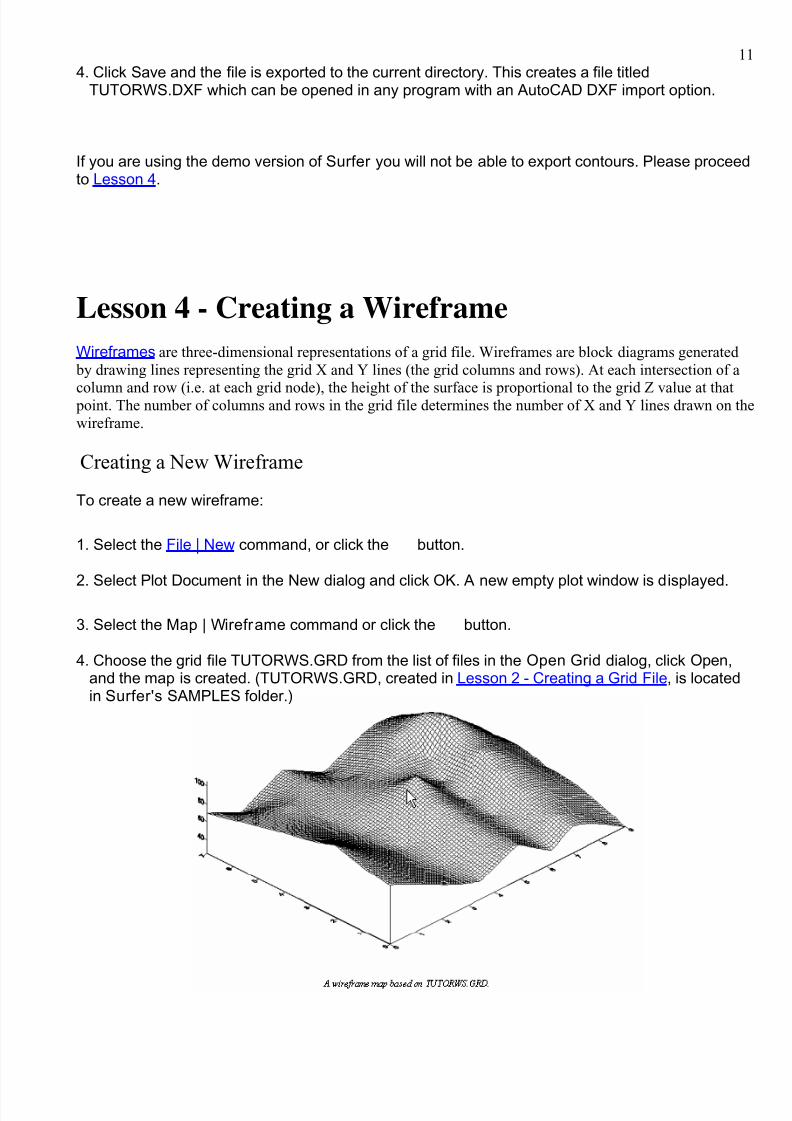
8152019 Surfer 8 Geology Tutorial
httpslidepdfcomreaderfullsurfer-8-geology-tutorial 1622
7 In the Fixed Size box (Symbol Size group) specify a size of 009 in
8 Click OK and the post map is drawn with the new symbol size
Overlaying Maps ndash Tutorial
To overlay maps
1 To see the two separate maps place the mouse pointer in the center of the maps and clickPress and hold the left mouse button and move the pointer slightly in any direction Release thebutton and the two maps are offset
2 Click Edit | Select All to select both maps
3 Choose the Map | Overlay Maps command to combine the two maps into a single compositemap
8152019 Surfer 8 Geology Tutorial
httpslidepdfcomreaderfullsurfer-8-geology-tutorial 1722
Selecting an Overlay and Assigning an Object ID
After creating a composite map you can still modify the individual overlays in the map
Selecting Maps
An individual overlay can be selected in the composite map by clicking on the overlay in the plotwindow or clicking on the overlay in the Object Manager
The easiest way to select an overlay in a composite map is to click on the overlay name in theObject Manager However you can also select the overlay in the plot window with the mouseWhenever two or more objects occupy the same position in the plot window use the CTRL key anthe left mouse button to select the desired object The CTRL key allows you to cycle through theselection of overlapping objects For example if you want to select a text block behind a rectanglehold down the CTRL key and click until the text is selected You can use the status bar to help you to
determine which object is selected
Renaming the Post Map
To select an overlay and assign an ID
1 Make sure the Object Manager is open If the Object Manager is not open click View | ObjecManager
2 Click the overlay name in the Object Manager In this case click the word Post The status bshould now report Map Post
3 Choose Edit | Object ID
4 In the Object ID dialog type the name Tutorial Post Map and click OK The status bar ObjecManager and properties dialog title reflect the name change
8152019 Surfer 8 Geology Tutorial
httpslidepdfcomreaderfullsurfer-8-geology-tutorial 1822
If you double-click on Tutorial Post Map in the Object Manager notice that the properties dialogtitle changes to Map Tutorial Post Map Properties When you rename an object in Surfer 8 theobjects properties dialog reflects the name change making it easier for you to keep track of theobject you are editing For example if you have eight post maps in the plot window it is beneficialto change the post map names to something meaningful to save time when trying to edit themThis is especially important because the properties dialog can stay open when changing selection
Adding Labels to the Post Map
You can add labels to the data points on post maps The post map can be selected by a fewdifferent methods though only the Object Manager method is discussed here
To add labels
1 Right-click on Tutorial Post Map in the Object Manager and choose Properties
2 Click on the Labels page In the Worksheet Column for Labels group click the drop-down arrowand a list of columns in TUTORWSDAT is displayed
3 Select Column C Elevation from the list
4 Click the Format button to open the Label Format dialog
5 Change the Type to Fixed and the Decimal Digits value to zero
6 Click OK to return to the post map properties dialog
7 Click OK and the overlay is redrawn with labels on each of the data points
8152019 Surfer 8 Geology Tutorial
httpslidepdfcomreaderfullsurfer-8-geology-tutorial 1922
Lesson 6 - Introducing Surfaces
Surfaces are new to Surfer 8 They are similar to wireframes except that surfaces are three-dimensional shaded renderings of a grid file Surfaces provide an impressive visual interpretationof data Surfaces can be overlaid with other surfaces so that the surfaces will intersect with eachother Surfaces can also have overlays of other map types excluding wireframes
Creating a Surface
To create a surface
1 Select the File | New command or click the button
2 Select Plot Document in the New dialog and click OK A new empty plot window is displayed
3 Select the Map | Surface command or click the button
4 Choose the grid file TUTORWSGRD from the list of files in the Open Grid dialog click Openand the surface is created using the default settings (TUTORWSGRD created in Lesson 2 -Creating a Grid File is located in Surfers SAMPLES folder)
Adding an Overlay
You can overlay base contour post image shaded relief 1-grid vector maps and 2-grid vector
maps on surfaces All overlays except other surfaces are converted into a type of bitmap knownas a texture map This texture map is then applied to the surface by stretching it and shrinking it anecessary When these maps are overlaid you have a choice on how to treat the texture map Yocan use the colors from overlays only from the surface only or blend colors from the overlays andsurface For example you could create a color filled contour map overlay the contour map andsurface and then use the colors from the contour map only
When multiple surfaces of differing elevations are overlaid the surfaces can intersect and overlapeach other If the surfaces are adjacent to each other in the X or Y direction the surfaces aredrawn side-by-side after using Map | Overlay Maps In this example we will overlay a plane withthe surface you just created
8152019 Surfer 8 Geology Tutorial
httpslidepdfcomreaderfullsurfer-8-geology-tutorial 2022
2
First create the surface plane
1 Select the Map | Surface command or click the button
2 In the Open Grid dialog open Surfers SAMPLES folder and select TUTORPLGRD
3 Click Open and the surface is created using the default settings
4 Right click on the upper 3D Surface in the Object Manager choose Object ID and add the textTUTORPLGRD to the end of the 3D Surface label to make it easier to distinguish the twosurfaces in the Object Manager list
Adding a Mesh
Mesh lines can be applied to surfaces
To add a mesh
1 Double-click on the surface to open the surface properties
2 Click the Mesh page
8152019 Surfer 8 Geology Tutorial
httpslidepdfcomreaderfullsurfer-8-geology-tutorial 2122
2
3 Check the X and Y boxes
4 Change the Frequency to 5 for the X and Y lines
5 Click the OK or Apply button to add a mesh to the selected surface
Notice that the mesh is applied to the selected surface within the composite map not to both
surfaces With all map types you can only change the map-specific properties of one map at atime Properties that apply to all overlays in the composite map include View Scale Limits andBackground
Changing Colors
Changing color schemes on surfaces is similar to changing colors on other map types such asimage maps or contour maps The Color Spectrum dialog is used to load previously defined colorschemes and it is also used to create your own color schemes
Before experimenting with color lets create a new surface map in a new plot window
1 Click File | New or click the button
2 In the New dialog select Plot Document and then click OK
3 Select the Map | Surface command or click the button
4 In the Open Grid dialog open Surfers SAMPLES folder and select any grid file [GRD]HELENS2GRD is a good choice for experimenting with color
5 Click Open and the surface is created using the default settings
To change the surface material color
1 Double-click on the surface to open the surface properties
2 There is a Material Color group on the General page Click the Upper button
3 Click the Load button in the Color Spectrum dialog
8152019 Surfer 8 Geology Tutorial
httpslidepdfcomreaderfullsurfer-8-geology-tutorial 2222
2
4 The color schemes are stored in color spectrum files containing a [CLR] extension Bydefault Surfer opens in the SAMPLES folder which contains many predefined color spectrums(Browse to the SAMPLES folder if it is not open) Click on one of the [CLR] files to select it andthen click the Open button
5 Notice that the colors and anchor node positions have changed in the Color Spectrum dialog Click OK in the Color Spectrum dialog to return to the surface map properties dialog
6 Click the Apply button in the surface map properties dialog to see your color changes Drag thesurface map properties off to the side if you cannot see the map
You can continue to experiment with the colors by clicking the Upper button and loading other colospectrum files This is the end of the tutorial If you still have questions try looking for answers inthe online help and users guide If you find you still have questions do not hesitate to contactGolden Softwarersquos technical support
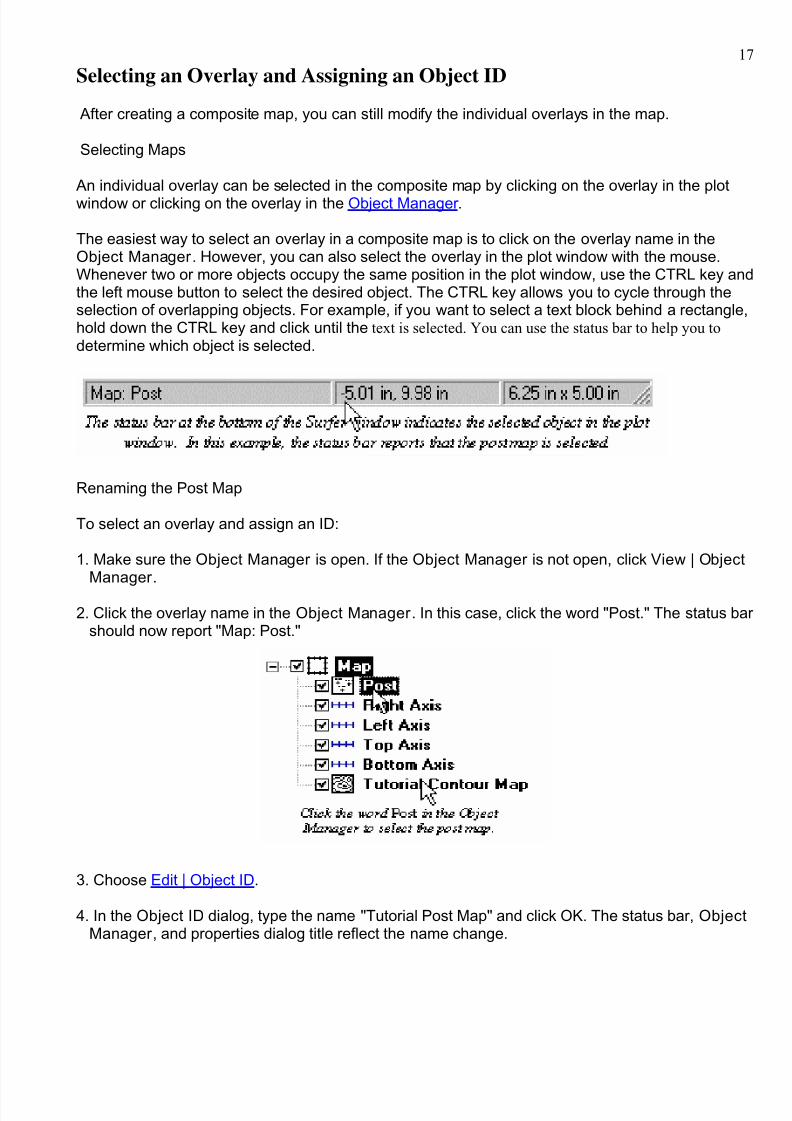
8152019 Surfer 8 Geology Tutorial
httpslidepdfcomreaderfullsurfer-8-geology-tutorial 1822
If you double-click on Tutorial Post Map in the Object Manager notice that the properties dialogtitle changes to Map Tutorial Post Map Properties When you rename an object in Surfer 8 theobjects properties dialog reflects the name change making it easier for you to keep track of theobject you are editing For example if you have eight post maps in the plot window it is beneficialto change the post map names to something meaningful to save time when trying to edit themThis is especially important because the properties dialog can stay open when changing selection
Adding Labels to the Post Map
You can add labels to the data points on post maps The post map can be selected by a fewdifferent methods though only the Object Manager method is discussed here
To add labels
1 Right-click on Tutorial Post Map in the Object Manager and choose Properties
2 Click on the Labels page In the Worksheet Column for Labels group click the drop-down arrowand a list of columns in TUTORWSDAT is displayed
3 Select Column C Elevation from the list
4 Click the Format button to open the Label Format dialog
5 Change the Type to Fixed and the Decimal Digits value to zero
6 Click OK to return to the post map properties dialog
7 Click OK and the overlay is redrawn with labels on each of the data points
8152019 Surfer 8 Geology Tutorial
httpslidepdfcomreaderfullsurfer-8-geology-tutorial 1922
Lesson 6 - Introducing Surfaces
Surfaces are new to Surfer 8 They are similar to wireframes except that surfaces are three-dimensional shaded renderings of a grid file Surfaces provide an impressive visual interpretationof data Surfaces can be overlaid with other surfaces so that the surfaces will intersect with eachother Surfaces can also have overlays of other map types excluding wireframes
Creating a Surface
To create a surface
1 Select the File | New command or click the button
2 Select Plot Document in the New dialog and click OK A new empty plot window is displayed
3 Select the Map | Surface command or click the button
4 Choose the grid file TUTORWSGRD from the list of files in the Open Grid dialog click Openand the surface is created using the default settings (TUTORWSGRD created in Lesson 2 -Creating a Grid File is located in Surfers SAMPLES folder)
Adding an Overlay
You can overlay base contour post image shaded relief 1-grid vector maps and 2-grid vector
maps on surfaces All overlays except other surfaces are converted into a type of bitmap knownas a texture map This texture map is then applied to the surface by stretching it and shrinking it anecessary When these maps are overlaid you have a choice on how to treat the texture map Yocan use the colors from overlays only from the surface only or blend colors from the overlays andsurface For example you could create a color filled contour map overlay the contour map andsurface and then use the colors from the contour map only
When multiple surfaces of differing elevations are overlaid the surfaces can intersect and overlapeach other If the surfaces are adjacent to each other in the X or Y direction the surfaces aredrawn side-by-side after using Map | Overlay Maps In this example we will overlay a plane withthe surface you just created
8152019 Surfer 8 Geology Tutorial
httpslidepdfcomreaderfullsurfer-8-geology-tutorial 2022
2
First create the surface plane
1 Select the Map | Surface command or click the button
2 In the Open Grid dialog open Surfers SAMPLES folder and select TUTORPLGRD
3 Click Open and the surface is created using the default settings
4 Right click on the upper 3D Surface in the Object Manager choose Object ID and add the textTUTORPLGRD to the end of the 3D Surface label to make it easier to distinguish the twosurfaces in the Object Manager list
Adding a Mesh
Mesh lines can be applied to surfaces
To add a mesh
1 Double-click on the surface to open the surface properties
2 Click the Mesh page
8152019 Surfer 8 Geology Tutorial
httpslidepdfcomreaderfullsurfer-8-geology-tutorial 2122
2
3 Check the X and Y boxes
4 Change the Frequency to 5 for the X and Y lines
5 Click the OK or Apply button to add a mesh to the selected surface
Notice that the mesh is applied to the selected surface within the composite map not to both
surfaces With all map types you can only change the map-specific properties of one map at atime Properties that apply to all overlays in the composite map include View Scale Limits andBackground
Changing Colors
Changing color schemes on surfaces is similar to changing colors on other map types such asimage maps or contour maps The Color Spectrum dialog is used to load previously defined colorschemes and it is also used to create your own color schemes
Before experimenting with color lets create a new surface map in a new plot window
1 Click File | New or click the button
2 In the New dialog select Plot Document and then click OK
3 Select the Map | Surface command or click the button
4 In the Open Grid dialog open Surfers SAMPLES folder and select any grid file [GRD]HELENS2GRD is a good choice for experimenting with color
5 Click Open and the surface is created using the default settings
To change the surface material color
1 Double-click on the surface to open the surface properties
2 There is a Material Color group on the General page Click the Upper button
3 Click the Load button in the Color Spectrum dialog
8152019 Surfer 8 Geology Tutorial
httpslidepdfcomreaderfullsurfer-8-geology-tutorial 2222
2
4 The color schemes are stored in color spectrum files containing a [CLR] extension Bydefault Surfer opens in the SAMPLES folder which contains many predefined color spectrums(Browse to the SAMPLES folder if it is not open) Click on one of the [CLR] files to select it andthen click the Open button
5 Notice that the colors and anchor node positions have changed in the Color Spectrum dialog Click OK in the Color Spectrum dialog to return to the surface map properties dialog
6 Click the Apply button in the surface map properties dialog to see your color changes Drag thesurface map properties off to the side if you cannot see the map
You can continue to experiment with the colors by clicking the Upper button and loading other colospectrum files This is the end of the tutorial If you still have questions try looking for answers inthe online help and users guide If you find you still have questions do not hesitate to contactGolden Softwarersquos technical support
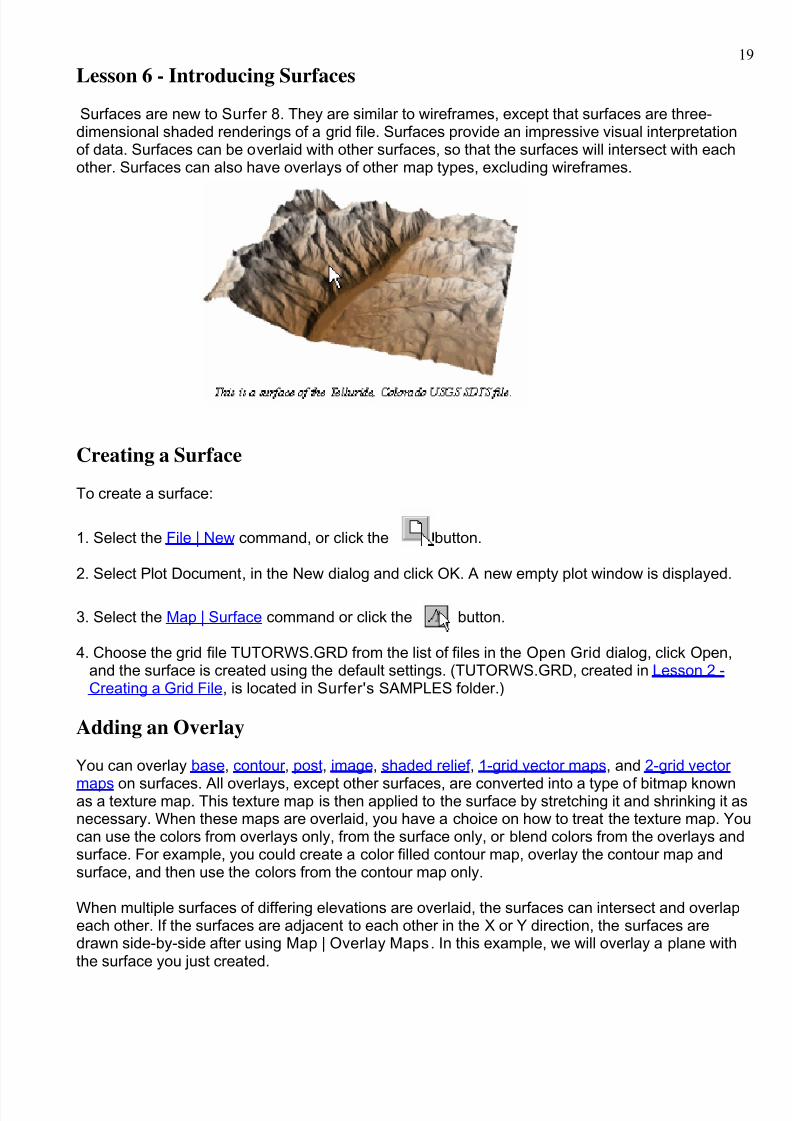
8152019 Surfer 8 Geology Tutorial
httpslidepdfcomreaderfullsurfer-8-geology-tutorial 2022
2
First create the surface plane
1 Select the Map | Surface command or click the button
2 In the Open Grid dialog open Surfers SAMPLES folder and select TUTORPLGRD
3 Click Open and the surface is created using the default settings
4 Right click on the upper 3D Surface in the Object Manager choose Object ID and add the textTUTORPLGRD to the end of the 3D Surface label to make it easier to distinguish the twosurfaces in the Object Manager list
Adding a Mesh
Mesh lines can be applied to surfaces
To add a mesh
1 Double-click on the surface to open the surface properties
2 Click the Mesh page
8152019 Surfer 8 Geology Tutorial
httpslidepdfcomreaderfullsurfer-8-geology-tutorial 2122
2
3 Check the X and Y boxes
4 Change the Frequency to 5 for the X and Y lines
5 Click the OK or Apply button to add a mesh to the selected surface
Notice that the mesh is applied to the selected surface within the composite map not to both
surfaces With all map types you can only change the map-specific properties of one map at atime Properties that apply to all overlays in the composite map include View Scale Limits andBackground
Changing Colors
Changing color schemes on surfaces is similar to changing colors on other map types such asimage maps or contour maps The Color Spectrum dialog is used to load previously defined colorschemes and it is also used to create your own color schemes
Before experimenting with color lets create a new surface map in a new plot window
1 Click File | New or click the button
2 In the New dialog select Plot Document and then click OK
3 Select the Map | Surface command or click the button
4 In the Open Grid dialog open Surfers SAMPLES folder and select any grid file [GRD]HELENS2GRD is a good choice for experimenting with color
5 Click Open and the surface is created using the default settings
To change the surface material color
1 Double-click on the surface to open the surface properties
2 There is a Material Color group on the General page Click the Upper button
3 Click the Load button in the Color Spectrum dialog
8152019 Surfer 8 Geology Tutorial
httpslidepdfcomreaderfullsurfer-8-geology-tutorial 2222
2
4 The color schemes are stored in color spectrum files containing a [CLR] extension Bydefault Surfer opens in the SAMPLES folder which contains many predefined color spectrums(Browse to the SAMPLES folder if it is not open) Click on one of the [CLR] files to select it andthen click the Open button
5 Notice that the colors and anchor node positions have changed in the Color Spectrum dialog Click OK in the Color Spectrum dialog to return to the surface map properties dialog
6 Click the Apply button in the surface map properties dialog to see your color changes Drag thesurface map properties off to the side if you cannot see the map
You can continue to experiment with the colors by clicking the Upper button and loading other colospectrum files This is the end of the tutorial If you still have questions try looking for answers inthe online help and users guide If you find you still have questions do not hesitate to contactGolden Softwarersquos technical support
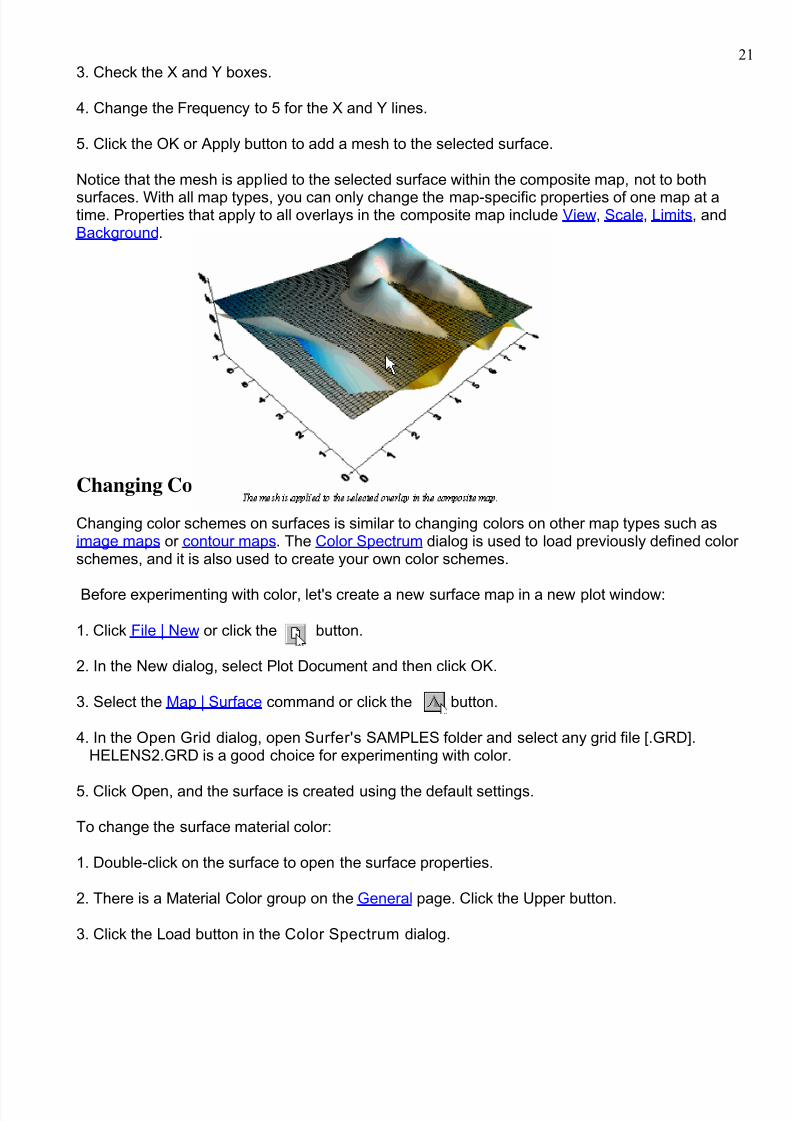
8152019 Surfer 8 Geology Tutorial
httpslidepdfcomreaderfullsurfer-8-geology-tutorial 2222
2
4 The color schemes are stored in color spectrum files containing a [CLR] extension Bydefault Surfer opens in the SAMPLES folder which contains many predefined color spectrums(Browse to the SAMPLES folder if it is not open) Click on one of the [CLR] files to select it andthen click the Open button
5 Notice that the colors and anchor node positions have changed in the Color Spectrum dialog Click OK in the Color Spectrum dialog to return to the surface map properties dialog
6 Click the Apply button in the surface map properties dialog to see your color changes Drag thesurface map properties off to the side if you cannot see the map
You can continue to experiment with the colors by clicking the Upper button and loading other colospectrum files This is the end of the tutorial If you still have questions try looking for answers inthe online help and users guide If you find you still have questions do not hesitate to contactGolden Softwarersquos technical support
Recommended