SUPPORTING STRATEGIC INVESTMENT CHOICES IN AGRICULTURAL TECHNOLOGY DEVELOPMENT AND ADOPTION
1. HarvestChoice & Technology Platform2. Household data3. Africa RISING M&E
B E L I Y O U H A I L E monitoring and evaluation
C A R L O A Z Z A R R I microeconomics, poverty
E L O D I E V A L E T T Eparticipatory GIS, spatial analysis
C I N D Y C O X technical writer, technology evaluation
C L E O R O B E R T S farming systems characterization
I V Y R O M E R O administrative coordinator
J A W O O K O O crop/technology modeling,
M A R I A C O M A N E S C U web development, programming
M E L A N I E B A C O U project management, microeconomics
Q U E E N I E G O N Gdata management, SPAM
S A R A S I G N O R E L L IMicroeconomics, impact evaluation
H O - Y O U N G K W O Ncrop and soil process modeling
U L R I K E W O O D - S I C H R A data management, SPAM, DREAM
Z H E G U O GIS coordinator, market accessibility, remote sensing
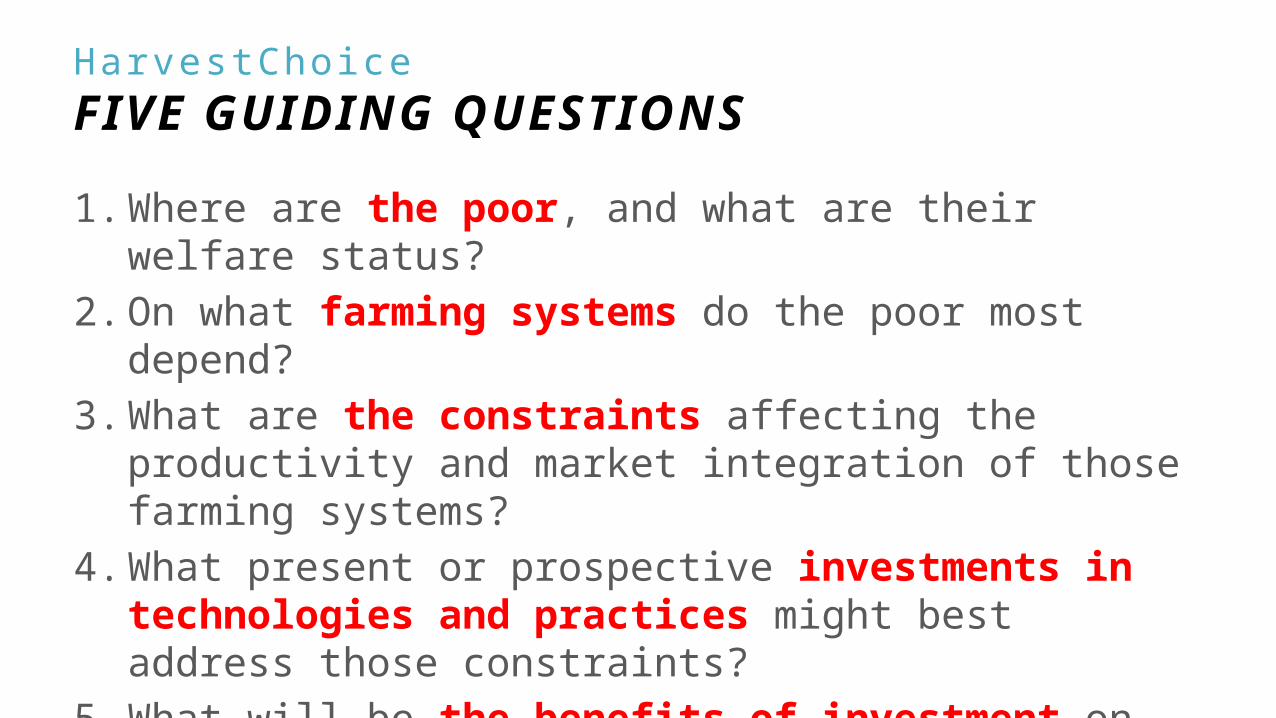
Har vestChoiceFIVE GUIDING QUESTIONS
1. Where are the poor, and what are their welfare status?
2. On what farming systems do the poor most depend?
3. What are the constraints affecting the productivity and market integration of those farming systems?
4. What present or prospective investments in technologies and practices might best address those constraints?
5. What will be the benefits of investment on productivity, income, and the reduction of poverty and hunger?
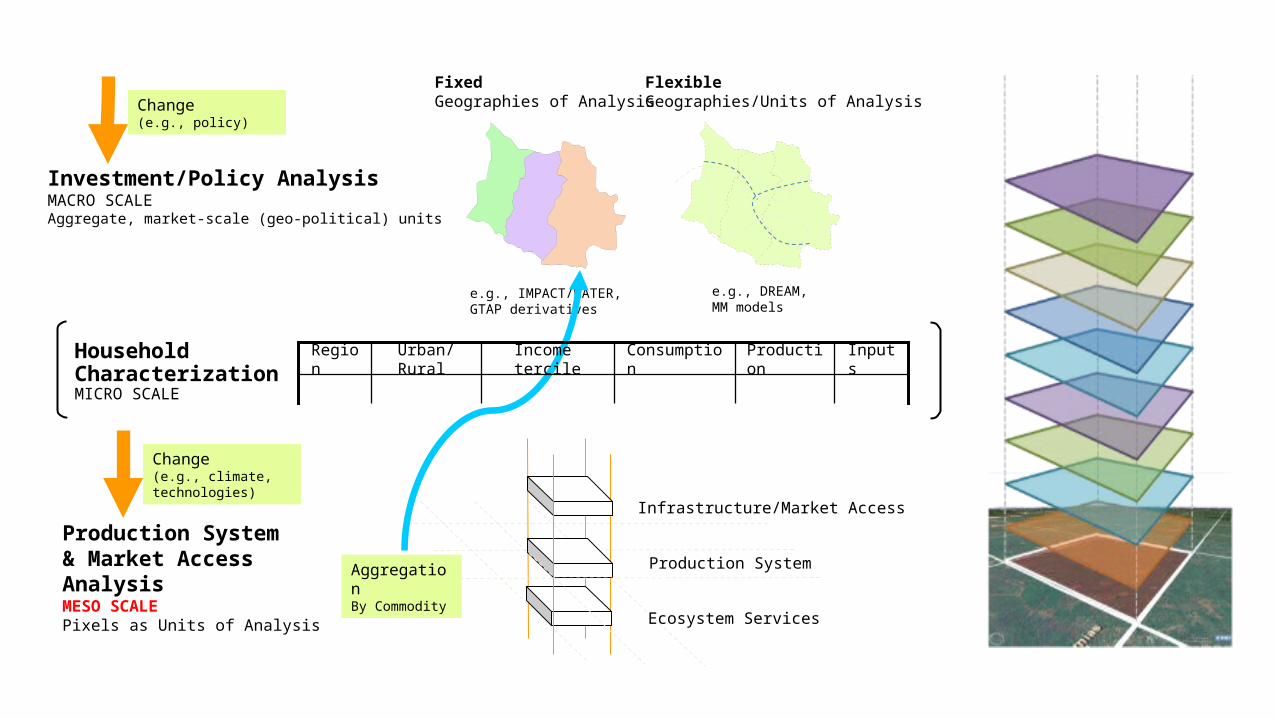
Production System& Market Access AnalysisMESO SCALEPixels as Units of Analysis
Production System
Ecosystem Services
Infrastructure/Market Access
Investment/Policy AnalysisMACRO SCALEAggregate, market-scale (geo-political) units
Fixed Geographies of Analysis
e.g., IMPACT/WATER,GTAP derivatives
Flexible Geographies/Units of Analysis
e.g., DREAM,MM models
AggregationBy Commodity
Urban/Rural Consumption InputsProductionIncome tercileRegionHousehold CharacterizationMICRO SCALE
Change(e.g., policy)
Change(e.g., climate,technologies)
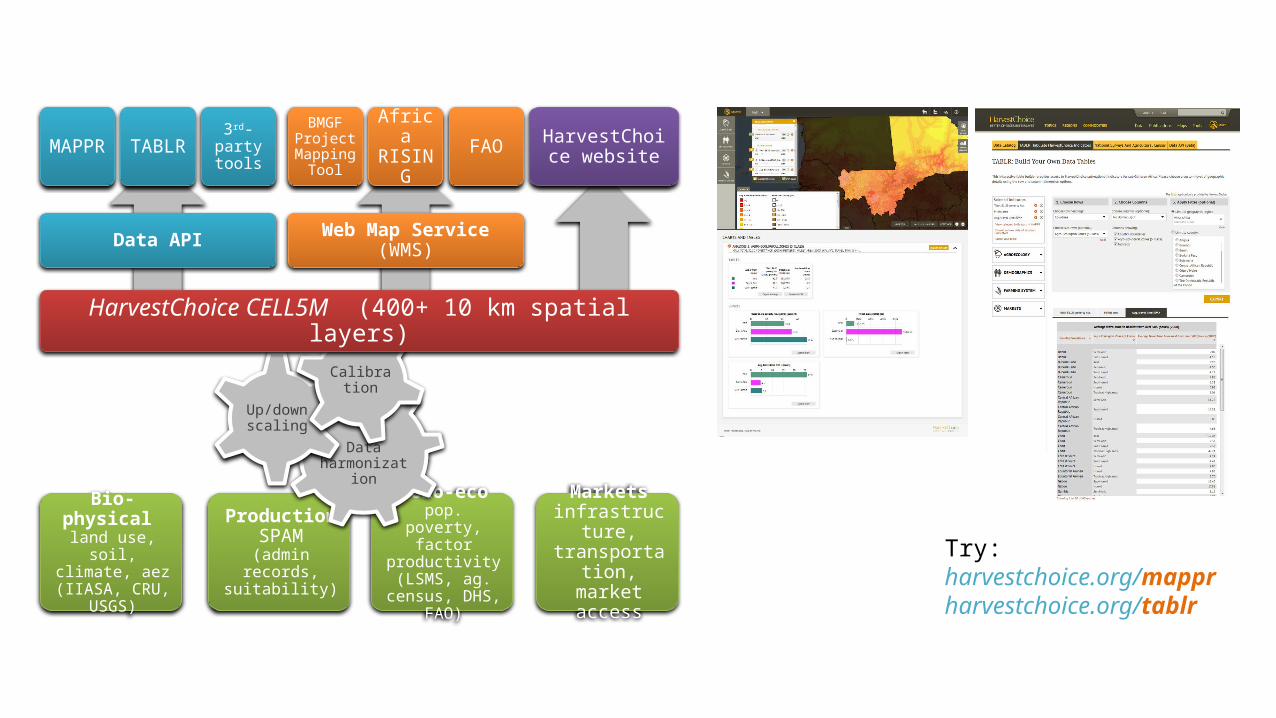
Bio-physical land use, soil,
climate, aez (IIASA, CRU, USGS)
ProductionSPAM
(admin records, suitability)
Socio-eco pop. poverty,
factor productivity(LSMS, ag. census,
DHS, FAO)
Marketsinfrastructure, transportation, market access
Data harmonization
Up/down scaling
Calibration
HarvestChoice CELL5M (400+ 10 km spatial layers)
Data API
MAPPR TABLR 3rd-party tools
Web Map Service (WMS)
BMGF Project
Mapping Tool
Africa RISING FAO HarvestChoice
website
Try:harvestchoice.org/mapprharvestchoice.org/tablr
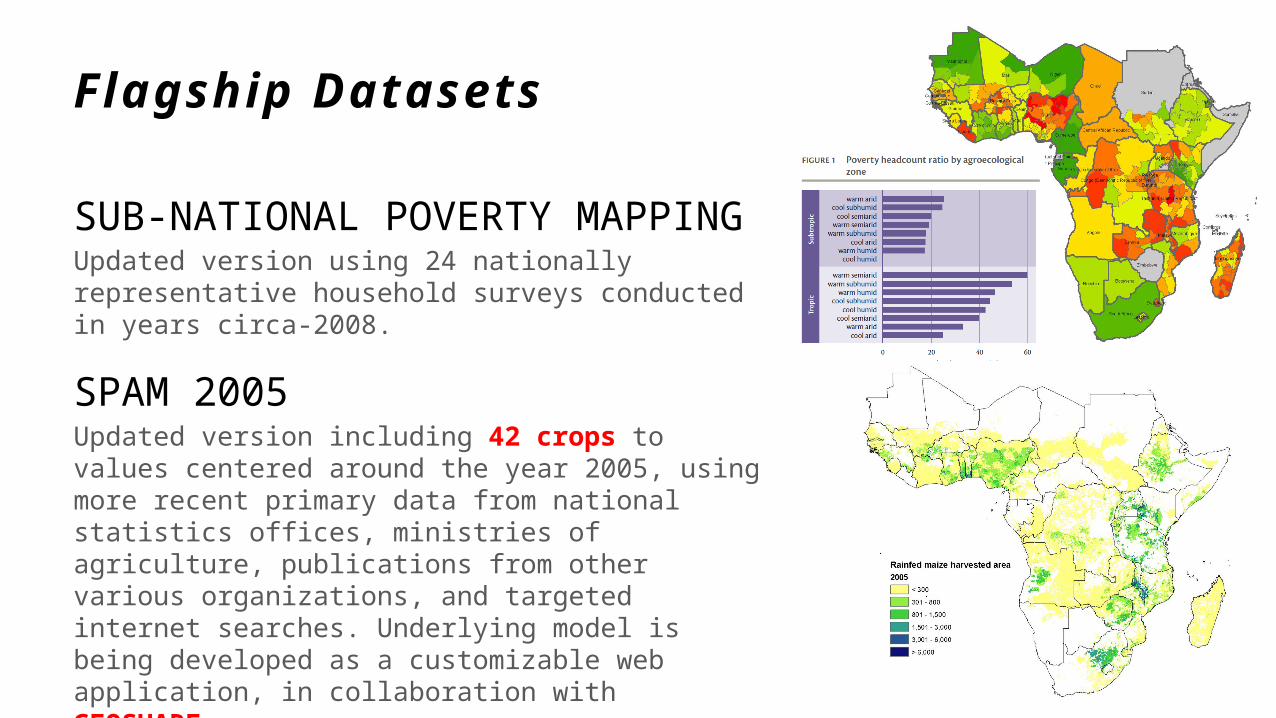
Flagship Datasets
SUB-NATIONAL POVERTY MAPPINGUpdated version using 24 nationally representative household surveys conducted in years circa-2008.
SPAM 2005Updated version including 42 crops to values centered around the year 2005, using more recent primary data from national statistics offices, ministries of agriculture, publications from other various organizations, and targeted internet searches. Underlying model is being developed as a customizable web application, in collaboration with GEOSHARE.
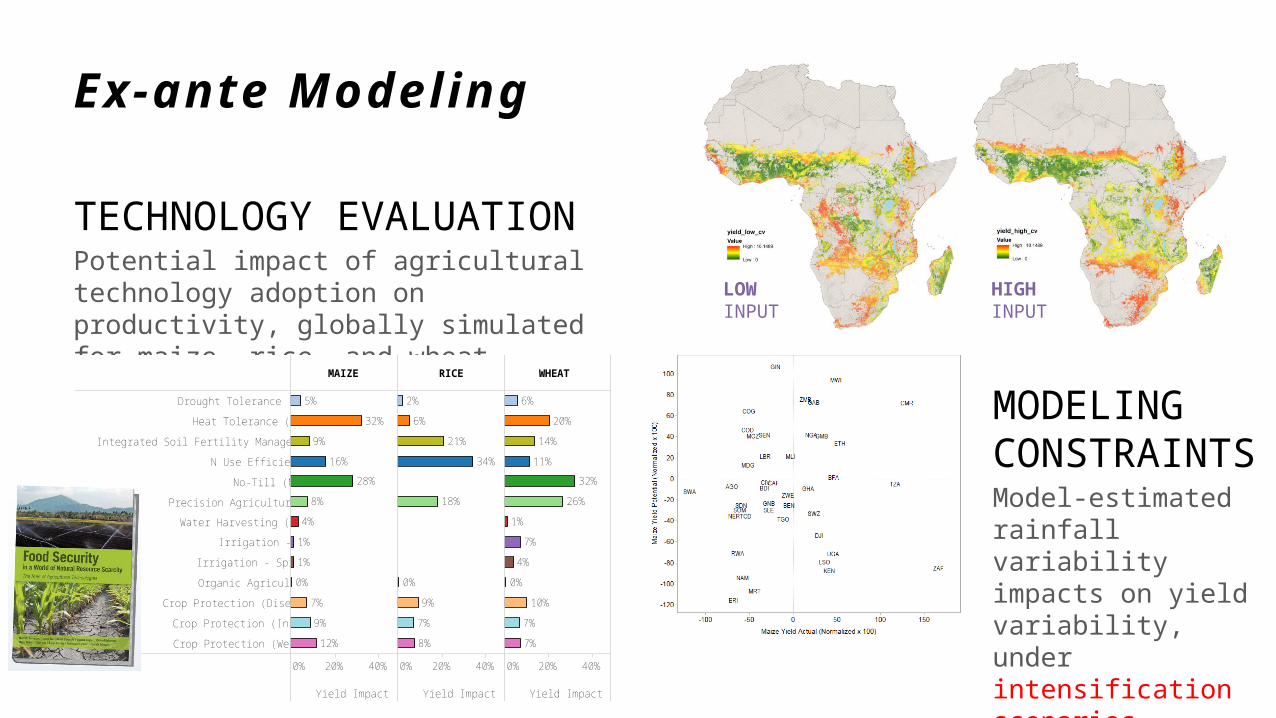
Ex-ante Modeling
TECHNOLOGY EVALUATIONPotential impact of agricultural technology adoption on productivity, globally simulated for maize, rice, and wheat.
MODELING CONSTRAINTSModel-estimated rainfall variability impacts on yield variability, under intensification scenarios
MAIZE RICE WHEAT
0% 20% 40%
Yield Impact
0% 20% 40%
Yield Impact
0% 20% 40%
Yield Impact
MIROC A1B
Drought Tolerance (DT)
Heat Tolerance (HT)
Integrated Soil Fertility Management (FM)
N Use Efficiency
No-Till (NT)
Precision Agriculture (PA)
Water Harvesting (WH)
Irrigation - Drip
Irrigation - Sprinkler
Organic Agriculture
Crop Protection (Diseases)
Crop Protection (Insects)
Crop Protection (Weeds)
32%
16%
28%
12%
5%
9%
8%
4%
1%
1%
0%
7%
9%
21%
34%
18%
2%
6%
0%
9%
7%
8%
20%
14%
11%
32%
26%
10%
6%
1%
7%
4%
0%
7%
7%
LOW INPUT
HIGHINPUT
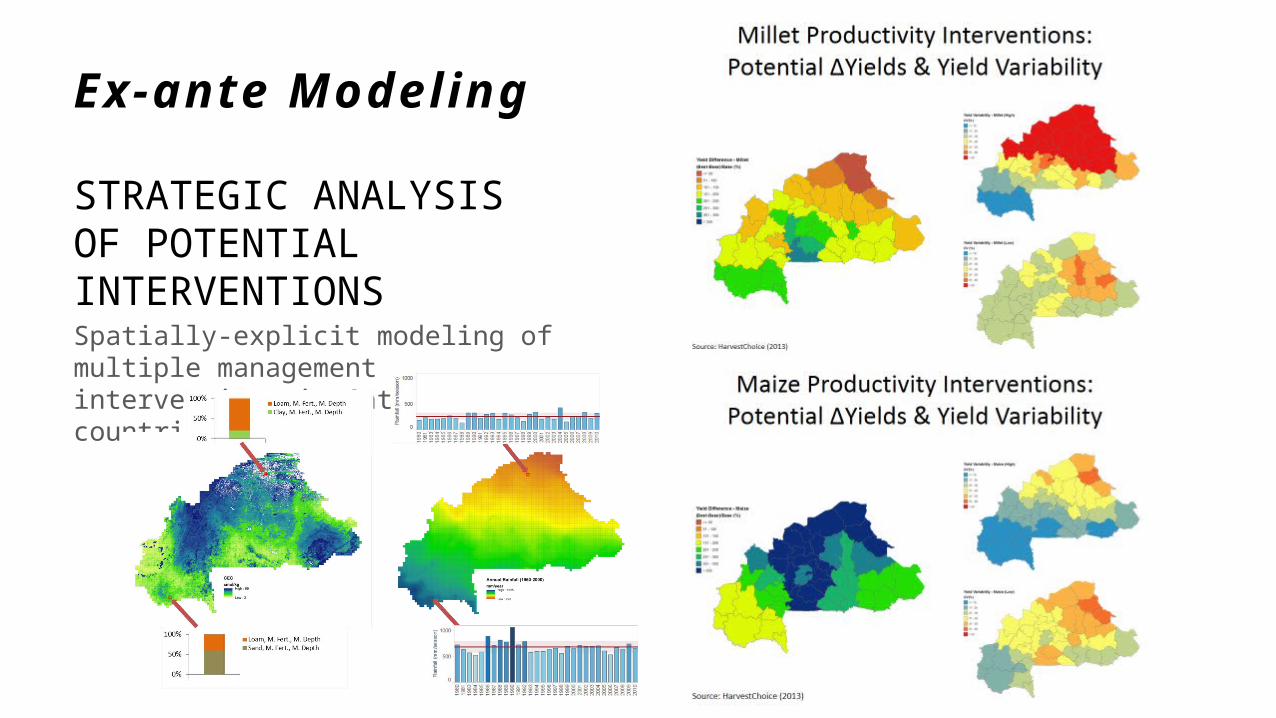
Ex-ante Modeling
STRATEGIC ANALYSIS OF POTENTIAL INTERVENTIONSSpatially-explicit modeling of multiple management interventions in Gates focus countries
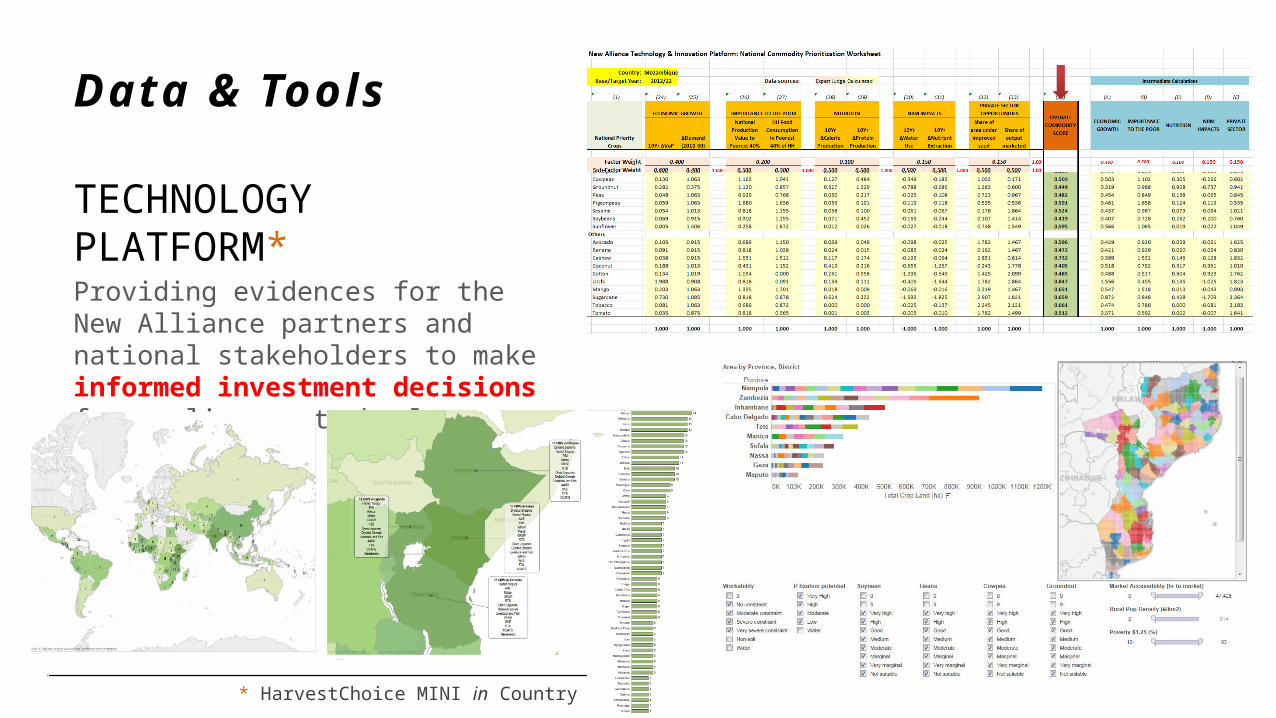
Data & Tools
TECHNOLOGY PLATFORM*Providing evidences for the New Alliance partners and national stakeholders to make informed investment decisions for scaling-up technology adoption
* HarvestChoice MINI in Country
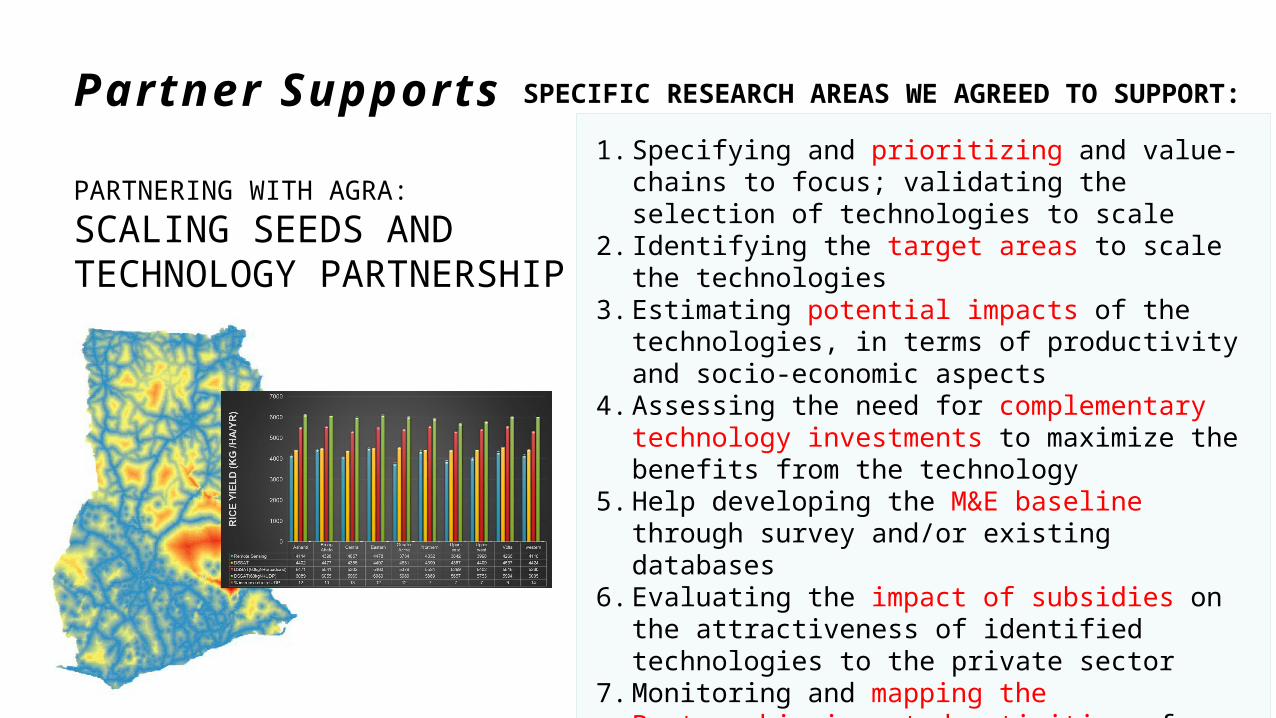
Partner Supports
PARTNERING WITH AGRA:
SCALING SEEDS AND TECHNOLOGY PARTNERSHIP
1. Specifying and prioritizing and value-chains to focus; validating the selection of technologies to scale
2. Identifying the target areas to scale the technologies3. Estimating potential impacts of the technologies, in
terms of productivity and socio-economic aspects4. Assessing the need for complementary technology
investments to maximize the benefits from the technology
5. Help developing the M&E baseline through survey and/or existing databases
6. Evaluating the impact of subsidies on the attractiveness of identified technologies to the private sector
7. Monitoring and mapping the Partnership-invested activities of grantees and partners on the ground
8. Developing investment strategy to reduce the average distance from farmers to input agro-dealers
SPECIFIC RESEARCH AREAS WE AGREED TO SUPPORT:

HOUSEHOLD SURVEY DATA

Poverty -> flagship, the most downloadedConsumption• Subnational per-capita total consumption (in PPP$), extracted from 24 nationally
representative household consumption and expenditure surveys conducted in various years circa-2005 (+-2 years)
Nutrition• Information collected from 60 DHS (Demographic and Health Survey) Phase 4, 5,
and 6 (1999-2013) worldwide; 29 in Sub-Saharan Africa. Highly comparable across countries, wide spatial coverage, over time representation
1. Sub-national mapping (poverty, consumption, nutrition)
2. AgricultureFarming system characterization (crop mix)Use of inputs (land, fertilizers, seeds, irrigation, labor) and their combinationYield, productionLivelihoods

1. POVERTY, CONSUMPTION, NUTRITION Nutrition indicators
• child anthropometric indicators (stunting, wasting, underweight)
• BMI for women• hemoglobin for women• percentage of women and children with anemia• DDS for women and children• antenatal care• infant/young child breastfeeding practices• iron and vitamin A supplementation of women and <5 y.o.• infant and child under 5 mortality rate• percentage of children with diarrheaVarious• education• decision power• asset ownership (incl. livestock)• wealth index• dwelling conditions (drinking water, sanitation facilities,
wall and roof material, cooking fuel, bednets)
Poverty indicators• poverty headcount ratio at $1.25 and $2 PPP/day• poverty gap at $1.25 and $2 PPP/day• poverty severity at $1.25 and $2 PPP/day• std. dev. of poverty headcount ratio at $1.25 and
$2 PPP/day • number of poor at $1.25 and $2 PPP/day• poverty density at $1.25 and $2 PPP/dayConsumption indicators• per-capita total consumption expenditure• Gini index• per-capita food consumption expenditure (in
progress)
…by region, urban/rural, household headship
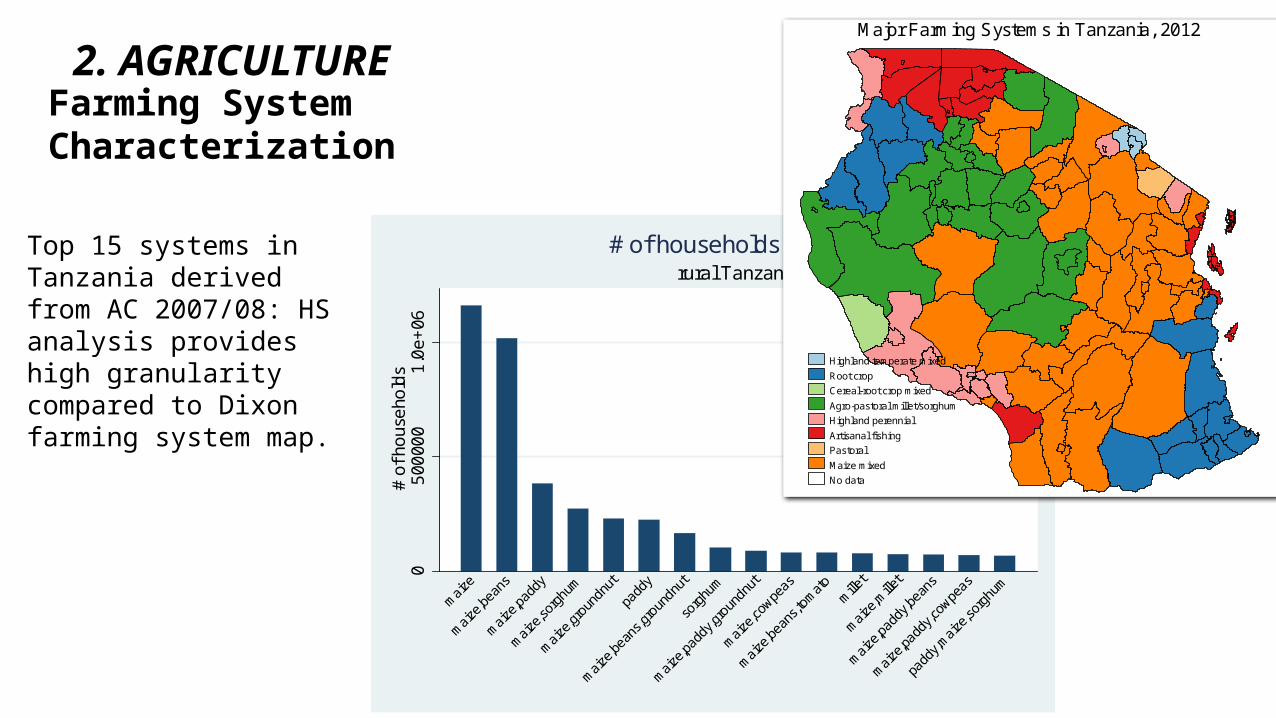
Farming System Characterization
Top 15 systems in Tanzania derived from AC 2007/08: HS analysis provides high granularity compared to Dixon farming system map.
05
0000
01
.0e+
06#
of h
ous
eho
lds
padd
y,maiz
e,so
rghu
m
maiz
e,pa
ddy,c
owpe
as
maiz
e,pa
ddy,b
eans
maiz
e,m
illet
mille
t
maiz
e,be
ans,t
omat
o
maiz
e,co
wpeas
maiz
e,pa
ddy,g
roun
dnut
sorg
hum
maiz
e,be
ans,g
roun
dnut
padd
y
maiz
e,gr
ound
nut
maiz
e,so
rghu
m
maiz
e,pa
ddy
maiz
e,be
ans
maiz
e
rural Tanzania# of households growing
Highland temperate mixed
Root crop
Cereal-root crop mixed
Agro-pastoral millet/sorghum
Highland perennial
Artisanal fishing
Pastoral
Maize mixed
No data
Major Farming Systems in Tanzania, 2012
2. AGRICULTURE
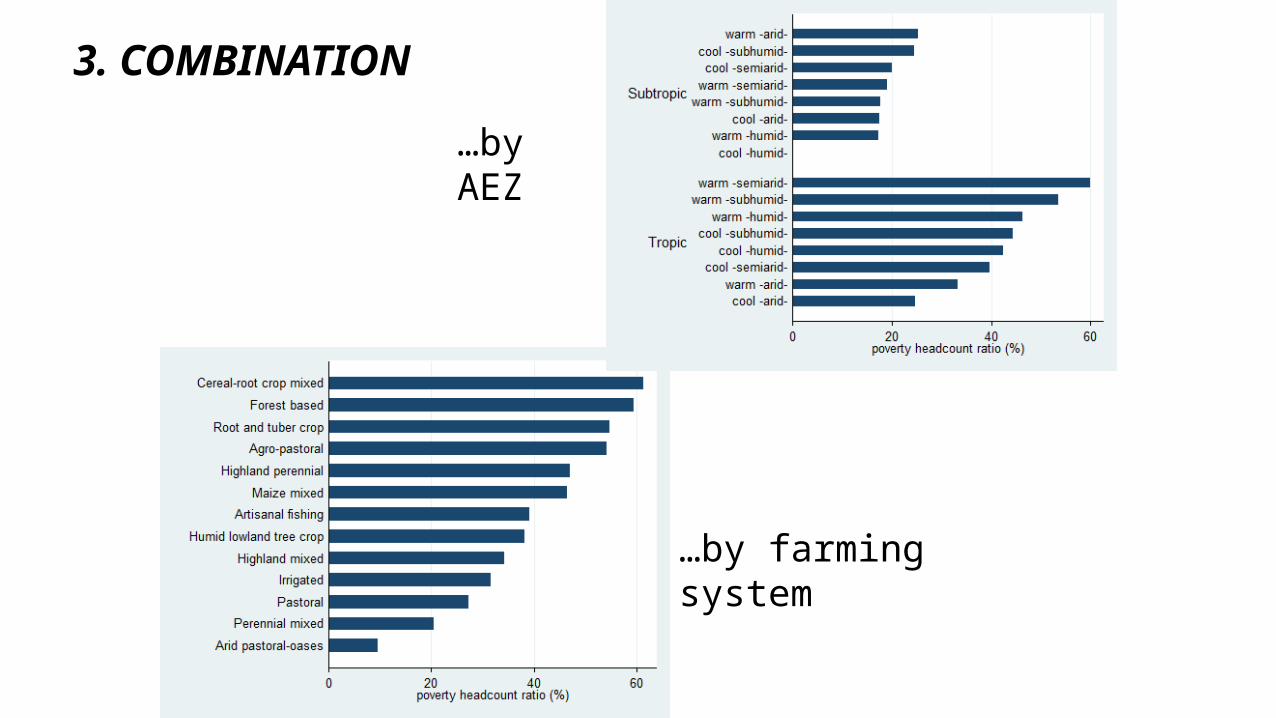
…by AEZ
…by farming system
3. COMBINATION
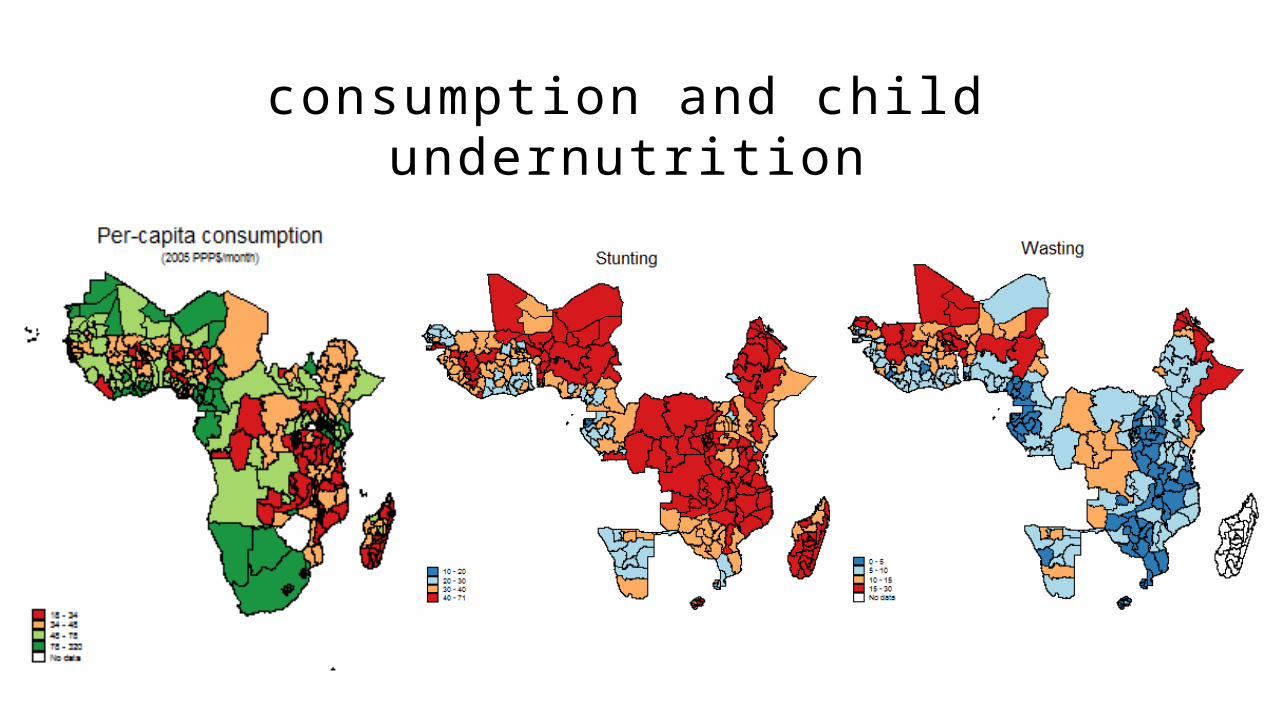
consumption and child undernutrition
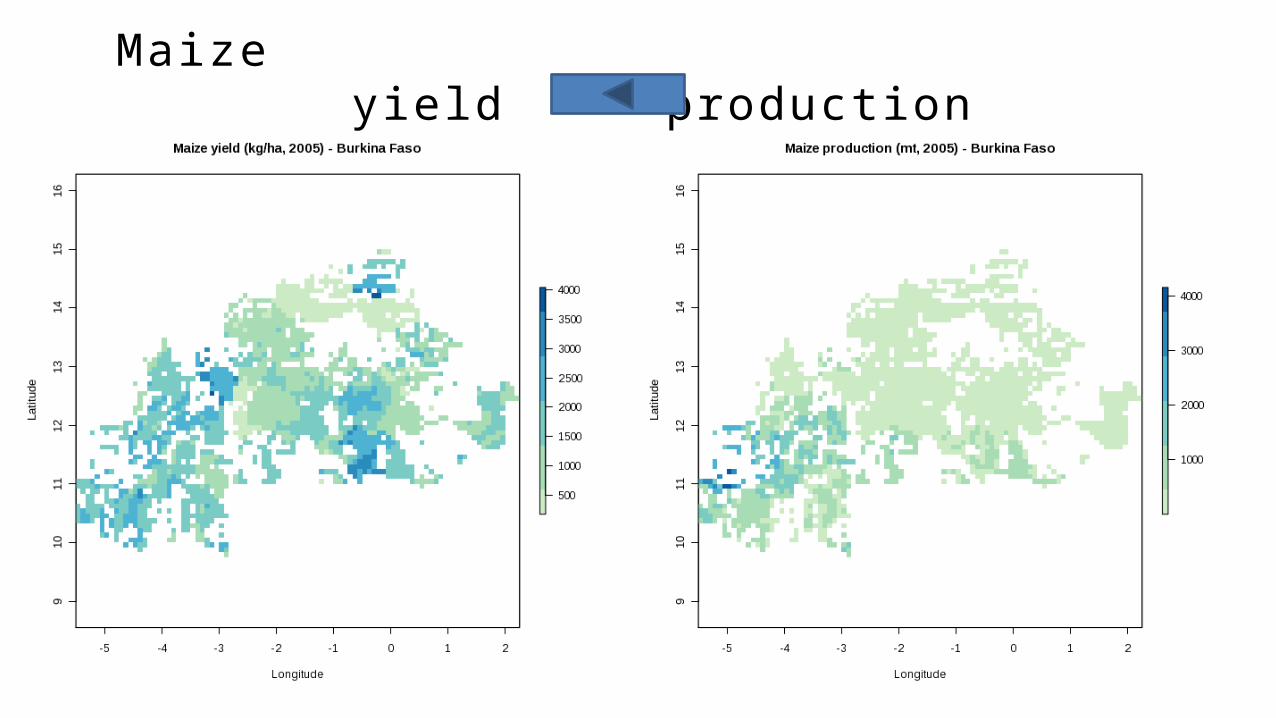
Maize yield production
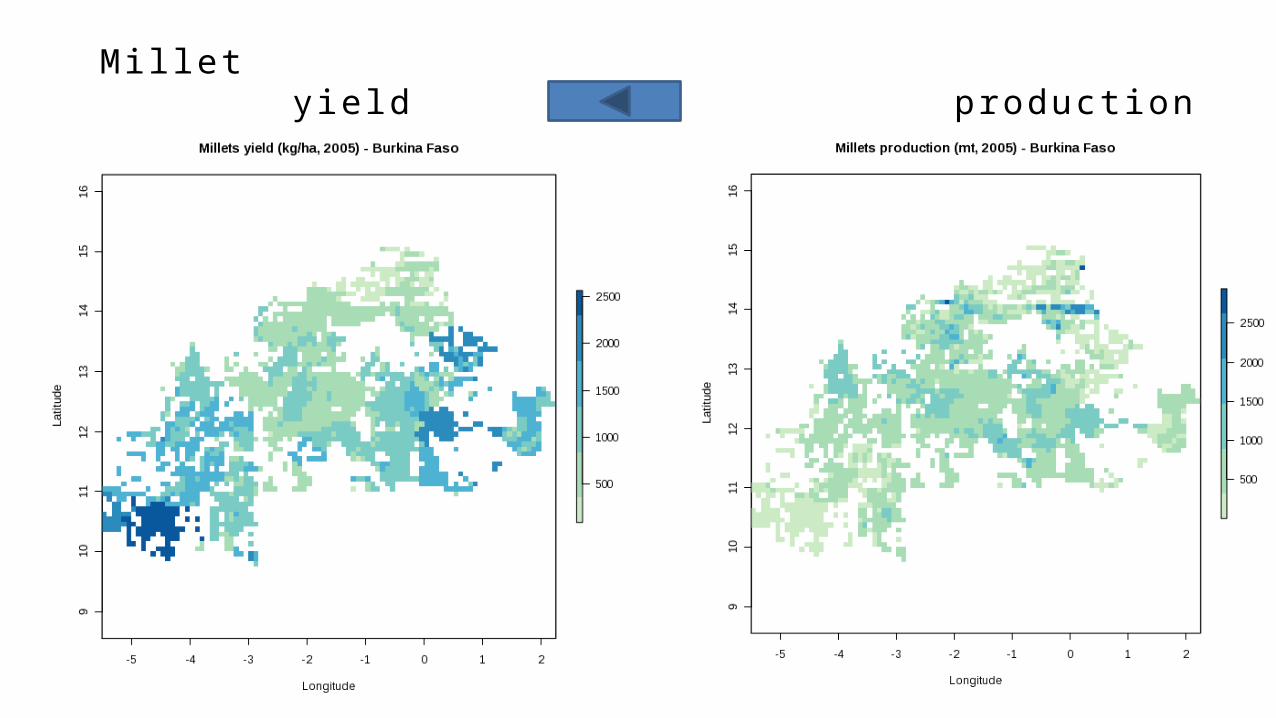
Millet yield production

cattle stunting wasting
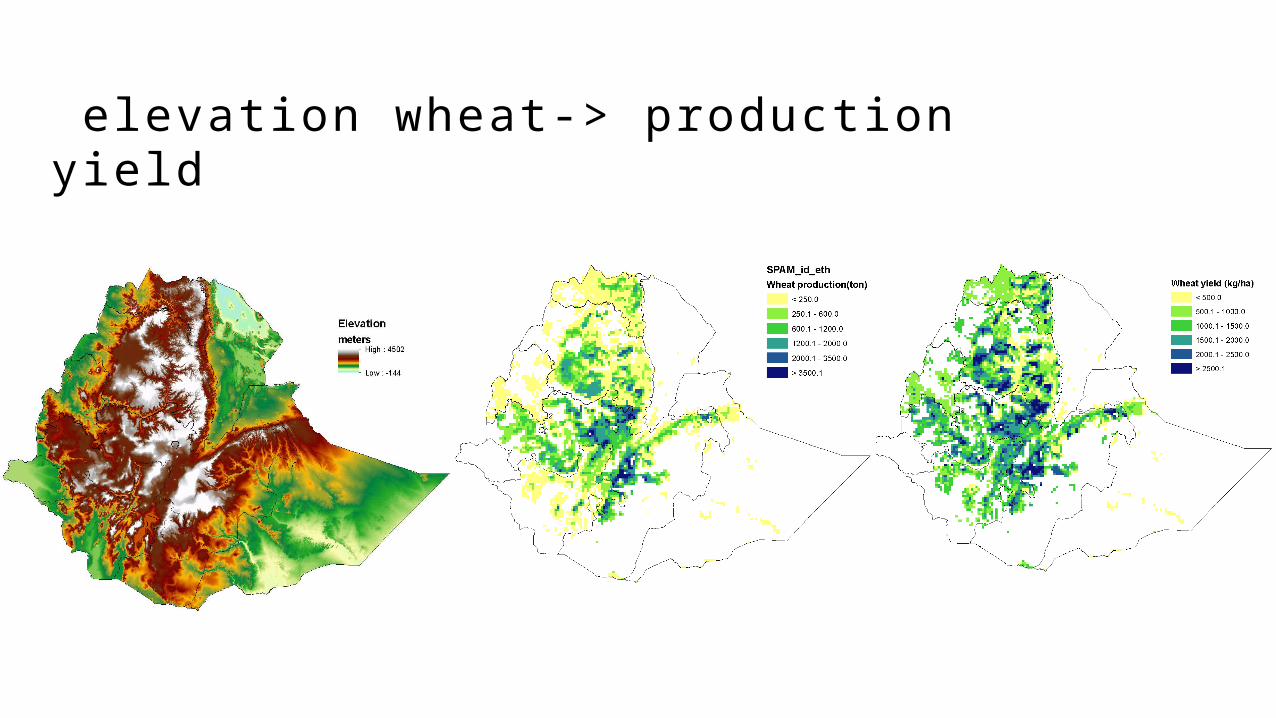
elevation wheat-> production yield
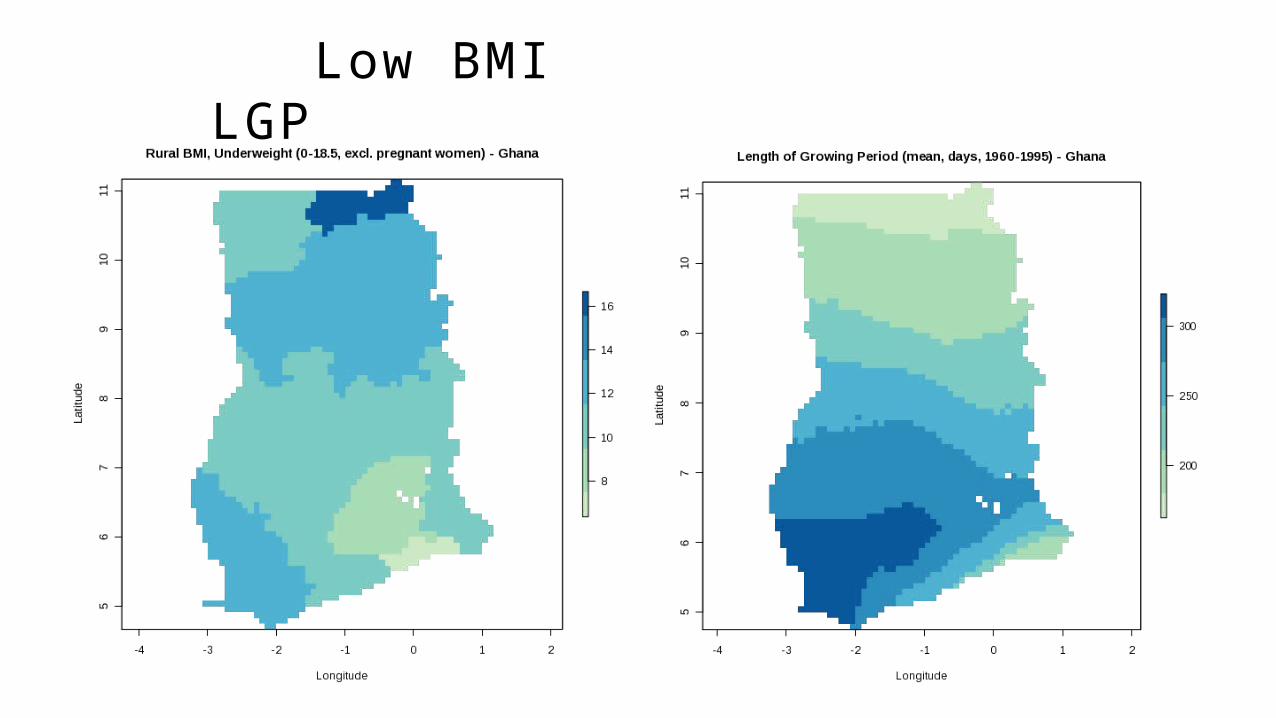
Low BMI LGP
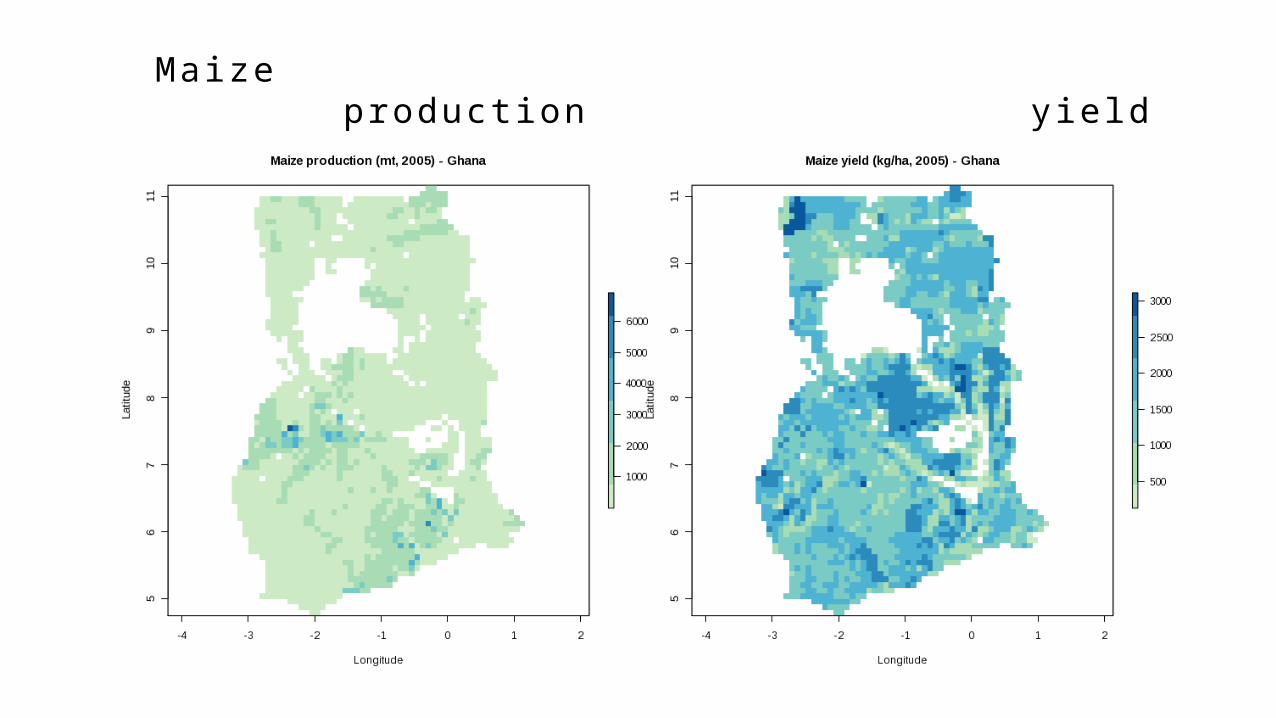
Maize production yield
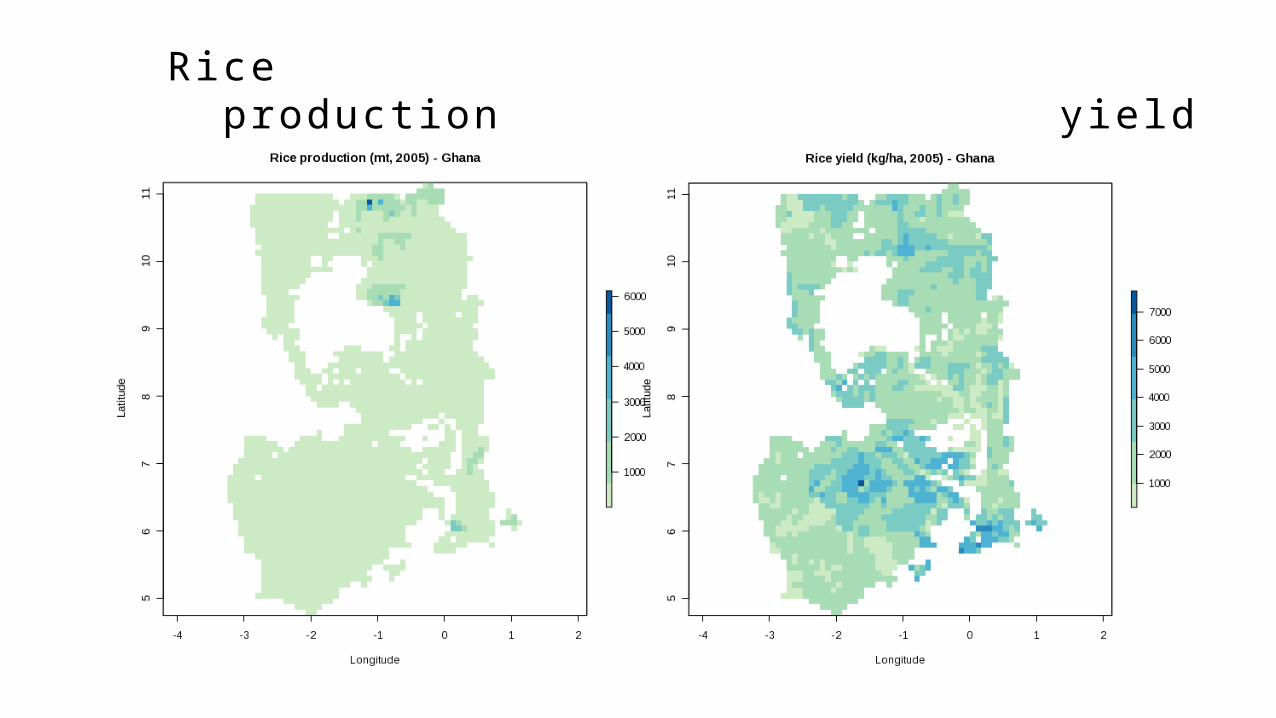
Rice production yield
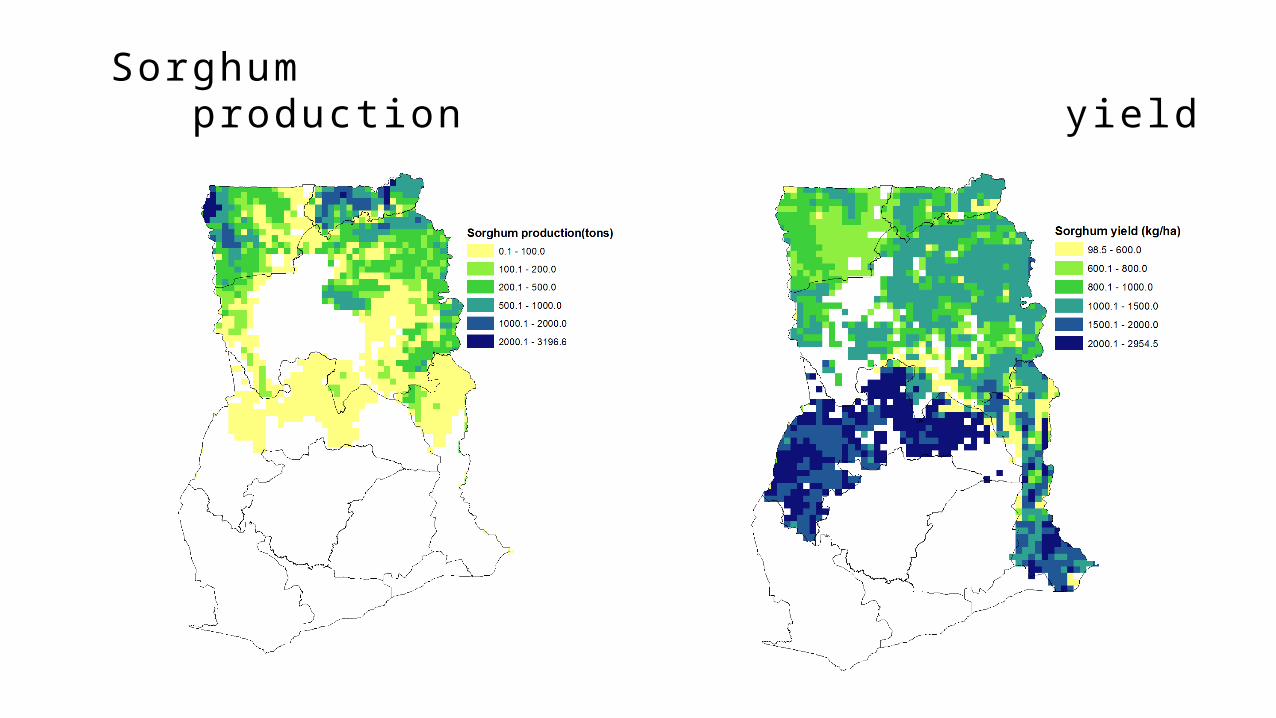
Sorghum production yield
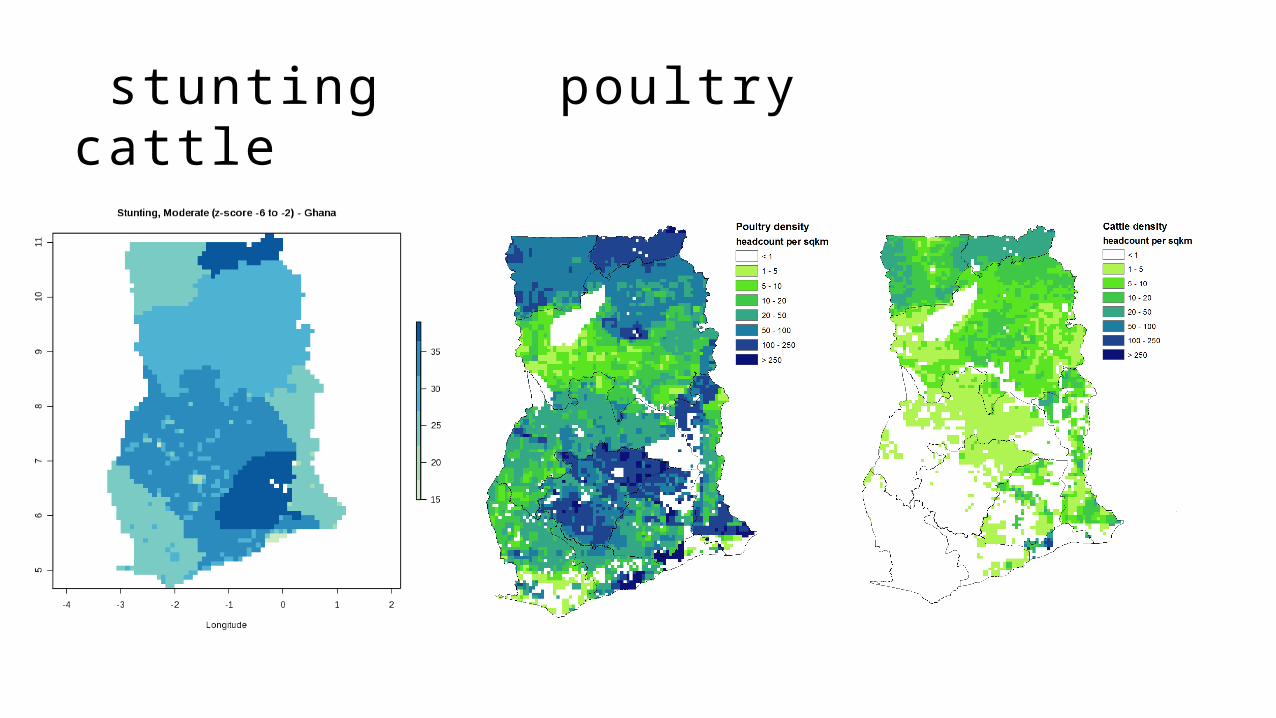
stunting poultry cattle

AFRICA RIS ING

How is Africa RISING linked to HarvestChoice? AR needs to be spatially-informed, requiring granular
information on a large suite of indicators
Both seek integration among different disciplines (agronomy, biophysical&crop modeling, economics)
Both are focused on farming system, ex-ante modeling, adoption study and scaling-up plan of agricultural technologies and innovation
HarvestChoice data need groundtruthing, indeed AR is an excellent opportunity for testing
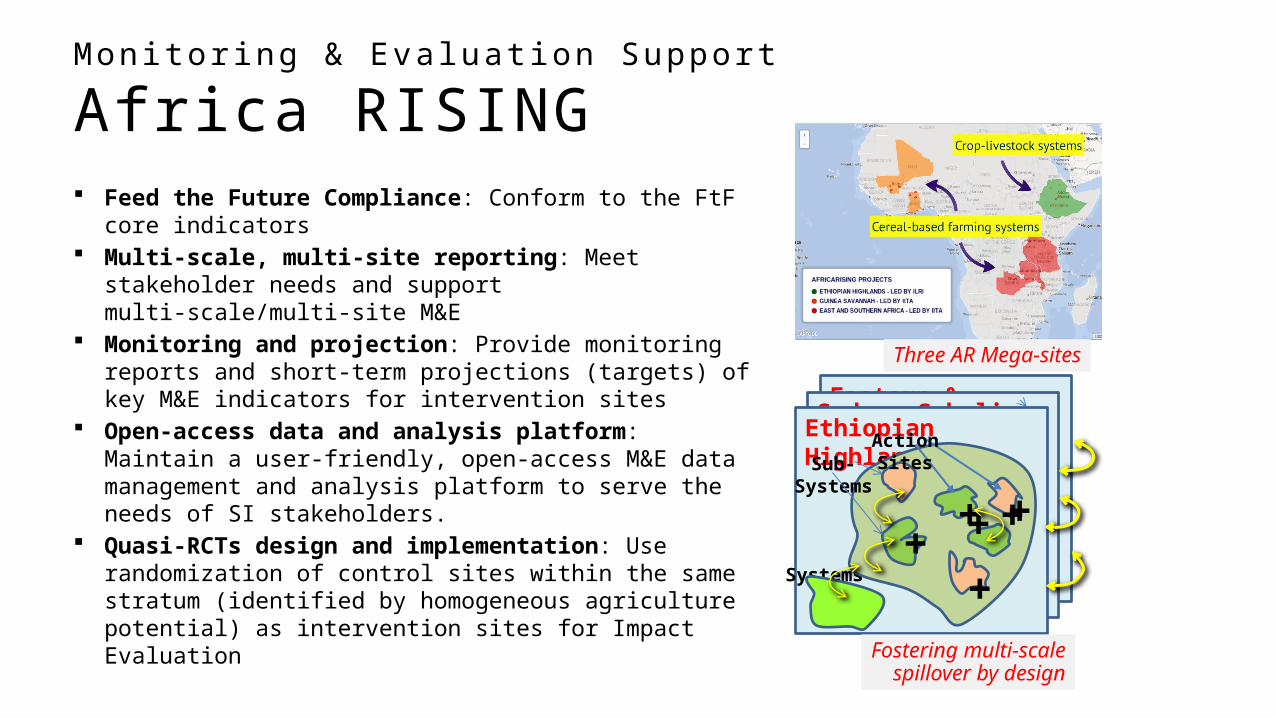
Monitor ing & Evaluat ion Support
Africa RISING Feed the Future Compliance: Conform to the FtF
core indicators Multi-scale, multi-site reporting: Meet
stakeholder needs and support multi-scale/multi-site M&E
Monitoring and projection: Provide monitoring reports and short-term projections (targets) of key M&E indicators for intervention sites
Open-access data and analysis platform: Maintain a user-friendly, open-access M&E data management and analysis platform to serve the needs of SI stakeholders.
Quasi-RCTs design and implementation: Use randomization of control sites within the same stratum (identified by homogeneous agriculture potential) as intervention sites for Impact Evaluation
Eastern & Southern Africa Maize-based Systems
Sudano-Sahelian ZoneEthiopian Highlands
Systems
Sub-Systems
+
+ ++++
ActionSites
Three AR Mega-sites
Fostering multi-scalespillover by design
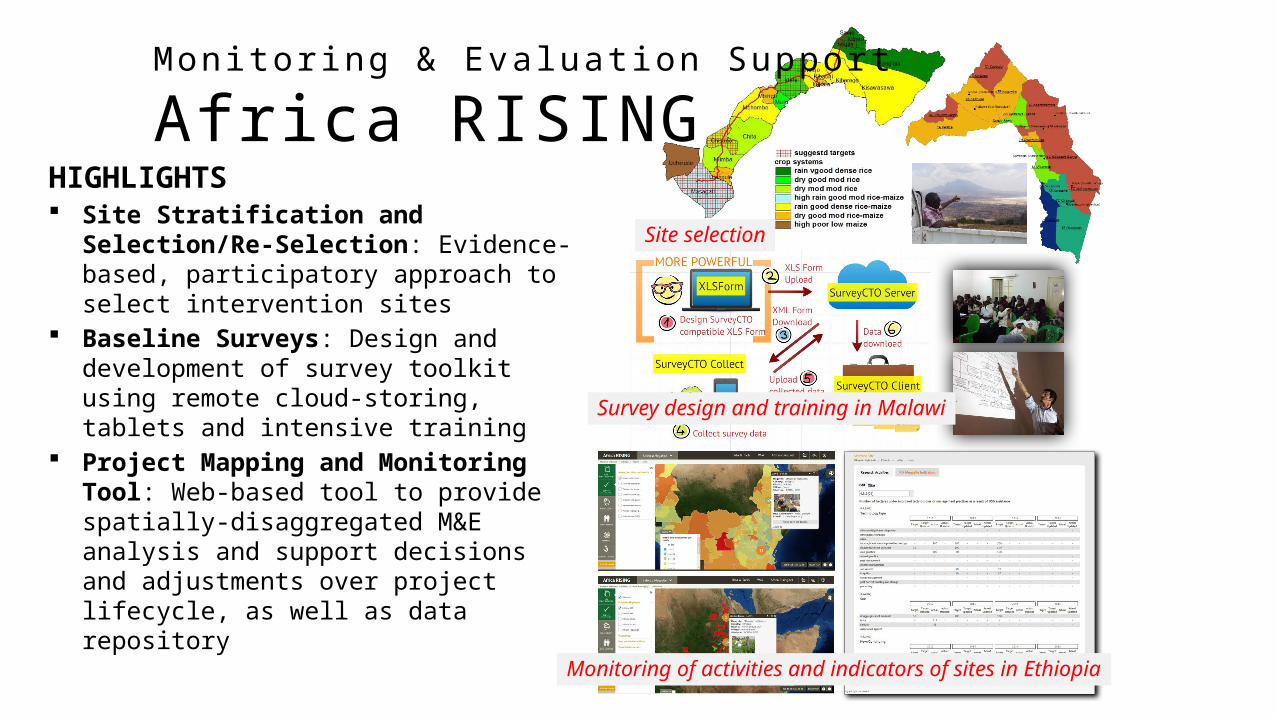
Monitor ing & Evaluat ion Support
Africa RISINGHIGHLIGHTS Site Stratification and
Selection/Re-Selection: Evidence-based, participatory approach to select intervention sites
Baseline Surveys: Design and development of survey toolkit using remote cloud-storing, tablets and intensive training
Project Mapping and Monitoring Tool: Web-based tool to provide spatially-disaggregated M&E analysis and support decisions and adjustments over project lifecycle, as well as data repository
Site selection
Survey design and training in Malawi
Monitoring of activities and indicators of sites in Ethiopia
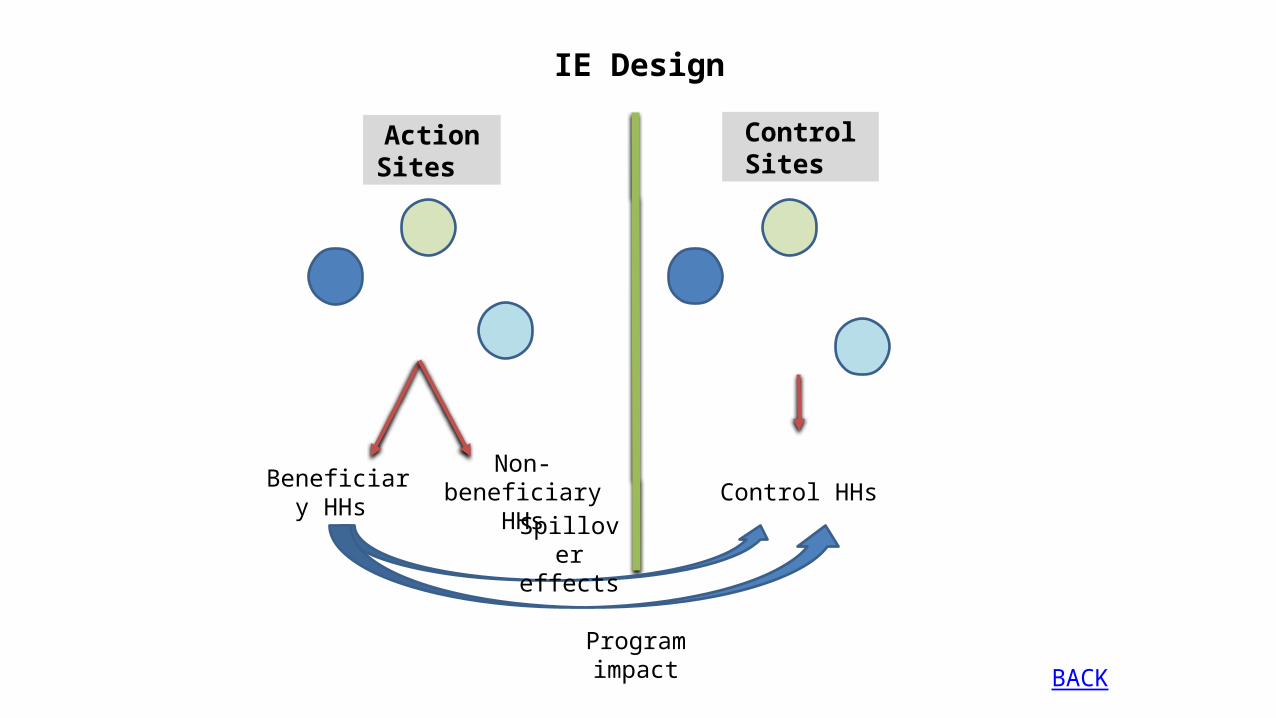
IE Design
Beneficiary HHs
Non-beneficiary
HHs Control HHs
Action Sites
Control Sites
Spillover effects
Program impact BACK
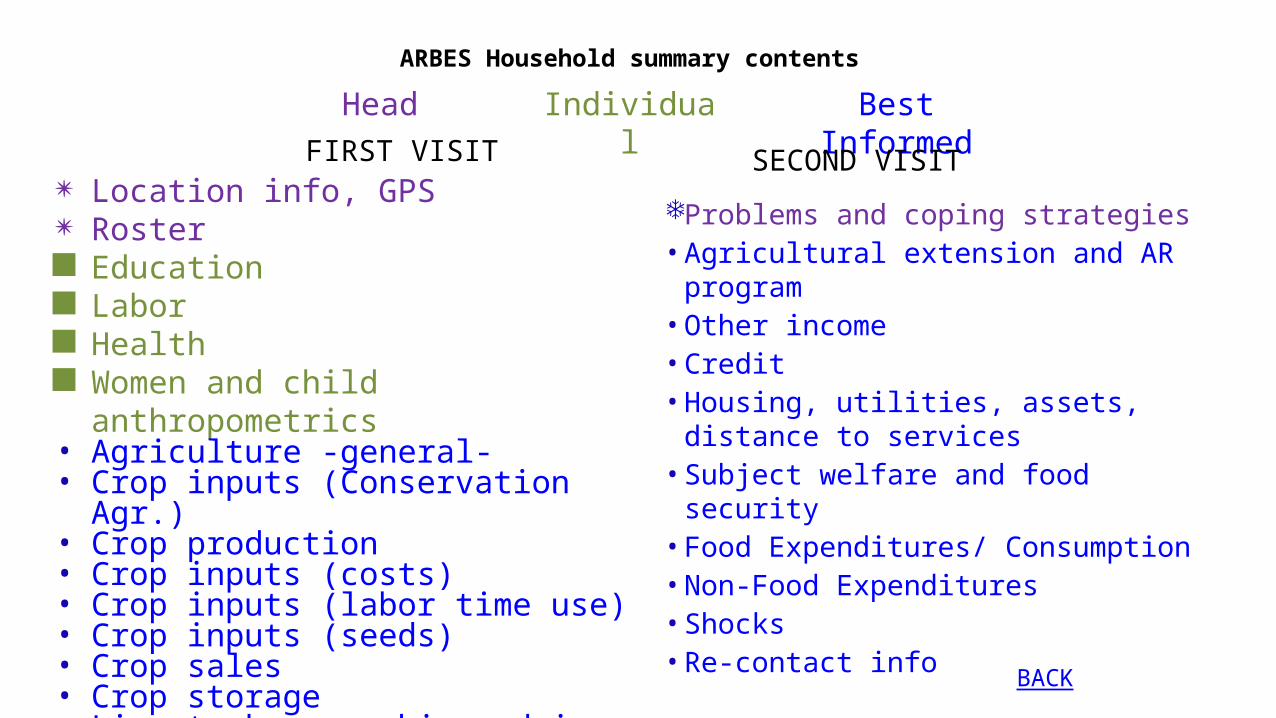
ARBES Household summary contents
Location info, GPS Roster Education Labor Health Women and child anthropometrics• Agriculture -general-• Crop inputs (Conservation Agr.)• Crop production• Crop inputs (costs)• Crop inputs (labor time use)• Crop inputs (seeds)• Crop sales• Crop storage• Livestock ownership and income• Livestock feed
Problems and coping strategies• Agricultural extension and AR
program• Other income• Credit• Housing, utilities, assets,
distance to services• Subject welfare and food security• Food Expenditures/ Consumption• Non-Food Expenditures• Shocks• Re-contact info
FIRST VISIT
Head Individual Best Informed
SECOND VISIT
BACK
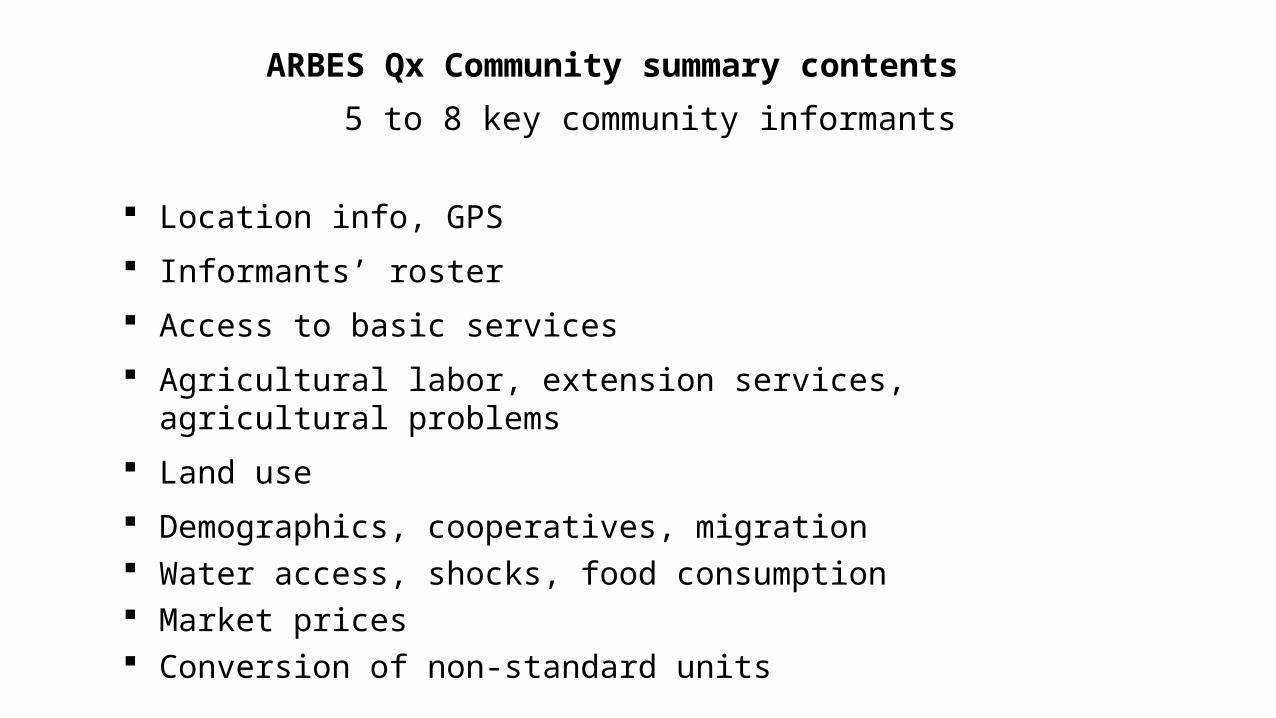
ARBES Qx Community summary contents
5 to 8 key community informants
Location info, GPS
Informants’ roster
Access to basic services
Agricultural labor, extension services, agricultural problems
Land use
Demographics, cooperatives, migration Water access, shocks, food consumption Market prices Conversion of non-standard units
Recommended