5/20/2011 – Deepwater Sediment Sampling Page 1
Study Plan for NRDA-Phase II Project
Deepwater Sediment Sampling to Assess Post-Spill Benthic Impacts from the
Deepwater Horizon Oil Spill
Deepwater Benthic Communities Technical Working Group
May 20, 2011
1.0 Background and Objectives:
The Deepwater Horizon (DWH) incident in the northern Gulf of Mexico occurred on April 20,
2010 at a water depth of 1525 meters in Mississippi Canyon Block 252. While some of the oil
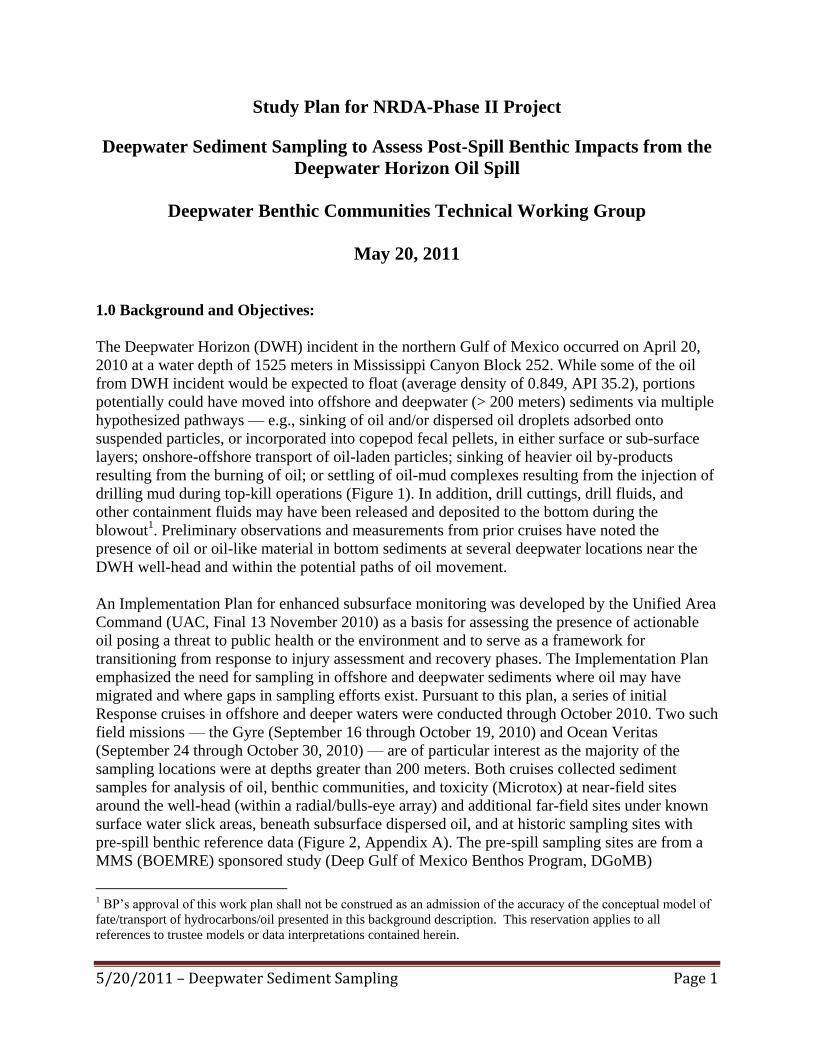
from DWH incident would be expected to float (average density of 0.849, API 35.2), portions
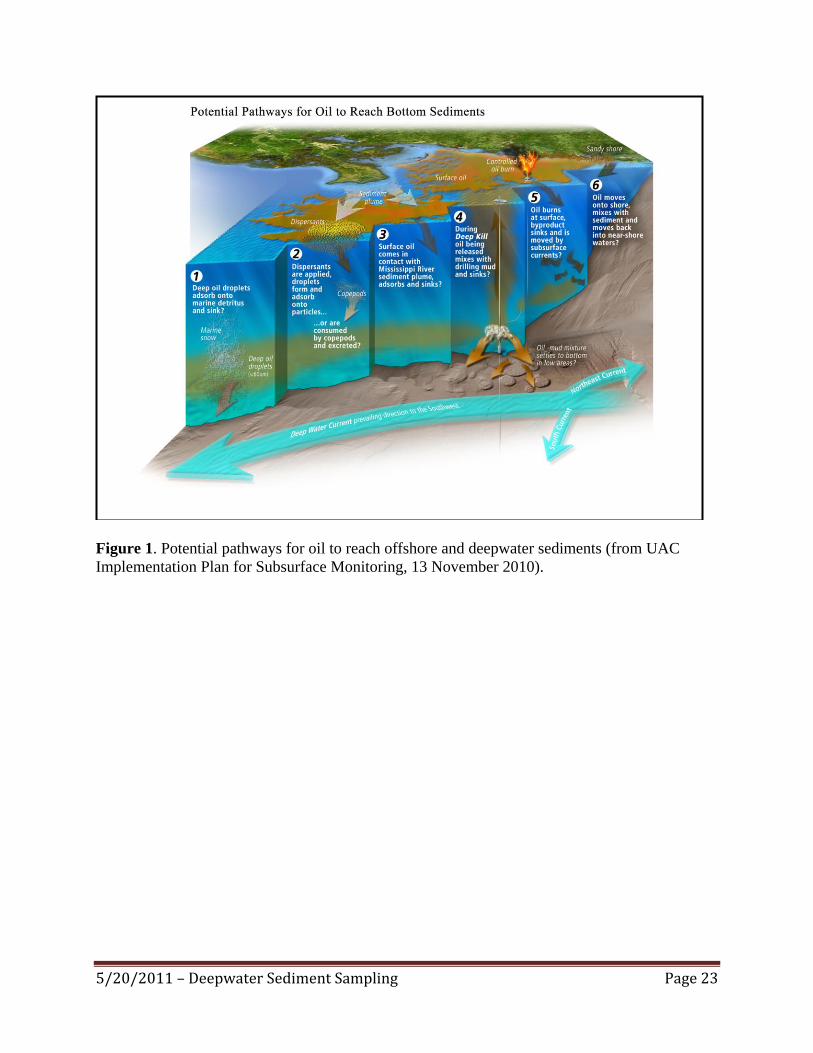
potentially could have moved into offshore and deepwater (> 200 meters) sediments via multiple
hypothesized pathways — e.g., sinking of oil and/or dispersed oil droplets adsorbed onto
suspended particles, or incorporated into copepod fecal pellets, in either surface or sub-surface
layers; onshore-offshore transport of oil-laden particles; sinking of heavier oil by-products
resulting from the burning of oil; or settling of oil-mud complexes resulting from the injection of
drilling mud during top-kill operations (Figure 1). In addition, drill cuttings, drill fluids, and
other containment fluids may have been released and deposited to the bottom during the
blowout1. Preliminary observations and measurements from prior cruises have noted the
presence of oil or oil-like material in bottom sediments at several deepwater locations near the
DWH well-head and within the potential paths of oil movement.
An Implementation Plan for enhanced subsurface monitoring was developed by the Unified Area
Command (UAC, Final 13 November 2010) as a basis for assessing the presence of actionable
oil posing a threat to public health or the environment and to serve as a framework for
transitioning from response to injury assessment and recovery phases. The Implementation Plan
emphasized the need for sampling in offshore and deepwater sediments where oil may have
migrated and where gaps in sampling efforts exist. Pursuant to this plan, a series of initial
Response cruises in offshore and deeper waters were conducted through October 2010. Two such
field missions — the Gyre (September 16 through October 19, 2010) and Ocean Veritas
(September 24 through October 30, 2010) — are of particular interest as the majority of the
sampling locations were at depths greater than 200 meters. Both cruises collected sediment
samples for analysis of oil, benthic communities, and toxicity (Microtox) at near-field sites
around the well-head (within a radial/bulls-eye array) and additional far-field sites under known
surface water slick areas, beneath subsurface dispersed oil, and at historic sampling sites with
pre-spill benthic reference data (Figure 2, Appendix A). The pre-spill sampling sites are from a
MMS (BOEMRE) sponsored study (Deep Gulf of Mexico Benthos Program, DGoMB)
1 BP’s approval of this work plan shall not be construed as an admission of the accuracy of the conceptual model of
fate/transport of hydrocarbons/oil presented in this background description. This reservation applies to all
references to trustee models or data interpretations contained herein.
5/20/2011 – Deepwater Sediment Sampling Page 2
conducted in 2000-2002 (Rowe and Kennicutt 2008, 2009). On both the Gyre and Ocean Veritas
cruises, a multi-corer system (OSIL Bowers and Connelly Multiple Corer) was used to collect
the sediment samples. This unique system is designed to collect undisturbed samples of seabed
sediment and overlying supernatant water and minimizes the risk of a bow-wave effect that
might otherwise displace the upper surface layer of sediments or flocculant and any associated
oil and thus compromise the results.
The proposed study is intended to build upon results of the Implementation Plan efforts by
making use of samples already collected and conducting follow-up sampling in deepwater areas
to help identify any potential oil-related impacts on sediments and resident benthic fauna. The
sampling design will focus on sites where oil was observed, that are in paths of oil exposure
predicted by the Trustee conceptual model, and that serve as anticipated reference sites
(including the historic DGoMB sites and other areas where MC252 oil has not been found) and is
based on the Implementation Plan results as presented in the recent OSAT (2010) Report.
The overall goal of this study is to help identify any potential impacts of the DWH oil spill on
deepwater sediments and resident benthic fauna in support of the NRDA injury-assessment
process. There are two fundamental questions to be answered in addressing this goal. First, are
sediments in areas with a greater likelihood of exposure, such as near the well-head, under the
former surface sea slick, or under the dispersed sub-surface hydrocarbons, impacted by
hydrocarbons traceable to the oil spill? If the answer is yes, the second question is, do living
benthic resources show evidence of a difference in community indices or other injuries that can
be related to exposure to the hydrocarbons? To help address such questions, the study will focus
on three primary objectives discussed in further detail below.
All materials associated with the collection or analysis of samples under these protocols or
pursuant to any approved work plan, except those consumed as a consequence of the applicable
sampling or analytical process, must and will be retained unless and until approval is given for
their disposal in accordance with the retention requirements set forth in paragraph 14 of Pretrial
Order # 1, paragraph 6 of Pretrial Order #30, the entirety of Pretrial order 16 which details the
retention of metadata, and any other applicable Court Orders governing tangible items that are or
may be issued in MDL No. 2179 IN RE: Oil Spill by the Oil Rig "DEEPWATER HORIZON"
(E.D. LA 2010). Such approval to dispose must be given in writing and by a person authorized to
direct such action on behalf of the state or federal agency whose employees or contractors are in
possession or control of such materials.
This plan will be implemented consistent with existing Trustee regulations and policies. All
applicable state and Federal permits must and will be obtained prior to conducting work.
2.0 Methods and Approach:
2.1. Objective 1: Examine the spatial pattern and magnitude of hydrocarbon exposure in
deepwater sediments to help inform follow-up sediment sampling designs and facilitate
biological interpretations.
5/20/2011 – Deepwater Sediment Sampling Page 3
The OSAT (2010) report presents results of hydrocarbon analyses performed through Response
efforts on 127 sediment samples from deepwater (> 200 m) locations. The samples are among
those collected in fall 2010 on the Gyre and Ocean Veritas cruises (Figure 2, Appendix A; 169
sample sites total including sites < 200m). As part of these analyses, concentrations of
polynuclear aromatic hydrocarbons (PAHs) were measured in each sample and compared to
corresponding EPA aquatic life benchmarks for PAHs in sediments. Samples that exceeded the
benchmarks were examined in further detail using oil fingerprinting methods to assess the
likelihood that exceedances were due to MC252 oil. Results of these analyses are discussed in
the OSAT (2010) report. In addition, the data (i.e., total PAH concentrations) can be accessed
through the Environmental Response Management Application® (ERMA) database
(https://gomex2.erma.unh.edu) a web-based GIS tool maintained by NOAA/ORR, University of
New Hampshire, and EPA.
PAH sediment exceedances were found at a total of seven stations all located within 3 km of the
well-head (OSAT 2010). All seven samples had hydrocarbons consistent with MC252 oil.
Concentrations of total PAHs in these samples ranged from 9,900 – 28,000 ng/g (OSAT 2010).
Two additional nearfield sites within this 3-km zone were not listed as PAH hits, but had
concentrations in excess of other published Sediment Quality Guidelines (SQGs) for total PAHs:
either the Effects Range Low (ERL) value of 4,022 ng/g (Long et al. 1995) or Threshold Effect
Level (TEL) value of 1684 ng/g (MacDonald et al. 1996). For comparison, total PAHs in
sediments from pre-spill reference sites (Rowe and Kennicutt 2009) ranged from 0 – 1033 ng/g
(mean of 140 ng/g). An additional pre-spill study in 2000 – 2003 at 45 locations within Lease
Blocks VK916, GB516, GB602, and MC 292 (Continental Shelf Associates 2006) found total
PAHs in farfield sediments at concentrations ranging from 93.8 – 748 (mean of 237 ng/g) across
a range of reference stations; and two samples within 300 m of the GB516 drill site had
concentrations of 3,470 and 23,840 ng/g. Another conclusion of the OSAT (2010) report was
that sediment PAH concentrations were above average reference levels at some locations within
9 km of the well-head.
Results of the above hydrocarbon analyses have been used in our planning thus far to help
identify a subset of the fall 2010 Response samples to work up initially for benthic community
analysis and to develop the sampling design for follow-up field sampling (Objectives 2 and 3 of
the present study); however, the Trustees do not believe that the data presented in the OSAT
(2010) report are necessarily informative or conclusive with regard to natural resource injuries.
Because, according to the OSAT (2010) report, the highest concentrations of oil consistent with
MC252 oil were found within 3 km of the well-head, one of the emphases is on samples within
this nearfield zone. These and other priority sites (total of 65) were selected based on the
following overall criteria:
Nearfield sites within ~ 3 km of well-head (17 sites) — Area where OSAT data have
shown sediments containing oil consistent with MC252 in excess of EPA aquatic life
benchmarks (OSAT 2010).
Mid-field sites within 25 km of well-head (23 sites) — Area within suggested path of oil
movement in various directions, based on subsurface trajectory modelling results
5/20/2011 – Deepwater Sediment Sampling Page 4
performed by NOAA contractors2; also includes the portion within 9 km of the well-head
where sediment PAH concentrations were above average reference levels (OSAT 2010).
Preliminary verbal reporting of laboratory data from the HOS Davis NRDA Cooperative
cruise in December 2010 also suggests the presence of MC252 oil in sediments at two
sites within this region.
Farfield sites > 25 km of well-head within suggested paths of oil movement based on
subsurface trajectory modelling results performed by NOAA contractors (15 sites) — 14
sites located to the southwest and one site (DO43S) about 50 km to the northeast.
Farfield sites > 25 km NW of well-head (2 sites) — Path of potential transport of oil to
seafloor due to possible interaction of surface oil with the sediment-laden Mississippi
River plume; also, qualitative indications of oil were found in some sediment samples
from this area (OSAT 2010).
Pre-spill DGoMB reference sites (Rowe and Kennicutt 2009) (8 sites) — Areas where
baseline sample results exist for pre-spill/post-spill comparisons.
Of the above 65 selected sites, seven were listed in the OSAT (2010) report as containing PAHs
consistent with MC252 at levels above EPA aquatic life benchmarks (see Appendix A herein)
and two more (ALTNF015, LBNL1) had relatively high levels of total PAHs in excess of other
published SQGs; 31 are likely to be non- to lesser-contaminated sites at comparable depths
(1300 - 1700 m, with most between 1400 – 1600 m) as the more heavily oiled sites (1493 - 1607
m); eight are historic/pre-spill DGOMB sites; and the remaining sites (17) provide additional
spatial coverage over a wider range of depths in comparison to sites where oil has been observed
at elevated levels.
It is noted that initial Response efforts only included oil fingerprinting on sediment samples that
contained PAHs in excess of EPA aquatic life benchmarks. As benthic samples are processed in
the present study, it may become necessary to have additional laboratory analyses performed on
some samples to support the interpretation of biological results. In addition, while the ERMA
website provides access to data on total PAH concentrations, data on individual PAH
concentrations (which should be available) and laboratory QA/QC packages will be needed to
facilitate biological and chemical interpretations.
Data from the above Response efforts and other potentially relevant information on hydrocarbon
concentrations within the region, as they become available, may be used to assess potential
impacts of the oil spill on benthic communities. Maps depicting the spatial pattern and
magnitude of oil exposure in sediments also will be prepared to help depict potential linkages
between presence of MC252 oil and results of the benthic analysis. Additional hydrocarbon data
resulting from the analysis of sediment samples collected in spring 2011, as part of the present
study, will provide a basis for assessing how the pattern and levels of hydrocarbons may have
persisted or changed relative to prior sampling efforts.
2.2. Objective 2: Assess potential impacts of the spill on benthic infauna from archived
samples collected in Fall 2010 (Gyre and Ocean Veritas cruises).
2 BP’s approval of this work plan shall not be construed as an admission of the accuracy of the NOAA models or
data interpretations relied on in selecting sites for surveys. This reservation applies to all references to trustee
models or data interpretations contained herein.
5/20/2011 – Deepwater Sediment Sampling Page 5
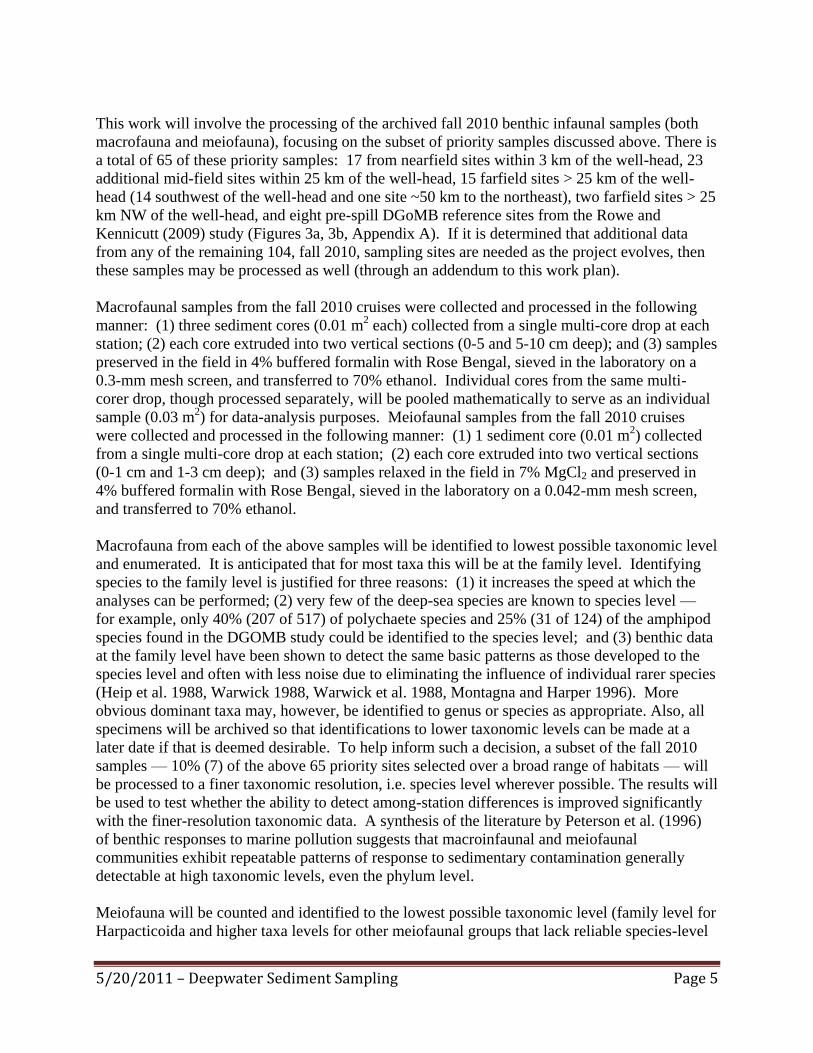
This work will involve the processing of the archived fall 2010 benthic infaunal samples (both
macrofauna and meiofauna), focusing on the subset of priority samples discussed above. There is
a total of 65 of these priority samples: 17 from nearfield sites within 3 km of the well-head, 23
additional mid-field sites within 25 km of the well-head, 15 farfield sites > 25 km of the well-
head (14 southwest of the well-head and one site ~50 km to the northeast), two farfield sites > 25
km NW of the well-head, and eight pre-spill DGoMB reference sites from the Rowe and
Kennicutt (2009) study (Figures 3a, 3b, Appendix A). If it is determined that additional data
from any of the remaining 104, fall 2010, sampling sites are needed as the project evolves, then
these samples may be processed as well (through an addendum to this work plan).
Macrofaunal samples from the fall 2010 cruises were collected and processed in the following
manner: (1) three sediment cores (0.01 m2 each) collected from a single multi-core drop at each
station; (2) each core extruded into two vertical sections (0-5 and 5-10 cm deep); and (3) samples
preserved in the field in 4% buffered formalin with Rose Bengal, sieved in the laboratory on a
0.3-mm mesh screen, and transferred to 70% ethanol. Individual cores from the same multi-
corer drop, though processed separately, will be pooled mathematically to serve as an individual
sample (0.03 m2) for data-analysis purposes. Meiofaunal samples from the fall 2010 cruises
were collected and processed in the following manner: (1) 1 sediment core (0.01 m2) collected
from a single multi-core drop at each station; (2) each core extruded into two vertical sections
(0-1 cm and 1-3 cm deep); and (3) samples relaxed in the field in 7% MgCl2 and preserved in
4% buffered formalin with Rose Bengal, sieved in the laboratory on a 0.042-mm mesh screen,
and transferred to 70% ethanol.
Macrofauna from each of the above samples will be identified to lowest possible taxonomic level
and enumerated. It is anticipated that for most taxa this will be at the family level. Identifying
species to the family level is justified for three reasons: (1) it increases the speed at which the
analyses can be performed; (2) very few of the deep-sea species are known to species level —
for example, only 40% (207 of 517) of polychaete species and 25% (31 of 124) of the amphipod
species found in the DGOMB study could be identified to the species level; and (3) benthic data
at the family level have been shown to detect the same basic patterns as those developed to the
species level and often with less noise due to eliminating the influence of individual rarer species
(Heip et al. 1988, Warwick 1988, Warwick et al. 1988, Montagna and Harper 1996). More
obvious dominant taxa may, however, be identified to genus or species as appropriate. Also, all
specimens will be archived so that identifications to lower taxonomic levels can be made at a
later date if that is deemed desirable. To help inform such a decision, a subset of the fall 2010
samples — 10% (7) of the above 65 priority sites selected over a broad range of habitats — will
be processed to a finer taxonomic resolution, i.e. species level wherever possible. The results will
be used to test whether the ability to detect among-station differences is improved significantly
with the finer-resolution taxonomic data. A synthesis of the literature by Peterson et al. (1996)
of benthic responses to marine pollution suggests that macroinfaunal and meiofaunal
communities exhibit repeatable patterns of response to sedimentary contamination generally
detectable at high taxonomic levels, even the phylum level.
Meiofauna will be counted and identified to the lowest possible taxonomic level (family level for
Harpacticoida and higher taxa levels for other meiofaunal groups that lack reliable species-level
5/20/2011 – Deepwater Sediment Sampling Page 6
systematics for the Gulf of Mexico). Meiofaunal biomass also will be measured using a semi-
automated microphotographic technique (Baguley et al. 2004, 2008) used successfully by
members of the project team in prior Gulf of Mexico deep-benthic studies.
Biological response variables will include common benthic attributes such as numbers of taxa,
diversity, total density, species abundances, community structure, Swartz’s Dominance Index,
biomass (for meiofauna only), and percentages of sensitive vs. tolerant species (e.g., based on
family guild structure and known responses) that have been proven in previous studies to serve
as sensitive indicators of pollution-induced disturbances (Engle et al. 1994, Van Dolah et al.
1999, Simboura and Zenetos 2002, Peterson et al. 1996). For example, bioindicators of
contaminant exposure around platforms in the Gulf of Mexico include the relative percentages of
sensitive species such as echinoderms and crustaceans (especially amphipods and harpacticoids)
versus other more tolerant species such as polychaetes, oligochaetes, and nematodes (especially
non-selective deposit feeders) that are often enhanced by presence of contaminants (Peterson et
al. 1996). In addition, the biota will be examined for evidence of visible abnormalities, such as
oil-coated appendages, high incidence of empty shells or other animal parts, lesions, relatively
high incidence of parasites, and any other abnormal appearances that may be apparent. As a
specific example, harpacticoids will be inspected to determine if the external egg sacs are oiled
or exhibit signs of deterioration. Potential effects of pressure changes in bringing these
invertebrate animals to the surface should be minimal (e.g., due to lack of swim bladders present
in fishes) and thus should not interfere with the ability to detect signs of such oil-related
abnormalities if present.
Taking samples along potential exposure gradients in different directions from the incident site
has been shown in the peer-reviewed literature to be a scientifically effective method for
detecting long-term environmental impacts (Kennicutt et al. 1996a). This kind of sampling
design is often referred to as a ―bulls-eye‖ design because transects extend in radial patterns from
the source of the contamination and the statistical analysis of such designs is well known
(Kennicutt et al. 1996a). The present sampling design includes stations in a bulls-eye
configuration with an increasing concentration of stations moving closer to the well-head (Fig.
3b). Additional stations > 25 km to the SW of the well-head provides another means to look for
gradients of response with increasing distance from the well-head (Fig. 3a).
Among-station spatial comparisons will also be facilitated by applying appropriate multivariate
data-analysis methods — e.g., combinations of numerical classification (cluster analysis),
multidimensional scaling, principal components analysis, and discriminant analysis to define
groups of stations with similar faunal composition and then to identify which of the measured
abiotic environmental variables (including oil concentrations) are the most correlated with any
observed among-group differences (e.g., see Green and Vascotto 1978, Green and Montagna
1996, Hyland et al. 1991) (also see Objective 3 below).
The inclusion of samples coinciding with historical/pre-spill DGOMB sampling sites (Rowe and
Kennicutt 2008, 2009) also provides a basis to test for temporal differences in benthic fauna
before versus after the spill at specific locations around the study area. This information will
help provide some reference to natural temporal variability in these fauna that may be useful in
evaluating the significance of potential biological impacts associated with the oil spill. For
5/20/2011 – Deepwater Sediment Sampling Page 7
example, such information could be valuable in addressing the relevant question: if there are
observed variations in benthic fauna between oiled versus non-oiled sites, based on spatial
comparisons of samples collected after the spill, then how different are these variations from the
normal ranges of temporal variability within the region? Note that because different sampling
gear and methods were used to collect benthic samples at DGOMB stations during the original,
2000-2002, pre-spill study (Rowe and Kennecutt 2008,2009) vs. post-spill (fall 2010) Response
cruises, the sample sizes (surface area of the sampling units) vary between collections (e.g.,
macrofauna: 0.17 m2 for 2000-2002 study, 0.03 m
2 for fall 2010 effort) and adjustment factors
may need to be applied.
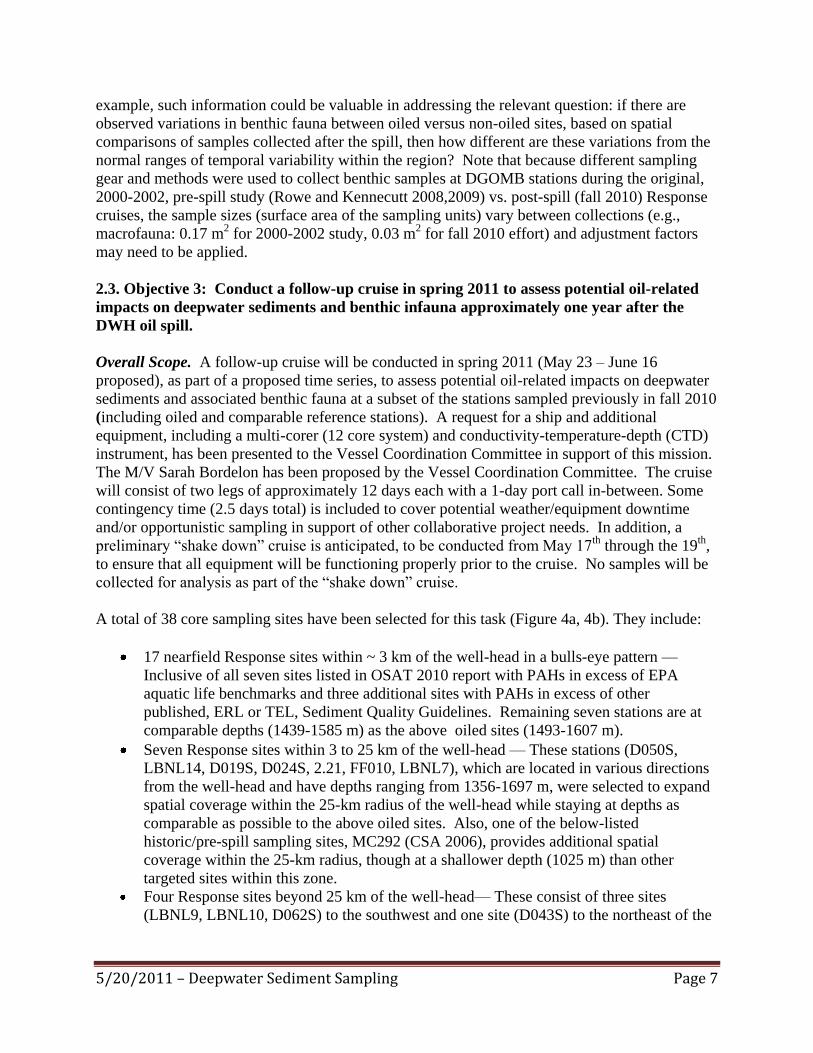
2.3. Objective 3: Conduct a follow-up cruise in spring 2011 to assess potential oil-related
impacts on deepwater sediments and benthic infauna approximately one year after the
DWH oil spill.
Overall Scope. A follow-up cruise will be conducted in spring 2011 (May 23 – June 16
proposed), as part of a proposed time series, to assess potential oil-related impacts on deepwater
sediments and associated benthic fauna at a subset of the stations sampled previously in fall 2010
(including oiled and comparable reference stations). A request for a ship and additional
equipment, including a multi-corer (12 core system) and conductivity-temperature-depth (CTD)
instrument, has been presented to the Vessel Coordination Committee in support of this mission.
The M/V Sarah Bordelon has been proposed by the Vessel Coordination Committee. The cruise
will consist of two legs of approximately 12 days each with a 1-day port call in-between. Some
contingency time (2.5 days total) is included to cover potential weather/equipment downtime
and/or opportunistic sampling in support of other collaborative project needs. In addition, a
preliminary ―shake down‖ cruise is anticipated, to be conducted from May 17th
through the 19th
,
to ensure that all equipment will be functioning properly prior to the cruise. No samples will be
collected for analysis as part of the ―shake down‖ cruise.
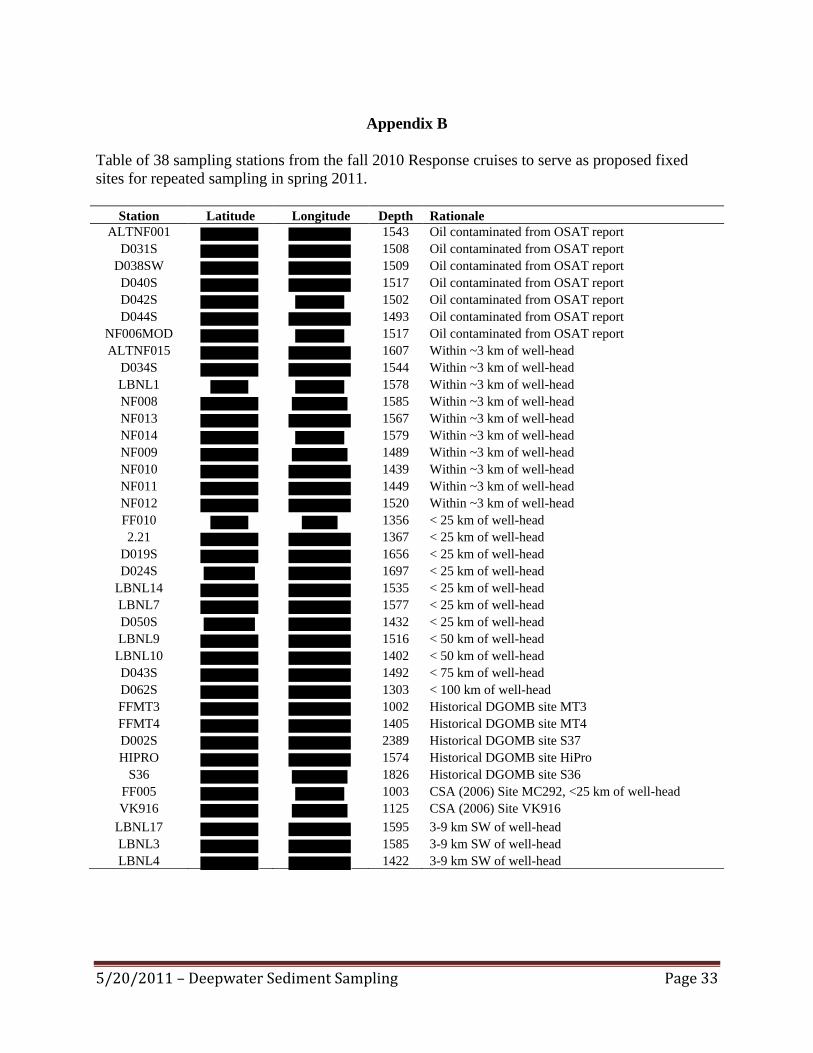
A total of 38 core sampling sites have been selected for this task (Figure 4a, 4b). They include:
17 nearfield Response sites within ~ 3 km of the well-head in a bulls-eye pattern —
Inclusive of all seven sites listed in OSAT 2010 report with PAHs in excess of EPA
aquatic life benchmarks and three additional sites with PAHs in excess of other
published, ERL or TEL, Sediment Quality Guidelines. Remaining seven stations are at
comparable depths (1439-1585 m) as the above oiled sites (1493-1607 m).
Seven Response sites within 3 to 25 km of the well-head — These stations (D050S,
LBNL14, D019S, D024S, 2.21, FF010, LBNL7), which are located in various directions
from the well-head and have depths ranging from 1356-1697 m, were selected to expand
spatial coverage within the 25-km radius of the well-head while staying at depths as
comparable as possible to the above oiled sites. Also, one of the below-listed
historic/pre-spill sampling sites, MC292 (CSA 2006), provides additional spatial
coverage within the 25-km radius, though at a shallower depth (1025 m) than other
targeted sites within this zone.
Four Response sites beyond 25 km of the well-head— These consist of three sites
(LBNL9, LBNL10, D062S) to the southwest and one site (D043S) to the northeast of the
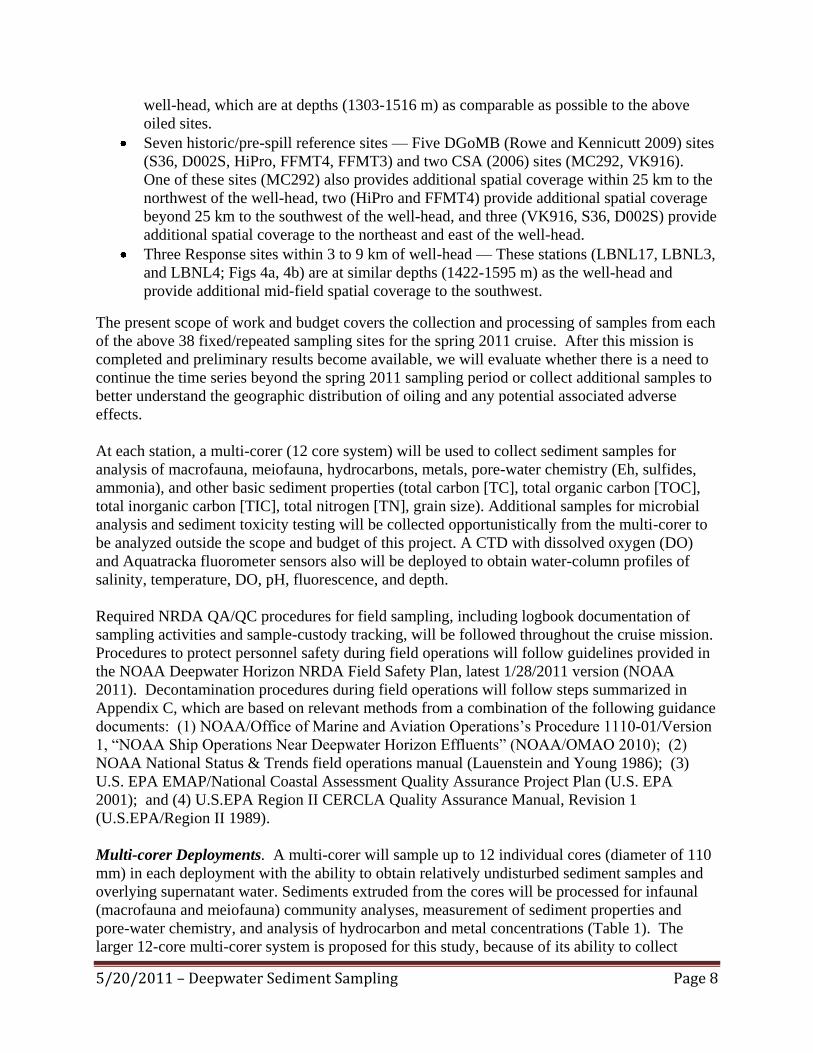
5/20/2011 – Deepwater Sediment Sampling Page 8
well-head, which are at depths (1303-1516 m) as comparable as possible to the above
oiled sites.
Seven historic/pre-spill reference sites — Five DGoMB (Rowe and Kennicutt 2009) sites
(S36, D002S, HiPro, FFMT4, FFMT3) and two CSA (2006) sites (MC292, VK916).
One of these sites (MC292) also provides additional spatial coverage within 25 km to the
northwest of the well-head, two (HiPro and FFMT4) provide additional spatial coverage
beyond 25 km to the southwest of the well-head, and three (VK916, S36, D002S) provide
additional spatial coverage to the northeast and east of the well-head.
Three Response sites within 3 to 9 km of well-head — These stations (LBNL17, LBNL3,
and LBNL4; Figs 4a, 4b) are at similar depths (1422-1595 m) as the well-head and
provide additional mid-field spatial coverage to the southwest.
The present scope of work and budget covers the collection and processing of samples from each
of the above 38 fixed/repeated sampling sites for the spring 2011 cruise. After this mission is
completed and preliminary results become available, we will evaluate whether there is a need to
continue the time series beyond the spring 2011 sampling period or collect additional samples to
better understand the geographic distribution of oiling and any potential associated adverse
effects.
At each station, a multi-corer (12 core system) will be used to collect sediment samples for
analysis of macrofauna, meiofauna, hydrocarbons, metals, pore-water chemistry (Eh, sulfides,
ammonia), and other basic sediment properties (total carbon [TC], total organic carbon [TOC],
total inorganic carbon [TIC], total nitrogen [TN], grain size). Additional samples for microbial
analysis and sediment toxicity testing will be collected opportunistically from the multi-corer to
be analyzed outside the scope and budget of this project. A CTD with dissolved oxygen (DO)
and Aquatracka fluorometer sensors also will be deployed to obtain water-column profiles of
salinity, temperature, DO, pH, fluorescence, and depth.
Required NRDA QA/QC procedures for field sampling, including logbook documentation of
sampling activities and sample-custody tracking, will be followed throughout the cruise mission.
Procedures to protect personnel safety during field operations will follow guidelines provided in
the NOAA Deepwater Horizon NRDA Field Safety Plan, latest 1/28/2011 version (NOAA
2011). Decontamination procedures during field operations will follow steps summarized in
Appendix C, which are based on relevant methods from a combination of the following guidance
documents: (1) NOAA/Office of Marine and Aviation Operations’s Procedure 1110-01/Version
1, ―NOAA Ship Operations Near Deepwater Horizon Effluents‖ (NOAA/OMAO 2010); (2)
NOAA National Status & Trends field operations manual (Lauenstein and Young 1986); (3)
U.S. EPA EMAP/National Coastal Assessment Quality Assurance Project Plan (U.S. EPA
2001); and (4) U.S.EPA Region II CERCLA Quality Assurance Manual, Revision 1
(U.S.EPA/Region II 1989).
Multi-corer Deployments. A multi-corer will sample up to 12 individual cores (diameter of 110
mm) in each deployment with the ability to obtain relatively undisturbed sediment samples and
overlying supernatant water. Sediments extruded from the cores will be processed for infaunal
(macrofauna and meiofauna) community analyses, measurement of sediment properties and
pore-water chemistry, and analysis of hydrocarbon and metal concentrations (Table 1). The
larger 12-core multi-corer system is proposed for this study, because of its ability to collect
5/20/2011 – Deepwater Sediment Sampling Page 9
additional spare cores to provide backup material or to support other potential analyses outside
the present scope of work and budget (e.g., sediment bioassays and microbial analyses). Core
locations in the corer system will be sequentially numbered and cores will be assigned to study
elements using a random number generator. At each station, three replicate sets of samples
(from three separate multi-corer drops) will be collected for each of the sample types.
Sampling and Analysis of Sediment Properties. One of the cores from each of the multi-core
drops will be used for the analysis of sediment properties: total carbon (TC), total organic
carbon (TOC), total inorganic carbon (TIC), total nitrogen (TN) and grain size. Sediment from
each core will be extruded and divided into four vertical sections (0 – 1 cm, 1 – 3 cm, 3-5 cm,
and 5-10 cm deep). Samples for the analysis of elemental carbon and nitrogen (TC, TOC, TIC,
TN) will be placed in clean 4-oz glass jars with Teflon lid liners and stored at -20 °C. Samples
for grain size will be placed in whirl-pack bags and stored at 4 °C. TC, TOC, TIC, and TN
content of dried samples will be determined using a CHN (Carbon/Hydrogen/Nitrogen) analyzer.
For grain-size analyses, standard sieve and hydrometer methods will be used (as described in
ASTM D-422) to determine the relative percentages of various particle size fractions based on
sediment classification procedures of Folk (1974). For consistency with other pre-spill benthic
studies in the region (Rowe and Kennicutt 2008, 2009; CSA 2006), results for each sample will
be reported as percent gravel, sand, silt, and clay. Thus, the sieving procedure will not include
separating the sand fraction into finer subdivisions (i.e., coarse sand, medium sand, fine sand,
very fine sand). This latter option should not be necessary since sediments throughout the
sampling area are predominantly silt and clay (based on the above pre-spill studies).
Sampling and Analysis of Macrofauna. Three of the cores from each multi-corer drop will be
used for the analysis of macro-infauna. The surface area of each individual core is ~0.01 m2. In
order to be consistent with protocols followed on the fall 2010 sampling cruises, the individual
cores from the same multi-corer drop, although processed separately, will be pooled
mathematically to serve as an individual sample (0.03 m2) for data-analysis purposes. Three
replicate samples, derived from three separate multi-corer drops, will be collected at each station.
Sediment from each core will be extruded into four vertical sections (0 – 3 cm, 3 – 5 cm, and 5 –
10, and 10-15 cm), preserved at sea in 4% buffered formalin with Rose Bengal, and sieved later
on-shore. The upper three sections will be processed as part of the this project and the lowest
section will be archived for possible subsequent analysis (outside the scope of this plan). On
return to the laboratory, the formalin-Rose Bengal solution will be changed to a 70% EtOH
solution. Samples will be sieved using a 0.3-mm mesh and a gentle wash.
Macrofauna in these various samples will be identified to lowest possible taxonomic level and
enumerated. As for the analysis of fall 2010 benthic samples (previous section), it is anticipated
that for most taxa this will be at the family level. As before, some of the more obvious dominant
taxa may be identified to genus or species as appropriate. Also, all specimens will be archived
so that identifications to lower taxonomic levels can be made at a later date if that is deemed
desirable. Numbers of individuals will be recorded to lowest taxon (mostly family level) in each
vertical section, from each individual core (within same drop), from each of the three replicate
samples (separate drops) at a station.
5/20/2011 – Deepwater Sediment Sampling Page 10
The following benthic response variables may be calculated for each replicate sample:
Infaunal abundance (total number of individuals per station)
Infaunal density (total number of individuals per square meter)
Densities of individual key taxa (e.g., numerical dominants)
Species richness (e.g., number of taxa, Margalef’s D)
Taxa diversity (Shannon’s Index H´)
Evenness (Pielou’s Index J´)
Swartz’s Dominance Index
In addition, as mentioned in the previous section, the biota also will be examined for evidence of
visible abnormalities. Such effects could include oil-coated appendages, high incidence of
empty shells or other animal parts, lesions, high incidence of parasites, and any other abnormal
appearances that may be apparent.
A suite of standard univariate and multivariate data-analysis methods can be used to characterize
benthic communities and examine patterns in relation to oil and other measured environmental
variables. Multivariate analysis may include ordination of station species abundance data by
multi-dimensional scaling using the Bray-Curtis similarity measure and hierarchical clustering of
similarity values using the group-average sorting strategy. A test of the significance of
dissimilarities determined by the ordination may be conducted using a non-parametric
permutation procedure on the ordination similarity matrix (Clarke and Gorley 2006). Results are
used to depict spatial and/or temporal groupings of samples. Principal components analysis
(PCA) can then be applied in conjunction with these analyses to help determine whether the
separation of groups can be explained by various measured abiotic environmental variables
including levels of oil (sensu Green and Vascotto 1978, Green and Montagna 1996, Hyland et al.
1991). The analysis derives a reduced set of variables that best describe the variance, based on
data represented by the different abiotic environmental variables. Variable loads, which are the
correlations between the original variables and the PCA scores on each variable, provide a
measure of the relative contribution of each variable to group separation. Sample scores provide
a new derived multivariate variable containing information about the load of each sample. Each
of the above biotic univariate metrics (density, diversity, number of sensitive taxa, etc.) can be
regressed against the PCA scores for each sample (Green and Montagna 1996, Long et al. 2003)
and analyzed using an appropriate test of significance to determine statistically significant
differences among various station groups or group/time interactions (Kennicutt et al. 1996a,
Montagna and Harper 1996). Also, because replicate samples (three) will be collected at each
station during the spring 2011 sampling effort, potential impacts can be examined from spatial
comparisons of benthic response variables between oiled versus reference sites of comparable
depths using ANOVA (e.g., nested ANOVA to test for differences in benthic variables between
oiled stations and reference stations, with three replicate measurements per each station; Sokal
and Rohlf 1969).
Comparisons of post-spill benthic data with pre-spill data from DGOMB sites may focus on
response variables and analysis approaches known to be relatively independent of sample-size
differences (e.g., density/m2, Hurlbert’s E(Sn) and related rarefaction methods). A similar
approach may need to be used for comparisons with pre-spill data from the two CSA (2006) sites
(MC292, VK916), which also were based on a different sample size (0.1 m2).
5/20/2011 – Deepwater Sediment Sampling Page 11
Sampling and Analysis of Meiofauna. One of the sediment cores from each multi-corer drop
will be used for meiofaunal analysis. Sediment from each 0.01-m2 core will be extruded and
divided into five vertical sections (0 – 1 cm, 1 – 3 cm, 3-5 cm, 5-10 cm, and 10-15 cm deep).
Each vertical section will be sub-sampled with a 5.5 cm diameter corer (to be consistent with the
fall 2010 sampling methods). Once extruded and subdivided, the sediment will be relaxed in 7%
MgCl2, preserved in 4% buffered formalin with Rose Bengal, and sieved later on-shore with a
0.042-mm sieve. After sieving, the samples are transferred to 70% ethanol. The upper four
sections will be processed as part of this plan and the remaining section will be archived for
possible subsequent analysis (outside the scope of this plan). Meiofaunal specimens will be
counted and identified to the lowest possible taxonomic level (family level for Harpacticoida and
higher levels for other meiofaunal groups that lack reliable species-level systematics for the Gulf
of Mexico). The methods are consistent with those used in previous Gulf of Mexico deepwater
studies by members of the project team (e.g., Baguley et al. 2008). Biomass will be measured
using a semi-automated photographic technique (Baguley et al. 2004). In addition, the
meiofauna will be examined for evidence of visible abnormalities that could be related to adverse
effects of the DWH incident (see previous section). Data analysis methods to assess meiofaunal
patterns will be the same as those described above for macrofauna.
Sampling and Analysis of Chemical Contaminants. One of the cores from each of the replicate
multi-corer drops will be used for the analysis of hydrocarbons. Sediment from each core will be
extruded and divided into four vertical sections (0 – 1 cm, 1 – 3 cm, and 3-5, and 5-10 cm deep).
Once extruded, the sediment will be placed in clean 4-oz glass jars with Teflon lid liners, stored
onboard the ship at -20°C, and transported frozen to the NRDA/Trustees analytical chemistry
contractor (Alpha Analytical Laboratory) for extraction and analysis of hydrocarbons using
approved NRDA QAP chemistry analysis and laboratory methods. The following measurements
should be included: total petroleum hydrocarbons (TPH), also referred to as total extractable
hydrocarbons (TEH), representing the total aromatic and aliphatic hydrocarbon content of the
sample; PAHs including individual parent and alkyl homologues; saturated hydrocarbons including
alkanes and isoprenoids; and oil finger-printing diagnostics. Analyses should follow methods
provided in the NOAA MC 252 Analytical Quality Assurance Plan/Version 2.2 (NOAA 2011).
For consistency, analyses also should include analytes measured in the fall 2010 Response
samples (e.g., the 41 individual PAH analytes listed in Table A-3 of OSAT 2010 Report).
In addition, one of the cores from each replicate multi-corer drop will be used for the analysis of
metals (e.g., silver, barium, cadmium, mercury, lead, nickel, vanadium, and zinc) that are
common constituents of drill cuttings and drill muds (Kennicutt et al. 1996b) and Corexit
9500/9527 dispersant indicators (e.g., dioctylsulfosuccinate sodium salt, Dipropylene Glycol n-
Butyl Ether). As with the analysis of hydrocarbons, the analyses will be performed by the
NRDA/Trustees analytical chemistry contractor using approved NRDA QAP methods.
Sediment from these cores also will be divided into four vertical sections (0 – 1 cm, 1 – 3 cm, 3-
5, and 5-10 cm deep), split evenly for the metals and dispersant (Corexit) analyses, and placed in
clean 4-oz glass jars with Teflon lid liners. Subsamples for metals analysis will stored onboard
the ship at -20 °C, and transported frozen to shore-based Alpha Analytical Laboratory for
extraction and analysis. Subsamples for Corexit analysis will stored onboard the ship at -20 °C,
and transported frozen to Columbia Analytical Services for extraction and analysis.
5/20/2011 – Deepwater Sediment Sampling Page 12
Sediment Pore-Water Chemistry. Two of the cores from each of the multi-corer drops will be
used for the analysis of pore-water chemistry: sulfide, ammonia, pH, salinity, temperature, and
oxidation-reduction potential (Eh). A total of 50 mL of pore water is required to complete all
analyses. Pore water will be collected in one of two ways: (1) in situ using a suction filtration
method in order to minimize disturbance to the sediment and exposure to oxygen (Winger and
Lasier 1991, Cooksey and Hyland 2007); or (2) ex situ centrifugation of sediment, as a fall back,
if suction filtration methods do not provide a large enough volume of pore water for testing all
parameters. While a large variety of methods are available for pore-water extraction, both in-situ
suction filtration and ex-situ centrifugation have been widely used with only minor differences in
chemistry found between these methods (Winger et al. 1998). However, the first method is the
preferred one and preliminary extractions with sediment from the region yielded successful
results.
For in-situ suction filtration, two fused-glass air stones will be placed at a depth of 3 cm in each
core and assumed to sample approximately the upper surrounding 0-5 cm. A vacuum will be
applied with either a 50 mL syringe or vacuum pump to facilitate suctioning. For ex-situ
centrifugation, the upper 0-5 cm will be extruded from the core and placed in clean centrifuge
tubes and centrifuged at high speed (10,000 g) for a maximum of 30 minutes in a refrigerated
bench-top centrifuge. Any open handling of pore water for analysis, or sediment for pore water
extraction, will occur under a nitrogen environment. Regardless of the extraction method, we
will attempt to collect the required volume of pore water by combining the upper 0-5 cm of
sediment from both cores into a single composite for each replicate multi-corer drop at a station.
If a sufficient volume of pore water cannot be obtained from the two composited cores within a
single multi-core drop, then samples will be composited from all three replicate drops at a
station.
Sulfide and ammonia will be measured on a HACH DR/890 colorimeter while in the field.
Measurement of total ammonia concentrations will follow the salicylate method in HACH
(2009). Un-ionized ammonia nitrogen (UAN), the form considered the most toxic to shallow
aquatic fauna (US EPA, 1989), will be calculated based on the total ammonia concentration and
the corresponding salinity, pH, and temperature of the sample (Bower and Bidwell, 1978).
Measurement of sulfide will follow the methylene blue method in HACH (2009) adapted from
APHA Standard Method 4500-S2-
(APHA, 1989). Un-ionized H2S, the form considered the most
toxic to shallow aquatic fauna (US EPA, 1986) will be calculated based on the sulfide (S2-
)
concentration, pH of the sample, and pK′ provided in Standard Method 4500-S2- (APHA, 1989).
Temperature, pH, and oxidation-reduction potential (ORP) will be measured while in the field
using a combination pH and ORP pen meter (Hanna Instruments model 98121). ORP is
measured in mV and requires the addition of an offset voltage of 210 mV to convert the reading
to Eh (Hanna Tech Service, personal communication). Salinity of the pore-water sample will be
determined with a refractometer.
The data resulting from pore-water chemistry analysis may be able to be used to aid in the
interpretation of toxicity results and biological patterns of infauna and to validate Sediment
Profile Imaging (SPI) data collected at coinciding sites through a separate collaborative project
effort.
5/20/2011 – Deepwater Sediment Sampling Page 13
Spare Cores: Sediment Toxicity Testing and Microbial Analysis.
Three of the 12 cores on the multi-core system will be available as spares to provide back-up
material to replace any of the above types of cores that may have failed. To the extent that extra
cores may be available, spare cores may be available for use in toxicity testing or microbial
analysis. At this time, a specific sediment bioassay for toxicity testing has not been identified
and thus is not included as a budgeted activity within the scope of the present plan. The top 3 cm
of up to three spare cores from each replicate multi-core drop will be reserved for toxicity
bioassay tests. Each core will be subdivided into two aliquots. One aliquot will be preserved at
4°C and will enter into BP chain of custody, and the other alliquot will be frozen on board the
vessel at -80 °C, and transferred to Alpha Analytical Laboratory upon completion of the cruise,
where they will be archived at -80 °C under Trustee chain of custody. Analysis of these cores is
not addressed in this plan.
Up to one spare core from a subset of the sampling locations will be reserved for microbial
analysis. Microbial cores will be retained intact (un-sectioned). Overlying water on the
sediment core will be removed via siphoning (not poured) with only a couple of cm of water left
in place. Cores will be capped and frozen upright at -80 °C. Once frozen, the cores may be
stored horizontally. Cores will be shipped packed in dry ice to Alpha Analytical Laboratory for
archive, until such time as a cooperatively-approved laboratory can be identified.
CTD Profiles. A CTD with DO and Aquatracka fluorometer sensors will be used to acquire
continuous profiles of conductivity, temperature, pH, dissolved oxygen, depth, and fluorescence
at each station as it is lowered and raised through the water column. The resulting data can be
used to aid in the interpretation of biological patterns. The CTD/Aquatracka unit will be
deployed either independently of the multi-corer system, within its own frame, or simultaneously
by mounting the unit to the multi-corer frame. The latter approach would save time on station by
eliminating a separate instrument deployment (typically minimum of 2 hrs roundtrip) and is
identified by the multi-corer manufacturer as a viable option.
3.0 Milestones and Deliverables:
Cruise Plan for spring 2011 cruise — Prior to cruise departure.
Cruise Report — Within 2-4 weeks of cruise completion.
Report on results of initial benthic sample analysis (from 2010 Gyre and Ocean Veritas
cruises) — Approximately 6 months after approval to begin these analyses.
Report on benthic results from spring 2011 field effort — Approximately 6 months after
cruise completion.
Periodic letter progress reports — To provide updates on progress and reports of any
preliminary salient findings.
Overall final report — Approximately 1 year after completion of spring 2011 cruise
(pending availability of chemistry data).
4.0 Key Personnel:
5/20/2011 – Deepwater Sediment Sampling Page 14
Project management —Jeff Hyland (NOAA/NCCOS), Paul Montagna (Texas A&M
University-Corpus Christi; TAMU-CC), and Cynthia Cooksey (NOAA/NCCOS) as co-
Project Leads.
Field work —Paul Montagna (TAMU-CC), Rick Kalke (TAMU-CC), and Cynthia
Cooksey (NOAA/NCCOS) will serve as Chief Scientist or 2nd Watch Leader on
alternating legs of the spring 2011 cruise (May 23 – June 16, 2011, divided into two legs
of ~12 days each with a 1-day port call in-between). The proposed vessel, M/V Sarah
Bordelon, accommodates 30 people total, six of whom are required for basic ship
operations (captain, engineer, cook, etc.). The following list is a breakdown of the
remaining 24 crew slots (by institution) needed to support the science mission for each of
the two cruise legs (each leg will consist of two 12-hr shifts):
o CSA — 4 per watch (8 total) for various ship scientific support functions (1 winch
operator, 1 Nav Tech, 2 deck hands one of whom also assists with Nav Tech
functions);
o TAMU-CC — 4 per watch (8 total): Chief Scientist/Watch Leader, processing of
multi-core samples, misc. sampling activities;
o NOAA-NCCOS — 2 per watch (4 total): Chief Scientist/Watch Leader, pore-
water chemistry, misc. sampling activities;
o Cardno ENTRIX — 1 per watch (2 total): RP representation, processing of multi-
core samples, misc. sampling activities;
o NOAA-Trustees Field Ops — 1 per watch (2 total): Data management and record
keeping; misc. sampling activities.
o Total — 12 per watch (24 total).
Macrofauna analysis — Paul Montagna (TAMU-CC)
Meiofauna analysis — Paul Montagna (TAMU-CC), Jeff Baguley (U. Nevada-Reno),
Woncheol Lee (Hangyang U., South Korea)
Sediment grain and elemental C/N analyses – Paul Montagna (TAMU-CC)
Sediment chemistry analysis — NRDA Trustees Contractor to run analyses; Mike Fulton
(NOAA/NCCOS) to work with chemistry Contractor and other project staff on
interpretation and reporting of chemistry data.
Data analysis and reporting — All of the above personnel; Others (e.g., Len Balthis and
Ian Hartwell from NOAA/NCCOS)
5.0 Safety Plans:
A HASP binder containing all health and safety protocols is provided to each vessel. All well-
established health and safety protocols will be followed and will be provided to the vessel in a
dedicated binder. The M/V Sarah Bordelon is the vessel currently assigned for the upcoming
spring 2011 cruise. The ship’s operational safety procedures will be followed at all times. Also,
all activities will follow protocols of NOAA’s Deepwater Horizon NRDA Field Safety Plan,
latest version 1/28/2011 (NOAA 2011), which will be available on the vessel. MSDS hazardous
materials sheets will be posted as well. Principal investigators may merge these safety plans
with other applicable university or participating organization practices.
6.0 Data Sharing:
5/20/2011 – Deepwater Sediment Sampling Page 15
6.1 Digital and Shipboard Data
All data and imagery (including navigation, instrument data, field logs, photographs and
documentation), acoustic, and other electronic data will be saved to an on-board computer, and
all data shall be migrated to a dedicated external hard drive. The data will be controlled and
managed under project protocols, including Chain-of-Custody tracking of the external hard-
drive. Upon return to port, the Data Manager shall produce identical copies of the raw and
processed electronic media generated during the cruise and deliver one of those copies each to
NOAA (or its contractor), Louisiana Oil Spill Coordinator’s Office (LOSCO) on behalf of the
State of Louisiana, and to Cardno ENTRIX.
6.2 Laboratory Data
Sediment samples for macrofauna, grain size, and elemental TOC/TC/TIC/TN analyses will be
performed at TAMU-CC under the supervision of Dr. Paul Montagna. Sediment samples for
meiofauna analysis will be processed under the supervision of Dr. Paul Montagna (TAMU-CC)
and Dr. Jeff Baguley (U. of Nevada). The meiofauna samples will be sent to University of
Nevada and extracted, sorted, enumerated to major taxonomic levels, and measured for biomass
in Dr. Baguley’s lab. Harpacticoid copepods from these meiofaunal samples will then be sent to
Dr. Woncheol Lee of Hangyang University to be identified to family level. Drs. Baguley and Lee
are former students and postdocs of Dr. Montagna and performed all of the prior DGOMB
analyses. Sediment samples for the analysis of hydrocarbons and other chemical contaminants
will be sent to the appropriate NRDA/Trustees contractor (Alpha Analytical Laboratories for
hydrocarbons and metals, Columbia Analytical Services for dispersants). Excess sediment cores
will be sent to Alpha Analytical Laboratories for archive.
Each laboratory shall simultaneously deliver raw data, including all necessary metadata,
generated as part of this work plan as a Laboratory Analytical Data Package (LADP) to the
trustee Data Management Team (DMT), the Louisiana Oil Spill Coordinator's Office (LOSCO)
on behalf of the State of Louisiana and to BP (or Cardno ENTRIX on behalf of BP). The
electronic data deliverable (EDD) spreadsheet with pre-validated analytical results, which is a
component of the complete LADP, will also be delivered to the secure FTP drop box maintained
by the trustees' Data Management Team (DMT). Any preliminary data distributed to the DMT
shall also be distributed to LOSCO and to BP (or Cardno ENTRIX on behalf of BP). Thereafter,
the DMT will validate and perform quality assurance/quality control (QA/QC) procedures on the
LADP consistent with the authorized Quality Assurance Project Plan, after which time the
validated/QA/QC'd data shall be made available simultaneously to all trustees and BP (or Cardno
ENTRIX on behalf of BP). Any questions raised on the validated/QA/QC results shall be
handled per the procedures in the Quality Assurance Project Plan and the issue and results shall
be distributed to all parties. In the interest of maintaining one consistent data set for use by all
parties, only the validated/QA/QC’d data set released by the DMT shall be considered the
consensus data set. In order to assure reliability of the consensus data and full review by the
parties, no party shall publish consensus data until 7 days after such data has been made
available to the parties. Also, the LADP shall not be released by the DMT, LOSCO, BP or
Cardno ENTRIX prior to validation/QA/QC absent a showing of critical operational need.
5/20/2011 – Deepwater Sediment Sampling Page 16
Should any party show a critical operational need for data prior to validation/QA/QC, any
released data will be clearly marked "preliminary/unvalidated" and will be made available
equally to all trustees and to BP (or Cardno ENTRIX on behalf of BP).
All materials associated with the collection or analysis of samples under these protocols or
pursuant to any approved work plan, except those consumed as a consequence of the applicable
sampling or analytical process, must be retained unless and until approval is given for their
disposal in accordance with the retention requirements set forth in paragraph 14 of Pretrial Order
# 1 (issued August 10, 2010) and any other applicable Court Orders governing tangible items
that are or may be issued in MDL No. 2179 IN RE: Oil Spill by the Oil Rig "DEEPWATER
HORIZON" (E.D. LA 2010). Such approval to dispose must be given in writing and by a person
authorized to direct such action on behalf of the state or federal agency whose employees or
contractors are in possession or control of such materials. This plan will be implemented
consistent with existing trustee regulations and policies. All applicable state and federal permits
must be obtained prior to conducting work.
7.0 References:
APHA – American Public Health Association, 1989. Standard Methods for the Examination of
Waste and Wastewater, 17th ed. American Public Health Association, Washington, DC.
Baguley, J.G., L.J. Hyde, and P.A. Montagna. 2004. A semi automated digital
microphotographic approach to measure meiofaunal biomass. Limnology and Oceanography
Methods. 2:181 190.
Baguley, J., P. Montagna, L. Hyde, and G. Rowe. 2008. Metazoan meiofauna biomass and
weight-dependent respiration in the northern Gulf of Mexico deep sea. Deep-Sea Research II,
55: 2607–2616.
Clarke, K.R. and R.N Gorley. 2006. PRIMER v6: User Manual / Tutorial. PRIMER-E:
Plymouth, United Kingdom.
Continental Shelf Associates, Inc. 2006. Effects of Oil and Gas Exploration and Development at
Selected Continental Slope Sites in the Gulf of Mexico. Volume II: Technical Report. U.S.
Department of the Interior, Minerals Management Service, Gulf of Mexico OCS Region,
New Orleans, LA. OCS Study MMS 2006-045. 636 pp.
Cooksey, C.L., and Hyland, J.L. 2007. Sediment quality of the Lower St. Johns River, Florida:
An integrative assessment of benthic fauna, sediment-associated stressors, and general
habitat characteristics. Marine Pollution Bulletin 54: 9-21.
Denoux, G., P. Gardinali, and T.L. Wade. 1998. Quantitative determination of polynuclear
aromatic hydrocarbons by gas chromatography/mass spectrometry-selected ion monitoring
(SIM) mode. In: Sampling and Analytical Methods of the National Status and Trends
Program, Mussel Watch Project: 1993–1996 Update. NOAA Technical Memorandum NOS
ORCA 130, pp. 129–139.
Engle, V.D., J.K. Summers, and G.R. Gaston. 1994. A benthic index of environmental condition
of Gulf of Mexico estuaries. Estuaries 17: 373-384.
Folk, R.L. 1974. Petrology of sedimentary rocks. Hemphill, Austin, Texas, 182 p.
Green, R.H. and P. Montagna. 1996. Implications for monitoring: Study designs and
interpretation of results. Canadian Journal of Fisheries and Aquatic Sciences 53:2629-2636.
5/20/2011 – Deepwater Sediment Sampling Page 17
Green, R.H. and G.L. Vascotto. 1978. A method for the analysis of environmental factors
controlling patterns of species composition in aquatic communities. Wat. Res., 12, 583-590.
HACH, 2009. DR/890 Colorimeter Procedures Manual. Hach Chemical Company, Loveland,
CO.
Heip, C., Warwick, R.M., Carr, M.R., Herman, P.M.J., Huys, R., Smol, N. and Van Holsbeke, K.
1988. Analysis of community attributes of the benthic meiofauna of
Frierfjord/Langesundfjord. Marine Ecology Progress Series 46:171-180.
Hyland, J., E. Baptiste, J. Campbell, J. Kennedy, R. Kropp, and S. Williams. 1991.
Macroinfaunal communities of the Santa Maria Basin on the California outer continental
shelf and slope. Mar. Ecol. Prog. Ser, 78, 147-161.
Kennicutt, M.C., II, R. H. Green, P. Montagna and P. F. Roscigno. 1996a. Gulf of Mexico
Offshore Operations Experiment (GOOMEX) Phase I: Sublethal responses to contaminant
exposure introduction and overview. Canadian Journal of Fisheries and Aquatic Sciences
53:2540-2553.
Kennicutt, M.C. II, P.N. Boothe, T.L. Wade, S.T. Sweet, R. Rezak, J.M. Brooks, B.J. Presley,
and D.A. Wiesenburg. 1996b. Geochemical patterns in sediments near offshore production
platforms. Canadian Journal of Fisheries and Aquatic Science 53: 2554-2566.
Lauenstein, G.G. and D.R. Young. 1986. National Status and Trends Program for Environmental
Quality. Benthic Surveillance Project: Cycle III Field Manual. NOAA Tech Memo NOS
OMA 28. 26 pp.
Long, E.R., R.S. Carr, and P.A. Montagna. 2003. Porewater toxicity tests: value as a component
of sediment quality triad assessments. In: R.S. Carr and M. Nipper (eds.) Porewater Toxicity
Testing: Biological, Chemical, and Ecological Considerations. Society of Environmental
Toxicology and Chemistry (SETAC) Press, Pensacola, FL. Chapter 8, pp. 163-200.
Long E.R., D.D. MacDonald, S.L. Smith, and F.D. Calder. 1995. Incidence of adverse biological
effects within ranges of chemical concentrations in marine and estuarine sediments. Environ
Manage 19: 81–97.
MacDonald D.D., R.S. Carr, F.D. Calder, E.R. Long, and C.G. Ingersoll. 1996. Development and
evaluation of sediment quality guidelines for Florida coastal waters. Ecotoxicology 5: 253-
278.
Montagna, P.A. and D. E. Harper, Jr. 1996. Benthic infaunal long-term response to offshore
production platforms. Canadian Journal of Fisheries and Aquatic Sciences 53:2567-2588.
NOAA. 2010. Mississippi Canyon 252 (Deepwater Horizon) Natural Resource Damage
Assessment, Analytical Quality Assurance Plan, Version 2.1, July 22, 2010. 36 pp.
NOAA. 2011. Deepwater Horizon NRDA Field Safety Plan, 1/28/2011 version. 37 pp.
NOAA/OMAO. 2010. NOAA Ship Operations Near Deepwater Horizon Effluents, Procedure
1110-01/Version 1, 6/18/2010. 8 PP.
OSAT. 2010. Sub-sea and sub-surface oil and dispersant detection: Sampling and monitoring.
Operational Science Advisory Team (OSAT) report, 17 December 2010. OSAT, Unified
Area Command, New Orleans, LA. <http://www.restorethegulf.gov/release/2010/12/16/data-analysis-
and-findings> Peterson, C.H., M.C. Kennicutt II, R.H. Green, P. Montagna, D.E. Harper, Jr., E.N. Powell, and
P.F. Roscigno. 1996. Ecological consequences of environmental perturbations associated
with offshore hydrocarbon production: A perspective from study of long term exposures in
the Gulf of Mexico. Canadian Journal of Fisheries and Aquatic Sciences 53:2637-2654.
Qian, Y., J.L. Sericano, and T.L. Wade. 1998. Extraction and clean-up of sediments for trace
organic analysis. In: Sampling and Analytical Methods of the National Status and Trends
5/20/2011 – Deepwater Sediment Sampling Page 18
Program, Mussel Watch Project: 1993–1996 Update. NOAA Technical Memorandum NOS
ORCA 130, pp. 94–97.
Rowe, G.T. and M.C. Kennicutt II, eds. 2008. The Deep Gulf of Mexico Benthos Program.
Deep-Sea Research Part II, 55 (Issues 24-26).
Rowe, G.T. and M.C. Kennicutt II, eds. 2009. Northern Gulf of Mexico continental slope
habitats and benthic ecology study: Final report. U.S. Dept. of the Interior, Minerals
Management. Service, Gulf of Mexico OCS Region, New Orleans, LA. OCS Study MMS
2009-039. 456 pp.
Simboura, N. and A. Zenetos. 2002. Benthic indicators to use in Ecological Quality classification
of Mediterranean soft bottom marine ecosystems, including a new Biotic Index.
Mediterranean Marine Science 3: 77-111.
Sokal, R.R. and F.J. Rohlf. 1969. Biometry, 2nd
Edition. W.H. Freeman and Company, NY. 859
pp.
Stevens, D. L. and A. R. Olsen. 2004. Spatially balanced sampling of natural resources. J. Amer.
Statistical Assoc. 99(465):262-278.
UAC. 2010. Implementation Plan for Sub-sea and Sub-surface Oil and Dispersant Detection,
Sampling, and Monitoring. Deepwater Horizon MC 252 Response Unified Area Command.
U.S. Coast Guard and BP Exploration and Production, Inc., New Orleans, LA (11/13/2010
Final).
US EPA, 1986. Quality criteria for water 1986. EPA 440/5-86-001, Office of Water, US
Environmental Protection Agency, Washington, DC.
US EPA, 1989. Ambient water quality for ammonia (saltwater) – 1989. EPA 440/5-88-004,
Office of Water, US Environmental Protection Agency, Washington, DC.
U.S. EPA. 2001. Environmental Monitoring and Assessment Program (EMAP): National
Coastal Assessment Quality Assurance Project Plan 2001-2004. United States Environmental
Protection Agency, Office of Research and Development, National Health and
Environmental Effects Research Laboratory, Gulf Ecology Division, Gulf Breeze,
FL.EPA/620/R-01/002.
U.S. EPA. 2008. National Coastal Condition Report III. EPA/842-R-08-002. U.S. EPA, Office of
Research and Development/Office of Water, Washington, D.C. 301 pp. Available at:
http://www.epa.gov/nccr/.
U.S. EPA/Region II. 1989. CERCLA Quality Assurance Manual, Revision 1, October 1989. 113
pp.
Van Dolah, R.F., J.L. Hyland, J.S. Rosen, and T.R. Snoots. 1999. A benthic index of biological
integrity for assessing habitat quality in estuaries of the southeastern USA. Marine
Environmental Research 48: 269-283.
Wade, T.L., Y. Soliman, S.T. Sweet, G.A. Wolff, B.J. Presley. 2008. Trace elements and
polycyclic aromatic hydrocarbons (PAHs) concentrations in deep Gulf of Mexico sediments.
Deep-Sea Research II, 55: 2585–2593.
Warwick, R.M. 1988. Analysis of community attributes of the macrobenthos of Frierfjord/
Langesundfjord at taxonomic levels higher than species. Marine Ecology Progress Series
Ser. 46:167-170.
Warwick, R.M., M.R. Carr, K.R. Clarke, J.M. Gee, and R.H. Green. 1988. A mesocosm
experiment on the effects of hydrocarbon and copper pollution on a sublittoral soft-sediment
meiobenthic community. Marine Ecology Progress Series 46:181-191.
5/20/2011 – Deepwater Sediment Sampling Page 19
Winger, P.V. and P.J. Lasier. 1991. A vacuum-operated pore-water extractor for estuarine and
freshwater sediments. Archives of Environmental Contamination and Toxicology 21: 321–
324.
Winger, P.V., P.J. Lasier, and B.P. Jackson. 1998. The Influence of Extraction Procedure on Ion
Concentrations in Sediment Pore Water. Archives of Environmental Contamination and
Toxicology 35: 8-13.
References to the studies cited in this work plan are for background and context only. Approval
of this work plan does not constitute endorsement of, or agreement with, the methods, analysis,
or conclusions of any study cited herein.
8.0 Costs:
The Parties acknowledge that this budget is an estimate, and that actual costs may prove to be
higher due to a number of potential factors. As soon as factors are identified that may increase
the estimated cost, BP will be notified and a change order provided describing the nature and
cause for the increase cost in addition to a revised budget for BP’s consideration and review.
The project costs indicated in Budget Chart 1 below are to be submitted by Trustees for
reimbursement by BP. The Vessel Costs indicated in Budget Chart 2 shall be paid directly by
BP.
5/20/2011 – Deepwater Sediment Sampling Page 20
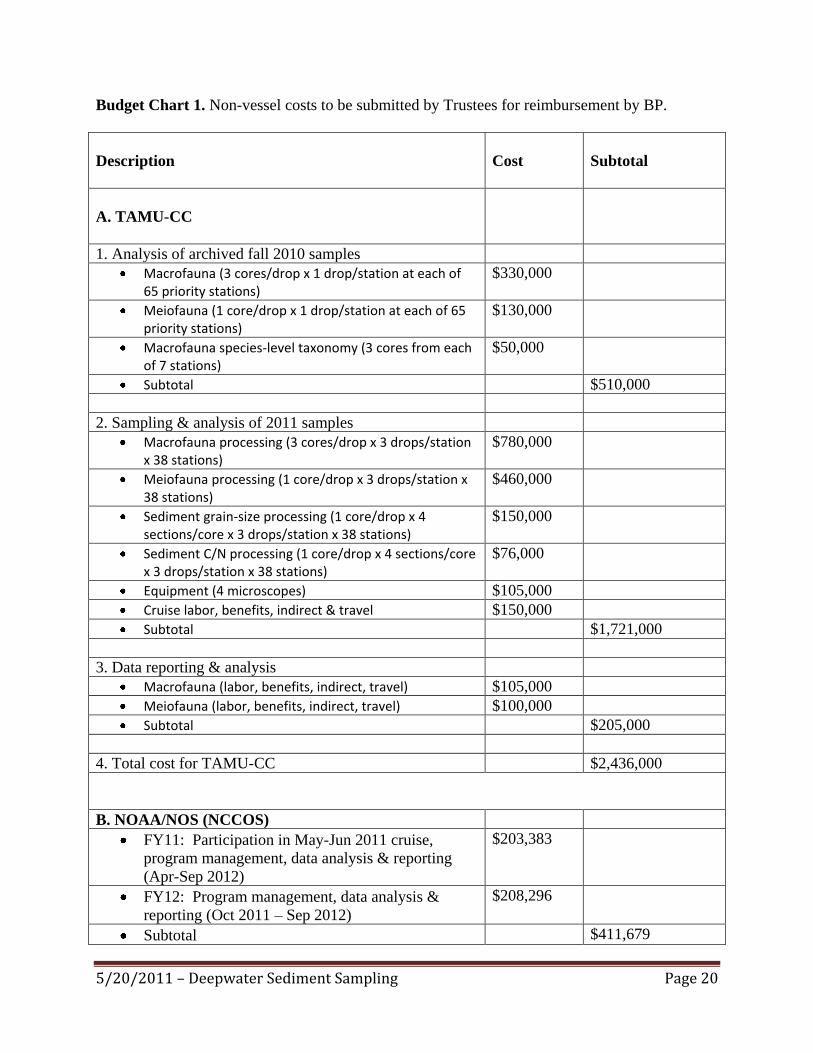
Budget Chart 1. Non-vessel costs to be submitted by Trustees for reimbursement by BP.
Description
Cost
Subtotal
A. TAMU-CC
1. Analysis of archived fall 2010 samples
Macrofauna (3 cores/drop x 1 drop/station at each of 65 priority stations)
$330,000
Meiofauna (1 core/drop x 1 drop/station at each of 65 priority stations)
$130,000
Macrofauna species-level taxonomy (3 cores from each of 7 stations)
$50,000
Subtotal $510,000
2. Sampling & analysis of 2011 samples
Macrofauna processing (3 cores/drop x 3 drops/station x 38 stations)
$780,000
Meiofauna processing (1 core/drop x 3 drops/station x 38 stations)
$460,000
Sediment grain-size processing (1 core/drop x 4 sections/core x 3 drops/station x 38 stations)
$150,000
Sediment C/N processing (1 core/drop x 4 sections/core x 3 drops/station x 38 stations)
$76,000
Equipment (4 microscopes) $105,000
Cruise labor, benefits, indirect & travel $150,000
Subtotal $1,721,000
3. Data reporting & analysis
Macrofauna (labor, benefits, indirect, travel) $105,000
Meiofauna (labor, benefits, indirect, travel) $100,000
Subtotal $205,000
4. Total cost for TAMU-CC $2,436,000
B. NOAA/NOS (NCCOS)
FY11: Participation in May-Jun 2011 cruise,
program management, data analysis & reporting
(Apr-Sep 2012)
$203,383
FY12: Program management, data analysis &
reporting (Oct 2011 – Sep 2012)
$208,296
Subtotal $411,679
5/20/2011 – Deepwater Sediment Sampling Page 21
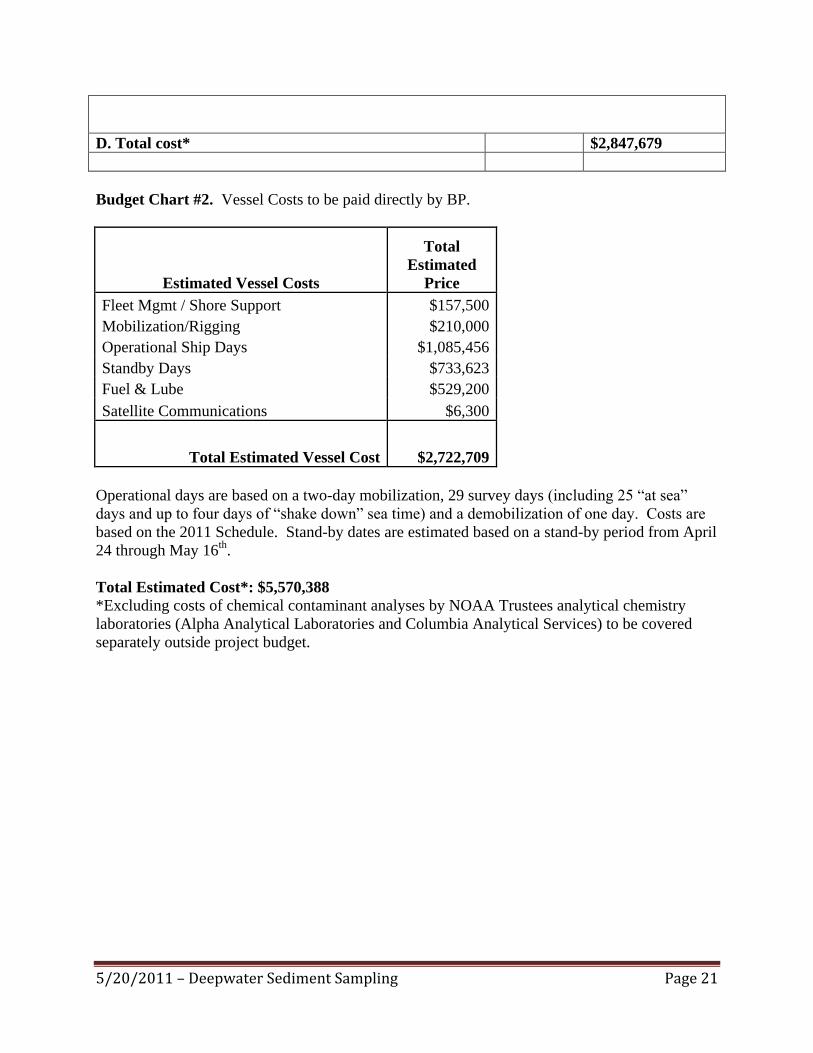
D. Total cost* $2,847,679
Budget Chart #2. Vessel Costs to be paid directly by BP.
Estimated Vessel Costs
Total
Estimated
Price
Fleet Mgmt / Shore Support $157,500
Mobilization/Rigging $210,000
Operational Ship Days $1,085,456
Standby Days $733,623
Fuel & Lube $529,200
Satellite Communications $6,300
Total Estimated Vessel Cost $2,722,709
Operational days are based on a two-day mobilization, 29 survey days (including 25 ―at sea‖
days and up to four days of ―shake down‖ sea time) and a demobilization of one day. Costs are
based on the 2011 Schedule. Stand-by dates are estimated based on a stand-by period from April
24 through May 16th
.
Total Estimated Cost*: $5,570,388
*Excluding costs of chemical contaminant analyses by NOAA Trustees analytical chemistry
laboratories (Alpha Analytical Laboratories and Columbia Analytical Services) to be covered
separately outside project budget.
5/20/2011 – Deepwater Sediment Sampling Page 22
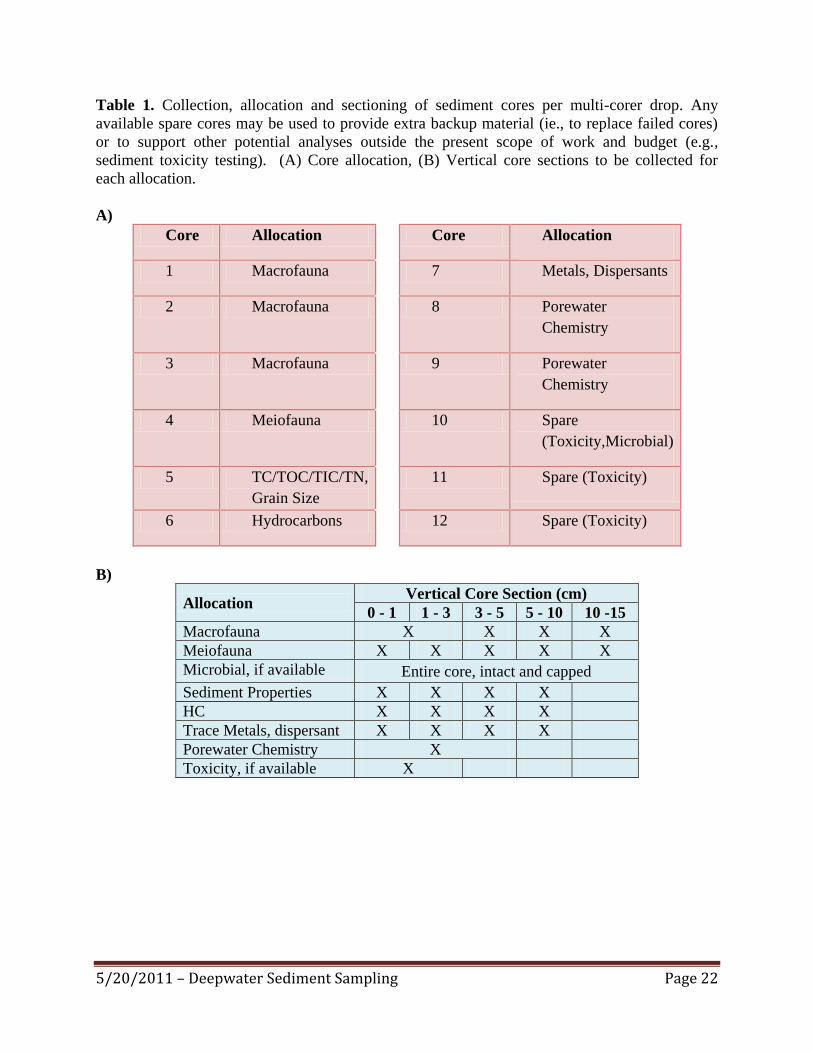
Table 1. Collection, allocation and sectioning of sediment cores per multi-corer drop. Any
available spare cores may be used to provide extra backup material (ie., to replace failed cores)
or to support other potential analyses outside the present scope of work and budget (e.g.,
sediment toxicity testing). (A) Core allocation, (B) Vertical core sections to be collected for
each allocation.
A)
Core Allocation Core Allocation
1 Macrofauna 7 Metals, Dispersants
2 Macrofauna 8 Porewater
Chemistry
3 Macrofauna 9 Porewater
Chemistry
4 Meiofauna 10 Spare
(Toxicity,Microbial)
5 TC/TOC/TIC/TN,
Grain Size
11 Spare (Toxicity)
6 Hydrocarbons 12 Spare (Toxicity)
B)
Allocation Vertical Core Section (cm)
0 - 1 1 - 3 3 - 5 5 - 10 10 -15
Macrofauna X X X X
Meiofauna X X X X X
Microbial, if available Entire core, intact and capped
Sediment Properties X X X X
HC X X X X
Trace Metals, dispersant X X X X
Porewater Chemistry X
Toxicity, if available X
5/20/2011 – Deepwater Sediment Sampling Page 23
Figure 1. Potential pathways for oil to reach offshore and deepwater sediments (from UAC
Implementation Plan for Subsurface Monitoring, 13 November 2010).
5/20/2011 – Deepwater Sediment Sampling Page 24
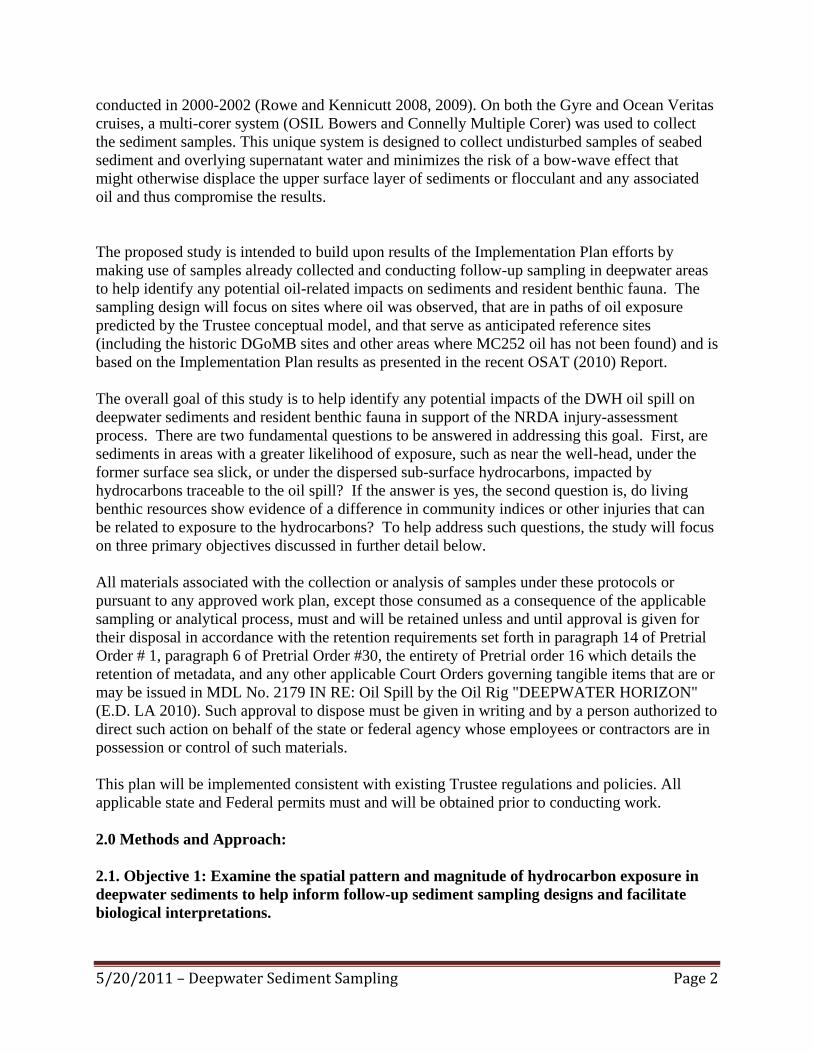
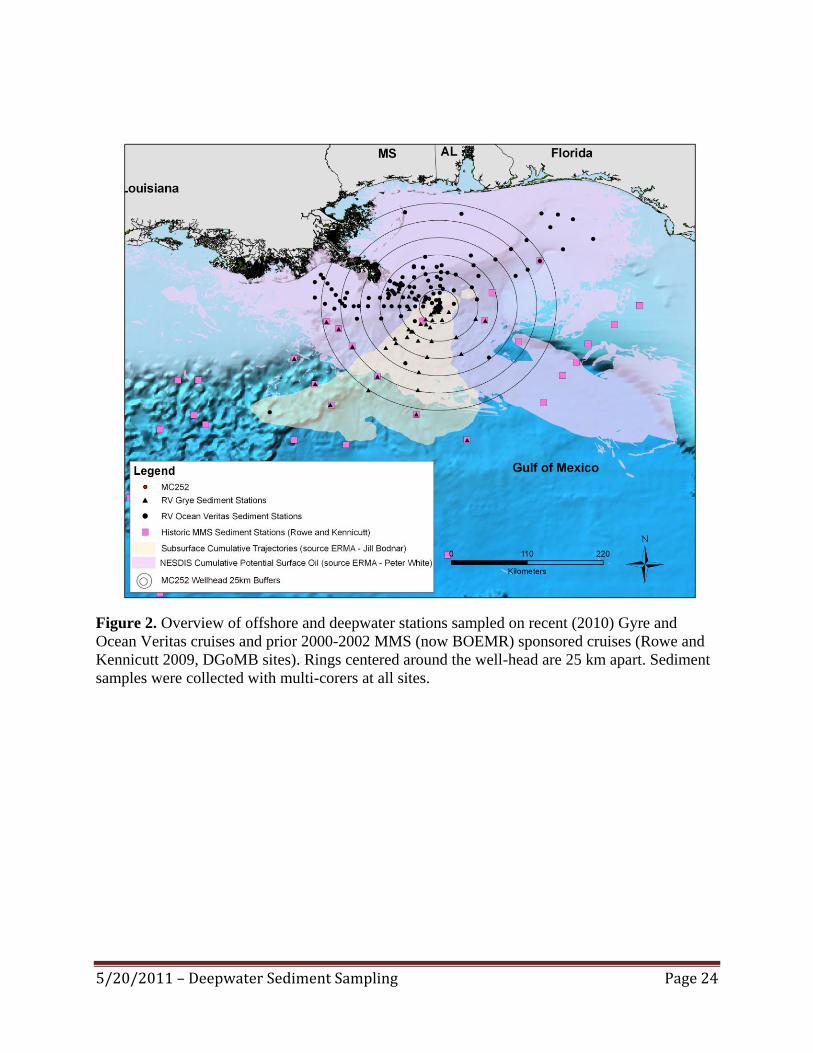
Figure 2. Overview of offshore and deepwater stations sampled on recent (2010) Gyre and
Ocean Veritas cruises and prior 2000-2002 MMS (now BOEMR) sponsored cruises (Rowe and
Kennicutt 2009, DGoMB sites). Rings centered around the well-head are 25 km apart. Sediment
samples were collected with multi-corers at all sites.
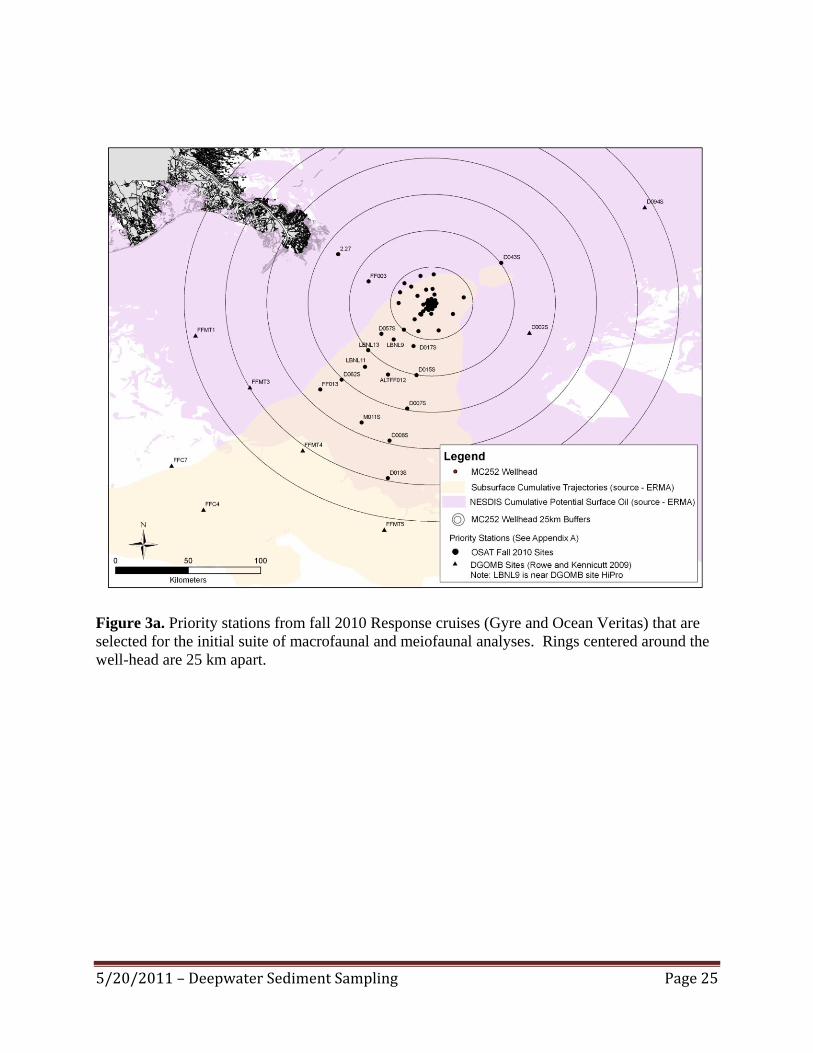
5/20/2011 – Deepwater Sediment Sampling Page 25
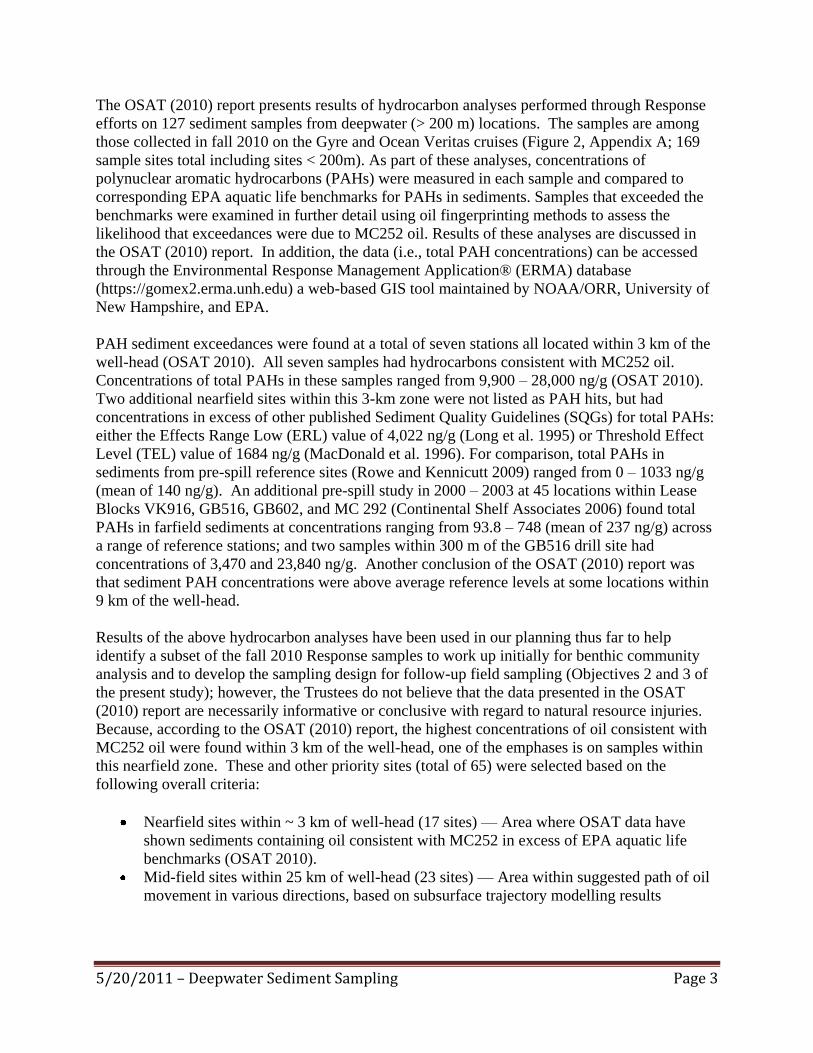
Figure 3a. Priority stations from fall 2010 Response cruises (Gyre and Ocean Veritas) that are
selected for the initial suite of macrofaunal and meiofaunal analyses. Rings centered around the
well-head are 25 km apart.
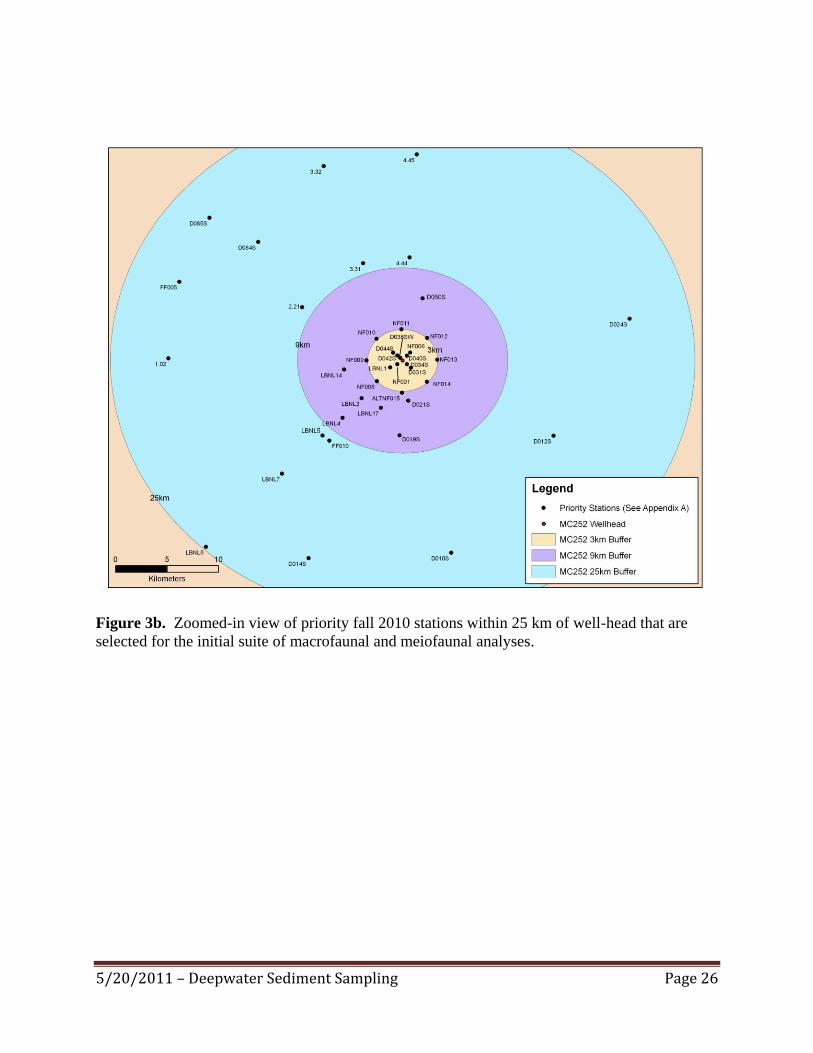
5/20/2011 – Deepwater Sediment Sampling Page 26
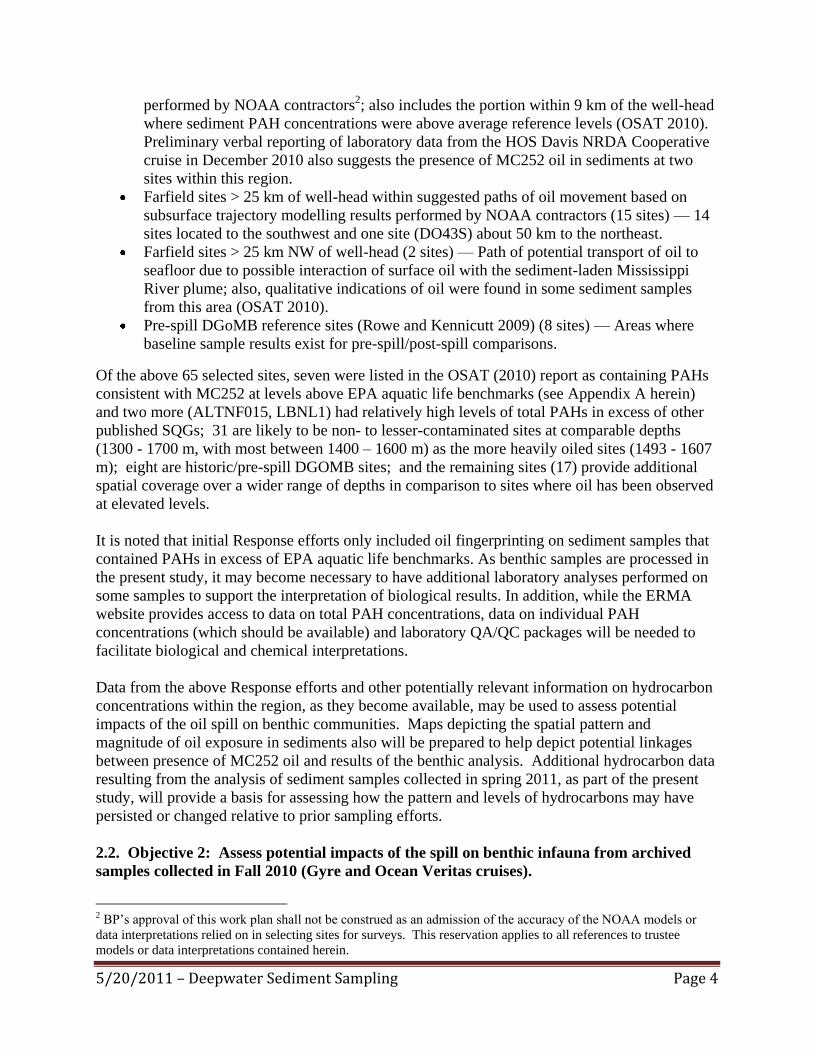
Figure 3b. Zoomed-in view of priority fall 2010 stations within 25 km of well-head that are
selected for the initial suite of macrofaunal and meiofaunal analyses.
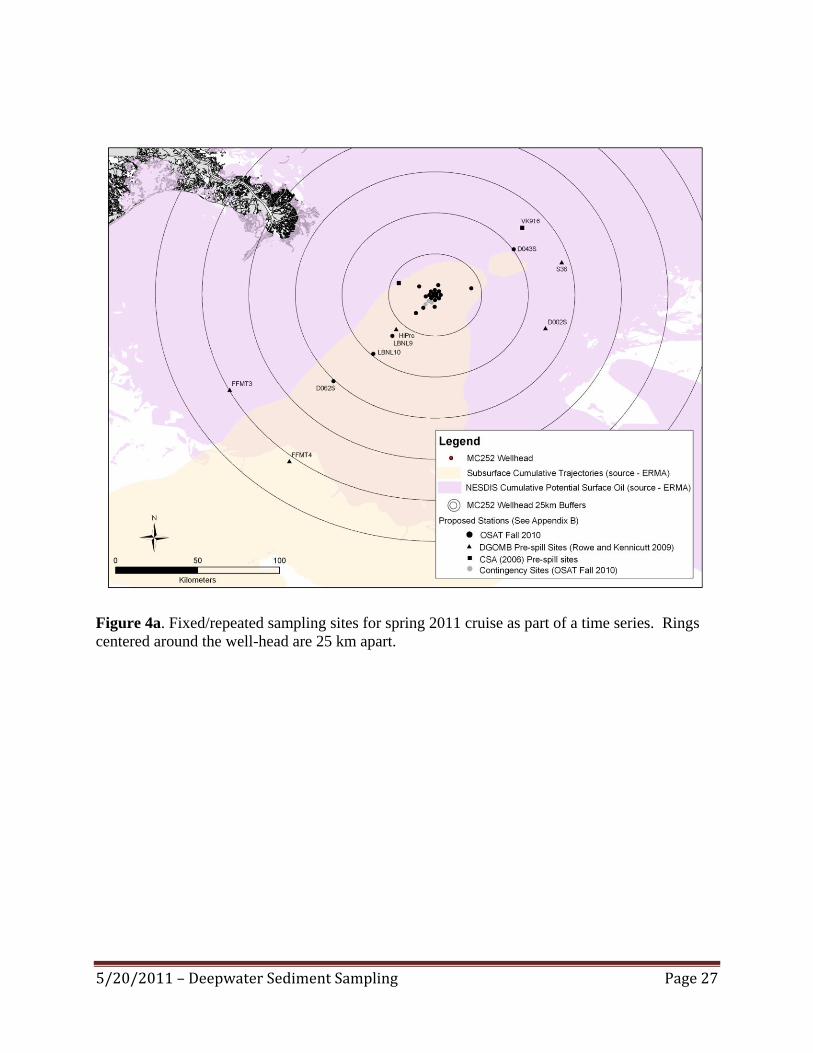
5/20/2011 – Deepwater Sediment Sampling Page 27
Figure 4a. Fixed/repeated sampling sites for spring 2011 cruise as part of a time series. Rings
centered around the well-head are 25 km apart.
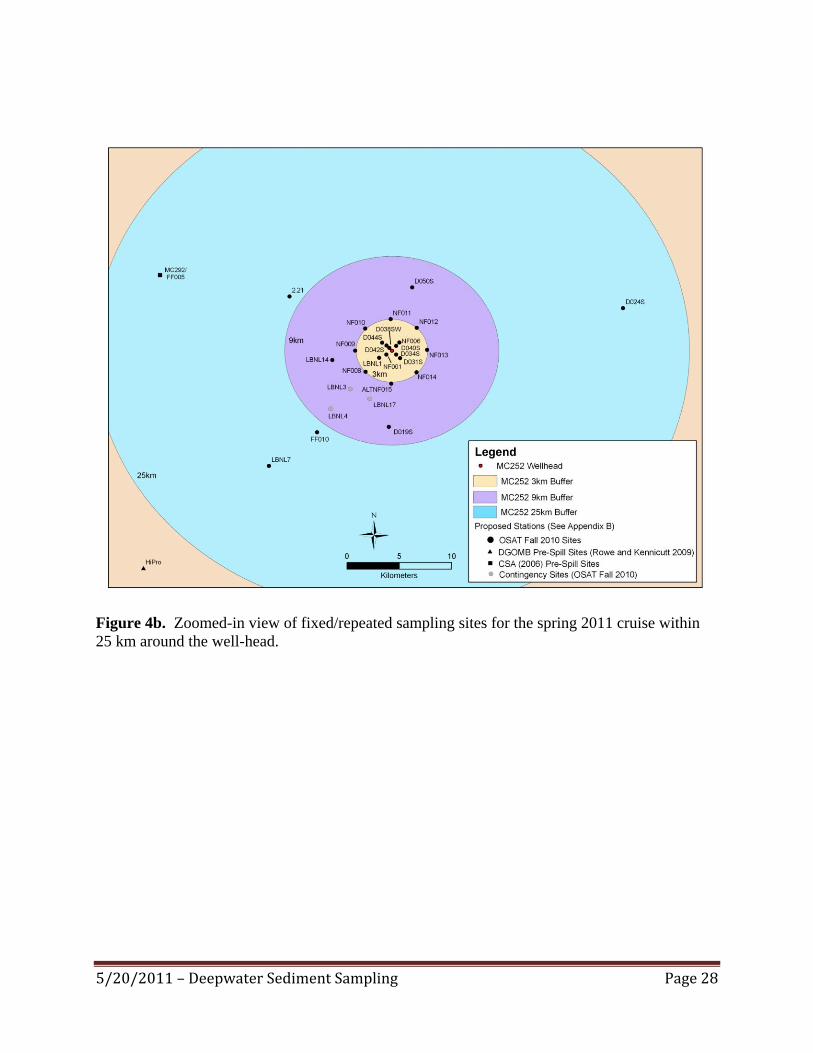
5/20/2011 – Deepwater Sediment Sampling Page 28
Figure 4b. Zoomed-in view of fixed/repeated sampling sites for the spring 2011 cruise within
25 km around the well-head.
5/20/2011 – Deepwater Sediment Sampling Page 29
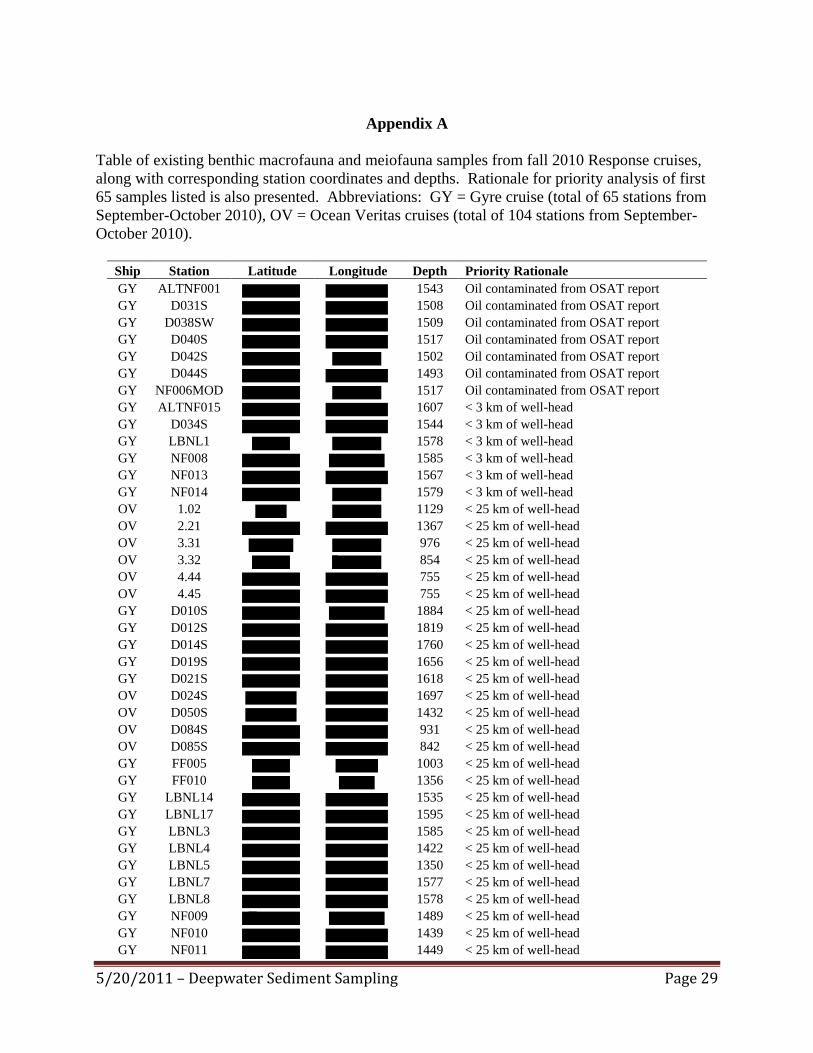
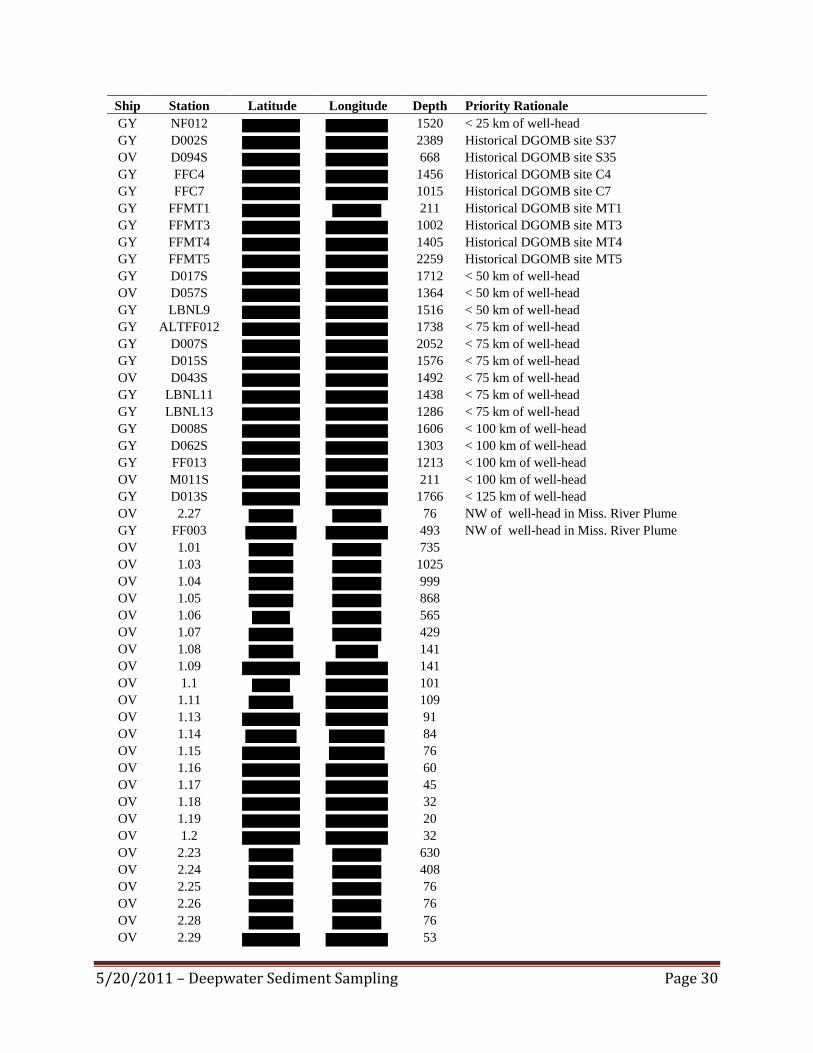
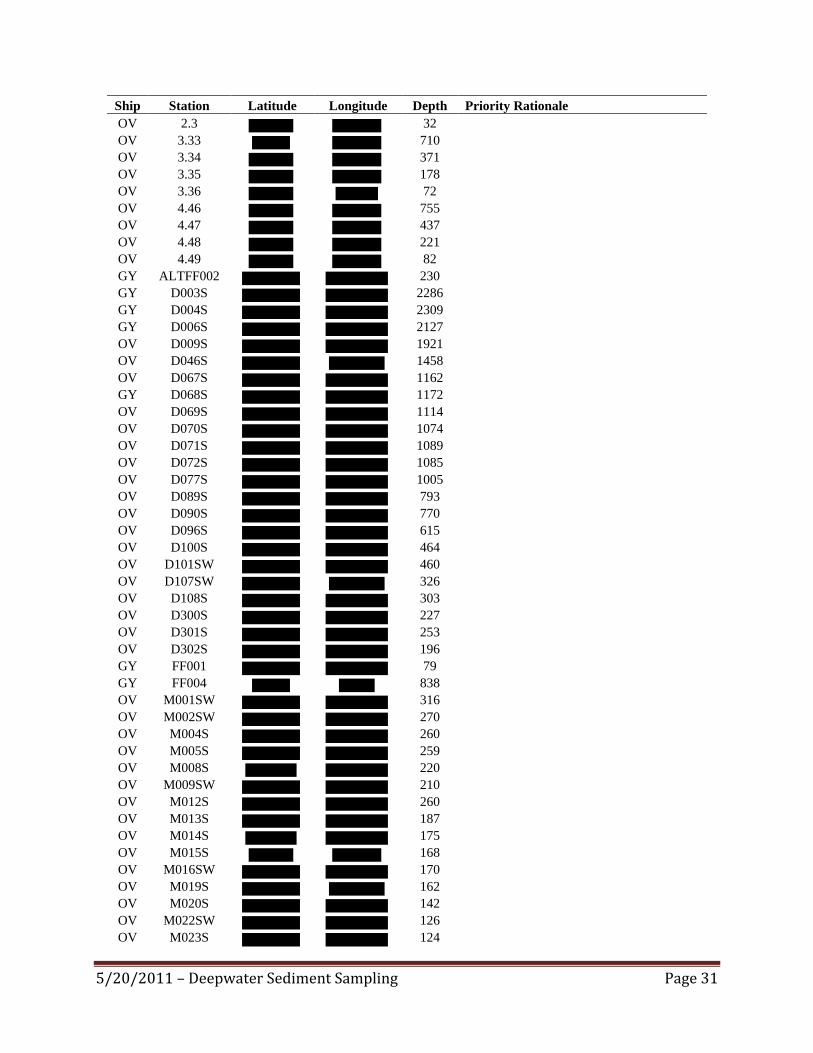
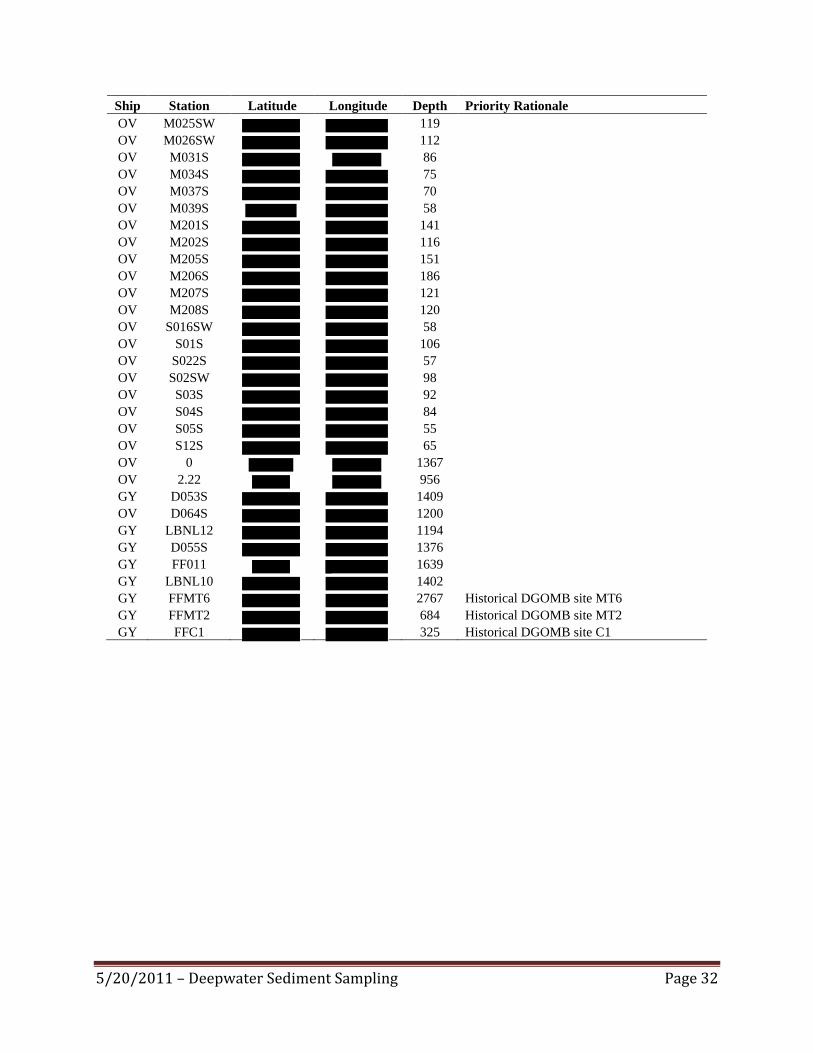
Appendix A
Table of existing benthic macrofauna and meiofauna samples from fall 2010 Response cruises,
along with corresponding station coordinates and depths. Rationale for priority analysis of first
65 samples listed is also presented. Abbreviations: GY = Gyre cruise (total of 65 stations from
September-October 2010), OV = Ocean Veritas cruises (total of 104 stations from September-
October 2010).
Ship Station Latitude Longitude Depth Priority Rationale
GY ALTNF001 1543 Oil contaminated from OSAT report
GY D031S 1508 Oil contaminated from OSAT report
GY D038SW 1509 Oil contaminated from OSAT report
GY D040S 1517 Oil contaminated from OSAT report
GY D042S 1502 Oil contaminated from OSAT report
GY D044S 1493 Oil contaminated from OSAT report
GY NF006MOD 1517 Oil contaminated from OSAT report
GY ALTNF015 1607 < 3 km of well-head
GY D034S 1544 < 3 km of well-head
GY LBNL1 1578 < 3 km of well-head
GY NF008 1585 < 3 km of well-head
GY NF013 1567 < 3 km of well-head
GY NF014 1579 < 3 km of well-head
OV 1.02 1129 < 25 km of well-head
OV 2.21 1367 < 25 km of well-head
OV 3.31 976 < 25 km of well-head
OV 3.32 854 < 25 km of well-head
OV 4.44 755 < 25 km of well-head
OV 4.45 755 < 25 km of well-head
GY D010S 1884 < 25 km of well-head
GY D012S 1819 < 25 km of well-head
GY D014S 1760 < 25 km of well-head
GY D019S 1656 < 25 km of well-head
GY D021S 1618 < 25 km of well-head
OV D024S 1697 < 25 km of well-head
OV D050S 1432 < 25 km of well-head
OV D084S 931 < 25 km of well-head
OV D085S 842 < 25 km of well-head
GY FF005 1003 < 25 km of well-head
GY FF010 1356 < 25 km of well-head
GY LBNL14 1535 < 25 km of well-head
GY LBNL17 1595 < 25 km of well-head
GY LBNL3 1585 < 25 km of well-head
GY LBNL4 1422 < 25 km of well-head
GY LBNL5 1350 < 25 km of well-head
GY LBNL7 1577 < 25 km of well-head
GY LBNL8 1578 < 25 km of well-head
GY NF009 1489 < 25 km of well-head
GY NF010 1439 < 25 km of well-head
GY NF011 1449 < 25 km of well-head
5/20/2011 – Deepwater Sediment Sampling Page 30
Ship Station Latitude Longitude Depth Priority Rationale
GY NF012 1520 < 25 km of well-head
GY D002S 2389 Historical DGOMB site S37
OV D094S 668 Historical DGOMB site S35
GY FFC4 1456 Historical DGOMB site C4
GY FFC7 1015 Historical DGOMB site C7
GY FFMT1 211 Historical DGOMB site MT1
GY FFMT3 1002 Historical DGOMB site MT3
GY FFMT4 1405 Historical DGOMB site MT4
GY FFMT5 2259 Historical DGOMB site MT5
GY D017S 1712 < 50 km of well-head
OV D057S 1364 < 50 km of well-head
GY LBNL9 1516 < 50 km of well-head
GY ALTFF012 1738 < 75 km of well-head
GY D007S 2052 < 75 km of well-head
GY D015S 1576 < 75 km of well-head
OV D043S 1492 < 75 km of well-head
GY LBNL11 1438 < 75 km of well-head
GY LBNL13 1286 < 75 km of well-head
GY D008S 1606 < 100 km of well-head
GY D062S 1303 < 100 km of well-head
GY FF013 1213 < 100 km of well-head
OV M011S 211 < 100 km of well-head
GY D013S 1766 < 125 km of well-head
OV 2.27 76 NW of well-head in Miss. River Plume
GY FF003 493 NW of well-head in Miss. River Plume
OV 1.01 735
OV 1.03 1025
OV 1.04 999
OV 1.05 868
OV 1.06 565
OV 1.07 429
OV 1.08 141
OV 1.09 141
OV 1.1 101
OV 1.11 109
OV 1.13 91
OV 1.14 84
OV 1.15 76
OV 1.16 60
OV 1.17 45
OV 1.18 32
OV 1.19 20
OV 1.2 32
OV 2.23 630
OV 2.24 408
OV 2.25 76
OV 2.26 76
OV 2.28 76
OV 2.29 53
5/20/2011 – Deepwater Sediment Sampling Page 31
Ship Station Latitude Longitude Depth Priority Rationale
OV 2.3 32
OV 3.33 710
OV 3.34 371
OV 3.35 178
OV 3.36 72
OV 4.46 755
OV 4.47 437
OV 4.48 221
OV 4.49 82
GY ALTFF002 230
GY D003S 2286
GY D004S 2309
GY D006S 2127
OV D009S 1921
OV D046S 1458
OV D067S 1162
GY D068S 1172
OV D069S 1114
OV D070S 1074
OV D071S 1089
OV D072S 1085
OV D077S 1005
OV D089S 793
OV D090S 770
OV D096S 615
OV D100S 464
OV D101SW 460
OV D107SW 326
OV D108S 303
OV D300S 227
OV D301S 253
OV D302S 196
GY FF001 79
GY FF004 838
OV M001SW 316
OV M002SW 270
OV M004S 260
OV M005S 259
OV M008S 220
OV M009SW 210
OV M012S 260
OV M013S 187
OV M014S 175
OV M015S 168
OV M016SW 170
OV M019S 162
OV M020S 142
OV M022SW 126
OV M023S 124
5/20/2011 – Deepwater Sediment Sampling Page 32
Ship Station Latitude Longitude Depth Priority Rationale
OV M025SW 119
OV M026SW 112
OV M031S 86
OV M034S 75
OV M037S 70
OV M039S 58
OV M201S 141
OV M202S 116
OV M205S 151
OV M206S 186
OV M207S 121
OV M208S 120
OV S016SW 58
OV S01S 106
OV S022S 57
OV S02SW 98
OV S03S 92
OV S04S 84
OV S05S 55
OV S12S 65
OV 0 1367
OV 2.22 956
GY D053S 1409
OV D064S 1200
GY LBNL12 1194
GY D055S 1376
GY FF011 1639
GY LBNL10 1402
GY FFMT6 2767 Historical DGOMB site MT6
GY FFMT2 684 Historical DGOMB site MT2
GY FFC1 325 Historical DGOMB site C1
5/20/2011 – Deepwater Sediment Sampling Page 33
Appendix B
Table of 38 sampling stations from the fall 2010 Response cruises to serve as proposed fixed
sites for repeated sampling in spring 2011.
Station Latitude Longitude Depth Rationale
ALTNF001 1543 Oil contaminated from OSAT report
D031S 1508 Oil contaminated from OSAT report
D038SW 1509 Oil contaminated from OSAT report
D040S 1517 Oil contaminated from OSAT report
D042S 1502 Oil contaminated from OSAT report
D044S 1493 Oil contaminated from OSAT report
NF006MOD 1517 Oil contaminated from OSAT report
ALTNF015 1607 Within ~3 km of well-head
D034S 1544 Within ~3 km of well-head
LBNL1 1578 Within ~3 km of well-head
NF008 1585 Within ~3 km of well-head
NF013 1567 Within ~3 km of well-head
NF014 1579 Within ~3 km of well-head
NF009 1489 Within ~3 km of well-head
NF010 1439 Within ~3 km of well-head
NF011 1449 Within ~3 km of well-head
NF012 1520 Within ~3 km of well-head
FF010 1356 < 25 km of well-head
2.21 1367 < 25 km of well-head
D019S 1656 < 25 km of well-head
D024S 1697 < 25 km of well-head
LBNL14 1535 < 25 km of well-head
LBNL7 1577 < 25 km of well-head
D050S 1432 < 25 km of well-head
LBNL9 1516 < 50 km of well-head
LBNL10 1402 < 50 km of well-head
D043S 1492 < 75 km of well-head
D062S 1303 < 100 km of well-head
FFMT3 1002 Historical DGOMB site MT3
FFMT4 1405 Historical DGOMB site MT4
D002S 2389 Historical DGOMB site S37
HIPRO 1574 Historical DGOMB site HiPro
S36 1826 Historical DGOMB site S36
FF005 1003 CSA (2006) Site MC292, <25 km of well-head
VK916 1125 CSA (2006) Site VK916
LBNL17 1595 3-9 km SW of well-head
LBNL3 1585 3-9 km SW of well-head
LBNL4 1422 3-9 km SW of well-head
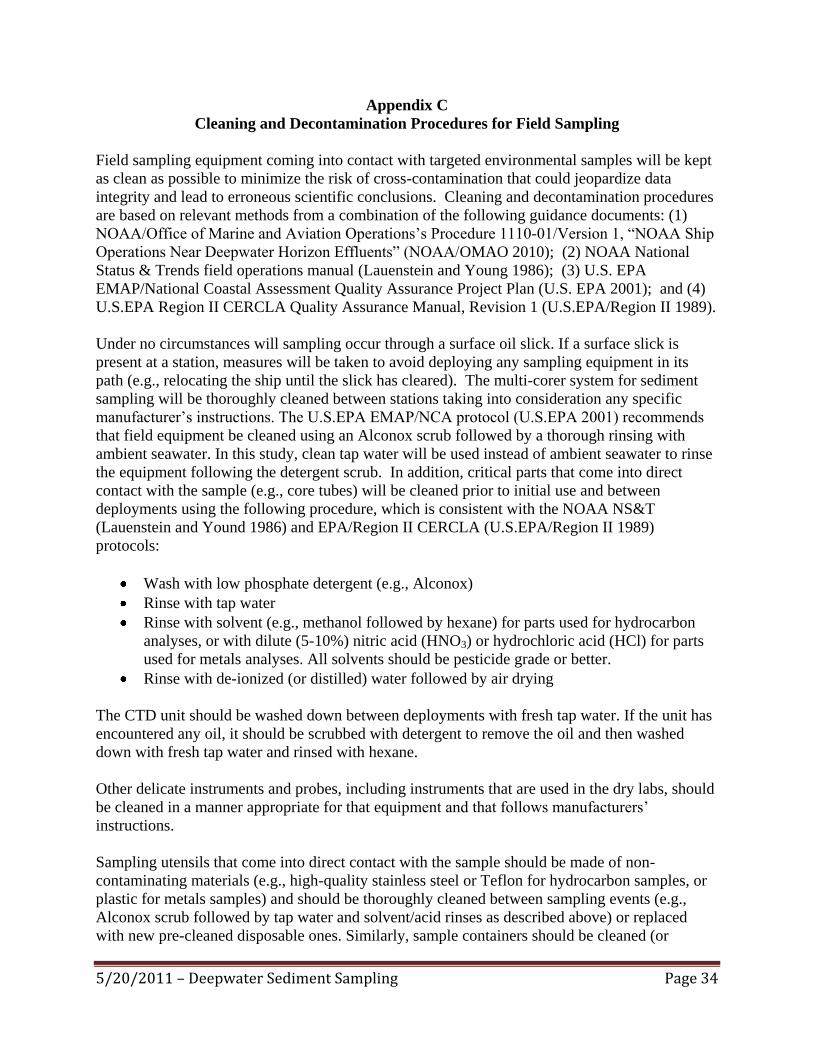
5/20/2011 – Deepwater Sediment Sampling Page 34
Appendix C
Cleaning and Decontamination Procedures for Field Sampling
Field sampling equipment coming into contact with targeted environmental samples will be kept
as clean as possible to minimize the risk of cross-contamination that could jeopardize data
integrity and lead to erroneous scientific conclusions. Cleaning and decontamination procedures
are based on relevant methods from a combination of the following guidance documents: (1)
NOAA/Office of Marine and Aviation Operations’s Procedure 1110-01/Version 1, ―NOAA Ship
Operations Near Deepwater Horizon Effluents‖ (NOAA/OMAO 2010); (2) NOAA National
Status & Trends field operations manual (Lauenstein and Young 1986); (3) U.S. EPA
EMAP/National Coastal Assessment Quality Assurance Project Plan (U.S. EPA 2001); and (4)
U.S.EPA Region II CERCLA Quality Assurance Manual, Revision 1 (U.S.EPA/Region II 1989).
Under no circumstances will sampling occur through a surface oil slick. If a surface slick is
present at a station, measures will be taken to avoid deploying any sampling equipment in its
path (e.g., relocating the ship until the slick has cleared). The multi-corer system for sediment
sampling will be thoroughly cleaned between stations taking into consideration any specific
manufacturer’s instructions. The U.S.EPA EMAP/NCA protocol (U.S.EPA 2001) recommends
that field equipment be cleaned using an Alconox scrub followed by a thorough rinsing with
ambient seawater. In this study, clean tap water will be used instead of ambient seawater to rinse
the equipment following the detergent scrub. In addition, critical parts that come into direct
contact with the sample (e.g., core tubes) will be cleaned prior to initial use and between
deployments using the following procedure, which is consistent with the NOAA NS&T
(Lauenstein and Yound 1986) and EPA/Region II CERCLA (U.S.EPA/Region II 1989)
protocols:
Wash with low phosphate detergent (e.g., Alconox)
Rinse with tap water
Rinse with solvent (e.g., methanol followed by hexane) for parts used for hydrocarbon
analyses, or with dilute (5-10%) nitric acid (HNO3) or hydrochloric acid (HCl) for parts
used for metals analyses. All solvents should be pesticide grade or better.
Rinse with de-ionized (or distilled) water followed by air drying
The CTD unit should be washed down between deployments with fresh tap water. If the unit has
encountered any oil, it should be scrubbed with detergent to remove the oil and then washed
down with fresh tap water and rinsed with hexane.
Other delicate instruments and probes, including instruments that are used in the dry labs, should
be cleaned in a manner appropriate for that equipment and that follows manufacturers’
instructions.
Sampling utensils that come into direct contact with the sample should be made of non-
contaminating materials (e.g., high-quality stainless steel or Teflon for hydrocarbon samples, or
plastic for metals samples) and should be thoroughly cleaned between sampling events (e.g.,
Alconox scrub followed by tap water and solvent/acid rinses as described above) or replaced
with new pre-cleaned disposable ones. Similarly, sample containers should be cleaned (or
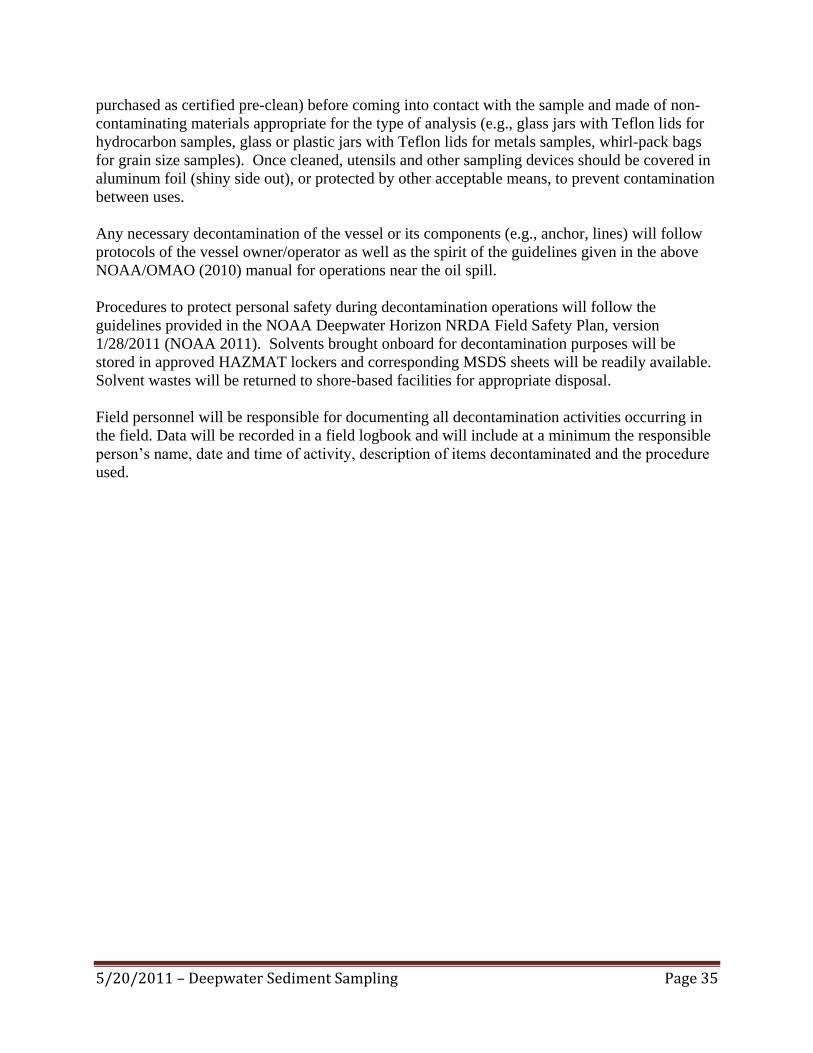
5/20/2011 – Deepwater Sediment Sampling Page 35
purchased as certified pre-clean) before coming into contact with the sample and made of non-
contaminating materials appropriate for the type of analysis (e.g., glass jars with Teflon lids for
hydrocarbon samples, glass or plastic jars with Teflon lids for metals samples, whirl-pack bags
for grain size samples). Once cleaned, utensils and other sampling devices should be covered in
aluminum foil (shiny side out), or protected by other acceptable means, to prevent contamination
between uses.
Any necessary decontamination of the vessel or its components (e.g., anchor, lines) will follow
protocols of the vessel owner/operator as well as the spirit of the guidelines given in the above
NOAA/OMAO (2010) manual for operations near the oil spill.
Procedures to protect personal safety during decontamination operations will follow the
guidelines provided in the NOAA Deepwater Horizon NRDA Field Safety Plan, version
1/28/2011 (NOAA 2011). Solvents brought onboard for decontamination purposes will be
stored in approved HAZMAT lockers and corresponding MSDS sheets will be readily available.
Solvent wastes will be returned to shore-based facilities for appropriate disposal.
Field personnel will be responsible for documenting all decontamination activities occurring in
the field. Data will be recorded in a field logbook and will include at a minimum the responsible
person’s name, date and time of activity, description of items decontaminated and the procedure
used.
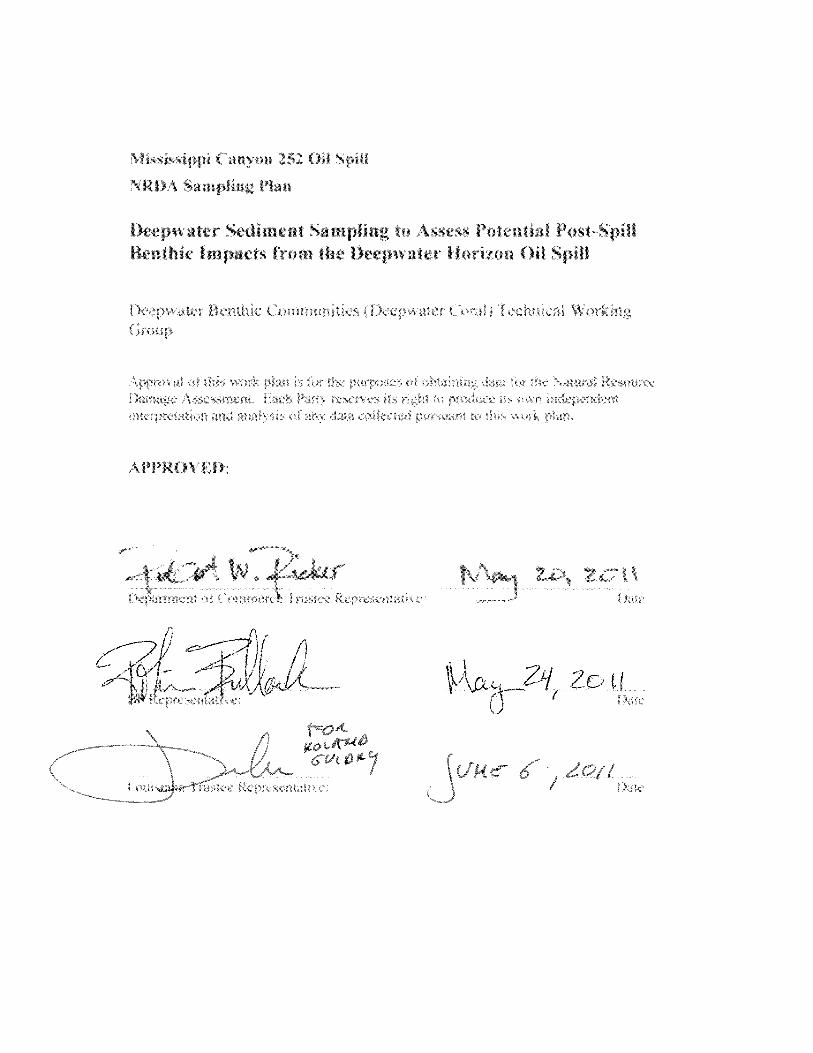
Slt%%1%%IpI ( anvon 252 (hI Spill
%kI) Sampling Plan
Deeps ater Sediment Sampling to \ssess Potential PostSpillBenthic Impacts from the l)eepstater llonion Oil Spill
IXr p Jici flnihc ( V 111 ; I1IILR% t I )ctpV IICI ( a ; I at Ha ii \\ ørkma4 414)111’
1 sø Fr’
I)r. r 4)h. I I rc9’ ci 9 1) Pd 91) F
P p PC
\ 14%
14 PiCa
r ‘ C . cc
lcpe dc’P Cl
PPRO ED:
Vw.fraui$’rrr iCri ‘I 9131 94Cc 1’ p ‘rI
tcotgotA14ô
Za, 2Ct’Pt
N‘(cc I cr4
2c LIP
2011/
Recommended