NASA Contractor Report 198459
/
Studies of Two-Phase Flow Dynamics and HeatTransfer at Reduced Gravity Conditions
Larry C. WiRe, W. Scott Bousman, and Larry B. ForeUniversity of HoustonHouston, Texas 77204
February 1996
Prepared forLewis Research Center
Under Grant NAG3-510
National Aeronautics and
Space Administration
https://ntrs.nasa.gov/search.jsp?R=19960015900 2018-05-17T07:53:04+00:00Z

STUDIES OF TWO-PHASE FLOWDYNAMICS AND HEAT TRANSFER
AT REDUCED GRAVITY CONDITIONS
NASA GrantNAG3-510
UH Account 1-5-54360
Final Report
Larry C. WitteProfessor of Mechanical Engineering
Principal Investigator
W. Scott BousmanResearch Assistant
Larry B. ForePost-Doctoral Fellow
Dept. of Chemical Engineering
UNIVERSITY OF HOUSTON
Houston, TX77204-4792
%
STUDIES OF TWO-PHASE FLOWDYNAMICS AND HEAT TRANSFER
AT REDUCED GRAVITY CONDITIONS
INTRODUCTION ........................................................................................................... 1
EXPERIMENTAL APPARATUS .................................................................................. 2
Flow Loops .......................................................................................................... 2Flow Dynamics Test Section ............................................................................... 2Heat Transfer Test Section .................................................................................. 5
FLOW DYNAMICS ....................................................................................................... 7
Flow Pattern Mapping ......................................................................................... 9Void Fraction Flow Pattern Transition Models ................................................... 13Weber Number-Based Flow Pattern Transition Models ..................................... 15
SUMMARY OF lw_OW DYNAMICS RESEARCH ...................................................... 17
HEAT TRANSFER ......................................................................................................... 17
Annular Flow ....................................................................................................... 17Calculation of Heat Transfer Coefficients .............................................. 17Correlation of Heat Transfer ................................................................... 19Pressure Gradient and Film Thickness .................................................... 20
Slug Flow ............................................................................................................ 22Data Reduction ........................................................................................ 22Pressure Gradient Correlation ................................................................. 23Correlation of Heat Transfer ................................................................... 24
SUMMARY OF HEAT TRANSFER RESEARCH ....................................................... 26
REFERENCES ................................................................................................................ 27
NOMENCLATURE ........................................................................................................ 28
APPENDIX I. PUBLICATIONS RESULTING FROM GRANT ................................. 30
APPENDIX II. DATA SUMMARY FORHEAT TRANSFER EXPERIMENTS ....... 3 i
STUDIES OF TWO-PHASE FLOWDYNAMICS AND HEAT TRANSFER
AT REDUCED GRAVITY CONDITIONS
INTRODUCTION
Gas-liquid mixtures occur in a number of situations relevant to on-going and planned
space operations. Some examples are the incidental boiling of cryogenic fluids,
evaporative heating/cooling systems and power generation systems. In these situations,
knowledge of the phase distribution is important for the design of piping systems,
separators and other associated units. The prediction of heat transfer characteristics is of
particular importance, since the design of such systems for space operations is inherently
limited by size constraints.
It was recognized some time ago that predictions of normal-gravity two-phase flows
could best be advanced with flow regime-dependent models rather than purely empirical
approaches. Following this reasoning, a number of studies have been performed to
identify the flow regimes that occur under reduced-gravity conditions and develop criteria
for inter-regime transitions (Dukler et al., 1988; Zhao and Rezkallah, 1993; Bousman and
Dulder, 1994). The three distinct regimes identified at reduced gravity are bubbly, slug
and annular, with transitions of bubbly-slug and slug-annular. Annular flow, where the
liquid flows as a thin film along the tube wall and as droplets in a gas/vapor core, occurs
over the widest range of gas and liquid flow rates. The largest frictional pressure
gradients and heat transfer coefficients occur in annular flow, further increasing the need
for good predictive methods.
Annular flows at small enough gravity levels are axisymmetric, much like vertical
annular upflows or downflows at earth-normal gravity, in that the liquid film is
distributed evenly about the perimeter of the tube. At gas velocities just above the slug-
annular transition under reduced gravity, conditions exist which are much unlike those
• exhibited at nori'nal-gravity. For example, the liquid film cari be significantly thicker than
possible under the influence of gravity. As the gas velocity is increased and the film
becomes thinner, the influence of acceleration on the hydrodynamics decreases relative to
shear and pressure forces. Likewise, any differences in heat transfer should decrease with
decreasing film thickness.
New experimental results for a 25.4-mm ID tube are reported for air-water, air-
water/glycerine mixtures and air-water/Zonyl mixtures. These results augment previous
results obtained for a 12.7-mm ID tube, and thus offer an opportunity to determine the
effectof tubediameter,aswell asviscosityandsurfacetensionvariationon flow patterns
in microgravity.This report also presentsnew heat transfer, pressuredrop and film thickness
measurementsfor air-waterandair-50%aqueousglycerineannularflows in a 25.4mm
ID tubeat reducedgravity. Thehydrodynamicswerefully-developedupstreamof the 56-
cm-long heatedsectionin which localmeasurementsof theheattransfercoefficientwere
made. The pressuregradient,film thicknessandheattransfercoefficientsarecompared
to existing correlationsandnew relationsaredeveloped. AppendixA containsa list of
publicationsthathaveresultedfrom thisgrantto date.
EXPERIMENTAL APPARATUS
Short durations of reduced gravity, less than 1% of earth normal, are created aboard
NASA's Zero-G KC-135 and the Learjet 25 aircraft by a series of parabolic trajectories.
The aircraft climb and descend between altitutudes of 7.6 and 10.6 km. The data
presented here were obtained-during microgravity flights using a flow loop designed and
constructed at NASA Lewis Research Center and test sections designed and fabricated at
the University of Houston.
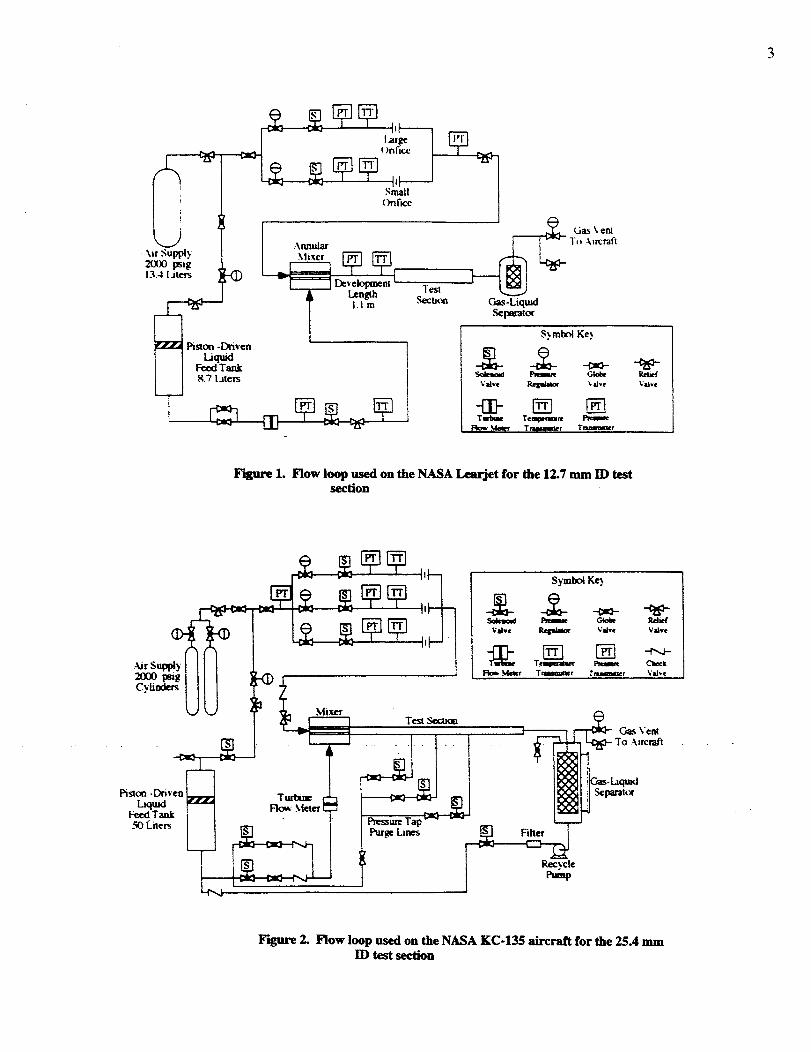
Flow Loops: Flow loops for the Learjet and KC-135 aircraft are shown
schematically in Figures 1 and 2. These flow loops were constructed to provide metered
quantities of gas and liquid to the test sections used in these studies (Bousman, 1995).
The gas flow rate was controlled with a critically-choked orifice to make the flow rate
independent of downstream pressure changes (McQuillen and Neumann, 1995). The
uncertainty in the gas superficial velocity measurement was estimated to be 8% over the
range investigated in these studies. A steady flow rate of liquid was provided by a
pressure-loaded piston in the liquid feed tank. The uncertainty in the liquid superficial
velocity measurement was estimated to be less than 10% over the experimental range.
The gas and liquid were combined in an annular mixer to produce a gas core surrounded
by a liquid film. The two-phase mixture passed through a flow development section prior
to entering the test section. At the exit of the test section, the mixture was separated over
screens by surface tension and the liquid was recovered for reuse while air was vented
into the cabin. Control of flow loop functions as well as data acquisition and storage is
accomplished with a dedicated computer in the flow loop rig.
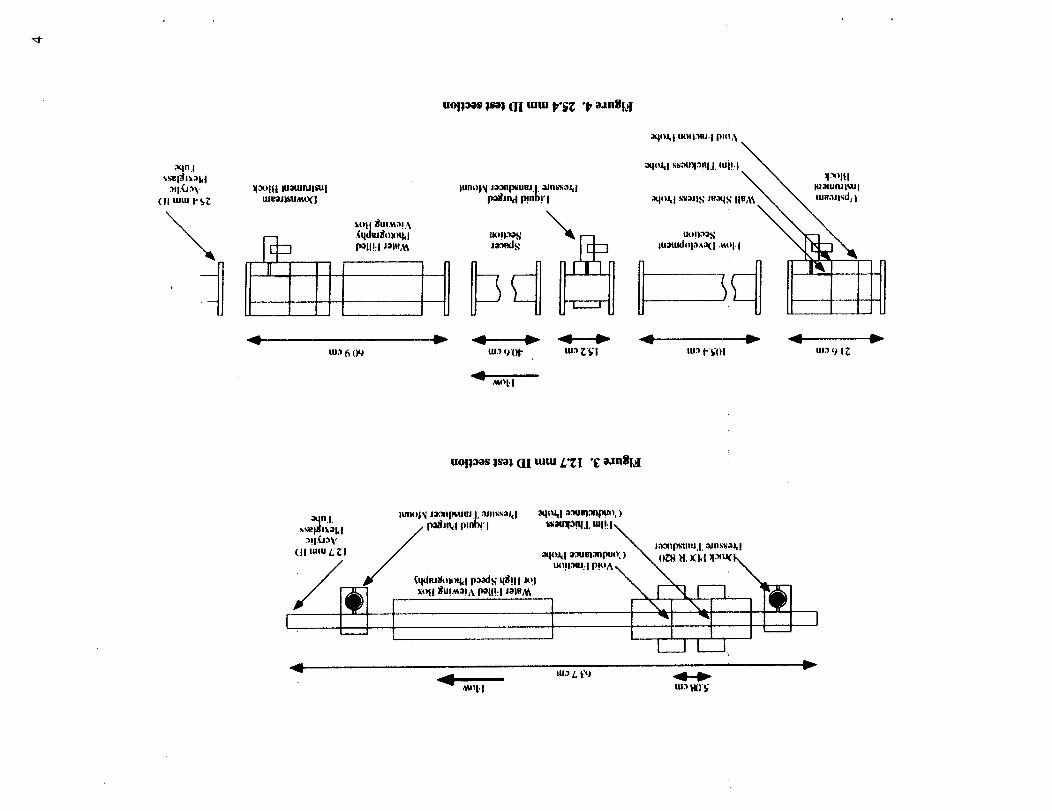
Flow Dynamics Test Section: A 12.7 mm ID test section (shown in Figure 3) for use
on the Learjet consisted of a smooth acrylic tube to which several probes were attached.
A 25.4 mm ID test section of similar construction (shown in Figure 4) was constructed
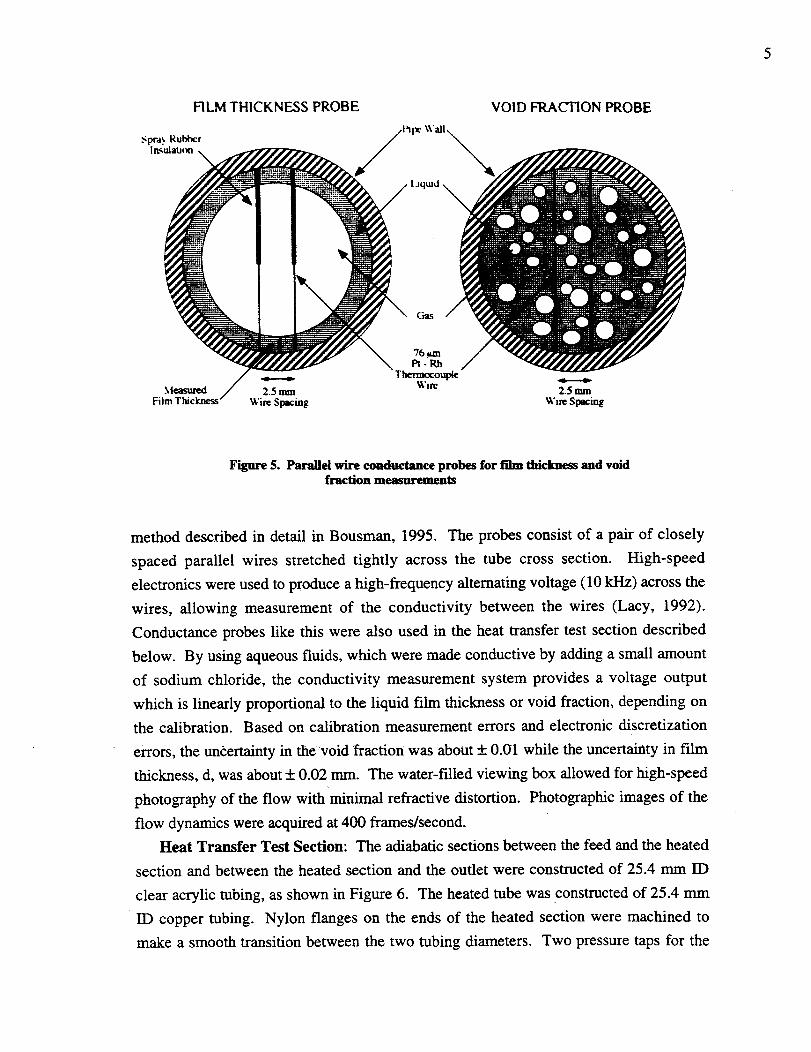
for use on the KC-135 aircraft. The liquid film thickness and void fraction conductivity
probes, shown in Figure 5, were based on the parallel wire conductance
Annular
20{)0 pslg13.4 liters
tar_ I
{ )nficc
Small(_nfx:e
TeslSecuoa
Separator
S._mboi Ke)
-tl]- [] []TIbme Tempemcwm I_
_ Tr_r Tmmmmer
R_ief
Vidve
Figure 1. Flow loop used on the NASA Learjet for the 12.7 mm ID testsection
.Mr SupO.v2O0O pmgCylinders
Piston -DrivenLlqmd
Feed Tank50 Liters
Test Sccuon
Figure 2. Flow loop used on the NASA KC-135 aircraft for the 25.4 mmID test section
._qn.I.
.'Ul._ V(11 lutu t" _
I_)111 iuaUnll_lule'llii_lto( i
--3
UOll_is llal (II mm P'fi; "PaJn_!,'!
A
lunot_l li_llptluzIj, ilnb_.'lJ dpo&nd p!nh!'l
loi I Ilu!._l._! ?t \
.(qdeJl_ll_kl uo!l-Y_v:_
POll!: I lile,_A lil'3t,xls
;Iqll41 oll!131U. I PUlA
aqo41 ._s.'lol.3nt.I, lui!, I
,,.-"- _ _ -.,,_" "--,,.- _ .i,,"lu,_ 6 (#J ul,_9(it- m_ _fl lu._ P_OI iil:l 9 I
-.- ,i_lt. I
UOli_as lsai (II mm L'I_I "£a.mlll3
_iln.l+
_,_.llllx:ll, d
[11 mlu 1_ I
,J,,,
llmlil_l lilIpluiu I, .tiii_s;141 aqllid ,'l.'ltill:3ilpuo , )
Ind plnl)r I illiu'13nlj, ml!_l
l;tlll_lllll J ,')Jns'slJ_J
eil,ioqd ,>aod.q ,8,11 it,I. Imii:Im:lP!°A_' -- _ '_
_.. lu._ L. t"i
_'_ _ol,I m:l IlO_
v
5
FILM THICKNESS PROBE VOID FRACTION PROBE
Gas
Figure 5. Parallel wire comtuctance probes for film thickness and voidfraction measurements
method described in detail in Bousman, 1995. The probes consist of a pair of closely
spaced parallel wires stretched tightly across the tube cross section. High-speed
electronics were used to produce a high-frequency alternating voltage (10 kHz) across the
wires, allowing measurement of the conductivity between the wires (Lacy, 1992).
Conductance probes like this were also used in the heat transfer test section described
below. By using aqueous fluids, which were made conductive by adding a small amount
of sodium chloride, the conductivity measurement system provides a voltage output
which is linearly proportional to the liquid film thickness or void fraction, depending on
the calibration. Based on calibration measurement errors and electronic discretization
errors, the uncertainty in thevoid fraction was about + 0.01 while the uncertainty in film
thickness, d, was about + 0.02 ram. The water-f'dled viewing box allowed for high-speed
photography of the flow with 'minimal refractive distortion. Photographic images of the
flow dynamics were acquired at 400 frames/second.
Heat Transfer Test Section: The adiabatic sections between the feed and the heated
section and between the heated section and the outlet were constructed of 25.4 mm ID
clear acrylic tubing, as shown in Figure 6. The heated tube was constructed of 25.4 mm
ID copper tubing. Nylon flanges on the ends of the heated section were machined to
make a smooth transition between the two tubing diameters. Two pressure taps for the
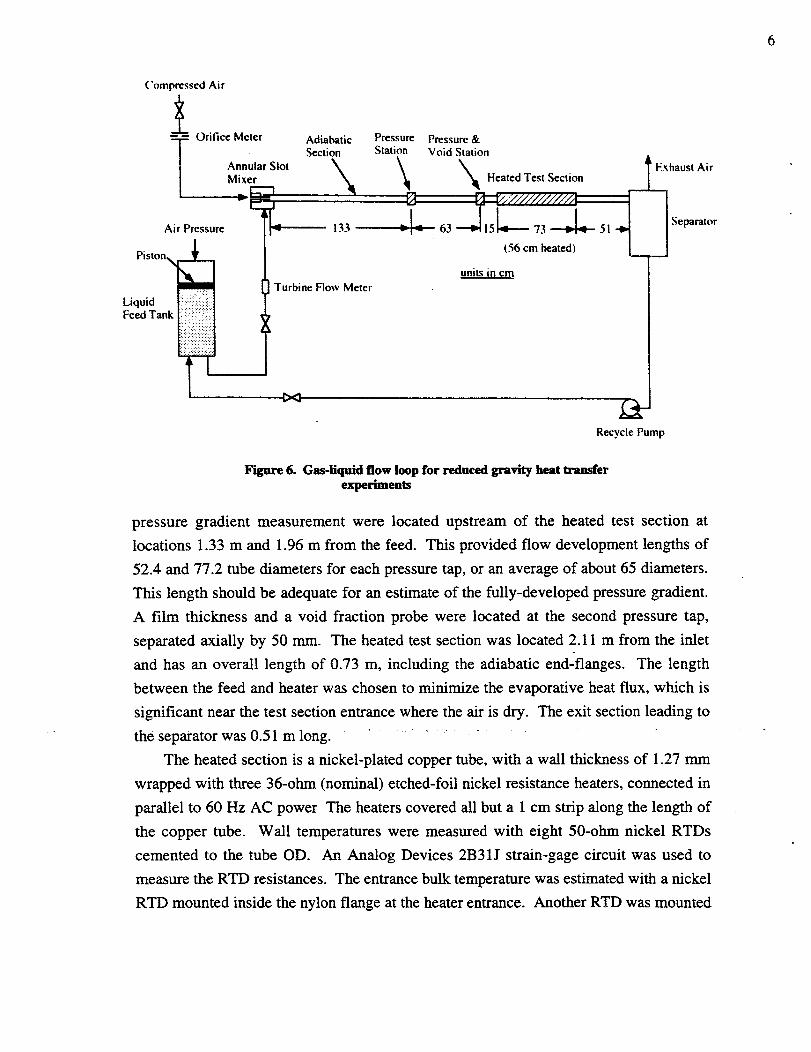
6
('omprcssed Air
/x
Mixer
Air Pressure _!_
PistonN __
x__.....
;: :::.: ":'.
Liquid :::::::::::::::::::::::::::;Feed Tank :::i!:i!:.i:::;.
: : :ii:. i-:::.!
i:i-i:ii!iiiii:i.!......,. :..:.:.:..,:,:..: :,,
;:::.,..:::;:: :,;:;.:
Adiabatic Pressure Pressure &Section Station Void Station
_ _ _ HeatedTestSection
(56 cm heated) L_
Turbine Flow Meter
units in cm
Recycle Pump
Exhaust Air
Separator
Figure 6. Gas-Hquid flow loop for reduced gravity heat transferexperiments
pressure gradient measurement were located upstream of the heated test section at
locations 1.33 m and 1.96 m from the feed. This provided flow development lengths of
52.4 and 77.2 tube diameters for each pressure tap, or an average of about 65 diameters.
This length should be adequate for an estimate of the fully-developed pressure gradient.
A film thickness and a void fraction probe were located at the second pressure tap,
separated axially by 50 mm. The heated test section was located 2.11 m from the inlet
and has an overall length of 0.73 m, including the adiabatic end-flanges. The length
between the feed and heater was chosen to minimize the evaporative heat flux, which is
significant near the test section entrance where the air is dry. The exit section leading to
the separator was 0.51 m long. " ...........
The heated section is a nickel-plated copper tube, with a wall thickness of 1.27 mm
wrapped with three 36-ohm (nominal) etched-foil nickel resistance heaters, connected in
parallel to 60 Hz AC power The heaters covered all but a 1 cm strip along the length of
the copper tube. Wall temperatures were measured with eight 50-ohm nickel RTDs
cemented to the tube OD. An Analog Devices 2B31J strain-gage circuit was used to
measure the RTD resistances. The entrance bulk temperature was estimated with a nickel
RTD mounted inside the nylon flange at the heater entrance. Another RTD was mounted
7
in a 7-degreeexpansionsectiondownstreamof theheaterto provideanestimateof the
exit bulk fluid temperature.
The two pressures,film thickness,eight wall temperaturesand inlet and outlet
temperatureswerecollectedat 1kHz. Accelerationsat two positionsalongtheflow loopwere also collectedat 1 kHz. Miscellaneoustest sectiontemperatures,pressures,and
flow rateswerecollectedat 1Hz.
FLOW DYNAMICS
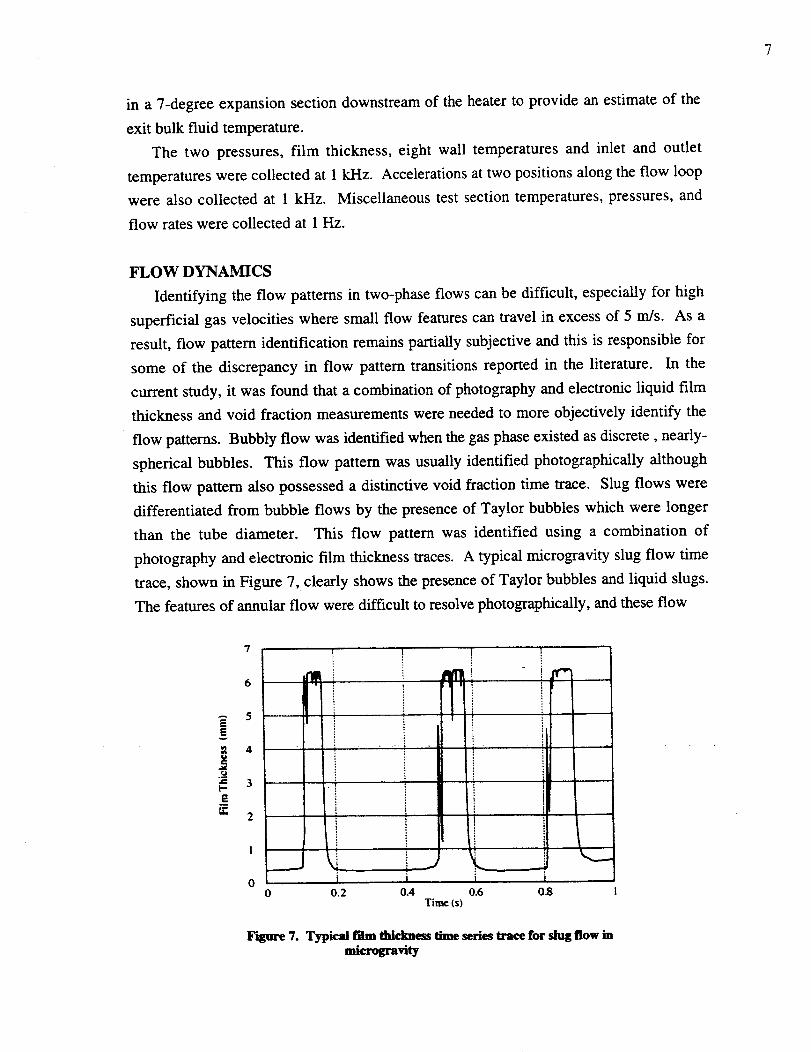
Identifying the flow pattems in two-phase flows can be difficult, especially for high
superficial gas velocities where small flow features can travel in excess of 5 m/s. As a
result, flow pattern identification remains partially subjective and this is responsible for
some of the discrepancy in flow pattern transitions reported in the literature. In the
current study, it was found that a combination of photography and electronic liquid film
thickness and void fraction measurements were needed to more objectively identify the
flow patterns. Bubbly flow was identified when the gas phase existed as discrete, nearly-
spherical bubbles. This flow pattern was usually identified photographically although
this flow pattern also possessed a distinctive void fraction time trace. Slug flows were
differentiated from bubble flows by the presence of Taylor bubbles which were longer
than the tube diameter. This flow pattern was identified using a combination of
photography and electronic film thickness traces. A typical microgravity slug flow time
trace, shown in Figure 7, clearly shows the presence of Taylor bubbles and liquid slugs.
The features of annular flow were difficult to resolve photographically, and these flow
7
6
5
4
.23b-
E
rr 2
I
0
!i
iI!
!
Jt I
l, lttt I
iI I
ii
iii i
i iiJ \i i
0 O.2 0.4 0.6 0.8Time (s)
i
i
il
Figure 7. Typical film thickness time series trace for slug flow in
mkrogravity
8
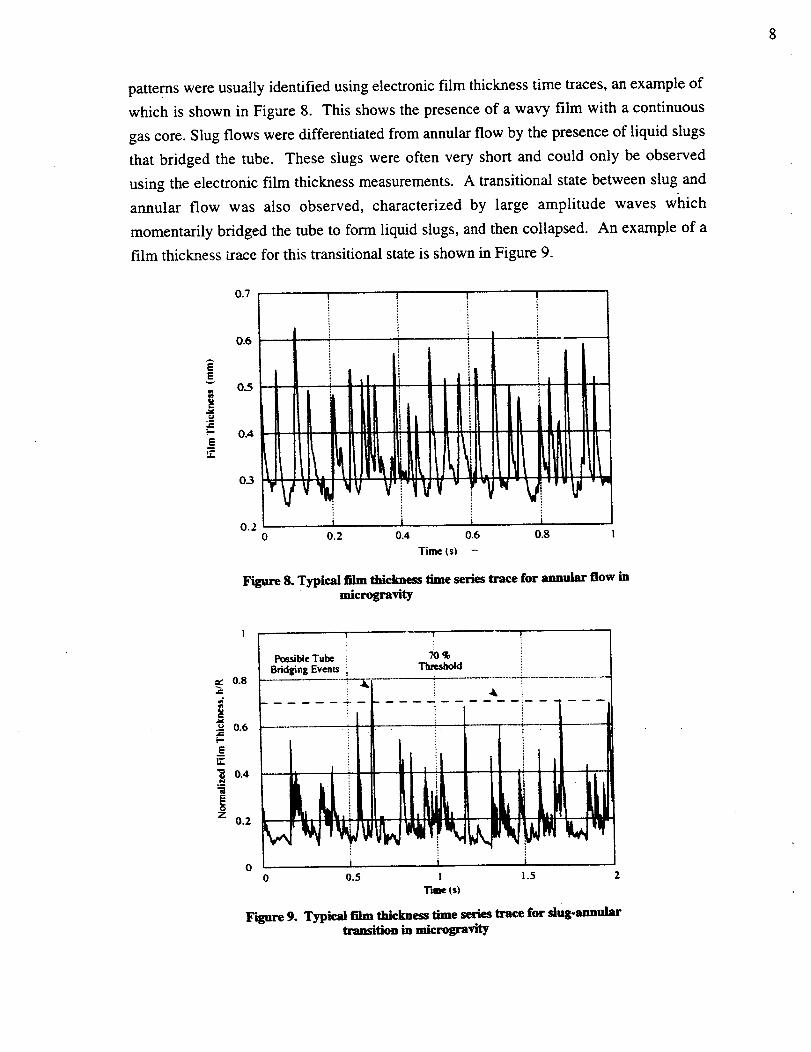
patterns were usually identified using electronic film thickness time traces, an example of
which is shown in Figure 8. This shows the presence of a wavy film with a continuous
gas core. Slug flows were differentiated from annular flow by the presence of liquid slugs
that bridged the tube. These slugs were often very short and could only be observed
using the electronic film thickness measurements. A transitional state between slug and
annular flow was also observed, characterized by large amplitude waves which
momentarily bridged the tube to form liquid slugs, and then collapsed. An example of a
film thickness trace for this transitional state is shown in Figure 9.
Ev
,ad
Em
0.7
0.6
O.5
0.4
0.3
0.2
!
!¥
! !
0 0.2 0.4
,ili
i
0.6 0.8
ill,il,!il
Time (s) -
Figure 8. Typical film thickness lime series trace for annular flow in
microgravity
_" 0.8
! 0.6
0.4
z 0.2
Po_l_e Tube
Bridging Even_ ;
0 0.5
!
Thm_d i
i!iliiliili. I1,I ,! LLIL
II 1.5
Time (s)
F'_gure 9. Typical fdm thickness lime seriestrace for dug.annular
transition in microgravity
9
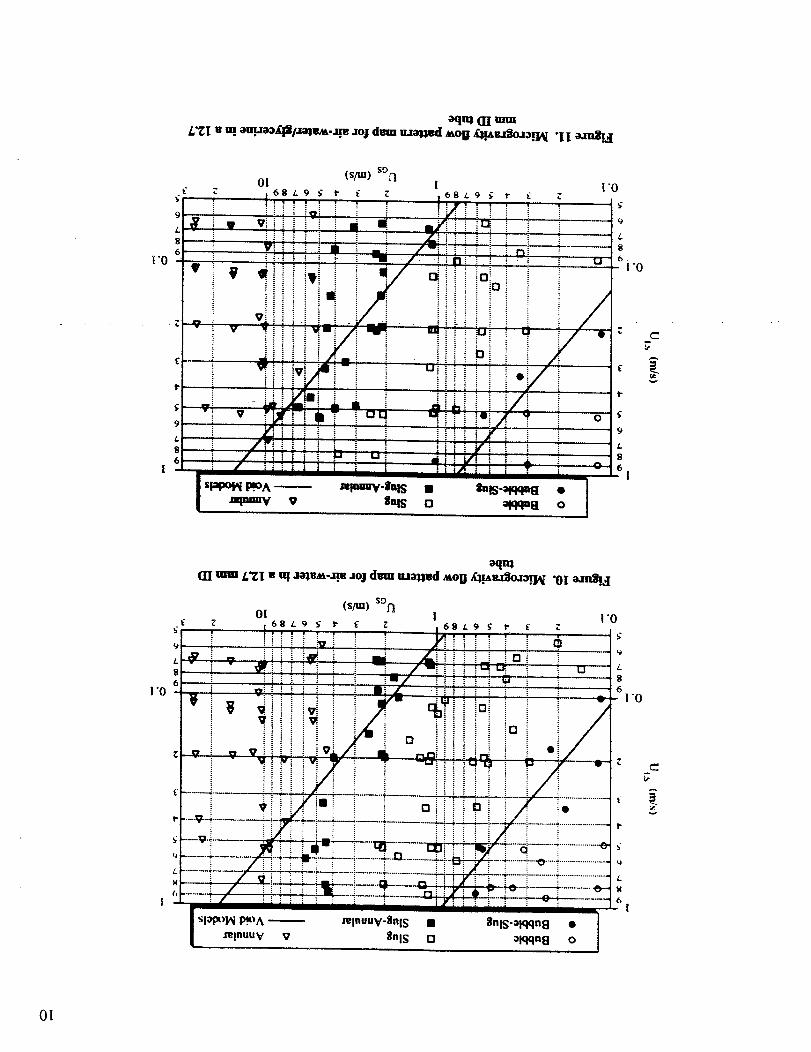
Flow Pattern Mapping: The experimental apparatus was used to establish flow pattern
maps in microgravity as a function of liquid viscosity, surface tension and tube diameter,
which are the key parameters affect the flow pattern maps. Three liquids were tested (all
at 21 + 2 C): water (!1 = 1 cP, t_ = 72 dynes/cm), 50-50 wt% water/glycerine (It = 6 cP, cr
= 63 dynes/cm), and water/Zonyl FSP (It = 1 cP, a = 21 dynes/cm). Zonyl FSP (Dupont)
is a powerful surfactant which in low concentrations can lower the surface tension
without affecting other physical properties of the liquid. Flow pattern maps were
determined for these liquids and air in 12.7 and 25.4 mm ID tubes.
The flow pattern maps are shown in Figures 10 through 15. A comparison of Figures
10 and 13, shows that the change in tube diameter leads to a shift in the bubble-slug
transition to lower valus of UGS, and thus void fraction, for the air-water system. For the
air-water/gylcerine and air-water/Zonyl FSP systems, the change in tube diameter
produced no significant change in the location of the bubble-slug transition. For all three
fluid systems, tube diameter had little effect on the location of the slug-annular transition.
Comparison of the air-water and air-water/glycerine flow pattern maps shows that a
six fold increase in the liquid viscosity produced no significant change in the location of
either flow pattern transition, indicating that liquid viscosity is not a major factor
affecting pattern transitions. Comparison of the air-water and air-water/Zonyl FSP maps
shows that reducing the surface tension results in a shift in the bubble-slug transition to
higher void fraction suggesting that surface tension plays a role in the bubble-slug
transition mechanism. The change in surface tension had no significant effect on the
slug-annular transition.
The air-water flow pattern map for the 12.7 mm ID tube is in good agreement with
the results of Dukler et al., 1988, and Janicot, 1988. This result is expected since all three
studies were done with similar apparatus and techniques.
The location of the transition between bubble and slug flow on the air-water flow map
of Colin, 1990 for a 30 mm ID tube compares well with the 25.4 mm ID air-water flow
pattern map of this study. ......
The results of Huckerby and Rezkallah, 1992, for air-water in a 9.525 mm ID tube
show fair agreement with the' 12.7 mm tube air-water results of this study. The Huckerby
and Rezkallah map shows the bubble-slug transition nearly independent of the gas
superficial velocity, UGS, which is contrary to the f'mdings of the present study. The slug
and annular regions of both flow maps are similar. The Zhao and Rezkallah, 1993, study
for air-water in a 9.525 mm ID tube shows the bubble-slug transition region to be
significantly different than that of Huckerby and Rezkallah, 1992, or the present 12.7 mm
I'0
..... i
I'0
9
L
86.
I'0
I'0
£
9
L
8
Ol
_iii i : i i
: : : : =" _ i
oi+!i_
i!!ii iQ
i.
I'0
c
L
8
6
: : : : : : :
i slaPOl,q P.mA --
_lnuuv V
mlnuuv-SnlS •
+Inls {3
_nlS-olqqn8 •
olqqn8 o
I'0
Ot
I o
IO
EE
=>
E
E
\
......... '¢' I
...................._ ............ ]....... _
13
ID air-water map. The cause of this discrepancy is unexplained. The location of the
Zhao and Rezkallah slug-annular transition is in good agreement with the present results.
Void Fraction Flow Pattern Transition Models: In addition to establishing flow
patterns maps, it is useful to develop models that predict the location of the transitions on
the maps. For microgravity gas-liquid flow pattern transitions, two approaches have been
suggested: a void fraction criteria from Dukler et al., 1988, and a Weber number criteria
from Zhao and Rezkallah, 1993. Both were examined in relation to the current study.
Tile void fraction based model for the bubble-slug transition was developed by
examining the high-speed movie images of the experiments near the transition. These
films suggested that the transition from bubble to slug flow occurred when spherical
bubbles became so densely packed that they touched and coalesced. This implies that the
transition occurs at a constant void fraction. The maximum packing density of rigid
spheres is 52%, which imposes an upper limit on the transition void fraction. However,
oscillations in the shape and position of the bubbles due to turbulence give the bubbles a
larger diameter and allow for coalescence at lower void fractions.
The mean void fraction values measured for bubble-slug transition flows in a 12.7-
mm ID tube were found to lie in a distinct range between those of the bubble and slug
flow experiments. The center point of this range was used as the characteristic void
fraction for the transition. Since adequate void fraction measurements were not available
for the experiments conducted in the 25.4-mm ID tube, the void fraction of each
transition run was estimated using the Drift-Flux model (Zuber and Findlay, 1965) with a
distribution parameter determined from the 12.7-ram ID tube experiments (Bousman,
1995). From these estimated void fractions, the transition void fraction was determined
for each flow pattern map. The transition void fraction value for each tube diameter and
fluid system is shown in Table 1.
The Drift-Flux model with a drift velocity of zero (due to the lack of buoyancy
between phases in microgravity) leads to
o , : . - .
Ut.s (1- Co(a )) U=- -Co-"_ [ os (1)
The distribution coefficient Co was determined to be 1.21 for microgravity gas-liquid
flows using experimental void fraction measurements (Bousman, 1995). Using this in
conjunction with the transition void fraction values of Table 1 yields lines of constant
void fraction on the flow pattern maps which represent the predicted bubble-slug
transition.
14
Table 1
Transition Void Fraction Values for the Bubble-Slug Transition
Fluids Tube Diameter (mm)
Air-Water 12.7 0.40
Air-Water/Glycerin 12.7 0.36
Air-Water/Zonyl 12.7 0.46
Transition Void Fraction
Air-Water 25.4 0.23
Air-Water/Glycerin 25.4 0.40
Air-Water/Zonyl 25.4 0.40
The bubble-slug transition predicted from the void fraction matching criteria is
superimposed on the flow pattern maps in Figures 10-15. As shown, these lines of
constant void fraction separate the bubble and slug regions of the flow map, which is
expected since these models were derived from the data. With the exception of the air-
water flow pattern map for the 25.4-mm ID tube, the bubble-slug transition occurs at a
void fraction of about 40%.
The decrease in the transition void fraction for the air-water system in the larger
diameter tube is also present in the flow patterns presented by Colin, 1990, for air-water
in a 40-mm ID tube. To better understand this result, the movie films of the experiments
near the transition were examined for both the small and large tubes. In the 25.4-mm
tube, the gas-liquid bubble interfaces were in a continuous state of fluctuation while those
in the 12.7-mm tube under the same flow conditions were more stable. These oscillations
in the larger tube, which can be attributed to turbulence, give the bubbles a larger
effective diameter thus increasfng the probability of contacting nearby bubbles. The
result is a transition to slug flow at a lower void fraction. This effect was not observed in
the air-water/glycerin experiments in the larger tube due to a reduction in turbulence.
The reduced surface tension in the air-water/Zonyl experiments should reduce the
probability of coalescence when bubbles contact each other and this may explain why the
decrease in transition void fraction was not observed for this system in the larger tube
when the strong bubble oscillations were present.
A void fraction slug-annular transition model was developed by Bousman, 1995,
using force balances to determine a void fraction relationship for annular flow. By
15
equatingthis with the slug flow void fractionexpressiondevelopedfrom the Drift-Fluxmodel, a void fraction matchingcondition is imposedas the transition criterion. This
model predictsthat the transitionoccursat the line of constantvoid fraction whenboththe gasandthe liquid phasesareturbulent. A transitionvalueof a = 0.8 was determined
for all flow maps using the 12.7-mm tube. The transition model for turbulent gas and
laminar liquid is more complex, but the predicted void fraction occurs at a nearly constant
value of UGS. This model over-predicted the transition void fraction in the turbulent
liquid region, possibly due to the problems in accurately determining the pressure
gradient in the unstable slug-annular transition region.
The results of Bousman, 1995, showed that the void fraction matching slug-annular
transition model was very sensitive to the transition void fraction value used. If a line of
constant void fraction at o_=0.75 is used instead of that predicted from the more rigorous
model, good separation of the slug and annular regimes is obtained for the air-water and
air-water/Zonyl FSP flow pattern maps for both tube diameters. A reasonable criterion
for the air-water/glycerine maps is o_=0.70. These constant void fraction criteria are
superimposed on the experimental flow pattern maps in Figures 10-15.
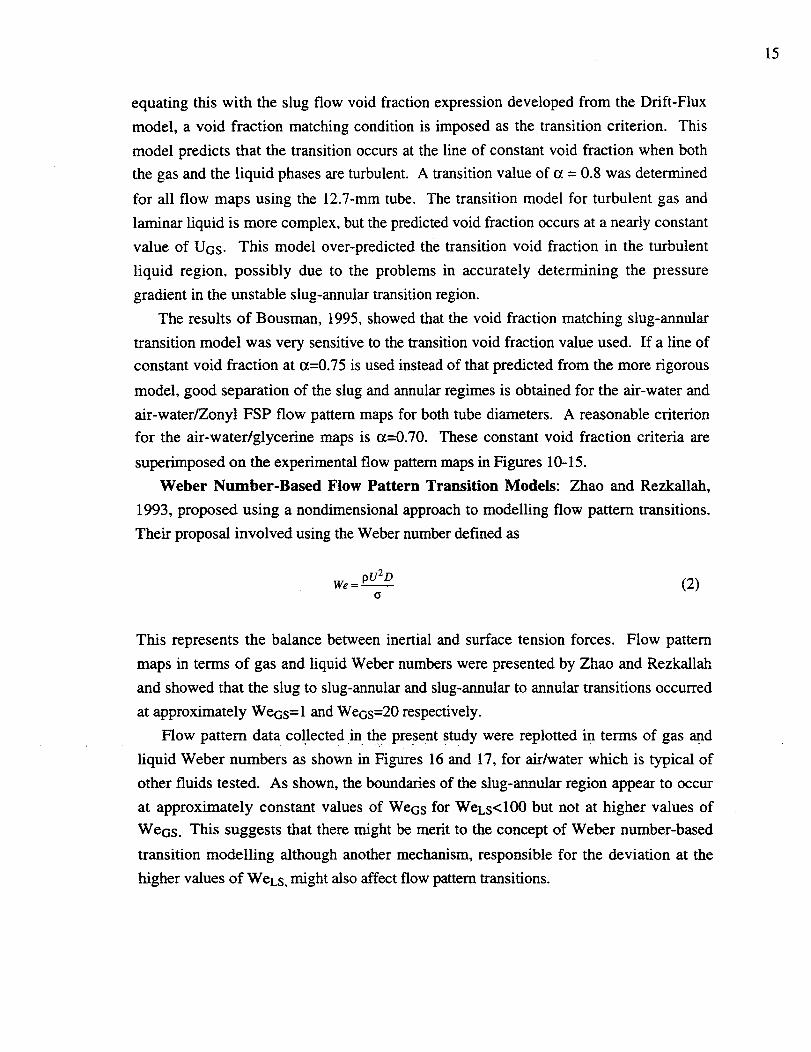
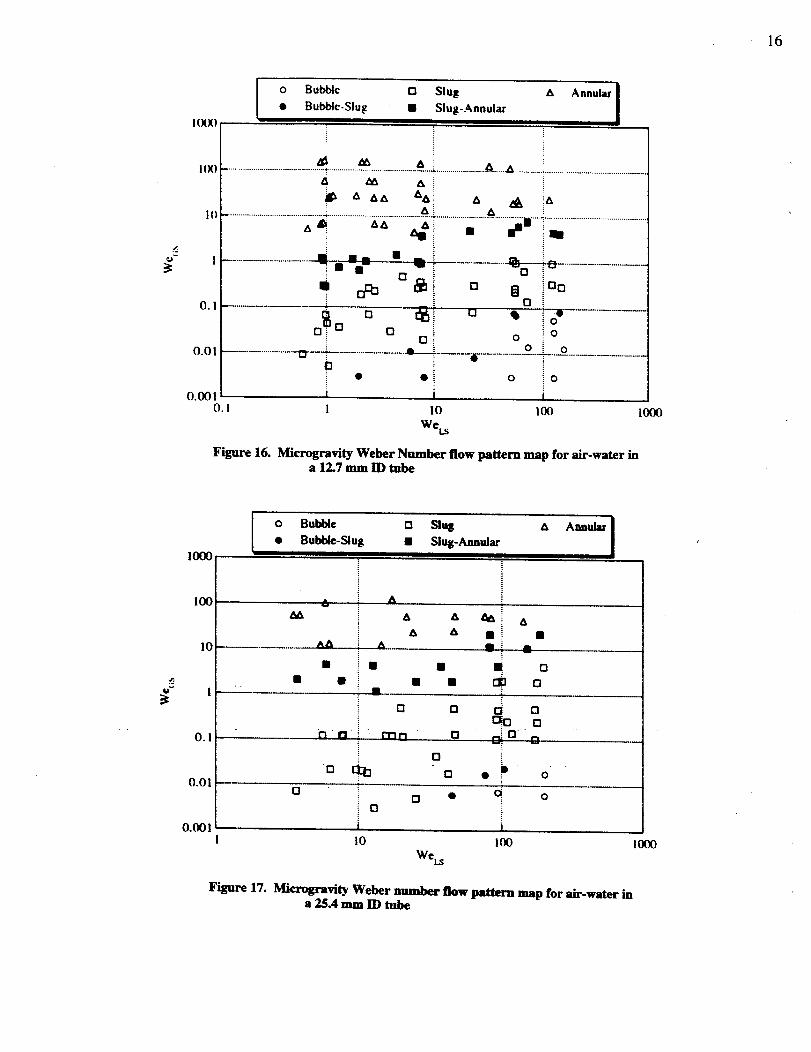
Weber Number-Based Flow Pattern Transition Models: Zhao and Rezkallah,
1993, proposed using a nondimensional approach to modelling flow pattern transitions.
Their proposal involved using the Weber number defined as
We = pU2 D (2)13
This represents the balance between inertial and surface tension forces. Flow pattern
maps in terms of gas and liquid Weber numbers were presented by Zhao and Rezkallah
and showed that the slug to slug-annular and slug-annular to annular transitions occurred
at approximately WeGS = 1 and WeGS=20 respectively.
Flow pattern data col.lected in the present study were replotted i n terms of ga s and
liquid Weber numbers as shown in Figures 16 and 17, for air/water which is typical of
other fluids tested. As shown, the boundaries of the slug-annular region appear to occur
at approximately constant values of WeGS for WeLS<100 but not at higher values of
WeGs. This suggests that there might be merit to the concept of Weber number-based
transition modelling although another mechanism, responsible for the deviation at the
higher values of WeLS, might also affect flow pattern transitions.
16
I(X_)I o Bub_c 0 Slug A Annula_ ]• Bubblc-Slug • Slug-Annular
II
........_ ................_ ......................_A............................_......,,...............,......................................................
a AA AA A a_ !AA A
'" ....................................................................................... ................;,.-=, ...........................................
t ............................._ N-E-41_rl
ii d_ &
o._ _, o _iO_ 0 0
oi
0
[]
-+'0- .....................
O i°°
qll ?-"O'ooo
o oO. 0 ! ...................... _ ........................ .t--_:-': -_--_-- ...................................
o i• o i o o
0.001 IO. !0 O0 i000
WeL. s
Figure 16. Microgravity Weber Number flow pattern map for alr-water ina 12.7 mm ID tube
1000
o Bubble 0 Slab a Annular I• Bubl01e-Slug • Slu_-AaoularI II
100
I0
o_ |
o.n
0.01
0.001
A
&
• i=
i i
i o.... i -
0 o " m n
AA
o
0
0
I
I0
A li n
• n oan _ o
i
Q [3 i-1
o _P o0
0 • I ' o
• _ o
iI00
WeLs
I000
Figure 17. Microgravity Weber number flow pattern map for air.water ina 25.4 mm ID tube
17
SUMMARY OF FLOW DYNAMICS RESEARCH
The ability to predict gas-liquid flow patterns is crucial to the design and operation of
two-phase flow systems in the microgravity environment. Flow pattern maps have been
developed in this study which show the occurrence of flow patterns as a function of gas
and liquid superficial velocities as well as tube diameter, liquid viscosity and surface
tension. The results have demonstrated that the location of the bubble-slug transition is
affected by the tube diameter for air-water systems and by surface tension, suggesting
that turbulence-induced bubble fluctuations and coalescence mechanisms play a role in
this transition. The location of the slug-annular transition on the flow pattern maps is
largely unaffected by tube diameter, liquid viscosity or surface tension in the ranges
tested. Void fraction-based transition criteria were developed which separate the flow
patterns on the flow pattern maps with reasonable accuracy. Weber number transition
criteria also show promise but further work is needed to improve these models.
HEAT TRANSFER
Because of fundamental differences in slug and annular flow, different techniques of
data reduction were required. Thus it is appropriate to discuss slug and annular flow
separately in what follows. All the data were collected for a 25.4 mm ID tube using air
and two fluids, water and 50-50 wt % water/glycerine. Pressure drop, heat transfer, film
thickness and void fraction data were collected for each flight experiment. A complete
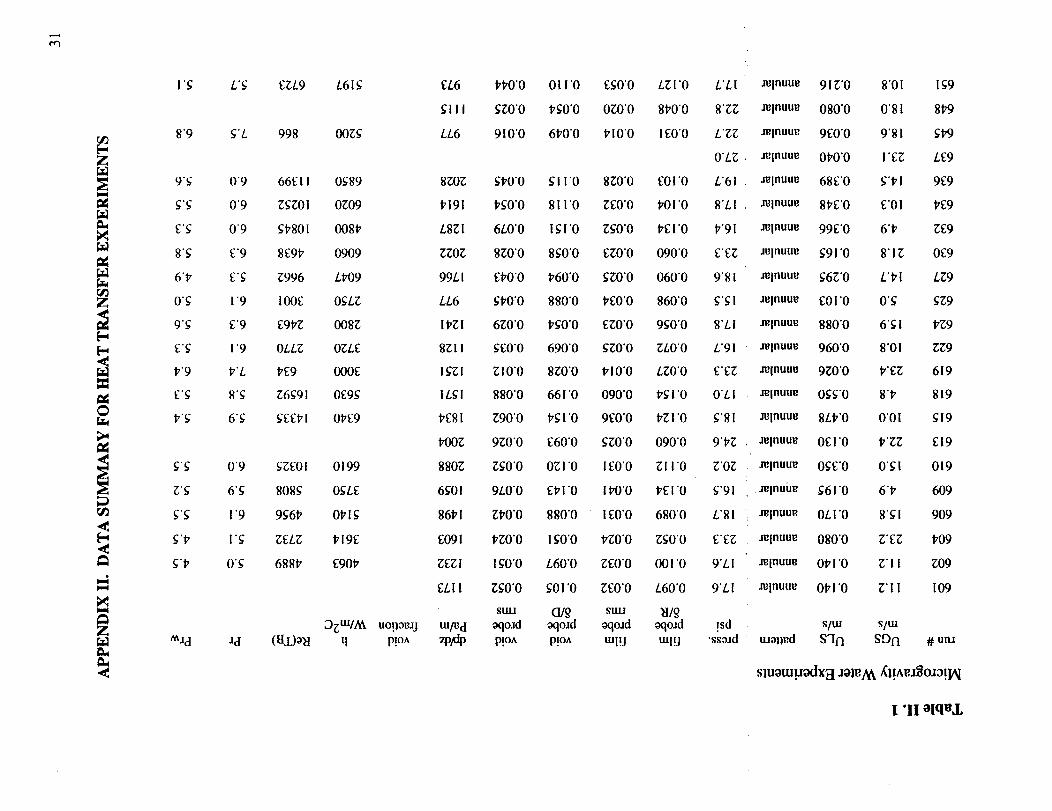
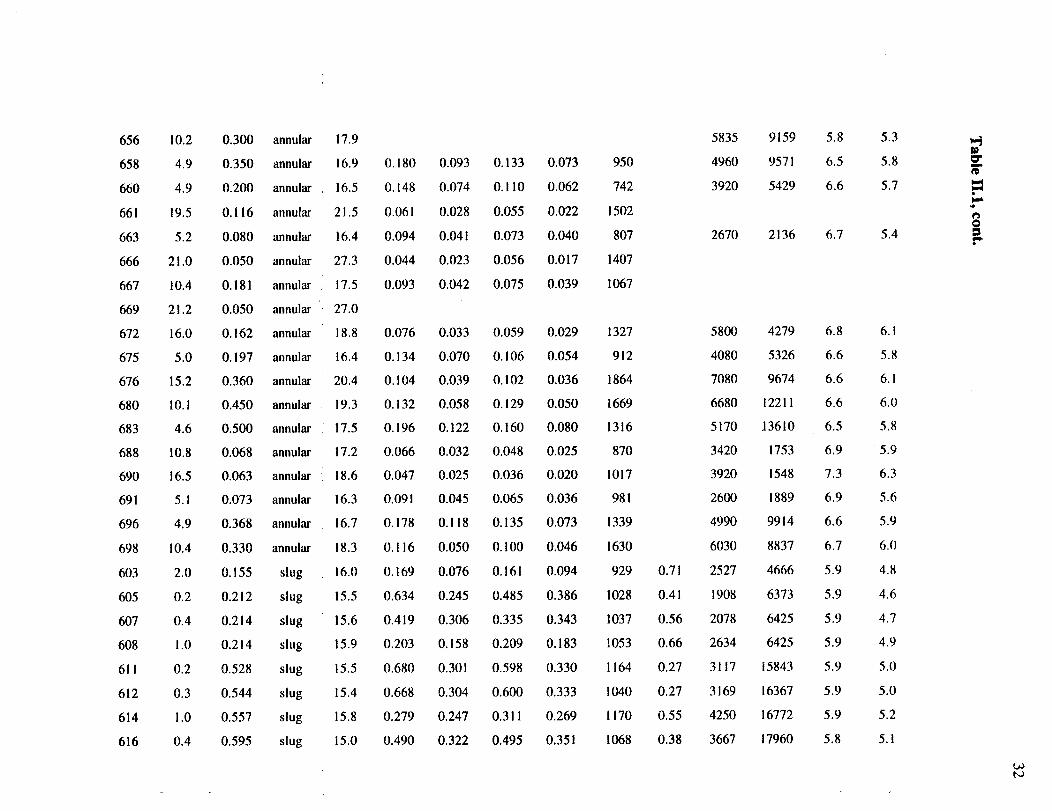
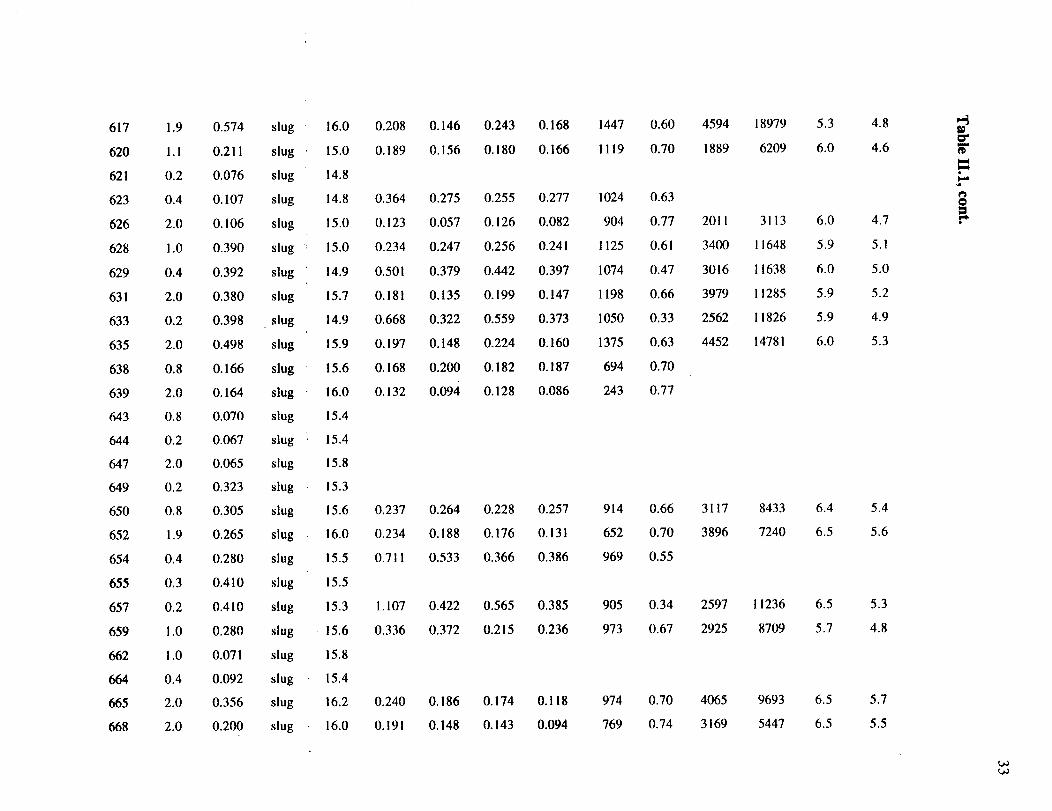
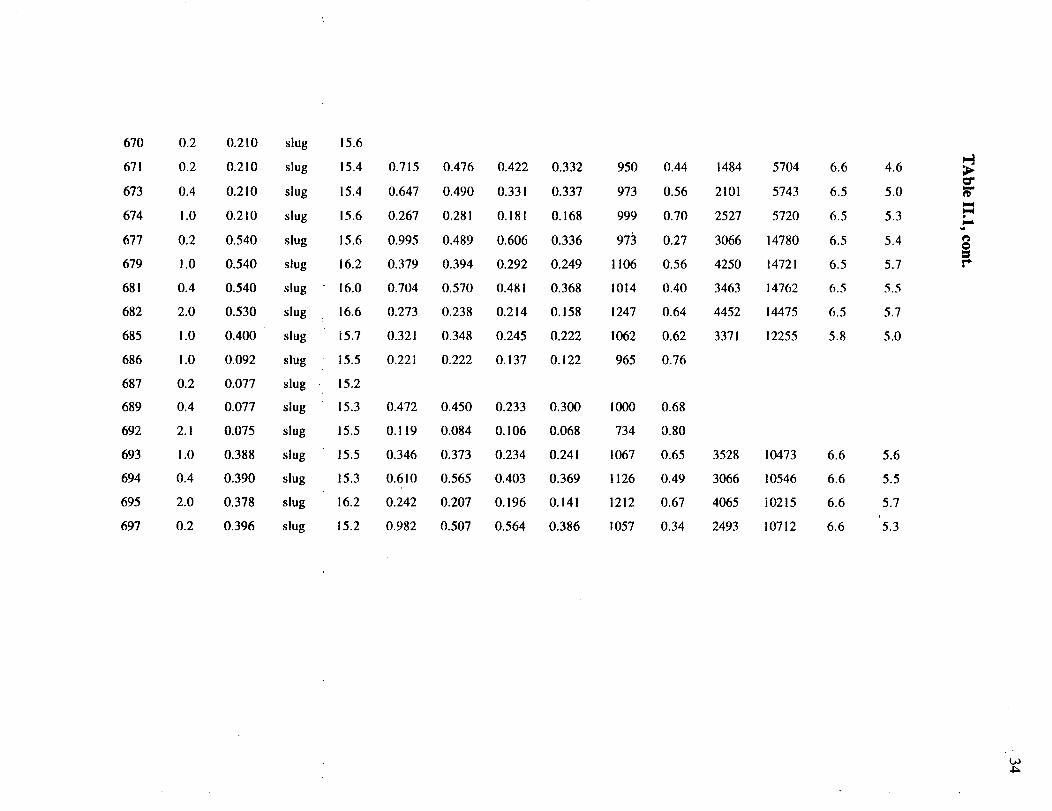
listing of the heat transfer data is given in Appendix B.
Annular Flow
Calculation of Heat Transfer Coefficients: The steady-state wall temperatures
were estimated for each run by averaging the latter portions of the time series, where the
wall temperatures appeared to be at asymptotic values. Depending on flow conditions,
the wall temperatures varied widely among experiments. The film thickness was
estimated by
$=[Regt2] 1/2 (3)L 2p_ j '
obtained from the fiat-film laminar velocity profile and definition of the Reynolds
number. Even though the film was turbulent for most of the test conditions, equation (3)
18
wasusedto provide a uniform treatmentfor all conditionsandfor comparisonwith thetheoretical transientanalysis. The stress,x, was estimated with an axial momentum
balance averaged over the tube cross-section as
t = -Dvp, (4)4
and the wall heat flux was defined by the heater power divided by the inner area of the
heated tube. The local Nusselt number (Nu=h_/k) is then simply
nu =_ (5)ew-08 '
where qw and qB are the dimensionless wall and bulk temperatures, respectively. In this
formulation, the time-averaged wall heat flux is assumed to be uniform. The bulk
temperature was estimated from an enthalpy balance on the liquid as
TB= TIN._ qw (6)FCp
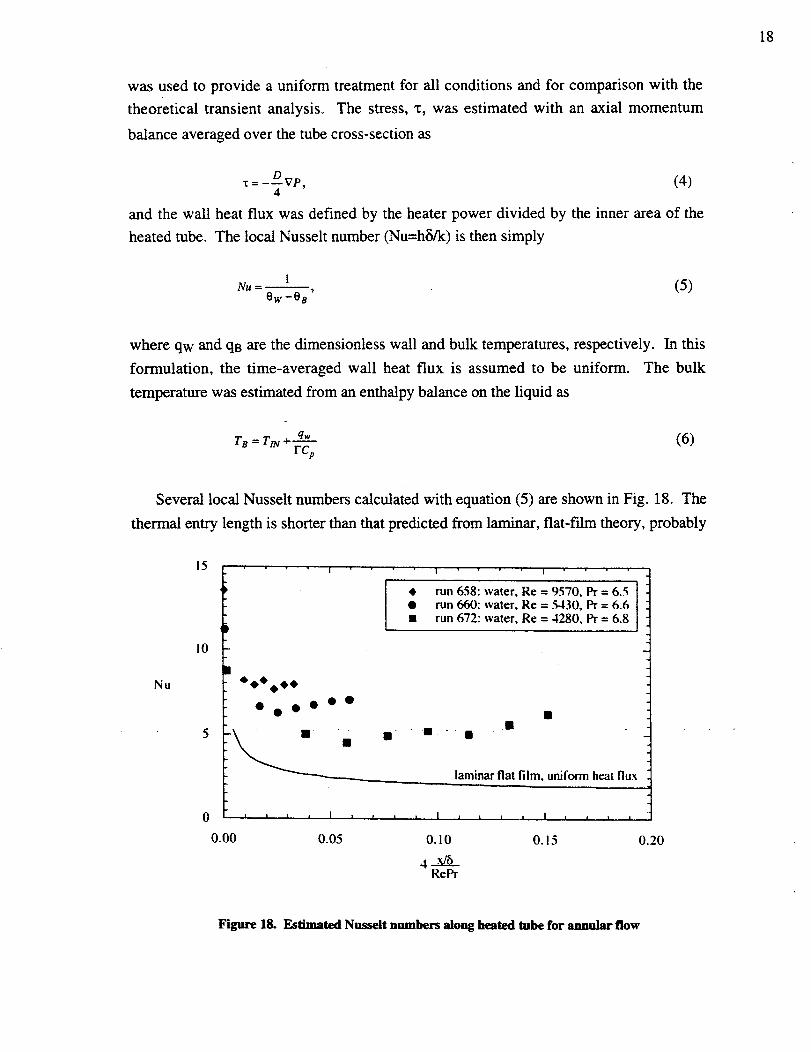
Several local Nusselt numbers calculated with equation (5) are shown in Fig. 18. The
thermal entry length is shorter than that predicted from laminar, fiat-film theory, probably
NH
15
10
OoOO
5 ._m ¸
I I I
0.00
I I I
• run 658: water, Re = 9570, Pr = 6.5
• run 660: water, Re = 5430, Pr = 6.6
• run 672: water, Re = 4280, Pr = 6.8
m m - •
laminar flat film, uniform heat flux
, l , , , , I , , _ , I
0.05 0.10 0.15
4x/6RePr
I I I I
0.20
Figure 18. Estimated Nusselt numbers along heated tube for annular flow
19
due tO the higher-than-predicted heat transfer coefficients, wave motion and film
turbulence. For the water run 658, it is fairly easy to interpret the asymptotic Nusselt
number since the wall temperatures reached steady state values in the experimental
period. It is more difficult for runs 660 and 672. The downstream temperatures did not
reach steady values, thus the computed Nusselt numbers at the tube exit are larger than
the asymptotic value. However, an estimate of the asymptotic Nusselt number is
available by examining the portion of the tube that did reach thermal equilibrium, which
typically included all but the two temperatures farthest downstream. This strategy is used
for all runs in which downstream lengths of the tube did not reach thermal equilibrium.
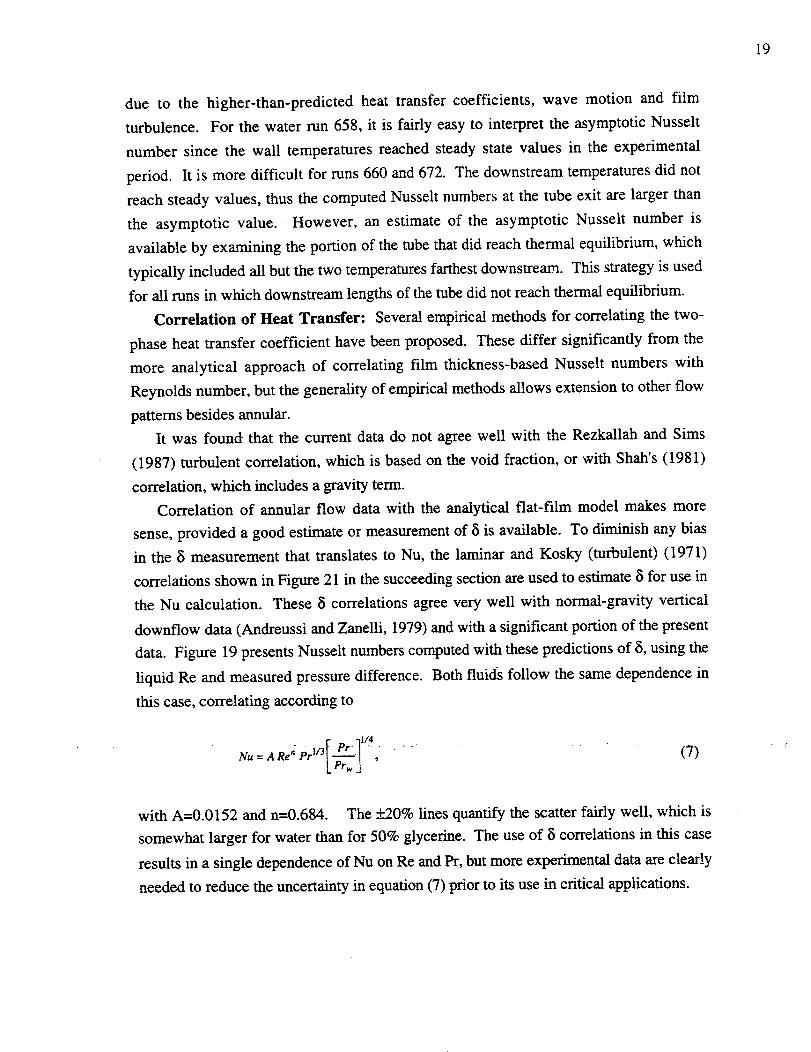
Correlation of Heat Transfer: Several empirical methods for correlating the two-
phase heat transfer coefficient have been proposed. These differ significantly from the
more analytical approach of correlating film thickness-based Nusselt numbers with
Reynolds number, but the generality of empirical methods allows extension to other flow
patterns besides annular.
It was found that the current data do not agree well with the Rezkallah and Sims
(1987) turbulent correlation, which is based on the void fraction, or with Shah's (1981)
correlation, which includes a gravity term.
Correlation of annular flow data with the analytical flat-film model makes more
sense, provided a good estimate or measurement of 8 is available. To diminish any bias
in the _i measurement that translates to Nu, the laminar and Kosky (turbulent) (1971)
correlations shown in Figure 21 in the succeeding section are used to estimate _ for use in
the Nu calculation. These _i correlations agree very well with normal-gravity vertical
downflow data (Andreussi and Zanelli, 1979) and with a significant portion of the present
data. Figure 19 presents Nusselt numbers computed with these predictions of 5, using the
liquid Re and measured pressure difference. Both fluids follow the same dependence in
this case, correlating according to
• t- pr.-11(4 .Nu = A Re n Prl/31_| ,
Ler_ J(7)
with A=0.0152 and n--0.684. The +_20% lines quantify the scatter fairly well, which is
somewhat larger for water than for 50% glycerine. The use of _5correlations in this case
results in a single dependence of Nu on Re and Pr, but more experimental data are clearly
needed to reduce the uncertainty in equation (7) prior to its use in critical applications.
20
I01
10°
! I I I | I ! s t I I I I ! I I I I "
0 water I50% glycerine +20%
0.0152 Re °'6_
!0 "1 , I i , I L I ,I I , , , , , ,,I
!02 103 10 4
Re
Figure 19. Correlation of Nusselt numbers using fdm thicknesscorrehttious for annular flow
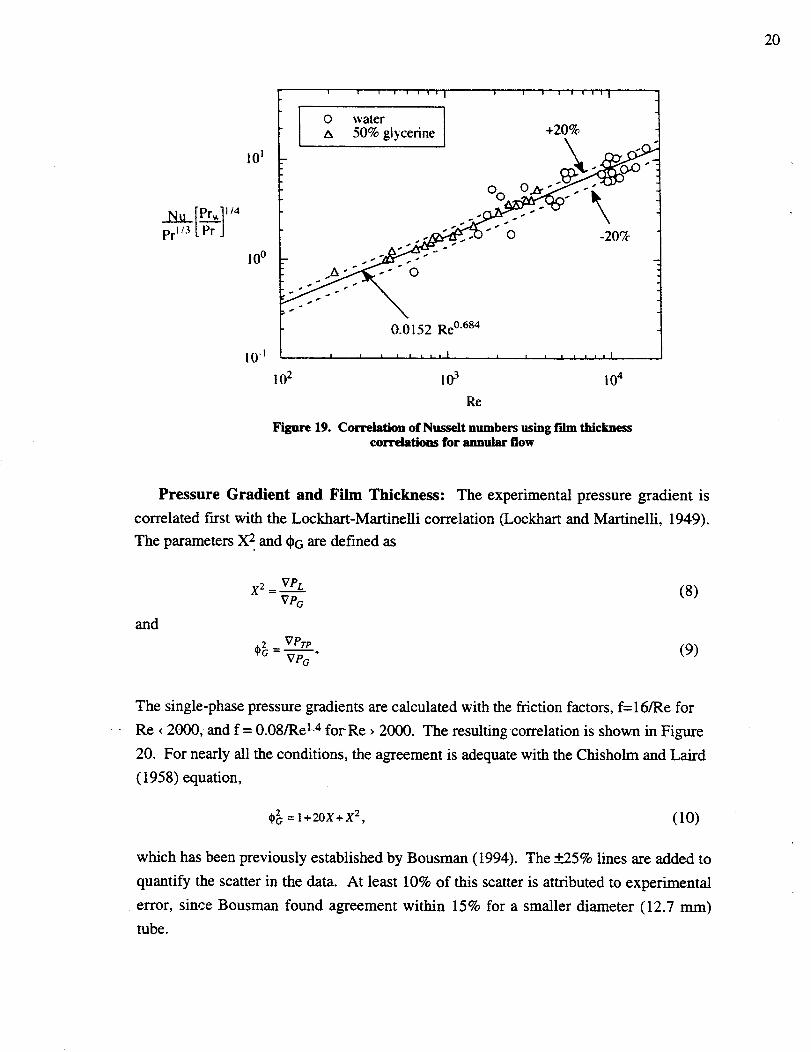
Pressure Gradient and Film Thickness: The experimental pressure gradient is
correlated first with the Lockhart-Martinelli correlation (Lockhart and Martinelli, 1949).
The parameters X 2 and _G are defined as
and
x 2 = veL (8)vt,_
(_2 = VPTPvP---_-" (9)
The single-phase pressure gradients are calculated with the friction factors, f= 16/Re for
Re < 2000, and f = 0.08/Rel-4 forRe > 2000. The resulting correlation is shown in Figure
20. For nearly all the conditions, the agreement is adequate with the Chisholm and Laird
(1958) equation,
,2 = I+20X+X 2, (10)
which has been previously established by Bousman (1994). The +_25% lines are added to
quantify the scatter in the data. At least 10% of this scatter is attributed to experimental
error, since Bousman found agreement within 15% for a smaller diameter (12.7 mm)
tube.
21
i 0 3
10 2
101
' ' ''''"1 ' ' ''''"1 ' ' '_''"1 ' ' '''"'l * , ,,,,,L
+25% ,._'_
o oI + 20 X + X 2 0 t2.¢._._ -" -25%
rt:.3_,--00r_ ""
o°. .O° .12t''
- - J:l" 9"-'-" [ Cl 5w0a%glycerine
!0 o ........ I ........ t ........ t ........ i .....
10 -3 10 -2 10- I 100 I01 102
X z
Figure 20. Comparison of measured pressure gradient with L_ldaart-Martinelli correlation for annular flow
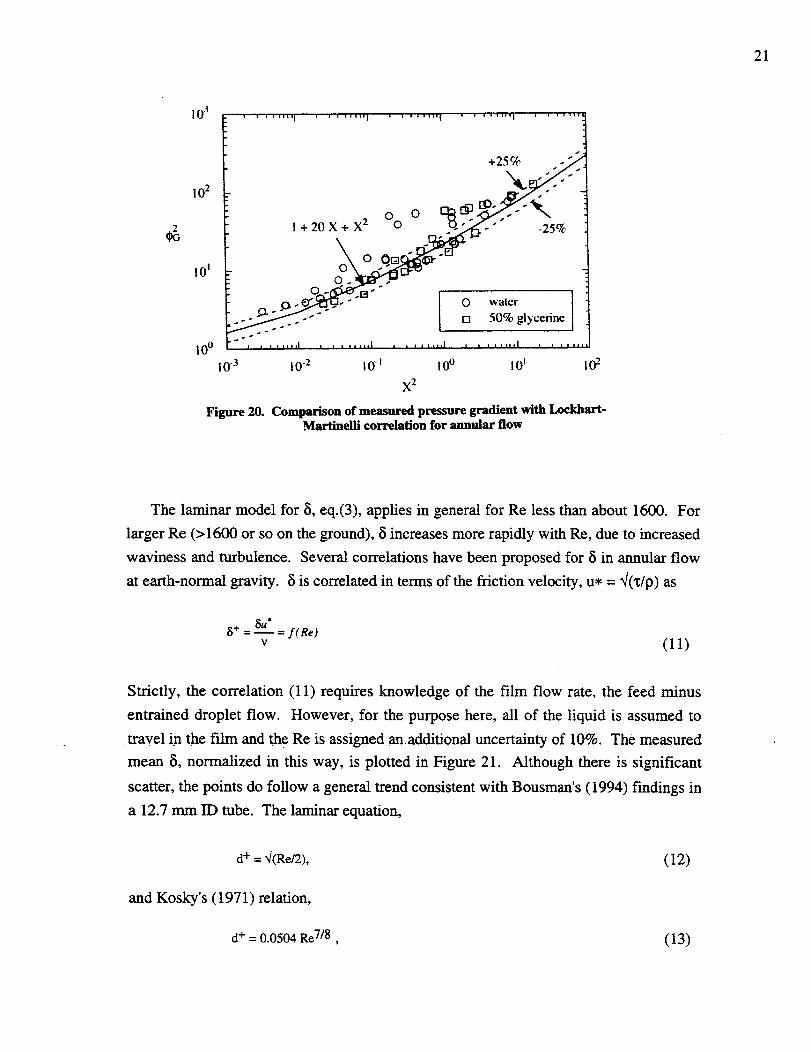
The laminar model for 15,eq.(3), applies in general for Re less than about 1600. For
larger Re (> 1600 or so on the ground), _5increases more rapidly with Re, due to increased
waviness and turbulence. Several correlations have been proposed for 15in annular flow
at earth-normal gravity. _ is correlated in terms of the friction velocity, u* = _/(x/p) as
_+ = _u* = f(Re)V (11)
Strictly, the correlation (11) requires knowledge of the film flow rate, the feed minus
entrained droplet flow. However, for the purpose here, all of the liquid is assumed to
•travel in the film and there is assigned an additional uncertainty of 10%. The measured
mean 5, normalized in this way, is plotted in Figure 21. Although there is significant
scatter, the points do follow a general trend consistent with Bousman's (1994) findings in
a 12.7 mm ID tube. The laminar equation,
d + = "4(Re/2),
and Kosky's (1971) relation,
d + = 0.0504 Re 7/8 ,
(12)
(13)
22
areincludedfor comparison,alongwith Bousman'sfit,
5+ = 2. 65 Re 0"695• (14)
Some of the scatter in Figure 21 is due to conditions near Uos=5 m/s, where the pressure
drop is larger than that expected for typical annular flows. A significant number of points
for Re greater than 1600 agree reasonably well with the Kosky relation, while the
agreement with the laminar relation for Re<1600 is not quite as good. Bousman's low-Re
data agree more closely, which may be due to random or bias errors in the current set of
data.
+
1000
100
10
100
i i _ i J I i , | i i i i i i i _ I
I o wa,er IO 50% glycerine [ O
Bousman (1994) O _ :,(_[_ --
\oo \
o ._[] ._in°__ K_ky (1971)
laminar flat film t
/t t I I I t ! I [ I | I I I • , , I
1000 10000
Re
Figure 21. Correlation of experimental film thickness with Hquid
Reynolds number for annular flow
Slug Flow
. . . . -
Data Reduction: The output of the conductance probe circuit is related directly to
the amount of conducting liquid between the void fraction wires, the equivalent height of
which is represented by _5. The instantaneous line-average fraction of the diameter filled
with liquid is then simply _5/D. For homogeneous conditions, where the bubbles or voids
are distributed uniformly across the diameter, the local void fraction is simply
23
For separatedflows,as in annularflow or alongaTaylorbubblein slug flow, wheretheliquid occupiesa contiguousregion adjacentto the wall, the local void fraction, or,is
equalto
Ct=(1--_)2. (16)
Full liquid pipe flow is used as a reference to account for temperature-dependent
conductivity changes among runs. For slug flows, eq. (15) applies for the liquid slugs
when bubbles are present, and eq. (16) applies for the Taylor bubbles. For the present
conditions, the Taylor bubbles represent most of the 0_, so eq. (16) is more accurate and
thus was used to calculate 0_.
Pressure Gradient Correlation: Neither of the two most commonly used techniques
for correlating pressure gradient in slug flows, the Lockhart-Martinelli, 1949, method, or
the homogeneous method, Wallis, 1969, correlated the present slug flow data well. A
correlation of the form suggested by Chu and Jones, 1980, using the two-phase Re, ReTp,
was used to correlate the data
Rere= Re__.._L (17)(l-a)
The equivalent liquid velocity is UL=ULs/(1-o0 and the two-phase friction factor is
fTp= O VP (18)2 PLU_.
This formulation correlates very well with the Rear, for both water and 50% glycerine.
However the ratio 01; gas-to-liquid kinematic viscosity, (VG/VL) _, is required for both
fluids to follow the same dependence on ReTr,, as given below in eq. (19).
14,500 (vo ]2fTP = _ m (19)tvLJ
but experiments over extended conditions and with other fluids are needed to justify the
empirical inclusion of the viscosity ratio.
24
Correlation of Heat Transfer: In a manner similar to that used for annular flows,
the steady wall temperatures were estimated. Tw's were placed in the dimensionless form,
0_ = rw - Tin, (20)qwD/k
where TIN is the inlet temperature, qw is the mean wall heat flux, and k is the thermal
conductivity. The distance along the tube, x, .was normalized using Re (Re=4G/B) and Pr
(Pr=-CplX/k) as
4x/D (21= Ree-"---7"
Assuming a uniform heat flux, the Nu (Nu=hD/k) based on the tube diameter is simply
Nu = _1 (22)O_-8 B '
from which the heat transfer coefficient, h, was back-calculated for each run. TB was
estimated from an enthalpy balance on the liquid as
TB =Tm _ q_x (23)FCp '
from which the simplification, qB = _, results°
Several local Nu calculated with eq. (22) are shown in Fig. 22. The leading digits, 6
and 7, in the Ilan number indicate water and 50% glycerine, respectively. The larger Nu
correspond to wall-to-bulk AT's that are smaller and more difficult to measure accurately.
However, the scatter is relatively small along the heated length and the asymptotic Nu
fairly easy to interpret from ..an average taken near the tube exit. In the case of obvious
deviations from the norm, as in the case when wall temperatures were far from their
steady values, local measurements were discarded from the average.
Chu and Jones (1980) used the two-phase Reynolds number from equation (16) to
correlate two-phase Nusselt number in a form similar to the Sieder-Tate, 1936,
correlation. The form of their correlation is
Nu=ARe_.pPrl/31 Pr _0"14¢pa _0"i7 '
t.e_J t J>)(24)
25
Nu
4(X)
35O
30O
250
200
150
100
50
O run 650: water, Rel =8430, Re(;= 1'44
D run 657: water, Ret= I 1,200, ReG=37
O run 679: water, ReL=14,700, ReG=I900
• run 702: 50% glycerine. ReL=2880, Re(i=41
• run 736: 50_" glycerine, ReL=2730, ReG=70
o o o o o o o
o o o o 0 o oD [] [] n [] [3
: =rl=t== o
Ill ii illll Ii i_ Ii Itll III II II III I , ,l II It It Itlll tl I,
0.0000 0.0001 0.0002 0.0003 0.0004 0.0005
4 _DRePr
Figure 22. Typical local Nusselt number along heated length for slug flow
where Prw is the wall Pr, Pa is atmospheric pressure and P is the local pressure. For the
Chu and Jones experiments, n=0.55 for both vertical upflows and downflows. The
constant, A, varies slightly between upflow and downflow as 0.43 and 0.47, respectively.
The current data were compared with the Chu and Jones correlations. The best fit occurs
for A=0.14 and n--0.62. The comparison also implied lower heat transfer coefficients
under reduced gravity, although the Chu and Jones data were collected over the higher
range of ReTp between 40,000 and 600,000. The current data approach the Chu and
Jones correlation at larger two-phase Reynolds numbers of around 60,000, but the
differences are significant.
A new correlation for the present experiments was obtained with the unmodified Re
and the Nu modified with" the ten'n, _](1-(X). This term Can be viewed as a multiplier to
obtain an equivalent tube diameter based on the liquid velocity, UL. By equating liquid
volume fluxes using UL and ULS as
ULsD 2 = ULD2, (25)
one finds that De=D_/(1-o0, and the equivalent Nu based on this diameter is Nu_/(1-o0.
This Nu is correlated in the form of
• 26
•- ,,114
t,e_w J(.26)
in Figure 23. Nearly all of the data fall within +20% of eq.(26) with A=0.154 and
n=0.61. Data at higher liquid Re are needed to extend and improve the confidence in the
correlations obtained with eqs. (24) and (26), both of which appear to be adequate for the
limited range of conditions studied here.
10o
Ntl .0"--_-__ [PI-.] TM
prl;3 L-'_"r] .
10
' ' ' ' ' I ' ' ' ' ' ' ' ' I ._
0. !54 Re°'6t
I I I I i I I i I I I i I I I
1,000 !0,000Re L
Figure 23. Correlation of overall heat transfer for slug flow
SUMMARY OF HEAT TRANSFER RESEARCH
For annular gas-liquid .flows of air-water and air-50% glycerine under reduced gravity
conditions, the pressure gradient agrees fairly well with a version of the Lockhart-
Martinelli correlation but the measured film thickness deviates from published
correlations at lower Reynolds numbers. Nusselt numbers, based on a film thickness
obtained from standard normal-gravity correlations, follow the relation, Nu = A Re n
Pr 1/3, but more experimental data in a reduced gravity environment are needed to
increase the confidence in the estimated constants, A and n.
In the slug flow regime, experimental pressure gradient does not correlate well with
either the Lockhart-Martinelli or a homogeneous formulation, but does correlate nicely
27
with a formulation based on a two-phase Reynolds number. Comparison with ground-
based correlations implies that the heat transfer coefficients are lower at reduced gravity
than at normal gravity under the same flow conditions. Nusselt numbers can be
correlated in a fashion similar to Chu and Jones.
ACKNOWLEDGMENT
This research was supported by the NASA Lewis Research Center under grant
NAG3-510. Special thanks are due to the Lewis team of J. McQuillan, G. Fedor, S.
Fisher, T. Lorik and M. Shoemaker, and to R. Mate at the University of Houston.
Thanks are also extended to Prof. Abe Dukler (posthumously) for being the originator of
this research.
REFERENCES
Andreussi, P. and Zanelli, S. 1979 "Downward Annular and Annular-Mist Flow of
Air-Water Mixtures," in Two-Phase Mass, Momentum, and Heat Transfer in Chemical
Process and Engineering Systems, F. Durst, G. V. Tsiklauri and N. Afgan, Eds.,
Hemisphere, Washington.
Bousman, W. S. 1995 "Studies of Two-Phase Gas-Liquid Flow in Microgravity",
NASA Contractor Report 195434, also PhD Dissertation, University of Houston, 1994.
Bousman, W. S. and Dukler, A. E. 1994 "Ground Based Studies of Gas-Liquid Flows
in Microgravity Using Lear Jet Trajectories," Paper AIAA 94-0829, 32nd Aerospace
Sciences Meeting and Exhibit, Reno, NV.
Chisholm, D. and Laird, A. D.M. 1958 "Two-Phase Flow in Rough Tubes," Trans.
ASME, 80 (2), 276-286.
Colin, C., 1990 "Ecoulements Diphasiques a Bulles et a Poches en Micropesanteur",
MS Thesis, Institut de Mechaniques des Fluides de Toulouse, France.
Dukler, A. E., Fabre, J. A., McQuillen, J.B. and Vernon, R..1988 "Gas-Liquid Flow
at Microgravity Conditions: Flow Patterns and Their Transitions," Int. J. Multiphase
Flow, 14, 389-400.
Chu, Y-C., and Jones, B. G. 1980 "Convective Heat Transfer Coefficient Studies in
Upward and Downward, Vertical, Two-Phase, Non-Boiling Flows," AIChE Symp. Series,
76, 79-90.
Huckerby, C. S., and Rezkallah, K.S. 1992 "Flow Pattern Observations in Two-Phase
Gas-Liquid Flow in a Straight Tube under Normal and Microgravity Conditions", Proc.of
the 1992 AIChE Heat Transfer Conference, 88, 288, San Diego, pp. 139-147.
28
Janicot,A. J. P. 1988"Experimentaland TheoreticalStudiesof Gas-Liquid Two-PhaseFlow at ReducedGravityConditions,MS Thesis,Universityof Houston.
Kosky, P. G. 1971 "Thin Liquid Films Under SimultaneousShear and Gravity
Forces",Int. J. Heat Mass Transfer, 14, 1220-1224.
Lacy, C. E. 1992, "Flooding and Wavy Films in Vertical Annular Gas-Liquid Hows",
PhD Dissertation, University of Houston.
Lockhart, L. W. and Martinelli, R. C. 1949 "Proposed Correlation of Data of
Isothermal Two-Phase, Two Component Flow in Pipes," Chem. Engng. Prog., 45, 39-48.
McQuillen, J. B. and Neumann, E. S. 1995, "Two-Phase Flow Research Using the
Learjet Apparatus", NASA Technical Memorandum 106814, NASA-Lewis Research
Center.
Rezkallah, K. S. and Sims, G.E. 1987 "An Examination of Correlations of Mean
Heat-Transfer Coefficients in Two-Phase Two-Component Flow in Vertical Tubes,"
AIChE Symp. Ser., 83 (257), 109-114.
Shah, M. M., 1981 "Generalized Prediction of Heat Transfer During Two Component
Gas-Liquid Flow in Tubes and Other Channels," AIChE Symp. Ser. 208, 77, 141-151.
Sieder, E. N. and Tate, G. E. 1936 "Heat Transfer and Pressure Drop of Liquids in
Tubes," Ind. Eng. Chem., 28 (12), 1428.
Wallis, G. B. 1969, One Dimensional Two-Phase Flow, McGraw-Hill, New York.
Zhao, L. and Rezkallah, K. S. 1993, "Gas-Liquid Flow Patterns at Microgravity
Conditions," Int. J. Multiphase Flow, 19, 751-763.
Zuber, N. and Findlay, J.A. 1965, "Average Volumetric Concentration in Two Phase
Systems, J. Ht. Trans., pp. 453-468.
NOMENCLATURE
A correlation constant
Cp specific heat
D tube diameter " " " "
f friction factor
f'rp two-phase friction factor
h heat transfer coefficient
k thermal conductivity
n correlation power
Nu Nusselt number
Pr Prandtl number
qw wall heat flux
Re Reynolds number
29
We
x
X
eL 2
VP
F
Pl
V
P
0
Weber number
axial coordinate
Lockhart-Martinelli parameter
void fraction
film thickness
Lockhart-Martinelli multiplier
pressure gradient
mass flow per unit perimeter
surface tension
liquid density
shear stress
viscosity
kinematic viscosity
density
dimensionless axial coordinate
dimensionless temperature
subscripts
B bulk
G gas
L liquid
S superficial
TP two-phase
W wall
30
APPENDIX I. PUBLICATIONS RESULTING FROM GRANT
Bousman, W. S. 1995 "Studies of Two-Phase Gas-Liquid Flow in Microgravity",
NASA Contractor Report 195434, also PhD Dissertation, University of Houston, 1994.
Bousman, W. S. and Dukler, A. E. 1994 "Ground Based Studies of Gas-Liquid Flows
in Microgravity Using Lear Jet Trajectories," Paper AIAA 94-0829, 32nd Aerospace
Sciences Meeting and Exhibit, Rent, NV.
Bousman, W. S. and Dukler, A. E., 1993, "Studies of Gas-Liquid Flow in
Microgravity: Void Fraction, Pressure Drop and Flow Patterns", presented at the ASME
Winter Annual Meeting, New Orleans.
Bousman, W. S., Witte, L. C. and McQuillen, J. B. 1996, "Gas-Liquid Flow Patterns
in Microgravity: Effects of Tube Diameter, Liquid Viscosity and Surface Tension",
accepted for International Journal of Multiphase Flow.
Fore, L. B., Witte, L. C. and McQuillen, J. B., 1996, "Heat Transfer to Annular Gas-
Liquid Mixtures at Reduced Gravity", submitted to Journal of Thermophysics and Heat
Transfer, (Dec., 1995).
Fore, L. B., Witte, L. C. and McQuillen, J. B., 1996, "Thermal Hydraulics of Two
Phase Slug Flow under Reduced Gravity", submitted to Int. Journal of Multiphase Flow,
(Jan., 1996).
Fore, L. B., Bousman, W. S. and Witte, L. C. 1996, "Two-Phase Flow Dynamics and
Heat Transfer in Microgravity", to be presented at the Energy Week Conference and
Exhibit, Houston, TX, Jan. 1996.
Fore, L. B. and Witte, L. C. 1995, "Roll Wave Effects on the Heating of Viscous
Liquid Films", presented at the National Heat Transfer Conference, Portland, OR,
August, 1995. Published in ASME HTD Vol. 314, pp. 23-30.
Fore, L. B., Witte, L. C. and McQuillen, J. B. 1996, "Microgravity Heat Transfer and
Pressure Drop in Gas-Liquid Mixtures: Slug and Annular Flow", to be presented at the
National Heat Transfer C.onferenc.e, Houston, TX.
r_
r_
Z
9"g
g'g
£'g
8"g
6"lz
O"g
9'g
£'g
17"9
f'g
17"5
gg
E'g
g'1'
g'1'
_.I d
0"9
0'9
0"9
£'9
£'g
1"9
£'9
!'9
1"L
8"g
6"g
0'9
6"g
!"9
I"g
O"g
Jd
£EL9
998
66£ I I
EgEOI
51,801
8£91'
E996
i00£
£91'E
OLLE
1'£9
E6g91
5££1'1
gE£O1
808g
9561'
E£LE
6881'
(81)o8
0589
OE09
0081,
0909
L1'09
OgLE
O08E
OEL£
000£
0£95
01'£9
0199
OgL£
01'15
1'19£
£901'
DEtUl bAq
uo!loeJjp!o^
£L6
gill
LL6
8EOE
1'191
LSEI
E_OE
99LI
LL6
I1'EI
8_11
15EI
IL51
1'ESl
1'OOE
880E
6501
8@I
£091
E£EI
£L11
t
zo,_
1'1'0"0
gEO'O
910"0
51'0"0
1'50"0
6LO'O
8_0"0
£1'0"0
51'0"0
6_0"0
5£0"0
EIO'O
880"0
E90"O
9EO'O
_gO'O
9LO'O
E1'O'O
1'EO'O
150"0
_gO'O
stm
oqoJd
p!on
OI I'0
1'gO'O
61'0"0
51 I'0
811"0
151"0
850"0
1'60"0
880"0
1'50"0
690"0
8_0"0
66 i "0
1751'0
£60"0
OE I '0
£1'1 "0
880"0
! 50"0
L60"O
g0I"0
oqoJd
p!o^
£50"0
OEO'O
1'I0"0
8EO'O
E£O'O
E50"O
£EO'O
5EO'O
1'£0"0
£_0"0
g_O'O
1'!0"0
090"0
9£0"0
5EO'O
l EO'O
I1'0"0
I£0"0
1'EO'O
_£0"0
E£O'O
suu
oqoad
ml!J
LEi'O
81'0"0
I£0"0
£01"0
1'01"0
1'£I"0
090'0
060"0
860"0
950"0
_LOIO
LEO'O
1'51"0
1'EI'O
090'0
_11'0
1'£I"0
680'0
E50"O
001"0
L60"O
8/_oq_d
ml!J
L'Li
WEE
L"_E
O'L_
L'61
8"LI
1"91
9"8I
g'51
8"Li
L'91
£'£E
O'LI
5"81
9"1'E
E'O_;
g'91
L'SI
£'£E
9"LI
9"LI
Isd"ssoJd
_1 nuue 9IE'O 8"0I 159
aelnuue 080'0 0'81 81'9
_1 nuue 9£0"0 9"81 51,9
_1 nuue 01'0"0 I'EE L£9
_1 nuue 68£'0 5"1'1 9£9
ml nuue 81'£'0 £'01 1'£9
-mlnuu_ 99£'0 6"1' _£9
_1 nuue g91"O 8"IZ 0£9
_i nuu_ 56U0 L'1'I L_9
_1 nuue £0I'0 0"5 5E9
a_lnuue 880"0 6'gi 1'E9
•mlnuue 960"0 8"01 gZ9
•mlnuue 9Z0'0 V£_ 619
_1 nuue 055"0 8"1' 819
_1 nuue 8LVO 0"01 519
_1 nuue 0£1"0 VEE £19
_1 nuue Og£'O 0"gl 019
,_1 nuue f61"O 6"1' 609
_i nuu_ OLI'O 8"gi 909
_1 nuue 080"0 E'gE 1'09
_1 nuun 01'1"0 E'II E09
_1 nuu_ 01'1"0 E'II I09
s/m s/mwalled S"IFI SDfl # uru
sluotu.uadxa Jzleht £1!^v,_oaa.qAI
I "II aiq_dL
656
658
660
661
663
666
667
669
672
675
676
680
683
688
690
691
696
698
603
605
607
608
611
612
614
616
10.2
4.9
4.9
19.5
5.2
21.0
10.4
21.2
16.0
5.0
15.2
10.1
4.6
10.8
16.5
5.1
4.9
10.4
2.0
0.2
0.4
1.0
0.2
0.3
1.0
0.4
0.300
0.350
0.200
0.116
0.080
0.050
0.181
0.050
O. 162
0.197
0.360
0.450
0.500
0.068
0.063
0.073
0.368
0.330
0.155
0.212
0.214
0.214
9.528
0.544
0.557
0.595
annular
annular
annular
annular
annular
annular
annular
annular
annular
annular
annular
annular
annular
annular
annular
annular
annular
annular
slug
slug
slug
slug
slug
slug
slug
slug
17.9
16.9
16.5
21.5
16.4
27.3
17.5
27.0
18.8
16.4
20.4
19.3
17.5
17.2
18.6
16.3
16.7
18.3
16.0
15.5
15.6
15.9
15.5
15.4
15.8
15.0
O. 180
0.148
0.061
0.094
0.044
0.093
0.076
0.134
O. 104
0.132
O. 196
0.066
0.047
0.091
0.178
0.116
0.169
0.634
0.419
0.203
0.680
0.668
0.279
0.490
0.093
0.074
0.028
0.04 I
0.023
0.042
0.033
0.070
0.039
0.058
0.122
0.032
0.025
0.045
0.118
0.050
0.076
0.245
0.306
0.158
0.301
0.304
0.247
0.322
0.133
0.110
0.055
0.073
0.056
0.075
0.059
O. 106
O. 102
0.129
0.160
0.048
0.036
0.065
0.135
0.100
0.161
0.485
0.335
0.209
0.598
0.600
0.311
0.495
0.073
0.062
0.022
0.040
0.017
0.039
0.029
O.054
0.036
0.050
0.080
0.025
0.020
0.036
0.073
0.046
0.094
0.386
0.343
0.183
0.330
0.333
0.269
0.351
950
742
1502
807
1407
1067
1327
912
1864
1669
1316
870
1017
981
1339
1630
929
1028
1037
1053
1164
1040
1170
1068,
0.71
0.41
0.56
0.66
0.27
0.27
0.55
0.38
5835
4960
3920
2670
5800
4080
7080
668O
5170
3420
3920
2600
4990
6030
2527
1908
2078
2634
3117
3169
4250
3667
9159
9571
5429
2136
4279
5326
9674
12211
.13610
1753
1548
1889
9914
8837
4666
6373
6425
6425
15843
16367
16772
17960
5.8
6.5
6.6
6.7
6.8
6.6
6.6
6.6
6.5
6.9
7.3
6.9
6.6
6.7
5.9
5.9
5.9
5.9
5.9
5.9
5.9
5.8
5.3
5.8
5.7
5.4
6.1
5.8
6.1
6.0
5.8
5.9
6.3
5.6
5.9
6.0
4.8
4.6
4.7
4.9
5.0
5.0
5.2
5.1
w
o=
t_
617
620
621
623
626
628
629
631
633
635
638
639
643
644
647
649
650
652
654
655
657
659
662
664
665
668
1.9
1.1
0.2
0.4
2.0
1.0
0.4
2.0
0.2
2.0
0.8
2.0
0.8
0.2
2.0
0.2
0.8
1.9
0.4
0.3
0.2
1.0
1.0
0.4
2.0
2.0
0.574
0.211
0.076
0.107
O. 106
0.390
0.392
0.380
0.398
0.498
0.166
0.164
0.070
0.067
0.065
0.323
0.305
0.265
0.280
0.410
0.410
0.280
0.071
0.092
0.356
0.200
slug
slug
slug
slug
slug
slug
slug
slug
slug
slug
slug
slug
slug
slug
slug
slug
slug
slug
slug
slug
slug
slug
slug
slug
slug
slug
16.0
15.0
14.8
14.8
15.0
15.0
14.9
15.7
14.9
15.9
15.6
16.0
15.4
15.4
15.8
15.3
15.6
16.0
15.5
15.5
15.3
15.6
15.8
15.4
16.2
16.0
0.208
0.189
0.364
0.123
0.234
0.501
0.181
0.668
O. 197
0.168
0.132
0.237
0.234
0.711
I. 107
0.336
0.240
0.191
0.146
0.156
0.275
0.057
0.247
0.379
0.135
0.322
0.148
0.200
0.094
0.264
0.188
0.533
0.422
0.372
0.186
0.148
0.243
0.180
0.255
0.126
0.256
0.442
0.199
0.559
0.224
0.182
0.128
0.228
0.176
0.366
0.565
0.215
0.174
0.143
0.168
0.166
0.277
0.082
0.241
0.397
O. 147
0.373
0.160
0.187
0.086
0.257
0.131
0.386
0.385
0.236
0.118
0.094
1447
1119
1024
904
1125
1074
1198
1050
1375
694
243
914
652
969
905
973
974
769
0.60
0.70
0.63
O.77
0.61
0.47
0.66
0.33
0.63
0.70
0.77
0.66
0.70
0.55
0.34
0.67
0.70
0.74
4594
1889
201 I
3400
3016
3979
2562
4452
3117
3896
2597
2925
4065
3169
18979
6209
3113
11648
11638
11285
11826
14781
8433
7240
11236
8709
9693
5447
5.3
6.0
6.0
5.9
6.0
5.9
5.9
6.0
6.4
6.5
6.5
5.7
6.5
6.5
4.8
4.6
4.7
5.1
5.0
5.2
4.9
5.3
5.4
5.6
5.3
4.8
5.7
5.5
,..1
.=
0
670
671
673
674
677
679
681
682
685
686
687
689
692
693
694
695
697
0.2
0.2
0.4
l.O
0.2
1.0
0.4
2.0
1.0
1.0
0.2
0.4
2.1
1.0
0.4
2.0
0.2
0.210
0.210
0.210
0.210
0.540
0.540
0.540
0.530
0.400
0.092
0.077
0.077
0.075
0.388
0.390
0.378
0.396
slug
slug
slug
slug
slug
slug
slug
slug
slug
slug
slug
slug
slug
slug
slug
slug
slug
15.6
15.4
15.4
15.6
15.6
16.2
16.0
16.6
15.7
15.5
15.2
15.3
15.5
15.5
15.3
16.2
15.2
0.715
0.647
O.267
0.995
0.379
(I.704
0.273
0.321
0.221
0.472
0.119
0.346
0.610
0.242
0.982
0.476
0.490
0.28 I
O.489
0.394
0.570
0.238
0.348
0.222
0.450
0.084
0.373
0.565
0.207
0.507
0.422
0.331
0.181
0.606
0.292
0.481
0.214
0.245
0.137
0.233
0.106
0.234
0.403
0.196
0.564
0.332
0.337
0.168
0.336
0.249
0.368
0.158
0.222
0.122
0.300
0.068
0.241
0.369
0.141
0.386
950
973
999
973
!106
1014
1247
1062
965
I000
734
1067
1126
1212
1057
0.44
0.56
0.70
0.27
0.56
0.40
0.64
0.62
0.76
0.68
0.80
0.65
0.49
0.67
0.34
1484
2101
2527
3066
4250
3463
4452
3371
3528
3066
4065
2493
5704
5743
5720
14780
14721
14762
14475
12255
10473
10546
i0215
10712
6.6
6.5
6.5
6.5
6.5
6.5
6.5
5.8
6.6
6.6
6.6
6.6
4.6
5.0
5.3
5.4
5.7
5.5
5.7
5.0
5.6
5.5
5.7
5.3
O
r*
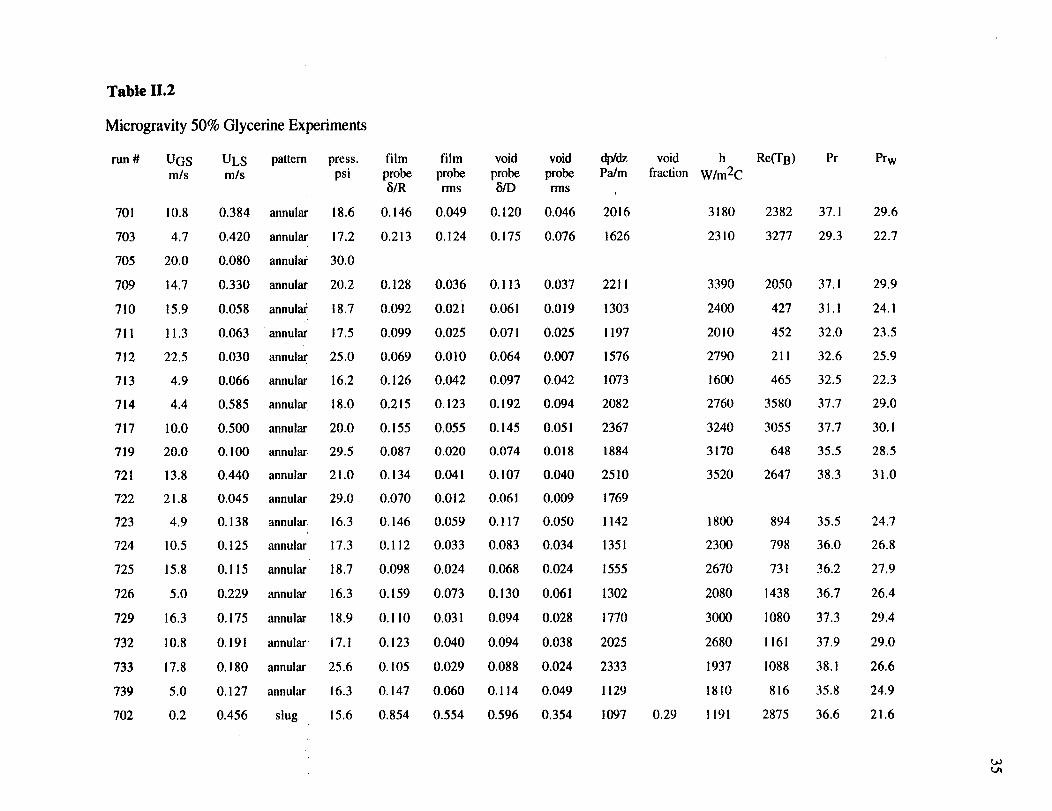
Table 11.2
Microgravity 50% Glycerine Experiments
run # UGS ULS pattern press, film film void void dlddzm/s m/s psi probe probe probe probe Pa/m
SIR rms _/D rms
701 10.8 0.384 annular 18.6 0.146 0.049 0.120 0.046 2016
703 4.7 0.420 annular 17.2 0.213 0.124 0.175 0.076 1626
705 20.0 0.080 annular 30.0
709 14.7 0.330 annular 20.2 0.128 0.036 0.1 ! 3 0.037 2211
710 15.9 0.058 annula/ 18.7 0.092 0.021 0.061 0.019 1303
711 11.3 0.063 "annular 17.5 0.099 0.025 0.071 0.025 1197
712 22.5 0.030 annular 25.0 0.069 0.0 ! 0 0.064 0.007 1576
713 4.9 0.066 annular 16.2 0.126 0.042 0.097 0.042 1073
714 4.4 0.585 annular 18.0 0.215 0.123 0.192 0.094 2082
717 10.0 0.500 annular 20.0 0.155 0.055 0.145 0.051 2367
719 20.0 0.100 annular 29.5 0.087 0.020 0.074 0.018 1884
721 13.8 0.440 annular 21.0 0.134 0.041 0.107 0.040 2510
722 21.8 0.045 annular 29.0 0.070 0.0 ! 2 0.061 0.009 ! 769
723 4.9 0.138 annular 16.3 0.146 0.059 0.117 0.050 1142
724 10.5 0.125 annular 17.3 0.112 0.033 0.083 0.034 1351
725 15.8 0.115 annular 18.7 0.098 0.024 0.068 0.024 1555
726 5.0 0.229 annular 16.3 0.159 0.073 0.130 0.061 1302
729 16.3 0.175 annular 18.9 0.110 0.031 0.094 0.028 1770
732 10.8 0.19 ! annular' i 7.1 0.123 0.040 0.094 0.038 2025
733 17.8 0.180 annular 25.6 0.105 0.029 0.088 0.024 2333
739 5.0 0.127 annular 16.3 0.147 0.060 0.114 0.049 1129
702 0.2 0.456 slug 15.6 0.854 0.554 0.596 0.354 1097
voidfraction
0.29
h
W/m2C
3180
2310
3390
2400
2010
2790
1600
2760
3240
3170
3520
1800
2300
2670
2080
3000
2680
1937
1810
!191
Re(TB)
2382
3277
2050
427
452
211
465
3580
3055
648
2647
894
798
731
1438
1080
1161
1088
816
2875
Pr
37.1
29.3
37.1
31.1
32.0
32.6
32.5
37.7
37.7
35.5
38.3
35.5
36.0
36.2
36.7
37.3
37.9
38.1
35.8
36.6
Pr W
29.6
22.7
29.9
24.1
23.5
25.9
22.3
29.0
30.1
28.5
31.0
24.7
26.8
27.9
26.4
29.4
29.0
26.6
24.9
21.6
taJ
704
706
707
708
715
716
718
720
728
730
731
734
735
736
737
738
740
1.9
0.4
0.4
1.0
2.0
0.4
0.9
0.2
0.4
0.2
2.0
0.8
0.1
0.4
1.0
1.9
0.8
0.435
0.452
0.445
0.435
0.620
0.650
0.630
0.660
0.220
0.218
0.214
0.442
0.448
0.446
0.434
0.063
0.646
slug
slug
slug
slug
slug
slug'
slug
slug
slug
slug
slug
slug
slug
slug
slug
slug
slug
16.5
15.5
15.5
16.1
16.8
16.0
16.2
15.4
15.3
15.0
15.6
15.2
15.0
15.2
15.5
15.8
15.8
0.292
0.639
0.624
0.439
0.332
0.742
0.504
0.934
0.485
0.212
0.438
0.947
0.618
0.393
0.158
0.495
0.245
0.547
0.537
0.373
0.273
0.533
0.397
0.524
0.537
0.160
0.403
0.530
0.52 I
0.390
0.089
0.394
0.231
0.467
0.466
0.308
0.272
0.560
0.373
0.674
0.373
0.182
0.334
0.689
0.455
0.308
0.145
0.373
0.165
0.357
0.349
0.239
0.184
0.347
0.26O
0.342
0.348
0.122
0.268
0.347
0.347
0.259
0.069
0.260
1427
1117
1115
1150
1669
1163
1246
1119
1078
1734
1373
1095
1123
1169
951
1260
0.62
0.41
0.41
0.54
0.56
0.31
0.46
0.22
0.51
0.68
0.52
0.22
0.42
0.55
0.74
0.46
2177
1293
1456
1851
2432
1672
2055
1120
1685
1716
957
1472
1781
1094
1989
2706
2862
2804
2733
3805
3995
3882
1401
1301
2660
2708
2730
2620
456
3825
37.1
36.4
36.5
36.7
37.6
37.5
37.4
36.2
38.0
38.4
38.1
37.7
38.2
31.7
39.0
27.0
22.2
23.4
25.5
28.1
25.0
26.7
20.9
25.3
25.7
20.0
24.0
26.0
19.0
27.3
_ru
0
g
O_

Form ApprovedREPORT DOCUMENTATION PAGE OMB No. 0704-0188
Publicreportingburdenforthiscollectionof informationis estimatedtoaverage1 hourperresponse,includingthetime forrevi.ewinginstructions,searchingexistingdatasour.ce.s.,gathedngandmaintainingthedataneeded,andcompletingand reviewingtheco.llectlonof reformation.Sendcommentsregardingth_ burdenes,tlmateoranyotneras.p.ect.oltinscollectionof information,includingsuggestionsforreducingthisburden,toWashingtonHeadquartersSennces.DirectorateforInformationuperatlonsano Heports, 1;¢1bJenarsonDavisHighway,Suite1204,Arlington,VA 22202-4302,andto the OfficeofManagementandBudget,PaperworkReductionProject(0704-0188).Washington.DC 20503.
1. AGENCY USE ONLY (Leave blank) 2. REPORT DATE 3. REPORT TYPE AND DATES COVERED
February 1996 Final Contractor Report4. TITLE AND SUBTITLE 5. FUNDING NUMBERS
Studies of Two-Phase Flow Dynamics and Heat Transfer at ReducedGravity Conditions
6. AUTHOR(S)
Larry C. Witte, W. Scott Bousman, and Larry B. Fore
7. PERFORMING ORGANIZATION NAME(S) AND ADDRESS(ES)
University of Houston
Department of Chemical EngineeringHouston, Texas 77204-4792
9. SPONSORING/MONITORING AGENCY NAME(S) AND ADDRESS(ES)
National Aeronautics and Space Administration
Lewis Research Center
Cleveland, Ohio 44135-3191
WU--694--03--0AG-NAG3-510
8. PERFORMING ORGANIZATIONREPORT NUMBER
E-10136
10. SPONSORING/MONITORINGAGENCY REPORT NUMBER
NASA CR-198459
11. SUPPLEMENTARY NOTES
Project Manager, John B. McQuillen, Space Experiments Division, NASA Lewis Research Center, organization
code 6712, (216) 433-2876.
12a. DISTRIBUTION/AVAILABILITY STATEMENT 12b. DISTRIBUTION CODE
Unclassified -Unlimited
Subject Category 34
This publication is available from the NASA Center for Aerospace Information, (301) 621-0390.
13. ABSTRACT (Maximum 200 words)
The ability to predict gas-liquid flow patterns is crucial to the design and operation of two-phase flow systems in the microgravity
environment. Flow pattern maps have been developed in this study which show the occurrence of flow patterns as a function of gas and
liquid superficial velocities as well as tube diameter, liquid viscosity and surface tension. The results have demonstrated that the
location of the bubble-slug transition is affected by the tube diameter for air-water systems and by surface tension, suggesting that
turbulence-induced bubble fluctuations and coalescence mechanisms play a role in this transition. The location of the slug-annular
transition on the flow pattern maps is largely unaffected by tube diameter, liquid viscosity or surface tension in the ranges tested. Void
fraction-based transition criteria were developed which separate the flow patterns on the flow pattern maps with reasonable accuracy.
Weber number transition criteria also show promise but further work is needed to improve these models. For annular gas-liquid flows
of air-water and air-50% glycerine under reduced gravity conditions, the pressure gradient agrees fairly well with a version of the
Lockhart-Martinelli correlation but the measured film thickness deviates from published correlations at lower Reynolds numbers.
Nusselt numbers, based on a film thickness obtained from standard normal-gravity correlations, follow the relation, Nu = A Re n Pr 1/3,
but more experimental data in a reduced gravity environment are needed to increase the confidence in the estimated constants, A and n.
In the slug flow regime, experimental pressure gradient does not correlate well with either the Lockhart-Martinelli or a homogeneous
formulation, but does correlate nicely with a formulation based on a two-phase Reynolds number. Comparison with ground-based
correlations implies that the heat transfer coefficients are lower at reduced gravity than at normal gravity under the same flow condi-tions. Nusselt numbers can be correlated in a fashion similar to Chu and Jones.
14. SUBJECT TERMS
Multiphase flow; Two phase flow; Reduced gravity; Annular flow; Flow stability;Voids; Bubbles
17. SECURITY CLASSIFICATIONOF REPORT
Unclassified
NSN 7540-01-280-5500
18. SECURITY CLASSIFICATIONOF THIS PAGE
Unclassified
19. SECURITY CLASSIFICATIONOF ABSTRACT
Unclassified
15. NUMBER OF PAGES
4016. PRICE CODE
A0320. LIMITATION OF ABSTRACT
Standard Form 298 (Rev. 2-89)Prescribedby ANSI Std. Z39-18298-102

National Aeronautics and
Space Administration
Lewis Research Center
21000 Brookpark Rd.Cleveland, OH 44135-3191
Official Business
Penalty for Private Use $300
POSTMASTER: If Undeliverable-- Do Not Return
Recommended